Seagrass Recovery Following Marine Heat Wave Influences Sediment Carbon Stocks
 Lillian R. Aoki1*†
  Karen J. McGlathery1
  Patricia L. Wiberg1 Matthew P. J. Oreska1 Amelie C. Berger1 Peter Berg1
  Robert J. Orth2
- 1Department of Environmental Sciences, University of Virginia, Charlottesville, VA, United States
- 2Virginia Institute of Marine Science, William and Mary, Gloucester Point, VA, United States
Worldwide, seagrass meadows accumulate significant stocks of organic carbon (C), known as “blue” carbon, which can remain buried for decades to centuries. However, when seagrass meadows are disturbed, these C stocks may be remineralized, leading to significant CO2 emissions. Increasing ocean temperatures, and increasing frequency and severity of heat waves, threaten seagrass meadows and their sediment blue C. To date, no study has directly measured the impact of seagrass declines from high temperatures on sediment C stocks. Here, we use a long-term record of sediment C stocks from a 7-km2, restored eelgrass (Zostera marina) meadow to show that seagrass dieback following a single marine heat wave (MHW) led to significant losses of sediment C. Patterns of sediment C loss and re-accumulation lagged patterns of seagrass recovery. Sediment C losses were concentrated within the central area of the meadow, where sites experienced extreme shoot density declines of 90% during the MHW and net losses of 20% of sediment C over the following 3 years. However, this effect was not uniform; outer meadow sites showed little evidence of shoot declines during the MHW and had net increases of 60% of sediment C over the following 3 years. Overall, sites with higher seagrass recovery maintained 1.7x as much C compared to sites with lower recovery. Our study demonstrates that while seagrass blue C is vulnerable to MHWs, localization of seagrass loss can prevent meadow-wide C losses. Long-term (decadal and beyond) stability of seagrass blue C depends on seagrass resilience to short-term disturbance events.
Introduction
Seagrass meadows, salt marshes, and mangrove forests have been recognized as important sinks for carbon (C) on a global scale (Mcleod et al., 2011). This “blue” C accumulates in the anoxic sediments of these coastal wetlands; globally, blue C ecosystems store between 0.08–0.22 Pg C y–1, approximately half of the total C buried in ocean sediments annually (Duarte et al., 2013). Anoxic sediment conditions preserve organic carbon from decomposition over long time-scales, from decades to centuries or even millennia (Fourqurean et al., 2012; Howard et al., 2017). However, disturbance and loss of blue C ecosystems lead to carbon emissions; not only is C stored in the biomass of vegetation lost, but the sediment can be resuspended and organic C can be exposed to oxic conditions in the water column and/or atmosphere, leading to rapid oxidation and remineralization (Pendleton et al., 2012). In seagrass meadows, the loss of seagrass shoots can result in the loss of blue C deposits that may have accumulated over previous decades (Marbà et al., 2015).
The magnitude of seagrass blue C loss following disturbance remains uncertain. Estimates to date generally rely on simple assumptions regarding the proportion of the C stock that will be remineralized (Arias-Ortiz et al., 2018; Ewers Lewis et al., 2018). However, numerous processes will affect the vulnerability of sediment C following disturbance and vegetation loss, including sediment deposition and erosion, redox oscillations from physical and biological drivers, and plant-microbe interactions (Spivak et al., 2019). Importantly, these interacting processes occur over varying spatial and temporal scales and impact not only the preservation of existing C stocks but also the continued accumulation of new organic C inputs (Belshe et al., 2017). Greater understanding of the net effect of these processes is needed to understand the stability of seagrass blue C stocks following different kinds of disturbance. In particular, studies need to account for spatial and temporal variation in sediment C loss and recovery. Studies with repeated measurements of blue C stock before and after a disturbance event, across plot (m2) to meadow (km2) spatial scales, are needed to provide empirical data on blue C stability.
Seagrass resilience will influence the net effect of disturbance on blue C. We define ecosystem resilience as “the capacity to undergo disturbance without permanent loss of key ecological structures and functions” [O’Brien et al. (2018) after Holling (1973)], encompassing both the resistance to change during disturbance and the ability to recover after disturbance (Levin and Lubchenco, 2008; Standish et al., 2014). Trajectories of seagrass degradation and recovery through time represent the cumulative effect of seagrass processes that occur across spatial and temporal scales and that respond to overlapping biotic and abiotic drivers (O’Brien et al., 2018). Long-term loss of seagrass presence after disturbance has been shown to destabilize blue C stocks, leading to release of previously buried carbon (Macreadie et al., 2015; Salinas et al., 2020). However, the impact of seagrass recovery on blue C persistence remains unexplored. Seagrass meadows have emerged as priorities for marine conservation and restoration (United Nations Environment Programme [UNEP], 2020), and greater understanding of how recovery trajectories after disturbance influence blue C is needed to inform these conservation efforts.
Like other blue C ecosystems, seagrass meadows have declined in many areas of the world; estimates from a decade ago were that roughly a third of the historical extent of seagrass meadows worldwide had already been lost (Waycott et al., 2009). The magnitude of C emissions due to loss of seagrass area has been estimated at 0.01–0.09 Pg C y–1 (Pendleton et al., 2012). Preservation of existing meadows limits these emissions, and restoration of degraded or lost meadows can reestablish C accumulation rates on par with natural systems (Greiner et al., 2013; Marbà et al., 2015). Climate change mitigation through blue C accumulation is one motivation for seagrass restoration efforts, and methodologies now exist to calculate and award carbon-offset credits from seagrass restoration projects (Emmer et al., 2015; Needelman et al., 2018). However, restoration of degraded meadows typically takes at least a decade (Greening and Janicki, 2006; McGlathery et al., 2012), and restored blue C stocks must persist for a period of 30 years to be eligible for carbon-offset credits (Oreska et al., 2020). Over the decadal time scales of seagrass restoration, short-term disturbance events threaten the persistence of slowly accumulating sediment C, potentially limiting the total blue C benefit from restoration. Natural meadows are also vulnerable to short-term disturbance. In particular, disturbance from high temperatures, driven more and more frequently by climate change, poses a serious threat to seagrass meadows (Orth et al., 2006; Moore and Jarvis, 2008; Thomson et al., 2015).
Rising ocean temperatures alter seagrass growth and reproduction, and particularly threaten species near the thermal boundary of their geographic range (Fraser et al., 2014; Short et al., 2016; Berger et al., 2020). Rising baseline temperatures are exacerbated by marine heat waves (MHWs), defined following Hobday et al. (2016) as periods of at least five consecutive days when temperatures exceed a climatological threshold. Recent work has shown that MHWs lead to declines in seagrass and other coastal foundation species (Lefcheck et al., 2017; Smale et al., 2019); periods of high temperatures that do not meet the MHW definition can also cause seagrass stress and decline (Moore and Jarvis, 2008). MHWs are increasing in frequency and duration (Oliver et al., 2018, 2019), increasing the risk of rapid, large-scale loss of seagrass meadows that could trigger massive losses of blue C from seagrass sediments. Previous studies have shown catastrophic dieback, with mortality of as much as 90% of shoots, following extreme high temperatures in Australian and Mediterranean seagrass meadows (Marbà and Duarte, 2009; Thomson et al., 2015; Kendrick et al., 2019). In Shark Bay, Australia, researchers recently modeled the C emissions from the sediment following a temperature-induced seagrass dieback by assuming between 10 and 50% of sediment C was exposed to oxic conditions following the dieback; their model predicted emissions of 0.5–2.5 Tg C from a 13,000 km2 area over 3 years after the dieback (Arias-Ortiz et al., 2018). However, no study to date has empirically measured seagrass sediment C stocks before and after a temperature-induced dieback, leaving uncertainty about the spatial and temporal effects of temperature-induced seagrass loss and subsequent recovery on sediment C stocks.
Here, we address this knowledge gap using long-term data collected at the Virginia Coast Reserve Long-Term Ecological Research site (VCR). We examined sediment C storage in a restored Zostera marina (eelgrass) meadow that experienced a severe dieback following unusually high summer temperatures in 2015 (Berger et al., 2020). We combined long-term monitoring of seagrass and sediment metrics with intensive sediment sampling before and after the dieback to determine how losses of seagrass shoots affected sediment C stocks from the plot scale (m2) to the meadow scale (km2). As part of a long-term (18 years) study, we continued measurements for 3 years after the initial loss of shoots to understand the patterns in seagrass C loss and re-accumulation over time.
Materials and Methods
Site Description and Study Design
South Bay, VA, United States, contains one of four eelgrass meadows restored by seeding in the shallow bays of the Virginia Coast Reserve Long Term Ecological Research site1. The depth in the coastal bays ranges from 0.8–1.6 m below mean sea level and the tidal range is 1.2 m (Fagherazzi and Wiberg, 2009). Sediments in South Bay are dominated by fine sands and dry bulk density is 1.4 g cm–3 (McGlathery et al., 2012). Seagrass plots in South Bay were seeded in 2001; the original 0.4 ha plots have since expanded into a continuous meadow, approximately 20 km2 by 2018 (Orth et al., 2020). Our monitoring efforts targeted the area of the original restoration, a region of the larger meadow that was approximately 7 km2 by 2015 (Oreska et al., 2017; Figure 1). This area has been monitored annually since 2007 at six of the original 0.4 ha restoration plots, located in the center of the meadow; these plots reached a stable, mature-meadow density of 400–600 shoots m–2 within 6–8 years after seeding (McGlathery et al., 2012). We labeled these long-term plots as “inner” meadow plots, and we leveraged the long-term data set in order to compare measurements of seagrass shoot density and sediment C stock before and after the MHW disturbance. In addition to the six inner plots, we measured shoot densities and sediment C stocks at nine additional sites, located between the inner plots and the meadow edge in areas that were colonized as the meadow expanded from the original seeded plots. We labeled these younger meadow sites as “outer” meadow plots (see Figure 1). The configuration of outer and inner meadow plots enabled us to understand possible variation in the impact of the MHW on sediment C stocks in the 7-km2 meadow region. Each plot was at least 200 m from the nearest neighboring site. The full set of nine outer plots was sampled in 2013; however, in the years after the MHW, subsets of four (2016) or six (2017–2018) outer plots were sampled.
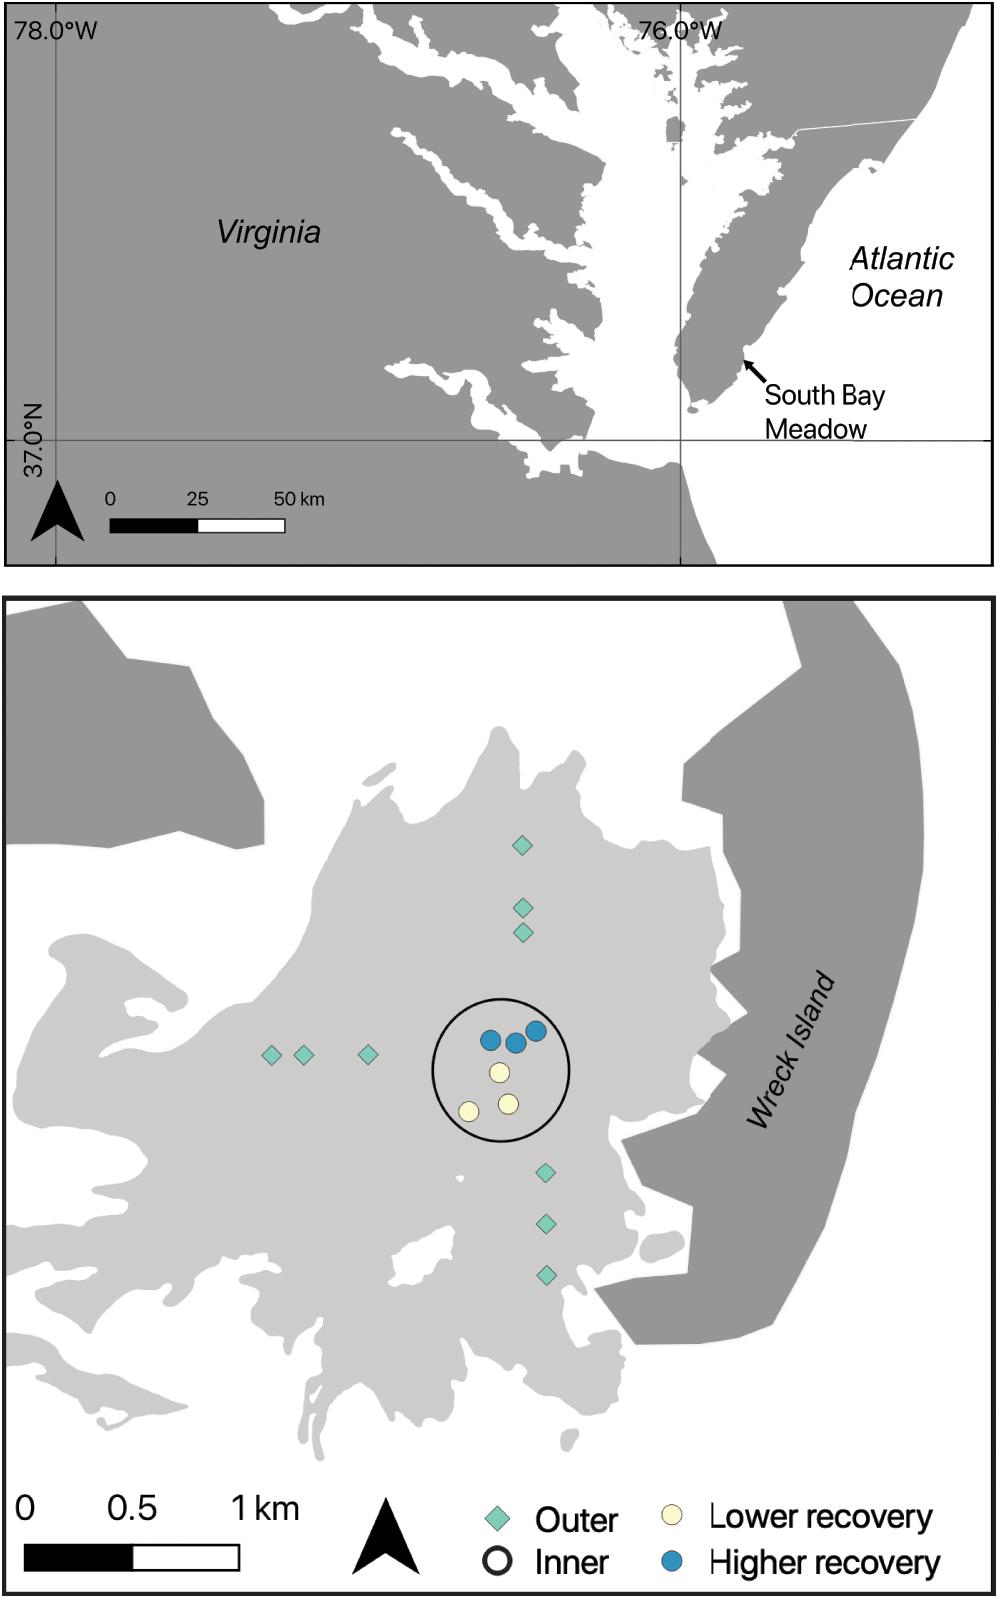
Figure 1. Map of the study system, with the seagrass meadow extent shown in light gray, the barrier islands shown in dark gray, and sampling sites as colored symbols. The six inner meadow sites are shown as circles; the nine outer sites are shown as diamonds. Colors represent the degree of impact from the heat wave in 2015; yellow sites had lower recovery, blue sites had higher recovery, outer sites are green. Sites within the black circle were long-term monitoring sites (2007–2018).
Marine Heat Wave
During June 2015, the South Bay meadow experienced high temperatures, followed by loss of seagrass shoots at the inner meadow sites (Berger et al., 2020). Following Hobday et al. (2016), we defined a marine heat wave as when water temperatures exceed the 90th percentile relative to local, long-term climatology for five consecutive days. We analyzed a long-term (24 years) record of hourly water temperature from a NOAA tide station located in Wachapreague, VA, United States, approximately 38 km from the South Bay meadow, in order to confirm that the June 2015 water temperatures qualified as a MHW. We also analyzed sea surface temperatures (SSTs) acquired from AVHRR satellite imagery of the Chesapeake Bay region2 to show patterns of SST associated with heat wave and non-heat wave conditions throughout the VCR. Satellite-derived SST images, available up to nine times per day, had a resolution of 1 km2 and were masked to eliminate cloudy regions and locations where the data did not meet data quality criteria. Details of the processing of the satellite data are available from (see text footnote 2). We used the available SST imagery from June 2015 to contrast MHW and non-MHW conditions during the observed seagrass die-off.
Seagrass Disturbance and Recovery
We used a combination of aerial imagery and field surveys to assess the effect of the June 2015 MHW on the seagrass meadow. Aerial images of the meadow were collected by researchers at the Virginia Institute of Marine Science from 2015–2018 as part of their annual Submerged Aquatic Vegetation survey3. Details of the image collection and processing are available elsewhere (Orth et al., 2012). We report seagrass shoot density data from 2014 (pre-dieback) to 2018 (post-dieback) that are part of a longer monitoring effort from 2008–2018. Seagrass shoot densities were measured at the six inner meadow sites during early summer (late June to early July). To measure shoot densities, we laid a 50 m transect from the center of the site and counted shoots within 10 evenly spaced 0.25 m2 quadrats. In the nine outer meadow sites, we counted shoot densities in 10 haphazardly distributed 0.25 m2 quadrats in 2014, as part of a related study (Oreska et al., 2017). Shoot densities were not measured at the outer sites in 2015 or 2016. In 2017 and 2018, we measured shoot densities at a subset of six outer sites, following the same protocol as for the six inner meadow sites. At the inner meadow sites, we quantified seagrass shoot recovery each year after the disturbance by calculating the annual shoot density as a percentage of the pre-disturbance (2014) shoot density.
Sediment C Stocks
We measured sediment C stocks in the upper layers of sediment (0–5 cm depth) annually from 2013–2018 at the inner meadow sites, consistent with the long-term study, to understand how seagrass disturbance and recovery affected the sediment stock in the upper sediments. Previous work has shown that seagrass restoration in South Bay had enhanced sediment C stocks to a depth of 12 cm by 2014; however, the bulk of the effect occurs between the sediment surface and 6 cm depth (Greiner et al., 2013; Oreska et al., 2017). At each of the six inner meadow sites, we collected five replicate 5-cm deep cores using a cut-off syringe corer (inner diameter 2.5 cm) at 10 m intervals along the transects used for shoot densities. A second set of 5-cm deep sediment cores was also collected for bulk density analysis. In order to understand how C loss differed across the 7-km2 meadow, we used data from comparable sediment cores collected at the outer sites; all nine outer sites were sampled in 2013 as part of a related study (Oreska et al., 2017), and in later years, subsets of four (2016) or six (2017–2018) outer plots were sampled. We compared areal C stocks in g C per m2 over time.
We collected additional sediment samples in 2017 and 2018 to further investigate the impact of seagrass loss and recovery on sediment C stocks. After the widespread loss of shoots in 2015, seagrass recovery was patchy at the plot (m2) scale, with large patches of bare sediment persisting through 2018 in some areas. In 2017, we assessed small-scale (m2) patchiness at the six inner meadow sites; at each site, we collected five replicate 5-cm deep sediment cores from bare patches, and five cores from adjacent seagrass patches. We compared areal sediment stocks in g C per m2 in bare and seagrass patches by integrating C content over the 5 cm core depth. To determine the extent of C loss deeper in the sediment profile, in 2018 we collected four replicate 10-cm deep sediment cores at each of the six inner meadow sites and segmented the cores into three depth increments, 0–2.5, 2.5–5, and 5–10 cm. We compared bulk C content in mg C per cm3 of sediment across the three depth intervals.
All sediment samples were transported on ice to the laboratory and were frozen immediately. Bulk density analysis was conducted by sub-sampling thawed cores; three cm3 of sediment was weighed and then dried to a constant weight. Bulk densities were calculated from the wet and dry weight and sample volume. For the sediment C analyses, frozen samples were defrosted and dried to constant mass at 60°C. Visible fragments of rhizomes, roots, and shells were removed and the samples were homogenized and stored in glass scintillation vials. Carbon content was measured on 25 mg subsamples using a Carlo Erba Elemental Analyzer with a 1,020°C combustion tube and 650°C reduction tube, and helium as a carrier gas. Bulk C stocks in the sediment were calculated by multiplying C content (mg C per mg sediment) by the sediment bulk density to calculate C stock in g C per cm3. Stocks were converted to g C per m2 by integrating over the 5 cm depth of the core. These sediments are siliciclastic and contain negligible carbonate (Saderne et al., 2019), so total C is a suitable measure of organic C in this system.
Statistical Analysis
The initial seagrass shoot recovery, calculated as the 2016 shoot density as a percentage of the pre-disturbance 2014 shoot density, varied between the inner meadow sites. Three out of six sites had initial shoot recovery >49% and were classified as “higher” recovery sites. The remaining three sites had initial shoot recovery <35% and were classified as “lower” recovery sites. We compared recovery over time between the higher and lower recovery sites using linear mixed models (LMMs, Zuur et al., 2009) with shoot density modeled as a function of two fixed effects, the years since disturbance and the recovery status, with site as a random effect.
To assess the impact of seagrass loss and recovery on sediment C stocks, we used LMMs to analyze the long-term record of upper sediment C stock (g C m–2) from the six inner meadow sites. We modeled upper sediment C stock through time as a function of year, including two pre-disturbance years (2013–2014), the year of the MHW (2015), and three post-disturbance years (2016–2018). Site was included as a random effect. During model selection, we determined that sediment C in the upper 5 cm did not vary through time based on recovery status (higher versus lower recovery sites); therefore, recovery status was not included in the final model.
We performed additional analyses to understand the effect of seagrass loss and recovery on sediment C in more detail. At the plot scale (m2), we compared upper sediment C stocks (g C m–2) in bare and seagrass patches in 2017 using a paired t-test; samples collected from bare and seagrass patches within the same sites were paired in order to account for site-level effects on C stock. To assess sediment C loss below 5 cm, we compared sediment C content (mg C cm–3) from 0–10 cm depth between the higher and low recovery sites in 2018 with LMMs, with recovery status, sediment depth, and the interaction as fixed effects and site as a random effect. By using subdivided sediment cores, sediment C content from each successive, neighboring depth interval may have been correlated. However, including an auto-regressive (AR-1) correlation structure to account for this possible autocorrelation (Zuur et al., 2009) did not improve the model, based on a log-likelihood comparison of the model with and without the AR-1 structure (L = 0.0008, df = 1, and p = 0.978). We therefore did not include the AR-1 correlation structure in the final model. Finally, to look at landscape-scale spatial patterns over time, we used LMMs comparing sediment C stocks (g C m–2) at the inner meadow sites with stocks at the outer meadow sites over 4 years; location (inner/outer), sampling year (pre-disturbance: 2013; post-disturbance: 2016, 2017, and 2018) and the interaction between location and year were fixed effects and site was a random effect.
For all LMMs, we used the package nlme in R (Pinheiro et al., 2018; R Core Team, 2018). We assessed homogeneity and normality of residuals graphically, and we added heterogeneous covariance structures to models when necessary to achieve homoscedasticity. We used backward model selection based on Akaike Information Criterion (AIC) and we evaluated the significance of model terms with F tests. Final model results are shown in Table 1. We used the function glht from the package multcomp to compare effect levels using post hoc contrasts, with adjusted p-values to account for multiple comparisons (Hothorn et al., 2008). Differences were considered significant for p < 0.05; means are reported with ± SE, n = 6 except where noted otherwise.
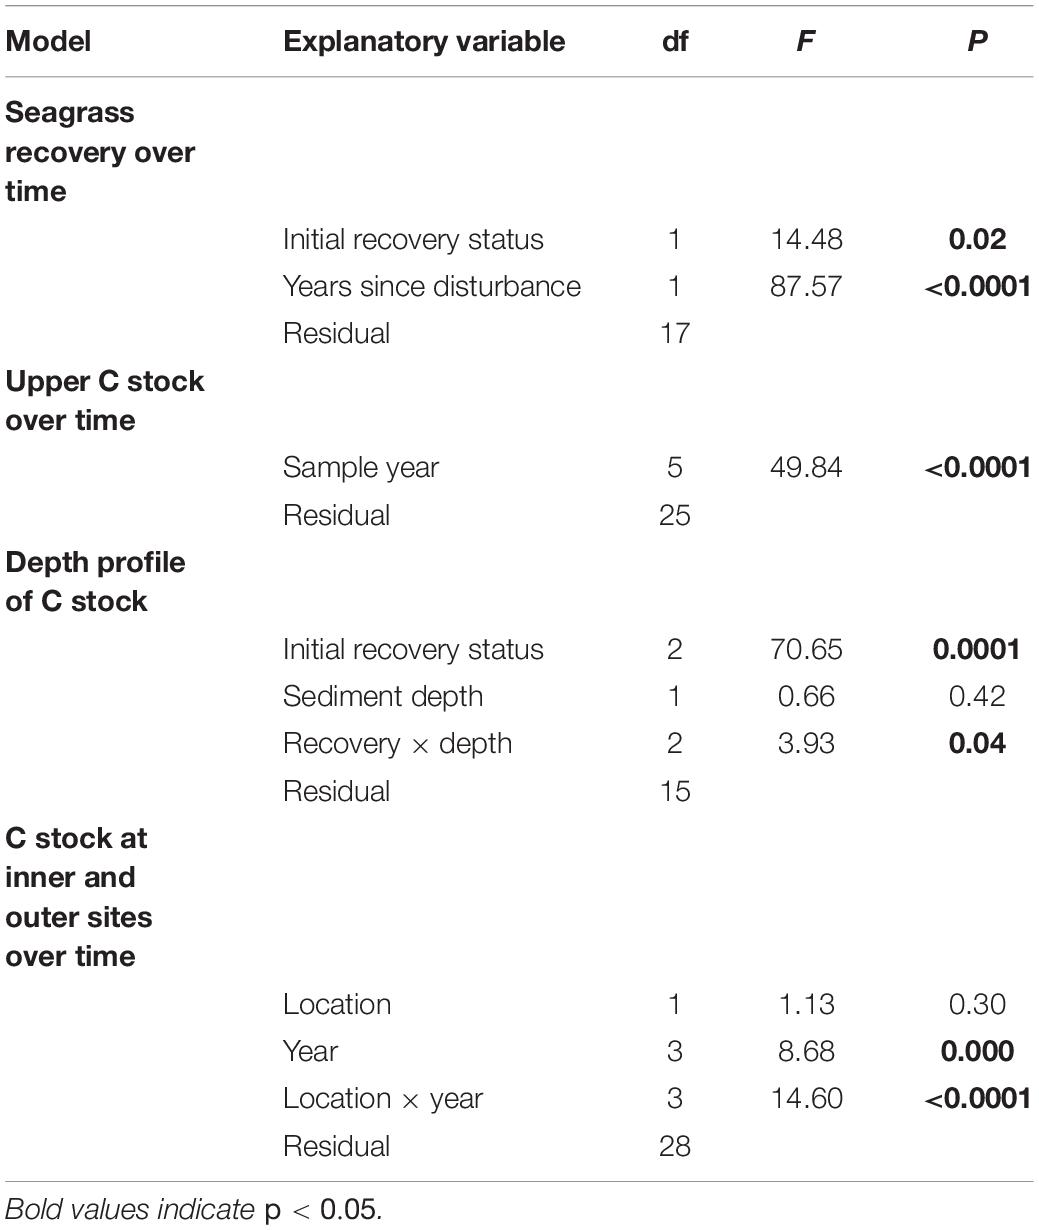
Table 1. Summary of model results for the spatial and temporal analyses of sediment C stocks.
Results
Temperature Exposure
Analysis of temperature data from the NOAA station in Wachapreague showed that a marine heat wave occurred from 12–25 June 2015 (Figure 2A). The heat wave affected waters throughout the Virginia coastal bays, with SST of ∼28–30°C during the MHW days, compared to ∼23–24°C during the non-MHW days in June 2015 (Figure 2B). The satellite sea-surface temperature imagery shows that under both MHW and non-MHW conditions, water temperatures in the Atlantic Ocean, east of the barrier islands, were lower than temperatures in the sheltered bays (Figure 3). Where the seagrass dieback occurred in South Bay, there was a clear difference between average ocean and bay temperatures during both MHW and non-MHW conditions (Figure 3D). During the MHW, mean temperatures were 26.1°C at the Atlantic Ocean site and 27.6°C in the seagrass meadow. During non-MHW conditions, mean temperatures were 25.3°C in the Atlantic Ocean and 26.4°C in the seagrass meadow. Throughout June 2015, seagrass meadow waters were on average 1.1–1.5°C warmer than the Atlantic Ocean waters under both MHW and non-MHW conditions.
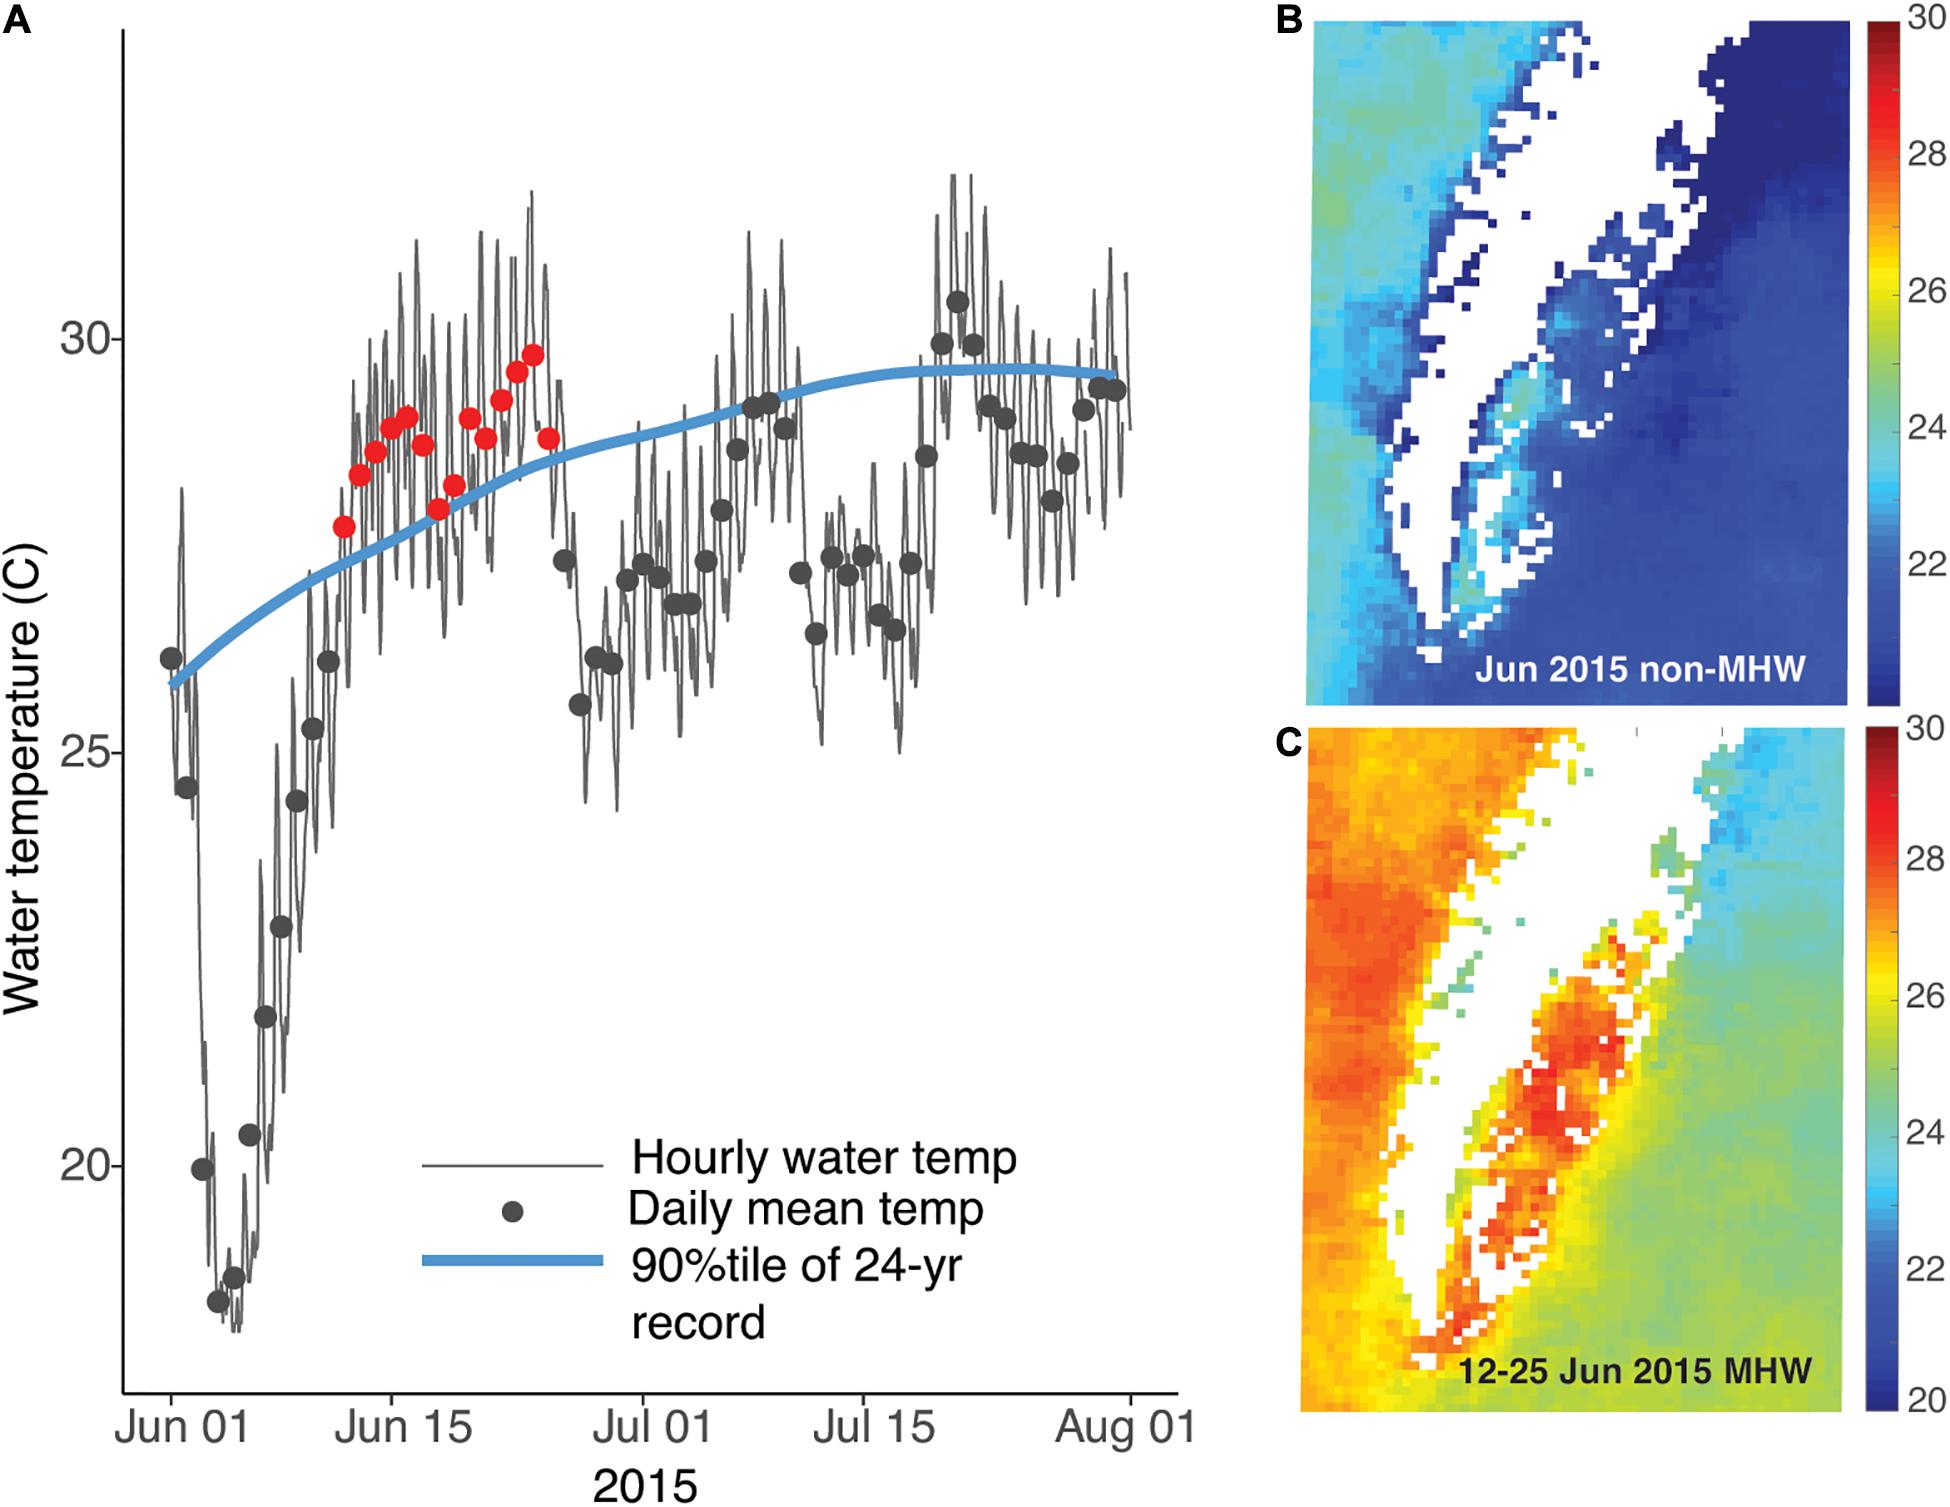
Figure 2. (A) Summer 2015 water temperature at the NOAA tide station in Wachapreague, VA; days that qualified as a MHW are shown in red (12–25 June). The right panels show the sea surface temperature for the Delmarva peninsula during June 2015 across the non-MHW (B) and MHW (C) conditions.
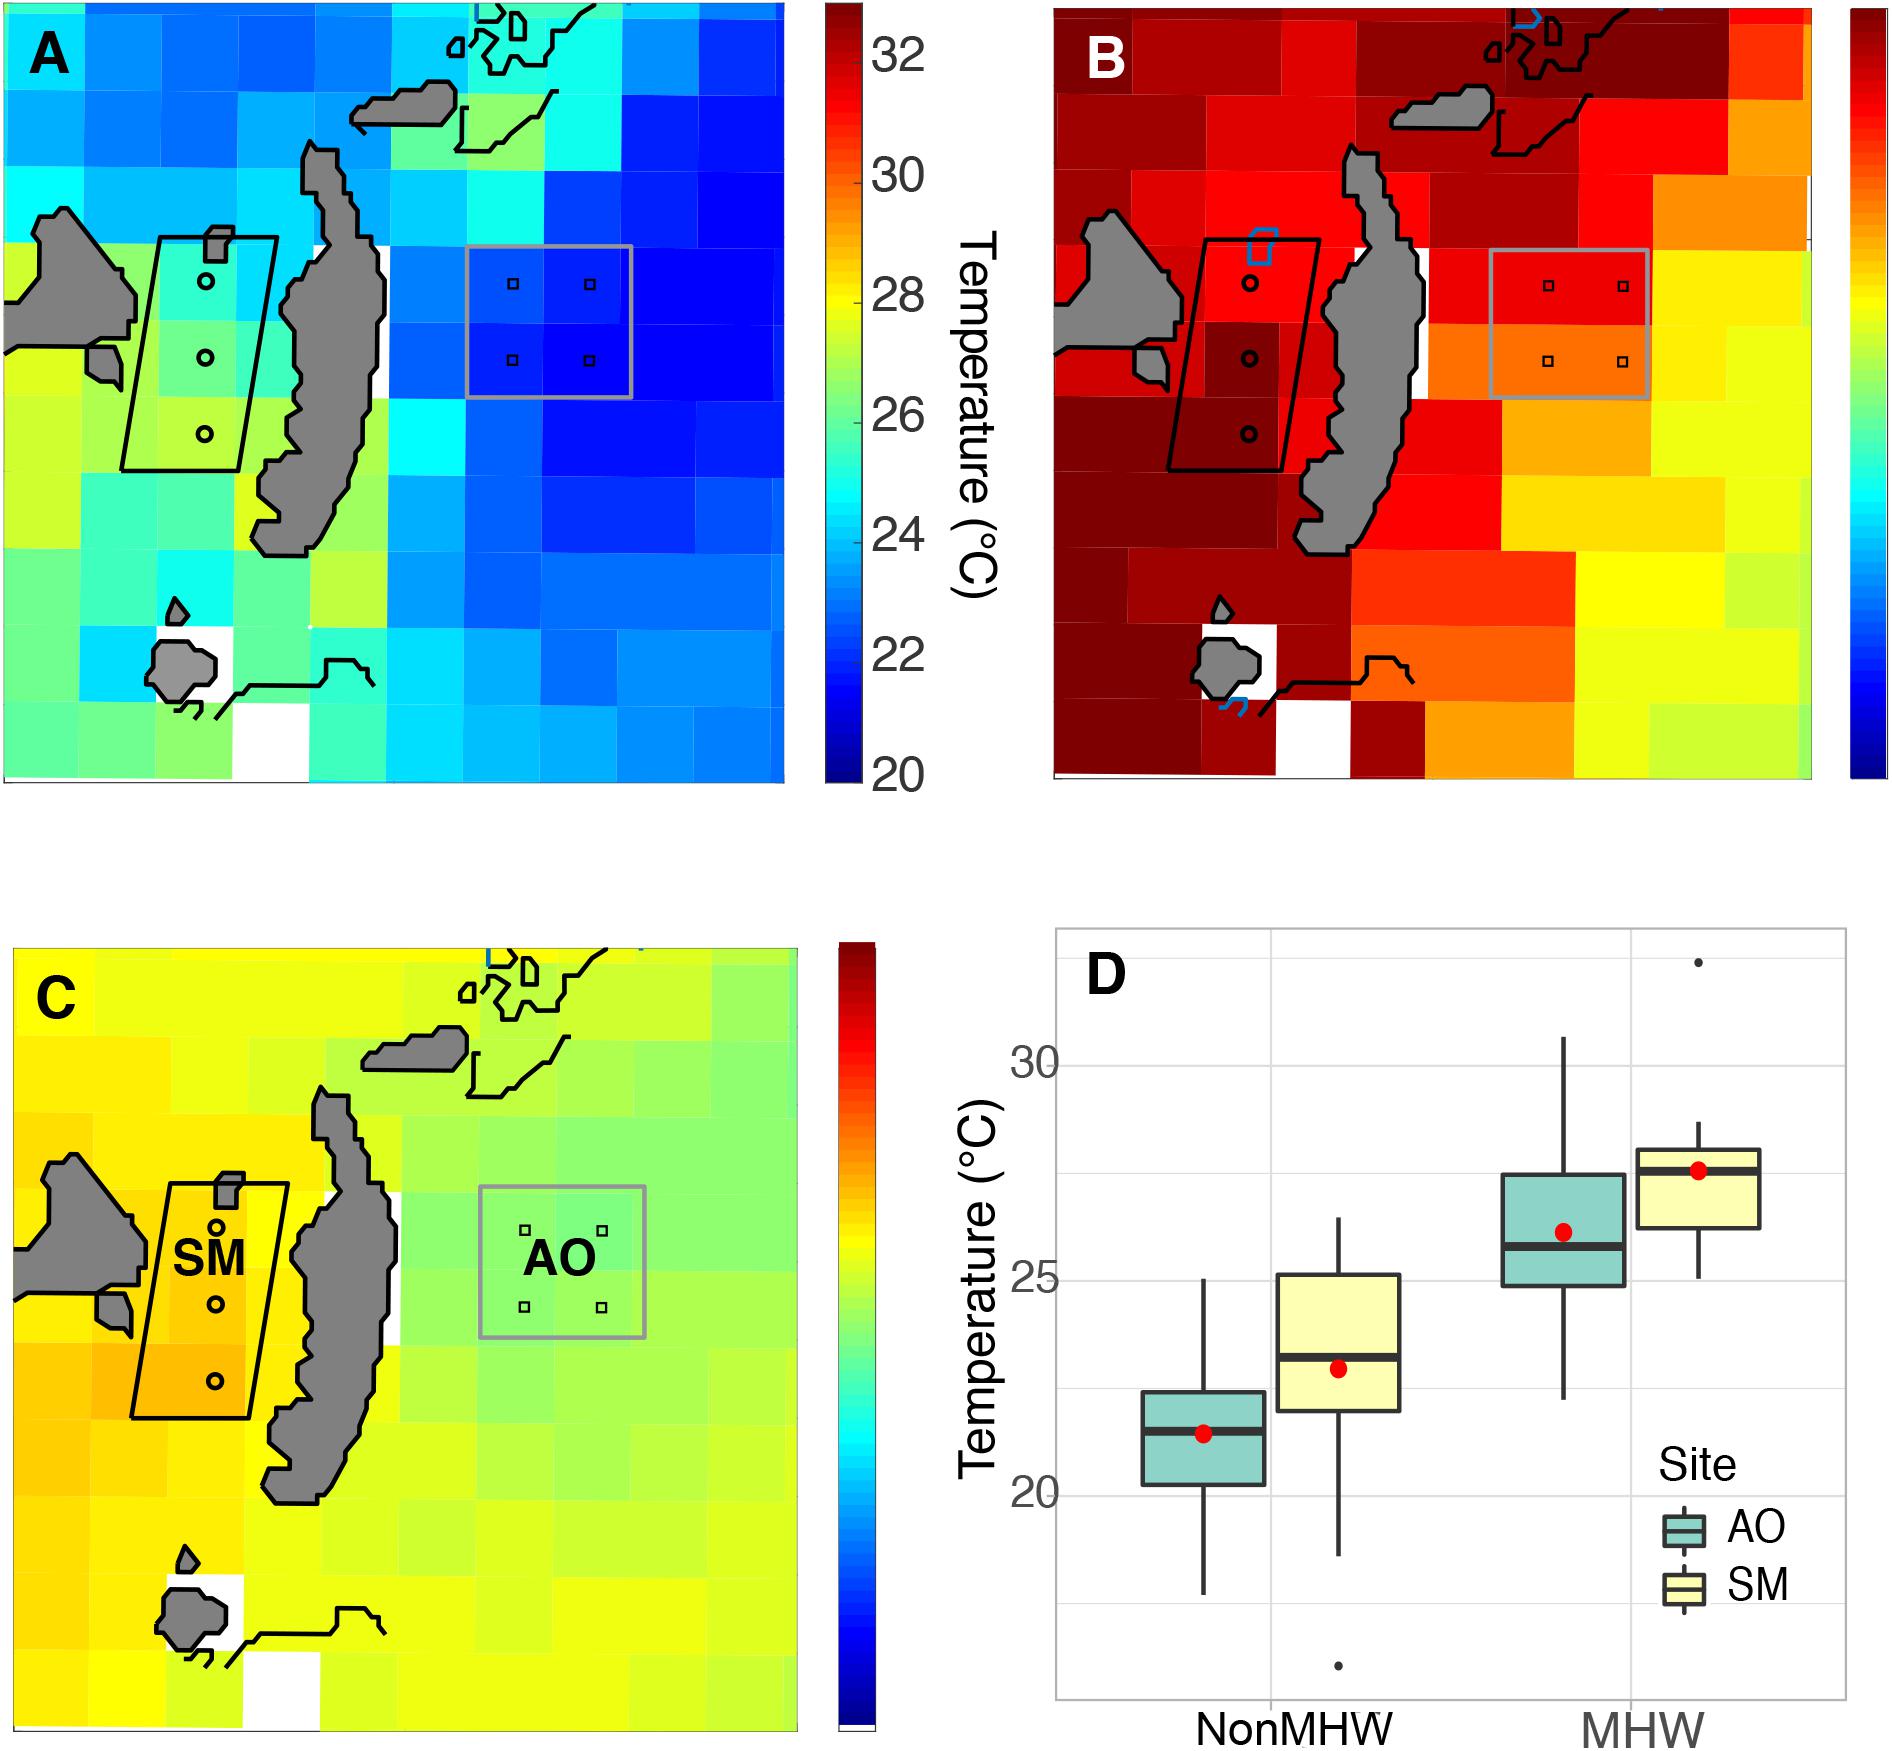
Figure 3. Sea surface temperatures from before (A), during (B), and after (C) the June 2015 MHW show cooler waters in the Atlantic Ocean (AO) compared to warmer waters in the seagrass meadow (SM). Image pixels for each area are identified in panel (C); images are from 11 June (A), 16 June (B), and 29 July (C). Temperature differences between the ocean and meadow regions for all available satellite images from June 2015 are shown in panel (D); seagrass meadow waters were on average 1.1–1.5°C warmer than the Atlantic Ocean waters under MHW and non-MHW conditions.
Seagrass Loss and Recovery
Images of the South Bay meadow acquired in May 2015 showed the healthy state of the meadow, weeks prior to the June 2015 dieback (Figure 4A). Aerial images of the meadow condition in July 2015, after the MHW, were not available. However, measurements of seagrass densities were conducted every 2 weeks from early June-early July at three of the inner sites in a related study (Aoki and McGlathery, 2018), and these measurements showed a rapid decline from 356 (±19, n = 3) shoots m–2 in early June 2015, before the MHW, to 151 (±11, n = 3) shoots m–2 in early July 2015, roughly 3 weeks after the MHW. Measurements of ecosystem metabolism, conducted using in situ aquatic eddy covariance at one inner site, also showed a significant decline in ecosystem respiration and gross primary production during this period, as well as a shift to net heterotrophy, indicating the substantial impact of the MHW and subsequent shoot density decline on the seagrass ecosystem (Berger et al., 2020). No aerial images were acquired in 2016; however, the 2017 images showed the unevenness of the recovery in the meadow 2 years after the initial dieback (Figure 4B). The central area of the meadow, where the inner sites were located, remained patchy in 2017, while areas further from the center did not have visible bare areas in 2017. By 2018, 3 years after the MHW, the patchiness was no longer visible in the aerial images, indicating recovery of the seagrass meadow in terms of canopy cover (Figure 4C).
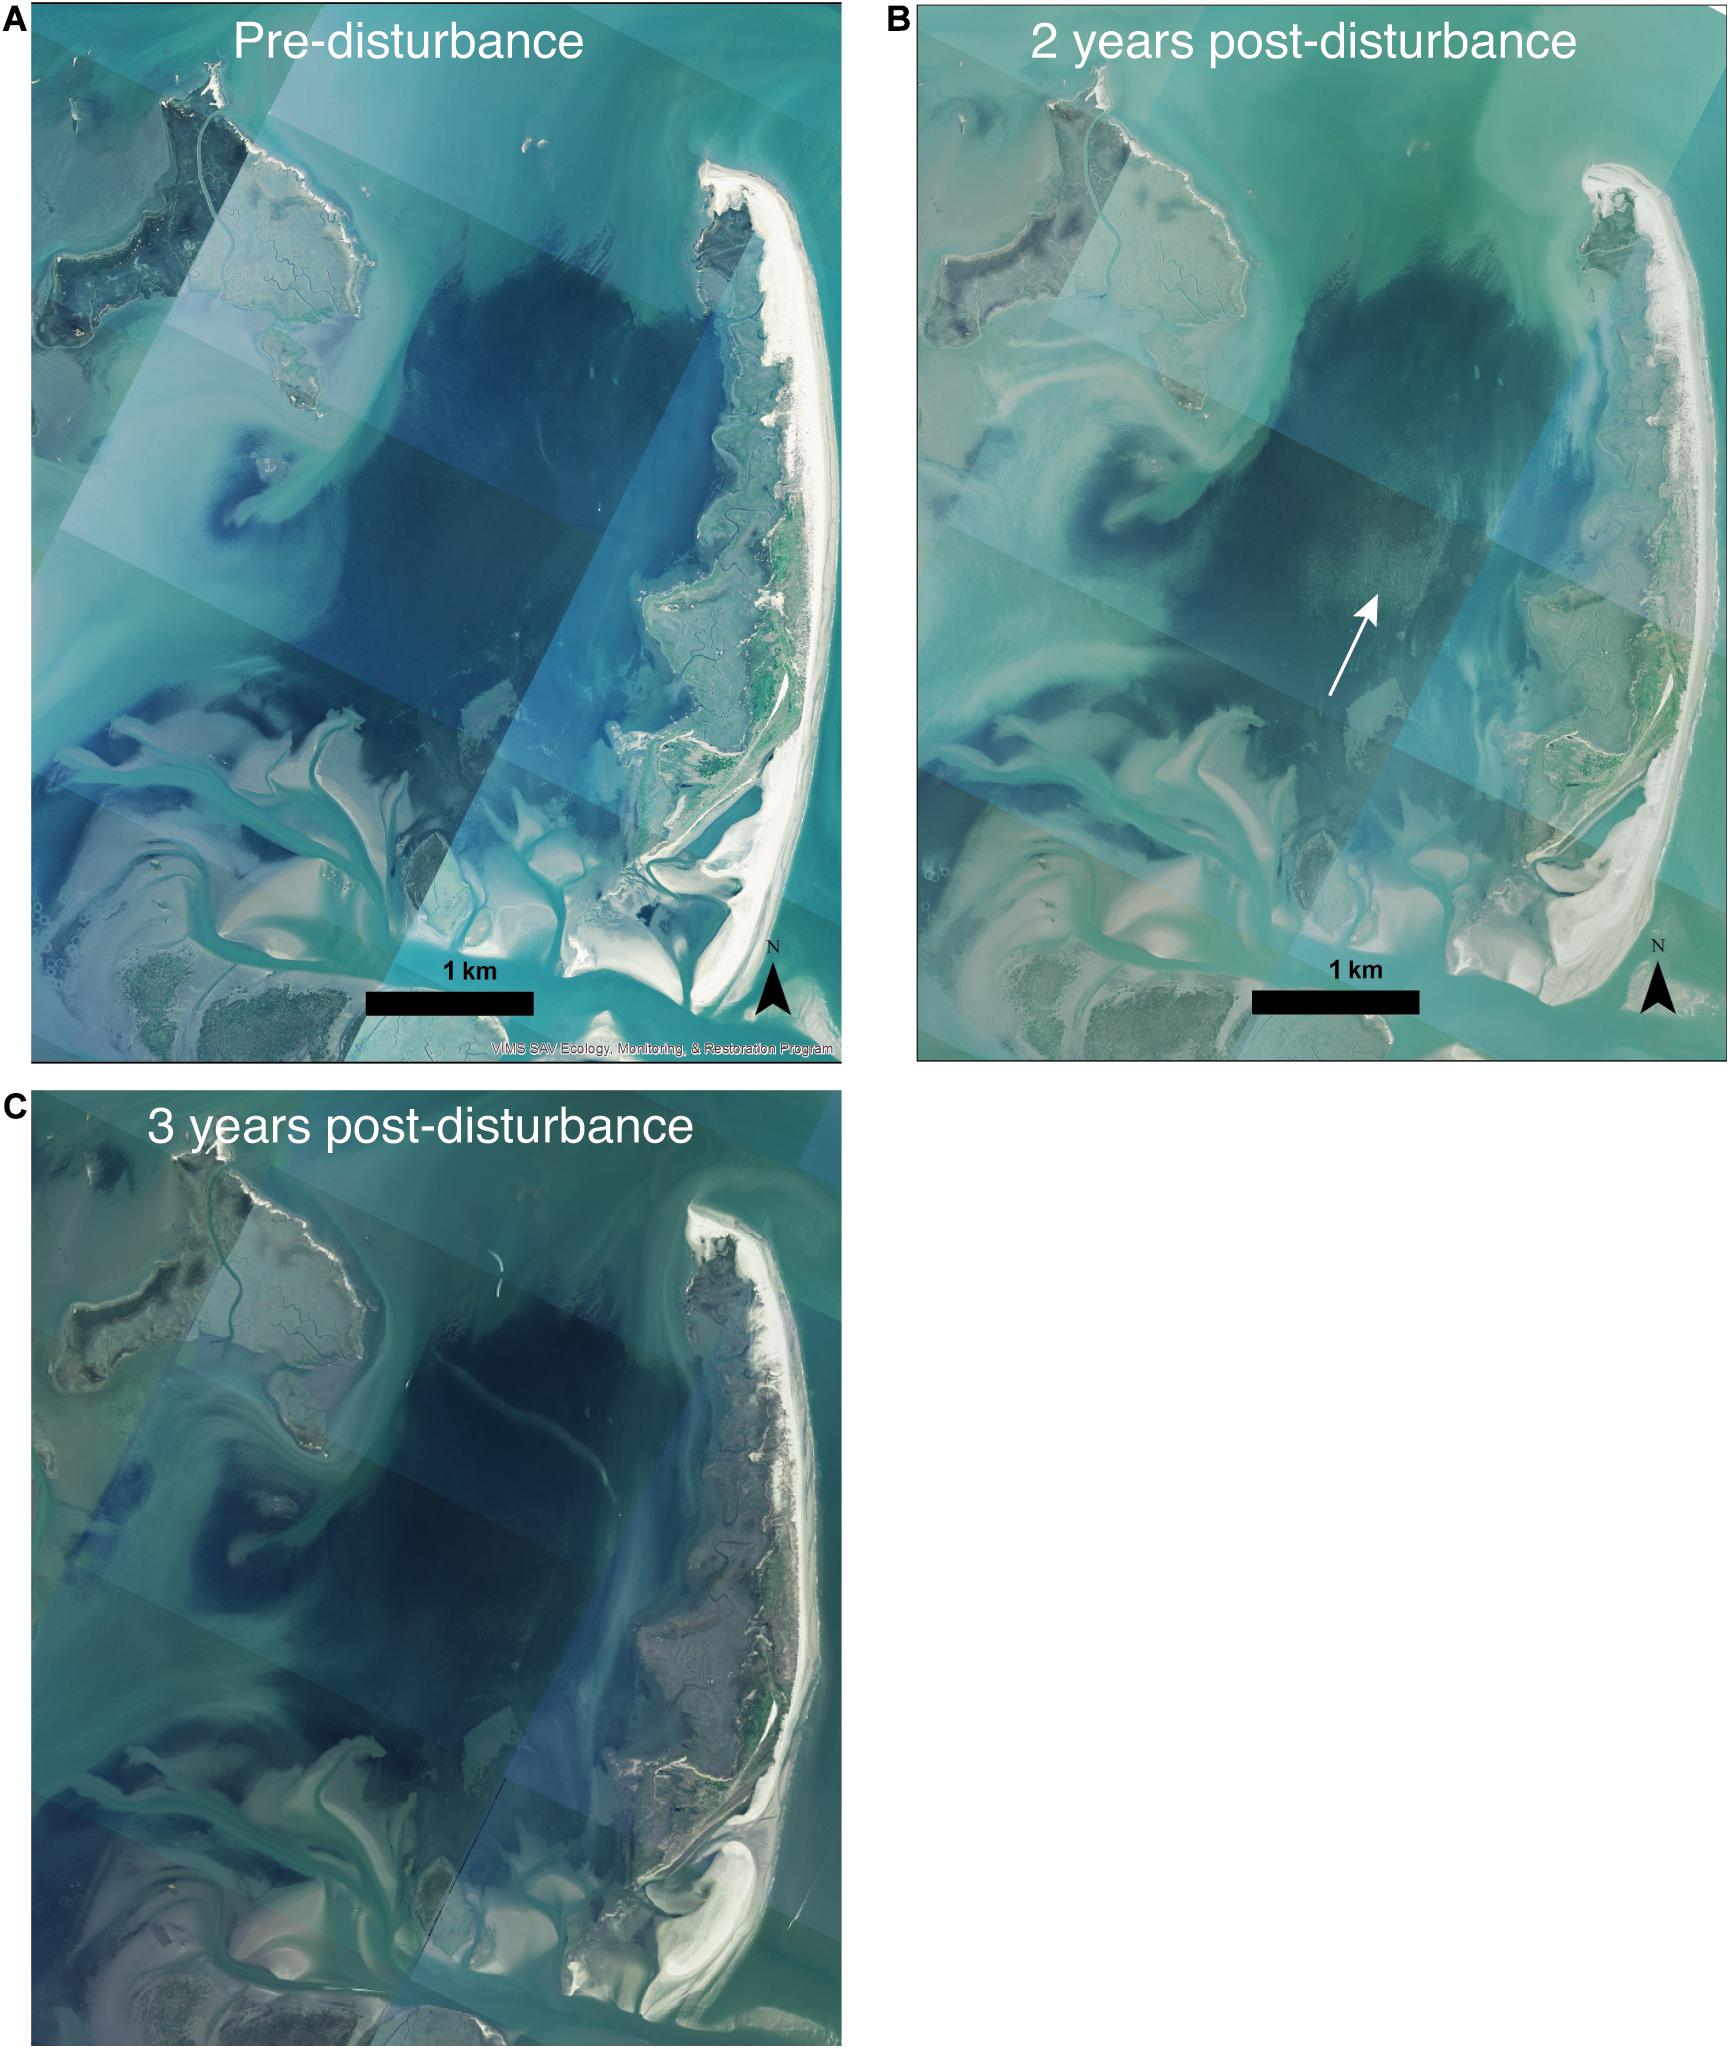
Figure 4. Aerial images from before (A), 2 years after (B), and 3 years after (C) the MHW show spatial variability in the meadow status 2 years after the MHW and full recovery within 3 years. The white arrow in panel (B) indicates the area in the inner of the meadow that had low recovery 2 years after the MHW.
Shoot density counts revealed site-specific patterns in shoot loss and recovery. Shoot losses were comparable at all six inner meadow sites, with mean shoot densities dropping from 599 (±20) shoots m–2 in July 2014 to 43 (±19) shoots m–2 in July 2015, just weeks after the MHW (Figure 5). Initial recovery varied by site; higher recovery sites had densities of 379 (±47, n = 3) shoots m–2 whereas low recovery sites had densities of 175 (±25, n = 3) shoots m–2 in 2016. However, shoot recovery converged somewhat over time, with densities of 503 (±16, n = 3) shoots m–2 at higher recovery sites compared to 406 (±44, n = 3) shoots m–2 at low recovery sites by 2018. Both recovery status and years since disturbance were significant effects in the model (Table 1). Shoot densities from the outer meadow sites were not included in the model, because densities were only available for 2014, 2017, and 2018. However, shoot densities were comparable between the outer sites in 2018 and 2014 [mean densities of 580 (±59) shoots m–2 in 2018 compared to 542 (±29) shoots m–2 in 2014]. Without knowing the extent of seagrass loss at these sites in 2015, we cannot determine if the outer sites recovered faster or experienced less loss, but it is clear that the outer sites had robust shoot densities in 2018.
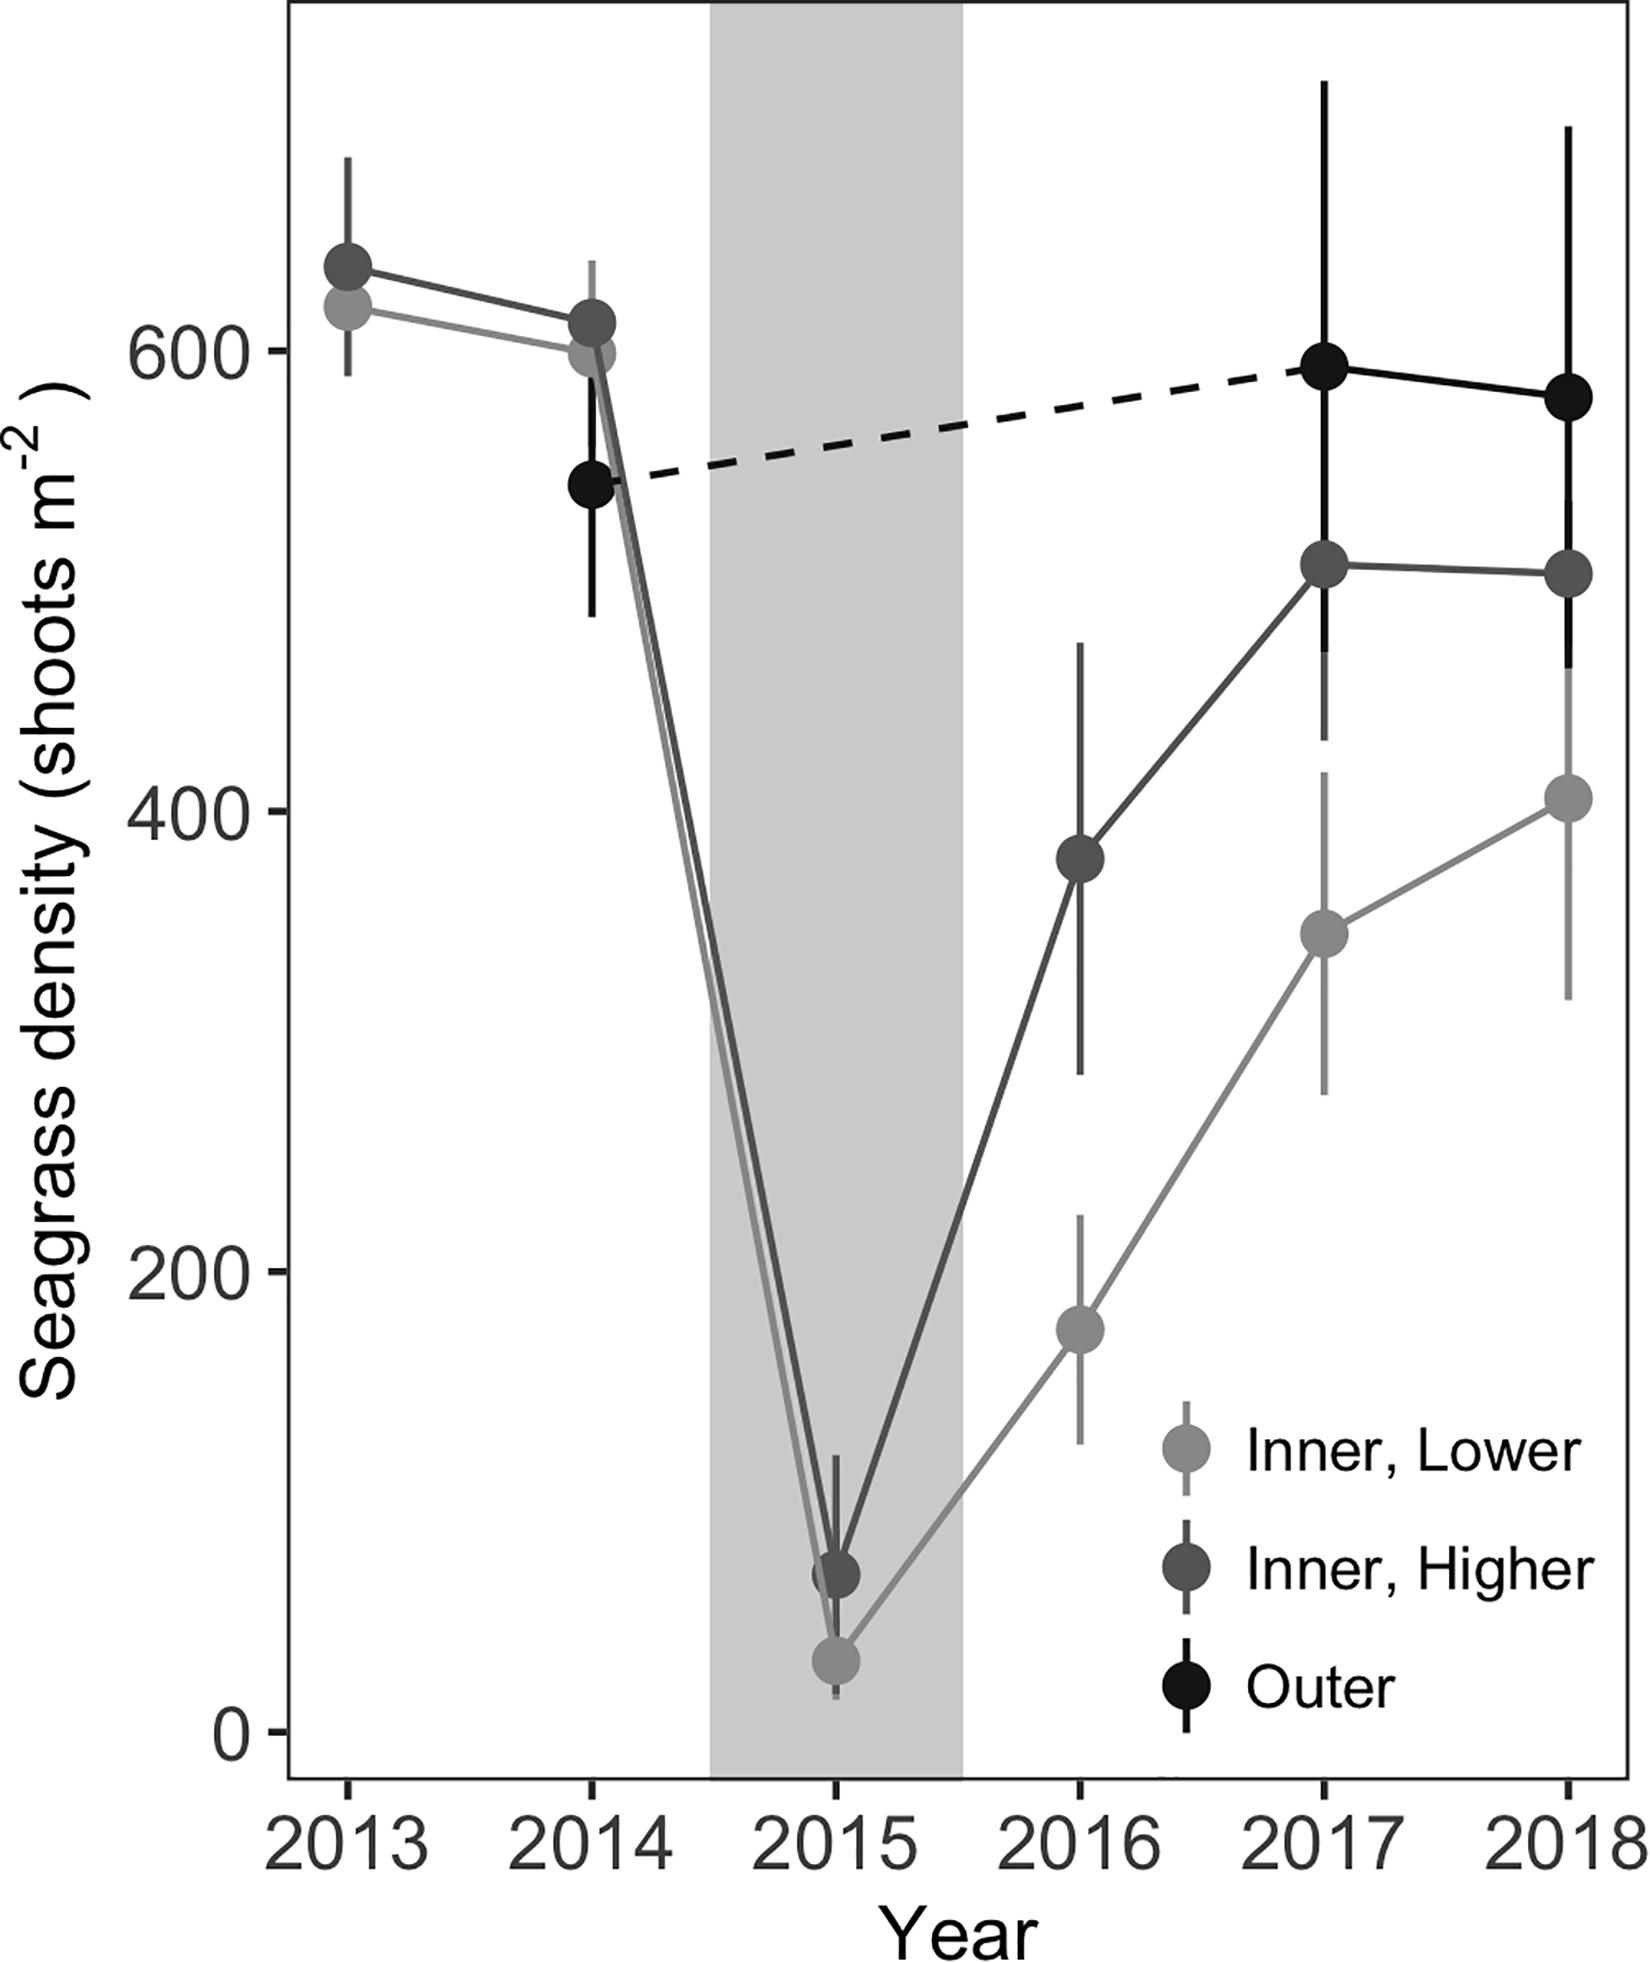
Figure 5. Seagrass shoot densities at all inner and outer sites from 2013–2018. Densities are missing from outer sites in 2013, 2015, and 2016. In 2015, the year of the MHW disturbance, shoot densities declined at all inner sites. Sites with more rapid initial recovery were categorized as “higher” recovery sites; sites with lower initial recovery were considered “lower” recovery sites. Gray background indicates the year of the MHW. Values are mean ± 2 × SE, n = 3 each for inner, higher and inner, lower sites, n = 6 for outer sites.
Loss of Upper Sediment C Stock
At the inner meadow sites, carbon stocks in the upper 5 cm of sediment varied significantly over time (Table 1). During the 2 years before disturbance, areal C stocks were constant in the restored meadow, at 399 (±29) g C m–2 in 2013 and 386 (±37) g C m–2 in 2014 [mean (±SE), Figure 6A, Tukey contrast, p = 0.99]. In 2015, sediment samples were collected approximately one month after the MHW; at this sampling point, the C stock had increased significantly to 571 [±27 g C m–2 (Tukey contrast, p < 0.001)]. However, by the following summer, the C stock declined substantially; C stock in 2016 was 303 (±19, n = 6) g C m–2, significantly lower than the pre-disturbance value in 2013 (Tukey contrast, p < 0.001). The C stock declined to a minimum of 250 (±21, n = 6) g C m–2 in 2017 but began to re-accumulate, with a value of 317 (±16, n = 6) g C m–2 in 2018, 3 years after the dieback. The C stock 3 years after the dieback was significantly greater than the minimum in 2017 (Tukey contrast, p = 0.040), but remained significantly lower than the pre-disturbance meadow stock (Tukey contrast, p = 0.042), indicating the lag in recovery of sediment carbon stocks following seagrass loss. At the outer meadow sites, C stocks showed no significant change from pre-disturbance stock of 249 (± 25, n = 9) g C m–2 in 2013 to post-disturbance stock of 256 (±18, n = 4) g C m–2 in 2016. By 2018, outer meadow sites had accumulated C stock of 372 (±40, n = 6) g C m–2, significantly greater than the 2013 pre-disturbance stock (Tukey contrast, p = 0.0035).
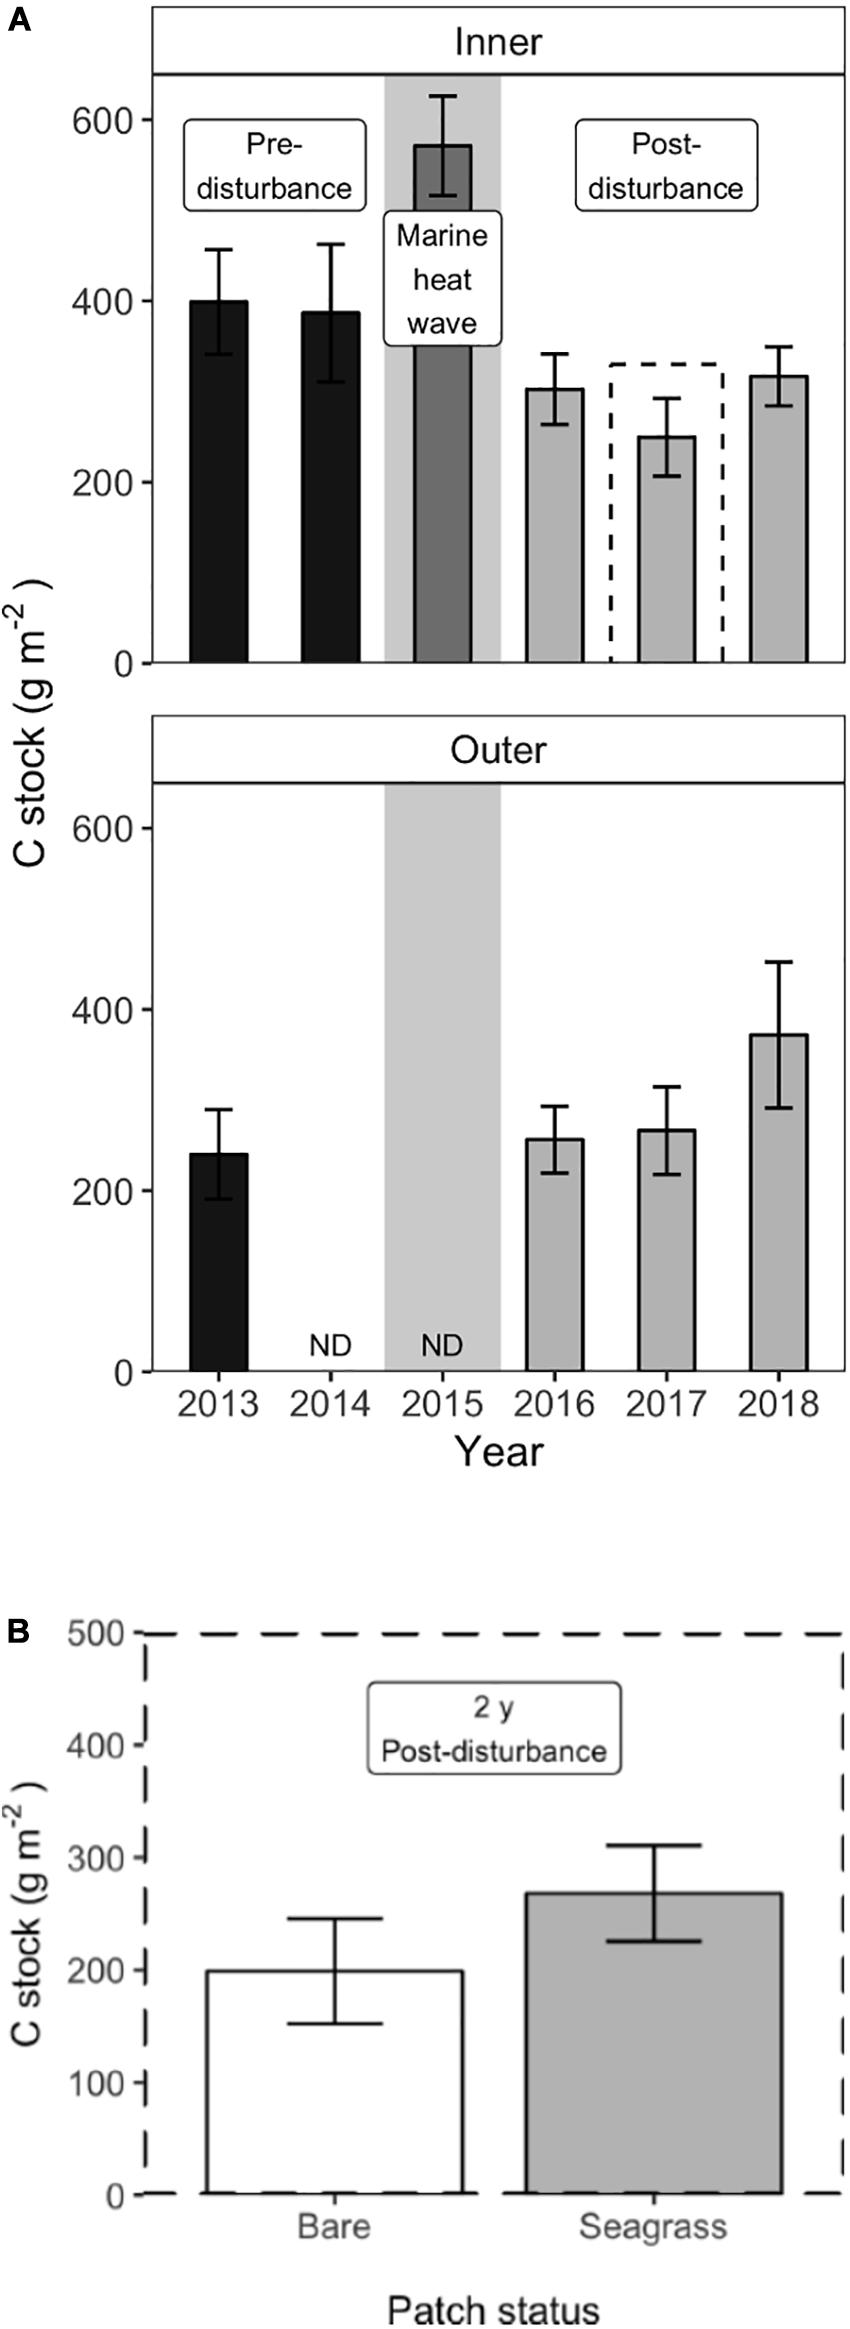
Figure 6. Sediment carbon stocks at the inner and outer meadow sites; gray background indicates the year of the MHW (A) At the inner sites, a large pulse of sediment C was observed within a month of the MHW in 2015, compared to the pre-disturbance stock. Sediment C then declined rapidly following the disturbance and began re-accumulating in 2018. At the outer sites, sediment C stocks were constant before and after the disturbance and accumulated in 2018. Values are mean ± 2 × SE, outer sites: n = 9 (2013), n = 4 (2016), and n = 6 (2017–2018); inner sites: n = 6. (B) Two years after the disturbance, small (m2) patches of recovering seagrass retained significantly more sediment carbon compared to bare patches at the inner sites (n = 6, mean ± 2 × SE).
Small-Scale Patchiness
At the patch scale (m2), uneven shoot recovery at the six inner meadow sites affected the amount of C retained in the sediments in 2017, 2 years after the dieback. The paired t-test showed that seagrass patches retained significantly more C in the upper 5 cm of sediment compared to bare patches, 268 (±23, n = 6) g C m–2 compared to 199 (±21) g C m–2 [mean (±SE), Figure 6B; t = −4.248, df = 5, and p = 0.008].
Retention of Deeper Sediment C Stock
Analysis of the deeper (10 cm) sediment cores showed that sites with faster initial recovery (higher recovery sites) retained significantly more sediment C than lower recovery sites (Table 1). Sediment profiles of the deeper sediment cores from 2018 are shown in Figure 7. C content (mg C cm–3) was not significantly different in the surface sediments (0–2.5 cm interval) between the three higher and three lower recovery sites (5.4 ± 0.7 g cm–3 and 4.1 ± 0.5 g cm–3 respectively, Tukey contrast, p = 0.26). However, higher recovery sites had significantly greater C content than lower recovery sites in the 2.5–5 cm interval (6.8 ± 2 g cm–3 and 4.2 ± 0.7 g cm–3 respectively, Tukey contrast, p < 0.001) and the 5–10 cm interval (6.7 ± 0.2 g cm–3 and 3.6 ± 0.2 g cm–3 respectively, Tukey contrast, p < 0.001). Integrating these C concentrations by each depth interval, the higher recovery site stored 636 g C m–2, while the lower recovery sites stored 384 g C m–2 in the upper 10 cm of sediment.
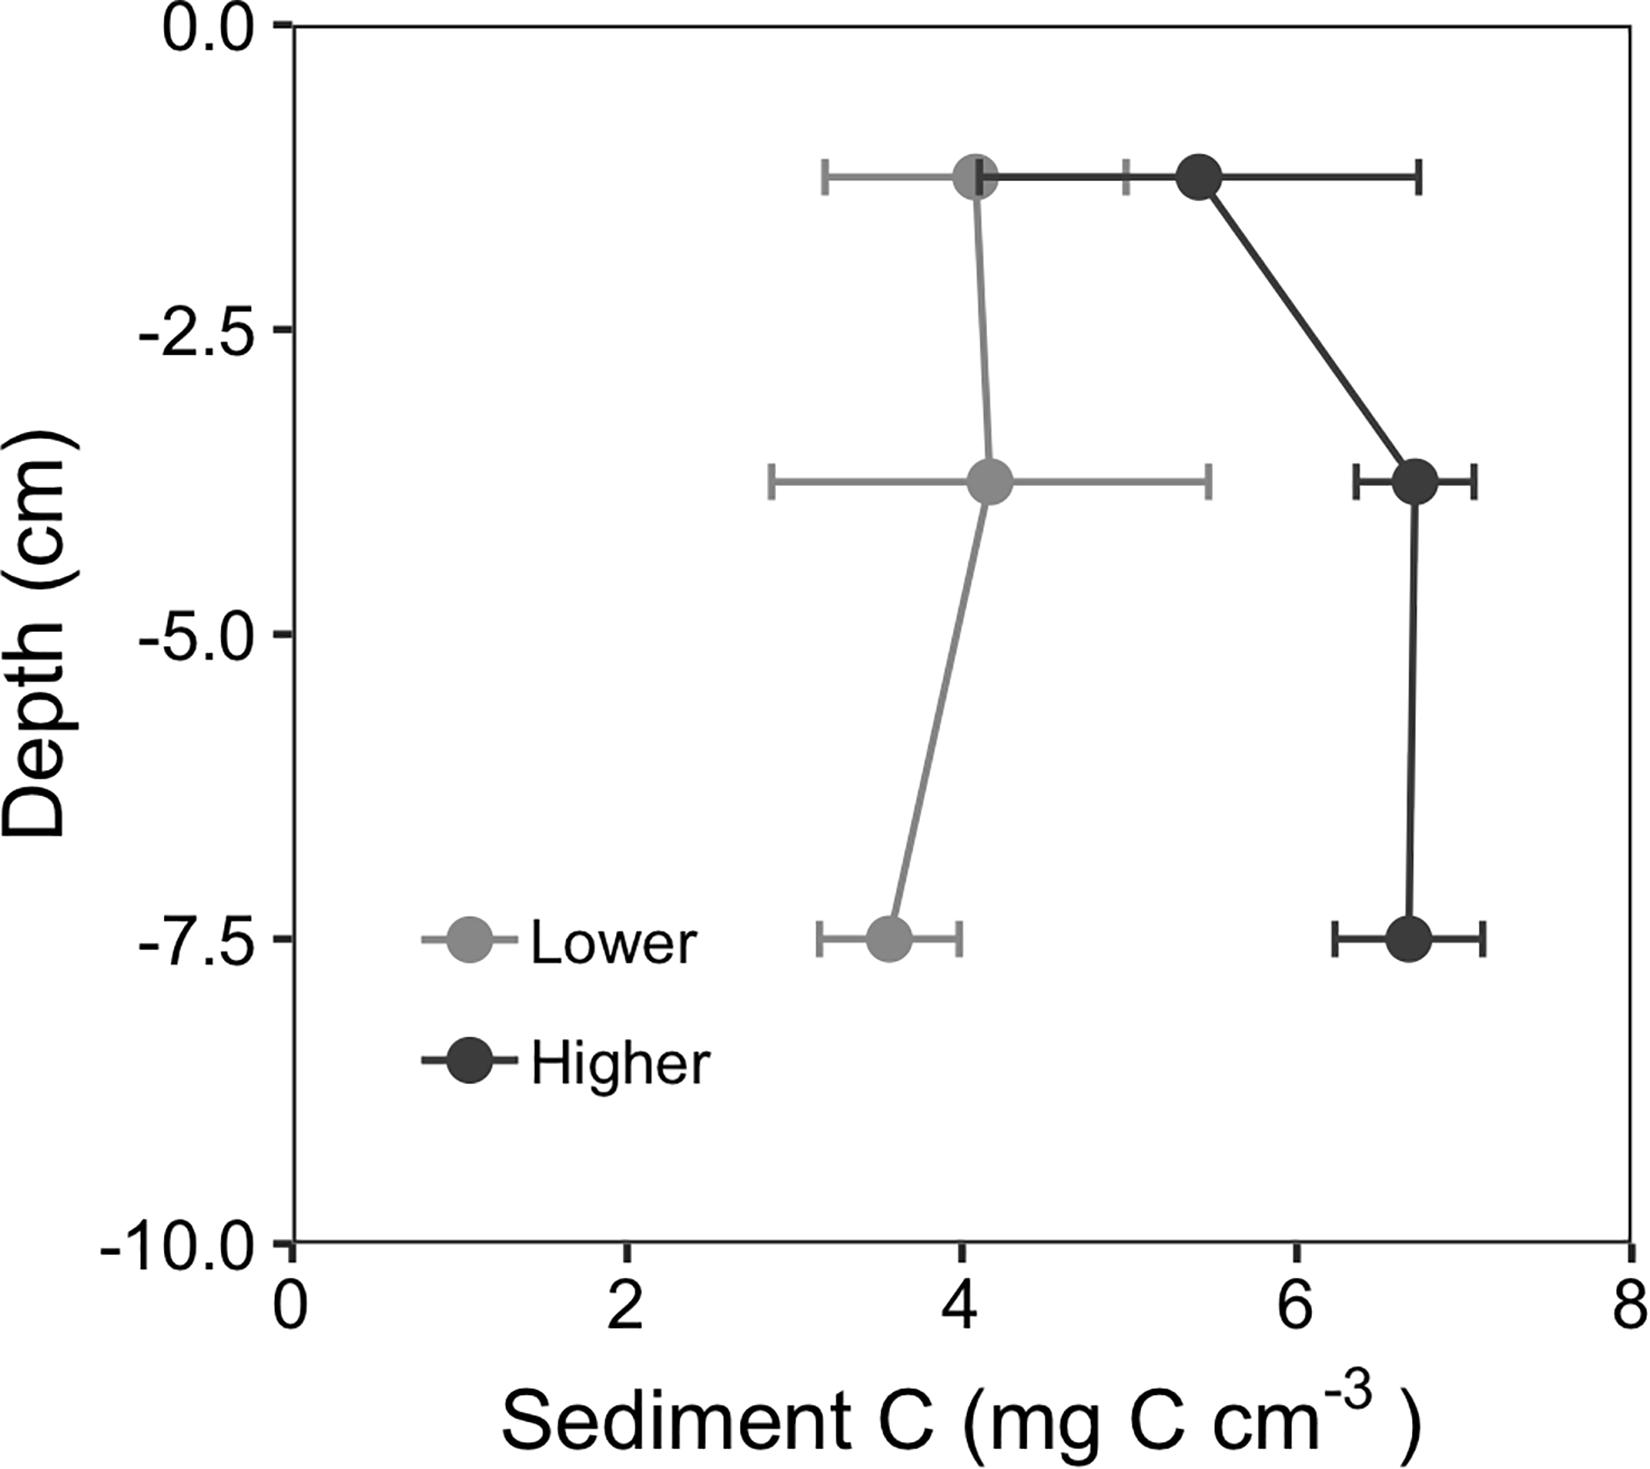
Figure 7. Depth profiles of sediment carbon content showed that in 2018, 3 years after the MHW disturbance, higher recovery sites retained more carbon at depths below the surface compared to lower recovery sites. Values are mean ± 2 × SE, n = 3.
Landscape-Level Spatial Effects
Compared to the inner sites, the outer sites did not experience a net loss of carbon after the MHW (Figure 8). The outer sites had significantly greater C stocks in 2018 (3 years post-disturbance) compared to 2013 (pre-disturbance meadow); the net change in C stock was an increase of 56% over the 6 years. In contrast, the inner meadow sites had lost significant amounts of C compared to 2013 levels by 2017, and only partially re-accumulated that C in 2018, with a net loss of 18%. The pattern of C loss and re-accumulation at the inner sites was consistent across the sites with higher and lower recovery. By 2018, there was no significant difference in C stock between the inner and outer sites (317 ± 16 and 372 ± 40 g C m–2 respectively, Tukey contrast, p = 0.98). However, the stock at the inner sites remained below the 2013 pre-dieback stock of 399 ± 29 g C m–2 and likely below the amount that would have accumulated, had the meadow not been disturbed in 2015.
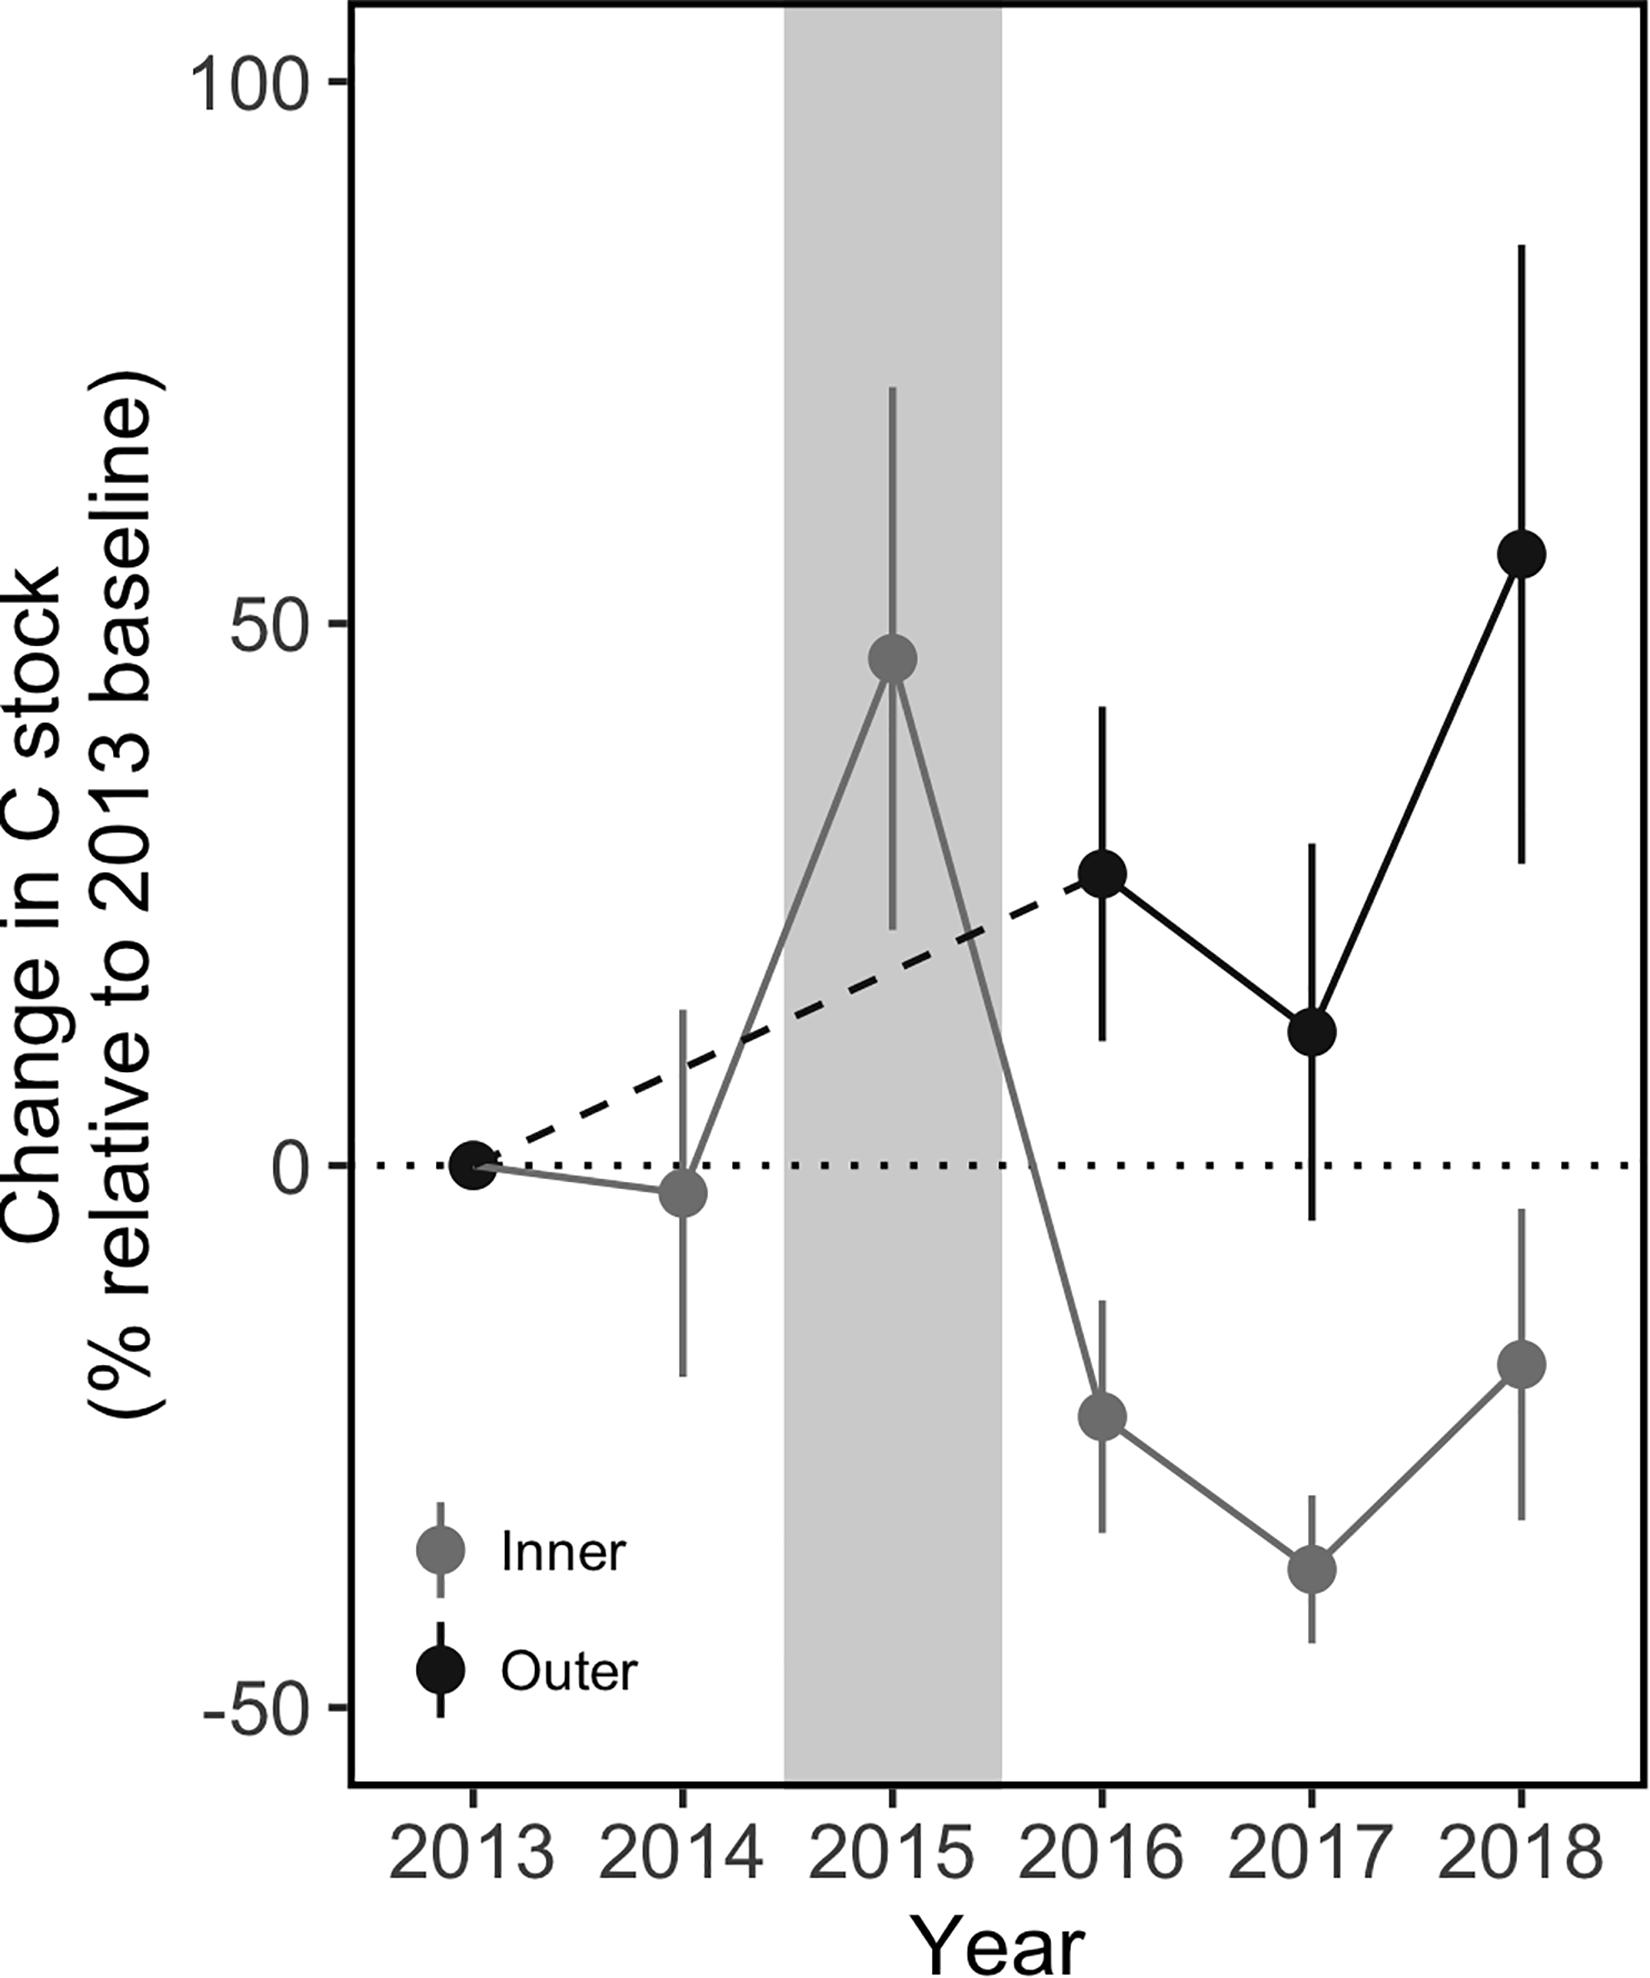
Figure 8. Change in sediment carbon stocks in the surface sediments (0–5 cm) at the inner and outer meadow sites before and after the MHW, compared to a pre-disturbance 2013 baseline. Despite a pulse in sediment C observed within one month of the MHW, the inner sites lost sediment C and took 3 years to begin re-accumulating, with a net loss of 18% by 2018. In contrast, the outer sites showed a net increase of 56% in sediment C within 3 years after the MHW. Gray background indicates the year of the MHW. Values are mean ± 2 × SE, outer sites: n = 9 (2013), n = 4 (2016), and n = 6 (2017–2018); inner sites: n = 6.
Discussion
To our knowledge, this is the first study to directly quantify the impact of a marine heat wave on sediment C stocks in a seagrass meadow. Using long-term data from a landscape-scale restoration project that spanned the period before, during, and after the MHW, we report that inner meadow sites experiencing extreme shoot density declines of 90% during the MHW also showed net losses of 20% of C in upper sediments (0–5 cm) over the three following years. However, this effect was not consistent across the 7-km2 meadow; outer meadow sites showed no change in shoot densities before and after the disturbance and experienced net increases of 60% of C in upper sediments (0–5 cm) over the 3 years after the disturbance. These outer meadow sites may have experienced less disturbance or they may have recovered more quickly. Regardless, the effects of a regional MHW were not uniform over a large seagrass meadow. Our study further documents that the unevenness of seagrass recovery had a clear impact on the preservation of sediment C stocks. Inner sites that had faster initial shoot recovery maintained C at deeper depths (down to 10 cm) compared to inner sites with slower initial shoot recovery (Figure 7). Seagrass patches (m2) also retained more sediment C than adjacent bare patches (Figure 6B). Together, these findings indicate that the long-term stability of seagrass sediment C stocks – over decades or longer – depends on seagrass resilience to and recovery from short-term disturbance events.
Spatial and Temporal Patterns in Blue C Loss
This case study highlights that sediment C loss following disturbance can be localized. Seagrass loss, and subsequent sediment C loss, was clear at the inner sites following the MHW disturbance. However, the effects of the MHW on the outer sites were not as evident. Both the aerial images of the meadow and the shoot density counts at the outer sites showed high seagrass cover in 2017 and 2018, and the sediment C stocks increased between 2013 (pre-disturbance) and 2016 (1 year post-disturbance) (Figure 8). Given the limited data available, we cannot determine whether the temporal stability of shoot densities and C stocks at the outer sites resulted from less disturbance compared to the inner sites, greater resistance to the effects of the MHW, more rapid recovery, or a combination. We hypothesize that disturbance from temperature stress was more limited at the outer sites as a result of ameliorating effects of tidal exchange with cooler ocean water. The inlet north of the meadow is the main source of tidal exchange for the bay, and there was a gradient of cooler temperatures from the ocean through the inlet to the meadow during both MHW and non-MHW conditions (Figure 3). There may be a temperature gradient within the meadow; the northernmost pixel identified as seagrass meadow was consistently cooler than the more southern meadow pixels, a difference of up to 0.5°C, which may be meaningful given the sensitivity of eelgrass in this region to temperatures above 28°C (Moore and Jarvis, 2008; Berger et al., 2020) and the 15-day duration of the MHW. However, the coarse spatial resolution of the SST data (1 km2 pixels) limits further inference. Temperature measurements are needed at finer spatial scales (<1 km) to understand differences in exposure to thermal stress, and any cooling effects of tidal exchange, across the meadow. Spatial patterns in sediment conditions may also have contributed to localized C loss at the inner sites; the inner sites had higher organic matter content before the dieback (Oreska et al., 2017), potentially leading to greater intrusion of toxic sulfide during the seagrass dieback (Holmer and Kendrick, 2013). Regardless of the exact mechanism, the net gain of sediment C at the outer sites shows that the meadow-wide MHW did not cause meadow-wide C losses. A related study mapping blue C in this meadow showed an increase in meadow-wide sediment C stocks from 2013 to 2016, despite the localized loss of sediment C in the inner meadow (Oreska et al., 2020). Our study confirms these findings and shows that disturbance from a MHW can have non-uniform effects on seagrass loss and recovery and on sediment C stock persistence at the meadow-scale (km2). These spatial patterns highlight the need to understand meadow-scale dynamics and landscape-scale drivers of seagrass loss and recovery after disturbance.
Within the inner sites that experienced net sediment C loss, patterns in sediment C to depths of 10 cm indicate the importance of shoot recovery. Previous work has shown that the major enhancement of sediment C following seagrass restoration occurs from 3–6 cm depth, in part due to contributions from belowground biomass (Greiner et al., 2013), whereas surface sediments (0–3 cm) have lower C content (Oreska et al., 2017). At sites with higher (more rapid) shoot recovery, seagrass shoots would reduce erosion, resuspension, and oxidation of sediment C and would support sediment accretion through deposition of particulates (de Boer, 2007; van Katwijk et al., 2010; Hansen and Reidenbach, 2012); shoots would also add organic matter to the root zone (3–6 cm depth). In contrast, sites with lower shoot recovery would experience less C accumulation at depth, less surface accretion, and greater rates of erosion and oxidation. Our measurements of change in C stocks do not differentiate these simultaneous processes, but previous measurements of accretion rates show that sediment C in the 0–10 cm interval had accumulated over the last decade of the restoration (Greiner et al., 2013; Oreska et al., 2017). Greater stocks of C below 2.5 cm at the higher recovery sites, as shown in Figure 7, indicate at least partial retention of the deeper C stores that had accumulated prior to the disturbance, whereas the reduced C stock at the lower recovery sites, consistent across the 0–10 cm depth profile, suggests extensive erosion and re-suspension. A similar dynamic would explain the lower stocks of C in bare patches compared to adjacent seagrass patches (Figure 6B); patchy shoot recovery stabilized the local sediments, preventing resuspension and oxidation. Previous work in this study system has found that seagrass restoration converted erosional sediments to an environment of net deposition and that seagrass effects on hydrodynamics and sediment suspension were density dependent (Hansen and Reidenbach, 2012). Other studies assessing sediment C after long-term seagrass loss have also highlighted the role of erosion (Serrano et al., 2016; Salinas et al., 2020). Thus, although the shoot losses after the MHW were comparable at all the inner meadow sites, site-specific patterns in shoot recovery mediated the impact of disturbance on C loss by influencing erosion rates.
This case study suggests that rapid shoot recovery following disturbance may be key to minimizing the net loss of seagrass blue C; however, there are several contrasts in the temporal records of shoot recovery and sediment C. First, there is a clear peak in sediment C at the inner sites in 2015, the year of the MHW (Figure 6). This peak likely results from the dieback of seagrass shoots and an associated pulse of detritus and organic matter to the sediments. Sediment sampling in 2015 was conducted within one month of the MHW; the peak in sediment C coincided with the minimum shoot densities, showing a contrasting immediate effect of the MHW on seagrass shoots versus C stocks. However, by the following summer (2016), the sediment C stock had fallen well below the pre-disturbance value whereas seagrass shoots had recovered by 26–77%. The contrast between rapid shoot recovery and continued C loss indicates the importance of erosion during fall and winter, before seagrass regrowth in spring. Other processes, such as stimulation of decomposition through the input of detritus, may also have contributed to the large decline in C stock from 2015 to 2016 (Liu et al., 2020). Second, the time lag between shoot recovery and recovery of C stocks persisted over time; C stocks did not begin to re-accumulate until 2018, 3 years after disturbance (Figure 8). The time lag shows that while rapid shoot recovery can minimize net loss of C at depth, recovery of sediment C stocks occurs over longer time scales than shoot recovery. Finally, it is important to note that the difference in C stock between higher and lower recovery sites is evident in the depth profiles (Figure 7) but was not significant in the temporal record of surface C stock (0–5 cm depth, Figure 6). Competing effects of erosion and accretion, as well as the changing shoot densities over time, complicate the comparison of sediment C in the surface interval (Belshe et al., 2017). Overall, seagrass shoot recovery trajectories indicate general but not exact patterns in net sediment C change after disturbance.
Implications for Seagrass Blue C Under Climate Change
Under a changing climate, baseline sea surface temperatures are rising, and MHWs are predicted to increase in severity, duration, and frequency (Oliver et al., 2019). These conditions will hamper rapid shoot recovery following diebacks and may increase loss of sediment C from disturbed seagrass meadows. In our case study, sediment C loss was offset temporally from seagrass shoot loss. At the inner sites, minimum shoot densities occurred in the year of the MHW (Figure 5), but sediment C stocks in the upper five cm declined over the 2 years following the MHW (Figure 6). Re-accumulation of sediment C did not occur until 2018, 3 years after disturbance. Cooler conditions, and no MHW, during June of the years following the dieback provided conditions to support seagrass recovery (Berger et al., 2020), likely contributing to sediment C retention and eventual re-accumulation. Repeated disturbance from MHWs in successive years, or within the same year, would likely have disrupted the shoot recovery and delayed or prevented the preservation and re-accumulation of C stocks. Seagrass populations near the thermal boundary of their geographic range will be most vulnerable to future temperature stress (Short et al., 2016); blue C stocks in these areas, including the Z. marina meadows in coastal Virginia, are therefore at greater risk of disturbance and C loss. Climate change projections suggest that the southern range limit of Z. marina may shift northward by 1.4–6.5 degrees of latitude by 2100 (Wilson and Lotze, 2019), potentially leading to loss of the Virginia coastal meadows and total exposure of the C stocks over time.
At the landscape scale, seagrass resilience to MHW disturbance, including both resistance and recovery, is a function of many environmental parameters. In particular, interactions between multiple stressors, including temperature, turbidity, and sulfide intrusion, can limit recovery (Lefcheck et al., 2017), as was the case in Shark Bay, Australia (Kendrick et al., 2019). The effects of interacting stressors are likely to become more pronounced under a changing climate, but management that minimizes non-temperature stressors can increase seagrass resilience and thereby protect seagrass blue C stocks. Regulations aimed at improving water quality have supported the recovery of seagrass in Chesapeake Bay, VA (Lefcheck et al., 2018) and have helped to stabilize seagrass area in Europe (de los Santos et al., 2019). In South Bay, long-term monitoring has shown consistently high water quality over the last 20 years (McGlathery and Christian, 2020); these favorable conditions likely benefited the seagrass recovery in South Bay, leading to the retention of sediment C in most areas of the meadow. Persistence of seagrass blue C stocks, along with the other services provided by seagrass meadows, will require maintaining these favorable environmental conditions.
Understanding the potential for climate change mitigation through restoration of blue C ecosystems requires knowledge of the stability of blue C stocks. Carbon offset credits may provide an avenue to finance seagrass restoration; voluntary credits are now available under a seagrass offset-credit accounting framework administered by Verra (formerly the Verified Carbon Standard Program). Assigning credits under this framework requires knowledge of the net carbon offset that a seagrass restoration project can generate over the project period, typically 30 years (Needelman et al., 2018; Oreska et al., 2020). As we show here, short-term disturbances can interrupt restoration trajectories, potentially altering the net carbon offset through time. Long-term monitoring is therefore critical to understand seagrass sediment C dynamics, and managers should not necessarily expect continuous seagrass blue C accumulation throughout a restored meadow over multi-decadal timescales. Unfortunately, seagrass restoration projects are typically monitored for 12 months or less (van Katwijk et al., 2016). Additional empirical and longitudinal studies are needed to document the impact of disturbance on seagrass C stocks and to better understand the persistence of seagrass blue C through time.
With increasing pressures on ocean ecosystems from climate change and other anthropogenic stressors, a narrow window exists to rebuild resilient and sustainable coastal habitats, including seagrass meadows (Duarte et al., 2020). Given the long time horizon for seagrass restoration success, projects started now will take at least a decade to realize their potential, and as MHWs become more prominent in the future ocean, seagrass C stocks will be more vulnerable to disturbance. Greater understanding of the landscape-scale drivers of blue C persistence is urgently needed to inform habitat suitability and risk assessments. Large-scale restoration projects, such as at this study site, are key to these efforts, and they can also provide compelling examples of restoration success. This study site is part of a hugely successful seagrass restoration project, with a total area of more than 36 km2 as of 2018 (Orth et al., 2020). Despite the localized loss of C resulting from the 2015 MHW disturbance, these restored meadows continue to expand, accumulate sediment C, and provide many additional benefits to water quality and biodiversity. Against the backdrop of accelerating climate change, large-scale and long-term restoration projects are needed more than ever to maximize the benefits of blue C sequestration in seagrass meadows.
Data Availability Statement
The raw data supporting the conclusions of this article will be made available by the authors, without undue reservation.
Author Contributions
LA collected and analyzed data, led data interpretation, and drafted and revised the manuscript. KM, MO, and AB collected data, contributed to data interpretation, and commented on the manuscript. PW analyzed data, contributed to data interpretation, and commented on the manuscript. PB contributed to data interpretation and commented on the manuscript. RO collected data and commented on the manuscript. All authors contributed to the article and approved the submitted version.
Funding
This work was funded by the National Science Foundation grants DEB-1237733 and DEB-1832221 to the Virginia Coast Reserve Long-Term Ecological Research project. This is Contribution 3980 of the Virginia Institute of Marine Science, William & Mary.
Conflict of Interest
The authors declare that the research was conducted in the absence of any commercial or financial relationships that could be construed as a potential conflict of interest.
Acknowledgments
We thank the staff and volunteers at the University of Virginia’s Coastal Research Center for their contributions to the long-term monitoring of the seagrass restoration and two reviewers for constructive comments.
Footnotes
- ^ www.vcrlter.virginia.edu
- ^ https://marine.rutgers.edu/cool/sat_data/
- ^ http://web.vims.edu/bio/sav/
References
Aoki, L., and McGlathery, K. (2018). Restoration enhances denitrification and DNRA in subsurface sediments of Zostera marina seagrass meadows. Mar. Ecol. Prog. Ser. 602, 87–102. doi: 10.3354/meps12678
Arias-Ortiz, A., Serrano, O., Masqué, P., Lavery, P. S., Mueller, U., Kendrick, G. A., et al. (2018). A marine heatwave drives massive losses from the world’s largest seagrass carbon stocks. Nat. Clim. Change 8, 338–344. doi: 10.1038/s41558-018-0096-y
Belshe, E. F., Mateo, M. A., Gillis, L., Zimmer, M., and Teichberg, M. (2017). Muddy waters: unintentional consequences of blue carbon research obscure our understanding of organic carbon dynamics in seagrass ecosystems. Front. Mar. Sci. 4:125. doi: 10.3389/fmars.2017.00125
Berger, A. C., Berg, P., McGlathery, K. J., and Delgard, M. L. (2020). Long-term trends and resilience of seagrass metabolism: a decadal aquatic eddy covariance study. Limnol. Oceanogr. 65, 1423–1438.
de Boer, W. F. (2007). Seagrass–sediment interactions, positive feedbacks and critical thresholds for occurrence: a review. Hydrobiologia 591, 5–24. doi: 10.1007/s10750-007-0780-9
de los Santos, C. B., Krause-Jensen, D., Alcoverro, T., Marbà, N., Duarte, C. M., van Katwijk, M. M., et al. (2019). Recent trend reversal for declining European seagrass meadows. Nat. Commun. 10:3356.
Duarte, C. M., Agusti, S., Barbier, E., Britten, G. L., Castilla, J. C., Gattuso, J.-P., et al. (2020). Rebuilding marine life. Nature 580, 39–51.
Duarte, C. M., Losada, I. J., Hendriks, I. E., Mazarrasa, I., and Marbà, N. (2013). The role of coastal plant communities for climate change mitigation and adaptation. Nat. Clim. Change 3, 961–968. doi: 10.1038/nclimate1970
Emmer, I., Needleman, B., Emmett-Maddox, S., Crooks, S., Megonigal, P., Myers, D., et al. (2015). Methodology for Tidal Wetland and Seagrass Restoration VM0033 Version 1.0 Verified Carbon Standard. Washington, D.C: Verra.
Ewers Lewis, C. J., Carnell, P. E., Sanderman, J., Baldock, J. A., and Macreadie, P. I. (2018). Variability and vulnerability of coastal ‘blue carbon’ stocks: a case study from southeast Australia. Ecosystems 21, 263–279. doi: 10.1007/s10021-017-0150-z
Fagherazzi, S., and Wiberg, P. L. (2009). Importance of wind conditions, fetch, and water levels on wave-generated shear stresses in shallow intertidal basins. J. Geophys. Res. 114:F03022.
Fourqurean, J. W., Duarte, C. M., Kennedy, H., Marbà, N., Holmer, M., Mateo, M. A., et al. (2012). Seagrass ecosystems as a globally significant carbon stock. Nat. Geosci. 5, 505–509. doi: 10.1038/ngeo1477
Fraser, M. W., Kendrick, G. A., Statton, J., Hovey, R. K., Zavala-Perez, A., and Walker, D. I. (2014). Extreme climate events lower resilience of foundation seagrass at edge of biogeographical range. J. Ecol. 102, 1528–1536. doi: 10.1111/1365-2745.12300
Greening, H., and Janicki, A. (2006). Toward Reversal of eutrophic conditions in a subtropical estuary: water quality and seagrass response to nitrogen loading reductions in tampa bay. Florida, USA. Environ. Manage. 38, 163–178. doi: 10.1007/s00267-005-0079-4
Greiner, J. T., McGlathery, K. J., Gunnell, J., and McKee, B. A. (2013). Seagrass restoration enhances “blue carbon” sequestration in coastal waters. PLoS One 8:e72469. doi: 10.1371/journal.pone.0072469
Hansen, J. C. R., and Reidenbach, M. A. (2012). Wave and tidally driven flows in eelgrass beds and their effect on sediment suspension. Mar. Ecol. Prog. Ser. 448, 271–287. doi: 10.3354/meps09225
Hobday, A. J., Alexander, L. V., Perkins, S. E., Smale, D. A., Straub, S. C., Oliver, E. C. J., et al. (2016). A hierarchical approach to defining marine heatwaves. Prog. Oceanogr. 141, 227–238. doi: 10.1016/j.pocean.2015.12.014
Holling, C. S. (1973). Resilience and Stability of Ecological Systems. Annu. Rev. Ecol. Syst. 4, 1–23. doi: 10.1007/978-3-030-54560-4_1
Holmer, M., and Kendrick, G. A. (2013). High sulfide intrusion in five temperate seagrasses growing under contrasting sediment conditions. Estuaries Coasts 36, 116–126. doi: 10.1007/s12237-012-9550-7
Hothorn, T., Bretz, F., and Westfall, P. (2008). Simultaneous inference in general parametric models. Biom J. 50, 346–363. doi: 10.1002/bimj.200810425
Howard, J., Sutton-Grier, A., Herr, D., Kleypas, J., Landis, E., Mcleod, E., et al. (2017). Clarifying the role of coastal and marine systems in climate mitigation. Front. Ecol. Environ. 15:42–50. doi: 10.1002/fee.1451
Kendrick, G. A., Nowicki, R. J., Olsen, Y. S., Strydom, S., Fraser, M. W., Sinclair, E. A., et al. (2019). A systematic review of how multiple stressors from an extreme event drove ecosystem-wide loss of resilience in an iconic seagrass community. Front. Mar. Sci. 6:455. doi: 10.3389/fmars.2019.00455
Lefcheck, J. S., Orth, R. J., Dennison, W. C., Wilcox, D. J., Murphy, R. R., Keisman, J., et al. (2018). Long-term nutrient reductions lead to the unprecedented recovery of a temperate coastal region. Proc. Natl. Acad. Sci. U.S.A. 115, 201715798.
Lefcheck, J. S., Wilcox, D. J., Murphy, R. R., Marion, S. R., and Orth, R. J. (2017). Multiple stressors threaten the imperiled coastal foundation species eelgrass (Zostera marina) in Chesapeake Bay, USA. Glob. Change Biol. 23, 3474– 3483.
Levin, S. A., and Lubchenco, J. (2008). Resilience, robustness, and marine ecosystem-based management. BioScience 58, 27–32. doi: 10.1641/b580107
Liu, S., Trevathan-Tackett, S. M., Ewers Lewis, C. J., Huang, X., and Macreadie, P. I. (2020). Macroalgal blooms trigger the breakdown of seagrass blue carbon. Environ. Sci. Technol. 54:22.
Macreadie, P. I., Trevathan-Tackett, S. M., Skilbeck, C. G., Sanderman, J., Curlevski, N., Jacobsen, G., et al. (2015). Losses and recovery of organic carbon from a seagrass ecosystem following disturbance. Proc. R Soc. B Biol. Sci. 282:20151537. doi: 10.1098/rspb.2015.1537
Marbà, N., Arias-Ortiz, A., Masqué, P., Kendrick, G. A., Mazarrasa, I., Bastyan, G. R., et al. (2015). Impact of seagrass loss and subsequent revegetation on carbon sequestration and stocks. J. Ecol. 103, 296–302. doi: 10.1111/1365-2745.12370
Marbà, N., and Duarte, C. M. (2009). Mediterranean warming triggers seagrass (Posidonia oceanica) shoot mortality. Glob Change Biol. 16, 2366–2375. doi: 10.1111/j.1365-2486.2009.02130.x
McGlathery, K. J., and Christian, R. (2020). Water quality sampling – integrated measurements for the Virginia Coast, 1992–2019 ver 14. Environ. Data Initiative doi: 10.6073/pasta/db7f8fe720ddfcdfab1352adc9c22702 (Accessed December 17, 2020).
McGlathery, K. J., Reynolds, L. K., Cole, L. W., Orth, R. J., Marion, S. R., and Schwarzschild, A. (2012). Recovery trajectories during state change from bare sediment to eelgrass dominance. Mar. Ecol. Prog. Ser. 448, 209–221. doi: 10.3354/meps09574
Mcleod, E., Chmura, G. L., Bouillon, S., Salm, R., Björk, M., Duarte, C. M., et al. (2011). A blueprint for blue carbon: toward an improved understanding of the role of vegetated coastal habitats in sequestering CO2. Front. Ecol. Environ. 9:552–560. doi: 10.1890/110004
Moore, K. A., and Jarvis, J. C. (2008). Environmental factors affecting recent summertime eelgrass diebacks in the lower chesapeake bay: implications for long-term persistence. J. Coast Res. 10055, 135–147. doi: 10.2112/si55-014
Needelman, B. A., Emmer, I. M., Emmett-Mattox, S., Crooks, S., Megonigal, J. P., Myers, D., et al. (2018). The science and policy of the verified carbon standard methodology for tidal wetland and seagrass restoration. Estuaries Coasts 41, 2159–2171. doi: 10.1007/s12237-018-0429-0
O’Brien, K. R., Waycott, M., Maxwell, P., Kendrick, G. A., Udy, J. W., Ferguson, A. J. P., et al. (2018). Seagrass ecosystem trajectory depends on the relative timescales of resistance, recovery and disturbance. Mar. Pollut. Bull. 134, 166–176. doi: 10.1016/j.marpolbul.2017.09.006
Oliver, E. C. J., Burrows, M. T., Donat, M. G., Sen Gupta, A., Alexander, L. V., Perkins-Kirkpatrick, S. E., et al. (2019). Projected marine heatwaves in the 21st century and the potential for ecological impact. Front. Mar. Sci. 6:734. doi: 10.3389/fmars.2019.00734
Oliver, E. C. J., Donat, M. G., Burrows, M. T., Moore, P. J., Smale, D. A., Alexander, L. V., et al. (2018). Longer and more frequent marine heatwaves over the past century. Nat. Commun. 9:1324.
Oreska, M. P. J., McGlathery, K. J., Aoki, L. R., Berger, A. C., Berg, P., and Mullins, L. (2020). The greenhouse gas offset potential from seagrass restoration. Sci. Rep. 10:7325.
Oreska, M. P. J., McGlathery, K. J., and Porter, J. H. (2017). Seagrass blue carbon spatial patterns at the meadow-scale. PLoS One 12:e0176630. doi: 10.1371/journal.pone.0176630.t001
Orth, R. J., Carruthers, T. J. B., Dennison, W. C., Duarte, C. M., Fourqurean, J. W., Heck, K. L., et al. (2006). A global crisis for seagrass ecosystems. BioScience 56, 987–996.
Orth, R. J., Lefcheck, J. S., McGlathery, K. S., Aoki, L., Luckenbach, M. W., Moore, K. A., et al. (2020). Restoration of seagrass habitat leads to rapid recovery of coastal ecosystem services. Sci. Adv. 6:eabc6434. doi: 10.1126/sciadv.abc6434
Orth, R. J., Moore, K. A., Marion, S. R., Wilcox, D. J., and Parrish, D. B. (2012). Seed addition facilitates eelgrass recovery in a coastal bay system. Mar. Ecol. Prog. Ser. 448, 177–195. doi: 10.3354/meps09522
Pendleton, L., Donato, D. C., Murray, B. C., Crooks, S., Jenkins, W. A., Sifleet, S., et al. (2012). Estimating global “blue carbon” emissions from conversion and degradation of vegetated coastal ecosystems. PLoS One 7:e43542. doi: 10.1371/journal.pone.0043542
Pinheiro, J., Bates, D., DebRoy, S., and Sarkar, D. R Core Team. (2018). Nlme: Linear and Nonlinear Mixed Effects Models. https://CRAN.R-project.org/package=nlme
R Core Team (2018). R: A Language and Environment for Statistical Computing. Vienna: R Foundation for Statistical Computing.
Saderne, V., Geraldi, N. R., Macreadie, P. I., Maher, D. T., Middelburg, J. J., Serrano, O., et al. (2019). Role of carbonate burial in Blue Carbon budgets. Nat. Commun. 10:1106.
Salinas, C., Duarte, C. M., Lavery, P. S., Masque, P., Arias-Ortiz, A., Leon, J. X., et al. (2020). Seagrass losses since mid-20th century fuelled CO 2 emissions from soil carbon stocks. Glob. Change Biol. 26, 4772–4784.
Serrano, O., Ruhon, R., Lavery, P. S., Kendrick, G. A., Hickey, S., Masqué, P., et al. (2016). Impact of mooring activities on carbon stocks in seagrass meadows. Sci. Rep. 6:23193.
Short, F. T., Kosten, S., Morgan, P. A., Malone, S., and Moore, G. E. (2016). Impacts of climate change on submerged and emergent wetland plants. Aquat. Bot. 135, 3–17. doi: 10.1016/j.aquabot.2016.06.006
Smale, D. A., Wernberg, T., Oliver, E. C. J., Thomsen, M., Harvey, B. P., Straub, S. C., et al. (2019). Marine heatwaves threaten global biodiversity and the provision of ecosystem services. Nat. Clim. Change 9, 306–312.
Spivak, A. C., Sanderman, J., Bowen, J. L., Canuel, E. A., and Hopkinson, C. S. (2019). Global-change controls on soil-carbon accumulation and loss in coastal vegetated ecosystems. Nat. Geosci. 12, 685–692. doi: 10.1038/s41561-019-0435-2
Standish, R. J., Hobbs, R. J., Mayfield, M. M., Bestelmeyer, B. T., Suding, K. N., Battaglia, L. L., et al. (2014). Resilience in ecology: abstraction, distraction, or where the action is? Biol. Conserv. 177, 43–51. doi: 10.1016/j.biocon.2014.06.008
Thomson, J. A., Burkholder, D. A., Heithaus, M. R., Fourqurean, J. W., Fraser, M. W., Statton, J., et al. (2015). Extreme temperatures, foundation species, and abrupt ecosystem change: an example from an iconic seagrass ecosystem. Glob. Change Biol. 21, 1463–1474. doi: 10.1111/gcb.12694
United Nations Environment Programme [UNEP] (2020). Out of the Blue: The Value of Seagrassses to the Environment and to People. Nairobi: United Nations Environment Programme.
van Katwijk, M. M., Bos, A. R., Hermus, D. C. R., and Suykerbuyk, W. (2010). Sediment modification by seagrass beds: muddification and sandification induced by plant cover and environmental conditions. Estuar. Coast Shelf Sci. 89, 175–181. doi: 10.1016/j.ecss.2010.06.008
van Katwijk, M. M., Thorhaug, A., Marbà, N., Orth, R. J., Duarte, C. M., Kendrick, G. A., et al. (2016). Global analysis of seagrass restoration: the importance of large-scale planting. J. Appl. Ecol. 53, 567–578.
Waycott, M., Duarte, C. M., Carruthers, T. J., Orth, R. J., Dennison, W. C., Olyarnik, S., et al. (2009). Accelerating loss of seagrasses across the globe threatens coastal ecosystems. Proc. Natl. Acad. Sci. U.S.A. 106, 12377–12381.
Wilson, K., and Lotze, H. (2019). Climate change projections reveal range shifts of eelgrass Zostera marina in the Northwest Atlantic. Mar. Ecol. Prog. Ser. 620, 47–62. doi: 10.3354/meps12973
Keywords: Zostera marina, eelgrass, disturbance, marine heat wave, blue carbon, restoration, resilience, climate change
Citation: Aoki LR, McGlathery KJ, Wiberg PL, Oreska MPJ, Berger AC, Berg P and Orth RJ (2021) Seagrass Recovery Following Marine Heat Wave Influences Sediment Carbon Stocks. Front. Mar. Sci. 7:576784. doi: 10.3389/fmars.2020.576784
Received: 27 June 2020; Accepted: 08 December 2020;
Published: 07 January 2021.
Edited by:
Stelios Katsanevakis, University of the Aegean, GreeceReviewed by:
Jennifer Li Ruesink, University of Washington, United StatesKun-Seop Lee, Pusan National University, South Korea
Copyright © 2021 Aoki, McGlathery, Wiberg, Oreska, Berger, Berg and Orth. This is an open-access article distributed under the terms of the Creative Commons Attribution License (CC BY). The use, distribution or reproduction in other forums is permitted, provided the original author(s) and the copyright owner(s) are credited and that the original publication in this journal is cited, in accordance with accepted academic practice. No use, distribution or reproduction is permitted which does not comply with these terms.
*Correspondence: Lillian R. Aoki, lra53@cornell.edu
†Present address: Lillian R. Aoki, Department of Ecology and Evolutionary Biology, Cornell University, Ithaca, NY, United States