
. Introduction
One of the most important considerations for 14C dating by accelerator mass spectrometry (AMS) is the method of target preparation. Measurements precision is limited by the C- current obtainable from material in a Cs sputterion source (0.5−2μA). For high precision, it is necessary to fabricate targets from material such as graphite, which gives a high C- current (Jull et al., 1986). In the AMS technique of radiocarbon dating, the 14C concentration is measured in graphite, which is prepared from the carbon contained in the sample. Graphite is pressed into a tablet, which is used as a target in the Cs-sputtering ion source of the accelerator (Czernik and Goslar, 2001).
The whole process of the radiocarbon dating consists of sample preparation and measurement. The sample preparation includes mechanical and chemical processes of cleaning, combustion and graphitization. A new system for the preparation of graphite samples for radiocarbon (14C) measurement using AMS has been built in the Dendrochronological Laboratory at AGH-UST, Kraków. This system consists of three independent components. The first is the equipment for mechanical and chemical sample pre-treatment. The second is the vacuum line for sample sealing and purification of CO2. And, the third and central part of this system is graphitization line, where graphite is produced from CO2 (Krąpiec et al., 2018).
The cathodes produced in this system were measured at the Center for Applied Isotope Studies at the University of Georgia, and the results of these measurements were presented in this article.
. Samples and methods
Organic samples, such as charcoal and plant fragments are pre-treated with the AAA method (acid-alkali-acid), following standard protocols (e.g. Jull et al., 2006). In our laboratory, we treat samples with 2% HCl at 75°C, next rinsing with deionized H2O to a neutral pH. As the next step, we treat the samples with 1 M NaOH at 75°C and rinsing with deionized H2O to a neutral pH again. Finally, we treat the samples with 2% HCl at 75°C again and rinse with deionized H2O to a neutral pH. We then dry the prepared sample and it is ready for the next stage.
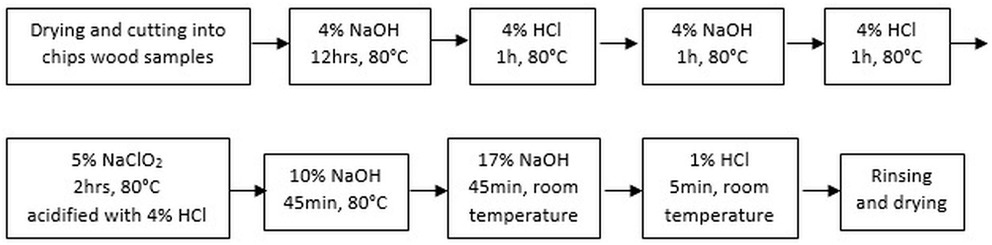
For wood samples, alpha cellulose extraction was performed since it is the most stable compound from plant material; therefore, the separation and utilization of this cellulose content is the most suitable for a 14C-age determination (Molnár et al., 2013). Lignin and hemicellulose, being components of wood, contain carbon that is easier to replace and is therefore not suitable for determining age (Nemec et al., 2010). The Green (1963) protocol was used to extract 𝛂-cellulose from wood. Additionally, this method was modified using an ultrasonic bath (Pazdur et al., 2005), and it used HCl instead of acetic acid to avoid any possible acetylation (Nemec et al., 2010) (Fig. 1).
IAEA and NIST OxII standard materials were converted to CO2 without pre-treatment. The background material (vitrinite) was prepared by AAA extraction to remove inorganic (carbonates) and organic components (fulvic and humic acid) (Krąpiec et al., 2018).
Samples were weighed and transferred to quartz ampoules, pre-baked at 850°C together with cupric oxide and silver wool. Thus, the prepared samples were flamesealed in evacuated quartz ampoules to a pressure of 10–5 mbar and combusted for 6 h at 900°C in a muffle oven. Resulting CO2 was released under vacuum and cryogenically separated from water in a glass vessel cooled in a dry ice/ethanol slurry (~177 K). Next, the purified CO2 was trapped in the glass valve cooled by liquid nitrogen and transferred to the reduction line (Czernik and Goslar, 2001) (Fig. 2b).
Fig 2
AMS graphitization system in the Dendrochronological Laboratory at AGH-UST, Kraków: a) Reduction line and vacuum line for sample sealing and purification of CO2; b) cryogenically separation CO2 from water in glass vessel cooled in a dry ice/ethanol slurry and trapping CO2 in the glass valve cooled by liquid nitrogen; c) shows the vacuum line for graphite preparation.
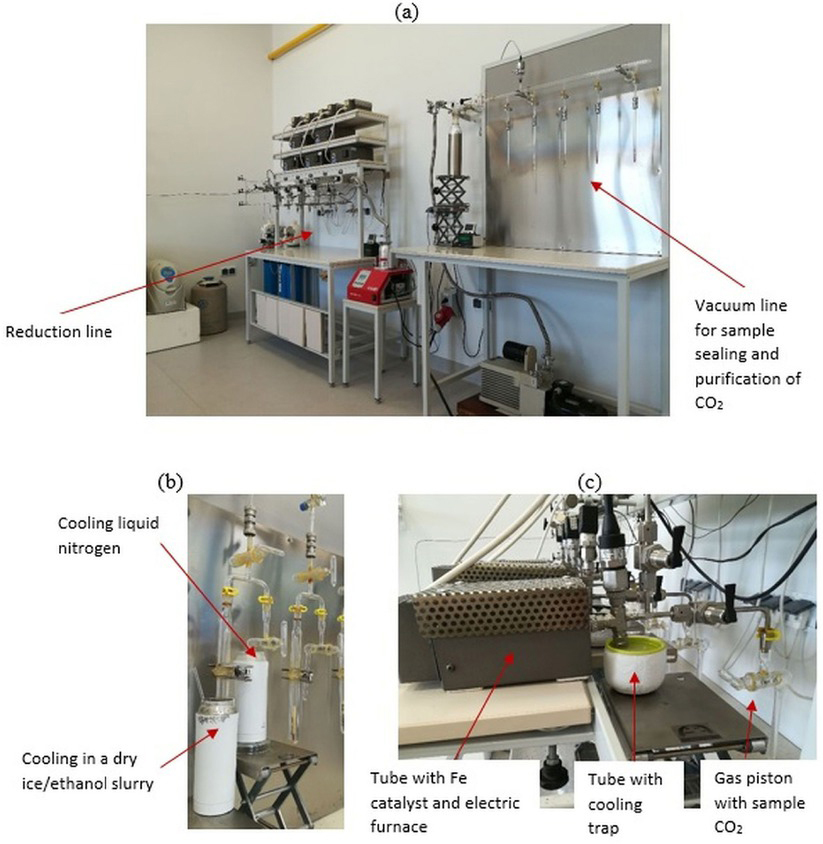
The reduction line consists of five ports (Fig. 2a). Each port is connected to a vacuum pump and contains manual valves for pressure control; a glass valve with sample CO2, a tube with a Fe catalyst and electric furnace and tube with cooling trap (Krąpiec et al., 2018). For CO2 reduction, we used ~200 mbar CO2, which corresponds to 1 mg of carbon. Graphite is produced during the reaction with H2 at 600°C, on 2 mg Fe as catalyst:
Before the reduction of CO2, the iron powder is oxidized for 15 min at 400°C and then reduced in H2 for 30 min at 400°C. During graphitization, for water separation, we used cooling trap from mixture of dry ice and alcohol (Goslar and Czernik 2000) (Fig. 2c). This is all monitored and controlled by manual pressure recordings at 5-min intervals. The cathodes produced in this system were measured at the Center for Applied Isotope Studies at the University of Georgia, USA (Labcode UGAMS; Cherkinsky et al., 2010).
. Results
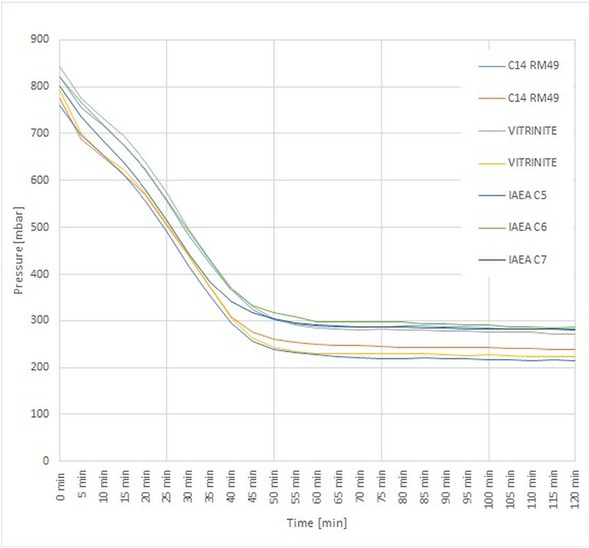
The graphitization process is monitored and controlled by manual pressure recordings at 5-min intervals. It shows that the graphitization process is completed after approximately 65 min (Fig. 3). According to the equation of efficiency (Osborne et al., 1994), the efficiency EFp is>95%.
The results of the previous measurements and details of our system and procedures are described by Krąpiec et al., (2018). This article presents the results of 49 samples, including 20 samples of NIST Ox-II, 21 background samples and eight samples of IAEA standards (three samples of IAEA C5, one sample of IAEA C6 and four samples of IAEA C7) (Table 1). These samples were used to test the performance of the system.
Table 1
The results of 14C AMS measurements of the samples prepared using the graphitization line in the Dendrochronological Laboratory at AGH-UST Krakow.
The relationship between the measured and expected values for all samples is presented in Table 2. For most of the samples, there are no significant differences between the measured values and the consensus values. An average value of samples NIST Ox-II of 134.05±0.17 pMC was obtained from 20 measurements and corresponds well with the expected value. The measurement of standards samples (IAEA C5, IAEA C6 and IAEA C7) also have very good results. An average value of samples IAEA C5 of 23.31±0.35 pMC was obtained from three measurements, of samples IAEA C6 of 149.44±0.44 pMC was obtained from one measurement and of samples IAEA C7 of 50.38±0.15 pMC was obtained from four measurements. Those results are satisfying and correspond rationally well to the consensus values.
Table 2
Relationship between measured and expected values.
The biggest scatter of results can be observed for the background samples (vitrinite), with an average value of 0.781±0.023 pMC that was obtained from 21 measurements. The average value of measured background is not bad, but the result is inflated by several samples. The measurements oscillating around ~ 0.350 pMC are acceptable and comparable with values reported by other laboratories (Krajcar-Bronić et al., 2010; Molnar et al., 2013). A few results are much higher (for example samples: WIT_13 – 1.020±0.016 pMC, WIT_7B – 1.410±0.060 pMC and WIT_9A – 1.385±0.081 pMC), which can probably be explained by leakage during sealing or by the graphitization of the samples (Krąpiec et al., 2018).
Another explanation may also be the contamination of samples during weighting or transferring. However, a relationship was noted between the weight of C (amount of CO2 used for reduction) and the measured value of 14C. If we used ~200 mbar CO2, which corresponds to 1 mg of carbon, it is easier to obtain the expected result. The lower the carbon content of the sample (the smaller the amount of CO2 used for reduction), the lower the accuracy of the results. For example, see samples WIT_15, WIT_15A and WIT_15B.
First sample (WIT_15): we used ~200 mbar carbon dioxide, which corresponds to 1 mg of carbon − result, 0.388±0.010 pMC (44 601±207 14C age years).
Second sample (WIT_15A): we used ~68 mbar carbon dioxide, which corresponds to 0.34 mg of carbon − result, 0.482±0.013 pMC (42 862±214 14C age years).
Third sample (WIT_15B): we used ~20 mbar carbon dioxide, which corresponds to 0.1 mg of carbon − result, 0.943±0.038 pMC (37 461±325 14C age years).
. Conclusions
The measurements conducted thus far provide evidence for the reliability of the AMS graphitization system in the Dendrochronological Laboratory at AGH-UST, Kraków. The results of measurements are satisfying and correspond rationally well to the consensus values. The tests conducted thus far show that a relationship was noted between the weight of C (amount of CO2 used for reduction) and the measured value of 14C. The small deviations are probably caused by leakage during sealing or the graphitization of the samples. Further tests are necessary to constantly improve the line and eliminate any contamination of samples.