
Automatic Subtyping of Individuals with Primary Progressive Aphasia
Abstract
Background:
The classification of patients with primary progressive aphasia (PPA) into variants is time-consuming, costly, and requires combined expertise by clinical neurologists, neuropsychologists, speech pathologists, and radiologists.
Objective:
The aim of the present study is to determine whether acoustic and linguistic variables provide accurate classification of PPA patients into one of three variants: nonfluent PPA, semantic PPA, and logopenic PPA.
Methods:
In this paper, we present a machine learning model based on deep neural networks (DNN) for the subtyping of patients with PPA into three main variants, using combined acoustic and linguistic information elicited automatically via acoustic and linguistic analysis. The performance of the DNN was compared to the classification accuracy of Random Forests, Support Vector Machines, and Decision Trees, as well as to expert clinicians’ classifications.
Results:
The DNN model outperformed the other machine learning models as well as expert clinicians’ classifications with 80% classification accuracy. Importantly, 90% of patients with nfvPPA and 95% of patients with lvPPA was identified correctly, providing reliable subtyping of these patients into their corresponding PPA variants.
Conclusion:
We show that the combined speech and language markers from connected speech productions can inform variant subtyping in patients with PPA. The end-to-end automated machine learning approach we present can enable clinicians and researchers to provide an easy, quick, and inexpensive classification of patients with PPA.
INTRODUCTION
Primary progressive aphasia (PPA) is a progressive neurological condition that is characterized by a gradual deterioration of speech and language. In patients with PPA, there is substantial symptom variability as a result of neurodegeneration affecting different brain areas. In an organized attempt to categorize speech and language deficits in patients with PPA, a team of experts put forth specific guidelines in a consensus paper for the classification of patients with PPA into three main variants: nonfluent variant PPA (nfvPPA), semantic variant PPA (svPPA), and logopenic variant PPA (lvPPA) [1]. Patients with nfvPPA are characterized by effortful speech with sound errors and distortions and impaired comprehension and produ-ction of syntactically complex sentences. Patients with svPPA are characterized by difficulties in confrontation naming, single-word comprehension, and impaired semantic memory of familiar objects that often results in ‘empty speech’ (i.e., output without meaning). Patients with lvPPA are characterized by difficulties in word retrieval, repetition of long words and phrases, and phonological errors.
Since patients with the same PPA variant share co-mmon linguistic deficits, PPA variants can inform the type of language therapy provided, such as targeting word retrieval, sentence formulation strategies, and addressing oral apraxia. However, the task of subtyping patients with PPA into variants is time consu-ming, arduous, and requires combining evaluations by clinical neurologists, neuropsychologists, speech pathologists, and radiologists. As insurance companies typically cover only limited therapy sessions, and the condition is progressive, the decision about the type of variant must be made quickly. Therefore, there is a dire need for an easy, quick, and accurate evaluation, consistent with the established criteria and sensitive to the speech and language deficits associated with each variant. An automatic evaluation system based on machine learning has the potential to save clinicians time and provide important information with respect to a patient’s PPA variant, that could guide clinical treatment, as shown in our main trial results [2].
This study presents a machine learning model based on Deep Artificial Neural Networks (DNNs) that can subtype patients with PPA into variants with high classification accuracy. This automated approach offers diagnosis tailored to specific individuals, using information from connected speech productions elicited from a picture description task—a naturalistic task that takes fewer than two minutes and it can be easy to administer, e.g., in the form of a mobile phone or web application. The model has two main advantages. First, information about the PPA variant of a patient can enable clinicians to make better decisions about tests and therapy batteries that can elicit optimal therapy results for individuals with PPA. Thus, knowledge about the PPA variant will enable assessment and treatment that is tailored to the specific individual with PPA [3]. Second, the correct diagnosis would be crucial for a probabilistic pathological diagnosis, which can complement clinical diagnosis. By quantifying the PPA variant classification, clinicians can share knowledge about successful treatment solutions that target specific subpopulations of individuals with PPA, which can be comparable across individuals and clinics.
The machine learning model employs information from connected speech productions, which are readily available through a simple picture description task [4]. Connected speech can convey a striking amount of information about PPA variants. It can inform patterns of articulation (e.g., vowel production), prosody, and grammar (e.g., morphology and syntax). Using parts of speech features earlier studies were able to develop machine learning models for classifying patients with different types of dementia [5–7]. For example, earlier studies showed that the relative vowel duration from a polysyllabic word repetition task can distinguish patients with nfvPPA and lvPPA [8]. Independent evidence on the role of vowels in PPA-variant classification comes from studies of paraphasias [9] and from cross-sectional studies accompanied by lesion-symptom mapping [10]. Patients with svPPA use more pronouns than no-uns [5]. Patients with nfvPPA are characterized by impaired production of grammatical words, such as articles, pronouns, etc., but have fewer difficulties using words with lexical content than individuals with svPPA [1]. The use of linguistic features has also been shown to distinguish patients with nfvPPA from AD and healthy individuals [6]. Other measures that can be elicited from connected speech, such as the noun-verb ratio can reveal whether an individual with PPA shows preference towards nouns or verbs; this information may help to subtype nfvPPA from patients with svPPA [5, 6]. Similarly, as patients with svPPA are impaired in noun naming, the noun-pronoun ratio can distinguish patients with svPPA from patients with another variant [5].
The aim of this study is twofold: 1) to provide a machine learning model that can automatically subtype PPA and offer diagnosis tailored to specific ind-ividuals, using information from connected speech productions elicited by a simple picture description task that takes fewer than two minutes to administer, and 2) to contribute to our current understanding of PPA variants and their differences in speech and language characteristics.
MATERIALS AND METHODS
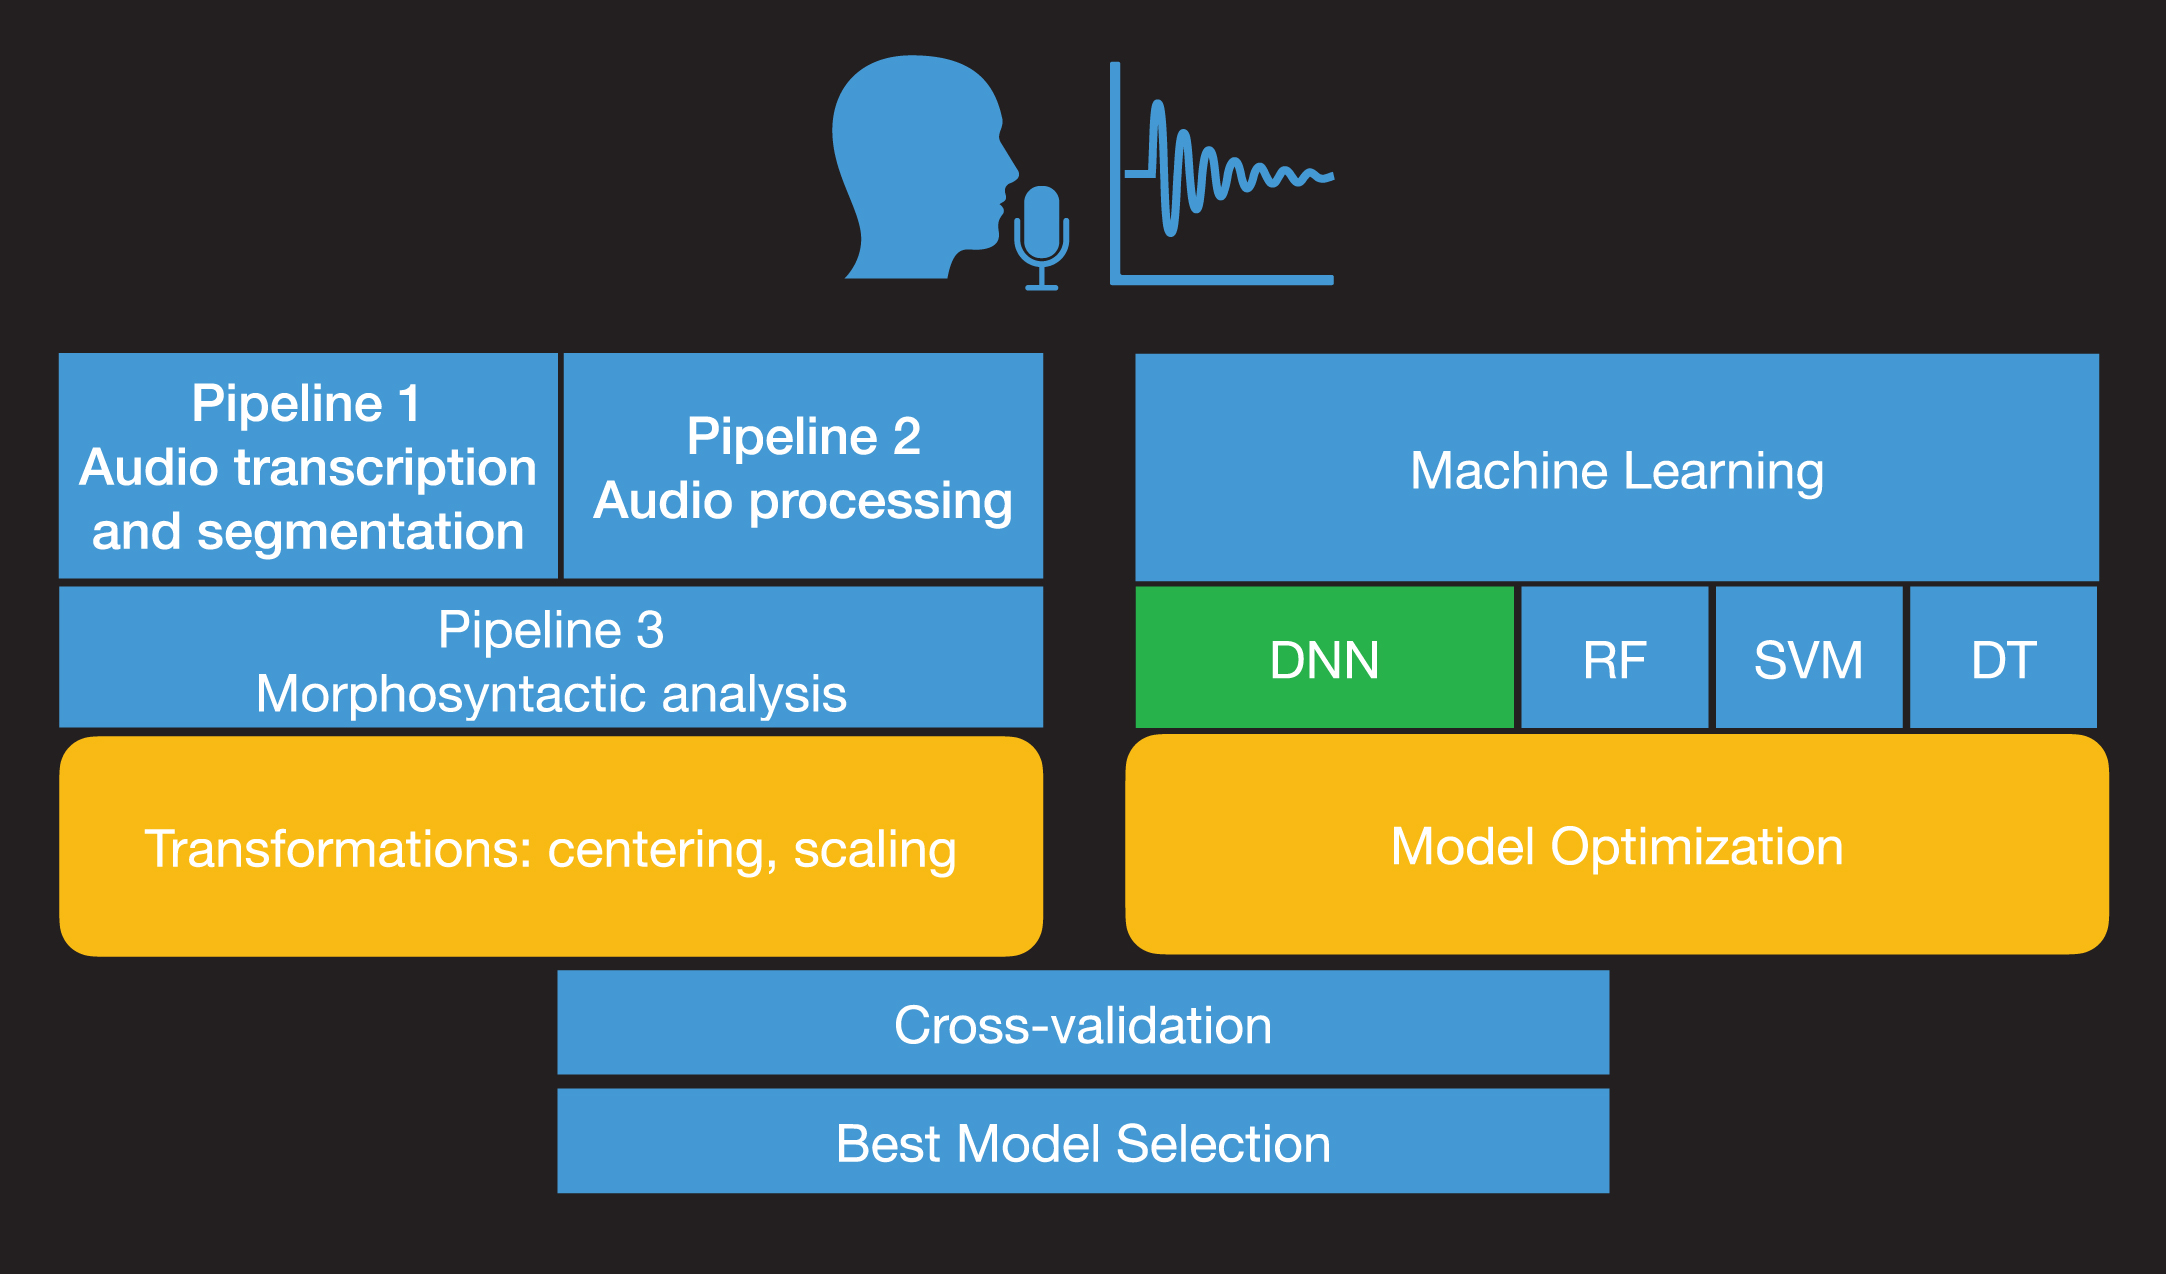
Fig 1 shows a process diagram that illustrates the process for subtyping of patients with PPA into variants from speech recordings. We employed data from connected speech productions via a simple and widely used picture description task: the Cookie Theft description from the Boston Diagnostic Aphasia Examination [11]. The task was administered to participants with PPA as part of a large clinical trial (NCT:02606422) during baseline evaluation sessions. Picture description productions were automatically transcribed and segmented into words, vowels, and consonants. Acoustic features were then extracted from vowel productions. We have excluded consonants, as they require a different type of feature analysis depending on their manner of articulation (stops, fricatives, sonorants, etc.) and may have an additional computational cost (e.g., dimensionality, longer processing and extraction). The whole text from transcribed picture descriptions of participants with PPA was analyzed using automatic morphosyntactic analysis that provides the part of speech (POS) for each word in the text. Acoustic and linguistic mea-surements were combined to provide the predictors for the machine learning analysis. To achieve the sub-typing of PPA variants, we developed DNN architectures that were trained on the combined set of acoustic and linguistic measurements. Results for the model comparison of DNNs with Support Vector Machines (SVMs) [12], Random Forests (RF) [13, 14], and Decision Trees (DTs) are also reported as these are often used in medical studies [15]. The methodology part details the complex procedure of designing and evaluating an end-to-end machine learning model based on neural networks. However, we need to stress out that this process is conducted only once. The potential users of the model, speech/language therapists, clinicians, etc. will not need to train or evaluate the machine learning model again but by uploading a recording of the cookie-theft picture description into the system, the model will provide the PPA variant automatically.
Fig. 1
Process diagram of model development. The audio recordings from the picture description task are automatically analyzed acoustically and transcribed (Pipeline 1). Then, formant frequencies, the duration of vowels, tonal measures, pauses, and voice quality measurements are estimated from the processed recordings (Pipeline 2). The ratio of characters, words, characters per word and the noun-verb ratio, noun-adjective ratio, noun-adverb ratio, noun-pronoun ratio, verb-adjective ratio, verb-adverb ratio, verb-pronoun ratio, adjective-adverb ratio, adjective-pronoun ratio, and adverb-pronoun ratio are estimated from the analyzed text transcripts (Pipeline 3). The model optimization and parameter tuning are followed by model comparison and evaluation with cross-validation.
Data collection
Trained clinicians or clinician assistants recorded 44 individuals with PPA during baseline evaluation sessions (Table 1). All participants had a diagnosis of PPA from an experienced neurologist, a history of at least two years of progressive language deficits with no other etiology (e.g., stroke, tumors, etc.). Participants were also right-handed and native speakers of English. Differential diagnosis and subtyping of patients with PPA was conducted by experienced neurologists based on magnetic resonance imaging (MRI) results, clinical and neuropsychological examination, and speech and language evaluations following the consensus criteria by Gorno-Tempini et al. [1].
Table 1
Demographic information of the participants for each PPA variant (for age, education, onset of the condition in years, language severity, and total severity, the mean and the standard deviation in parenthesis is provided; language severity and total severity correspond to the Behavior-Comportment-Personality and Language domains of the FTLD-CDR [16]
| Variant | svPPA | lvPPA | nfvPPA |
| Female | 5 | 8 | 7 |
| Male | 4 | 8 | 12 |
| Total patients | 9 | 16 | 19 |
| Age | 66.59 (6.06) | 67.93 (7.55) | 69.07 (5.57) |
| Education | 16.30 (1.92) | 16.92 (2.24) | 16.42 (1.37) |
| Onset years | 6.48 (2.31) | 3.88 (3.23) | 3.49 (1.80) |
| Language severity | 2.27 (0.56) | 1.39 (0.75) | 1.77 (0.48) |
| Total severity | 7.75 (4.36) | 4.98 (2.82) | 6.04 (3.10) |
| Total words | 1265 | 2529 | 826 |
| Mean number of words | 84(57) | 141(133) | 75(52) |
Specifically, 9 participants were subtyped as svPPA, 16 as lvPPA, and 19 as nfvPPA. Table 1 provides biographical demographic information of the partici-pants for each PPA variant. Kruskal-Wallis chi square tests showed that there were no significant diffe-rences between variants for word produced by gender (χ2(2)=4.571, p = 0.101), age (χ2(2)=0.52, p = 0.77) education (χ2(2)=0.11393, p = 0.945), lan-guage severity (χ2(2)=0.441, p = 0.802), total severity (χ2(2)=1.771, p = 0.413), and number of words (χ2(2)=1.97, p = 0.373). We used the revised Frontotemporal Dementia Clinical Dementia Rating (FTD-CDR) scale to rate severity of PPA [16]. Severity was calculated by three independent raters who scored each item for each participant based on face-to-face interaction with the participant and family, along with language and cognitive evaluations. Total severity and language severity scores were the result of the consensus between the three raters. Data collection was conducted as part of a clinical trial on Transcranial Direct Current Stimulation for Primary Progressive Aphasia at Johns Hopkins University (NCT:02606422). All participants provided informed consent.
Data preprocessing
Recordings from the Cookie Theft picture description task were saved in mono waveform audio file format (wav files) at a 16000 Hz sampling frequency. The following three preprocessing pipelines were developed to analyze the acoustic and linguistic properties and generate the classification data.
Pipeline 1: Audio transcription and segmentation
The sounds were processed using Themis, a python program developed in-house that provides a text file with the audio transcription of each word and segment—vowel, consonant, pause—and a table that contains the times (onset time and offset time) of each word and segment [5, 17]. The table was converted into Praat TextGrid files for processing in Praat automatically [18] pause duration was calculated during segmentation from the automatic alignment system.
Pipeline 2: Audio processing
A second pipeline in Praat, a software for speech analysis, enabled the extraction of acoustic information for the segmented vowels. Specifically, the following acoustic properties were measured:
i. Vowel formants. Formant frequencies from first formant frequency to the fifth formant frequency were measured at the 25%, 50%, and 75% mark of vowel duration.
ii. Vowel duration. Vowel duration was measured from the onset to the offset of the first and second formant frequencies.
iii. Fundamental frequency. (F0). We calculated the mean F0, minimum F0, and maximum F0 for each vowel production. F0 calculation was conducted using the autocorrelation method.
iv. H1–H2, H1–A1, H1–A2, H1–A3. Harmonic and spectral amplitude measures were extracted from the vowels using Praat.
Overall, we employed the following 40 predict-ors: vowel duration, pause duration, and the first five formant frequencies measured at three locations inside the vowel at the 25%, 50%, and 75% of the vowel duration, voice quality features (H1-H2, H1-A1, H1-A2, H1-A3), measures of F0 (Minimum F0, Mean F0, Maximum F0), and POS ratios and means (noun/verb ratio, noun/adjective ratio, noun/adverb ratio, noun/pronoun ratio, verb/adjective ra-tio, verb/adverb ratio, verb/pronoun ratio, adjective/adverb ratio, adjective/pronoun ratio, adverb/pro-noun ratio, mean noun, mean pronoun, mean verbs, mean adjective, mean adverb).
Pipeline 3: Morphosyntactic analysis
A third pipeline processed transcripts morphosyntactically. It conducted an automatic morphosyntactic analysis using the TextBlob python library [19]. Measurements of characters, words, characters per word, etc., were calculated from the tokenized and parsed output, and the ratio of each part of speech per total number of words and the ratio between two part of speech categories, i.e., the noun-verb ra-tio, noun-adjective ratio, noun-adverb ratio, noun-pronoun ratio, verb-adjective ratio, verb-adverb ratio, verb-pronoun ratio, adjective-adverb ratio, adj-ective-pronoun ratio, and adverb-pronoun ratio were calculated. The outputs of the three pipelines were combined into a single comma-separated values (CSV) file, which consisted of 25,413 data series and was employed as an input for the machine learning models.
Neural network architecture
This section provides a description of the architecture of the neural network and the design of the system. Providing the appropriate details on the archi-tecture and implementation of neural networks nec-essitates some use of jargon to allow the comparison of our approach to other modeling work. We limit the use of such jargon to the paragraphs that follow and cite the necessary related works that clarify this technical jargon.
The data were randomized and transformed using Standard Scaling, which standardizes measurements by removing the mean and scaling to unit variance using (1):
(1)
where μ is the mean of the training samples; σ is the standard deviation of the training samples. Standard scaling was conducted using the StandardScaler function from scikit-learn [20]. Note that we do not conduct Standard Scaling on the whole dataset at once but in two phases. The scaling model is fitted on the training data. Then, the fitted model is used to transform the training and test sets separately to ensure that there is no information (such as effects on the total mean and standard deviation) from the test set on the training set. This can occur when data are transformed using information from the test and training set combined.
Fig 2 shows the design of the neural network employed in this study. It is a feed-forward neural network (DNN), that conducts multiclass classification. This type of neural network processes data sequentially from the input layer, which is the first layer of the model, to the hidden layers, which are the intermediate layers of the model. It is designed for a multiclass classification as the output classes of the network are three, namely the three PPA variants (an alternative type is the binary classification).
Fig. 2
Neural network architecture. Structure of the neural network designed for the study and feature properties, including the number of input features employed, the type and number of units and activation functions for the input, hidden, and output layer. The first layer on top is the input layer and consists of 350 units; 8 layers in the middle containing 350 units are hidden layers, and the final layer contains only three units; here with different colors, when the green is activated it corresponds to the svPPA variant, when the red is activated it corresponds to the lvPPA variant, and when the yellow unit is activated it corresponds to the nfvPPA variant.
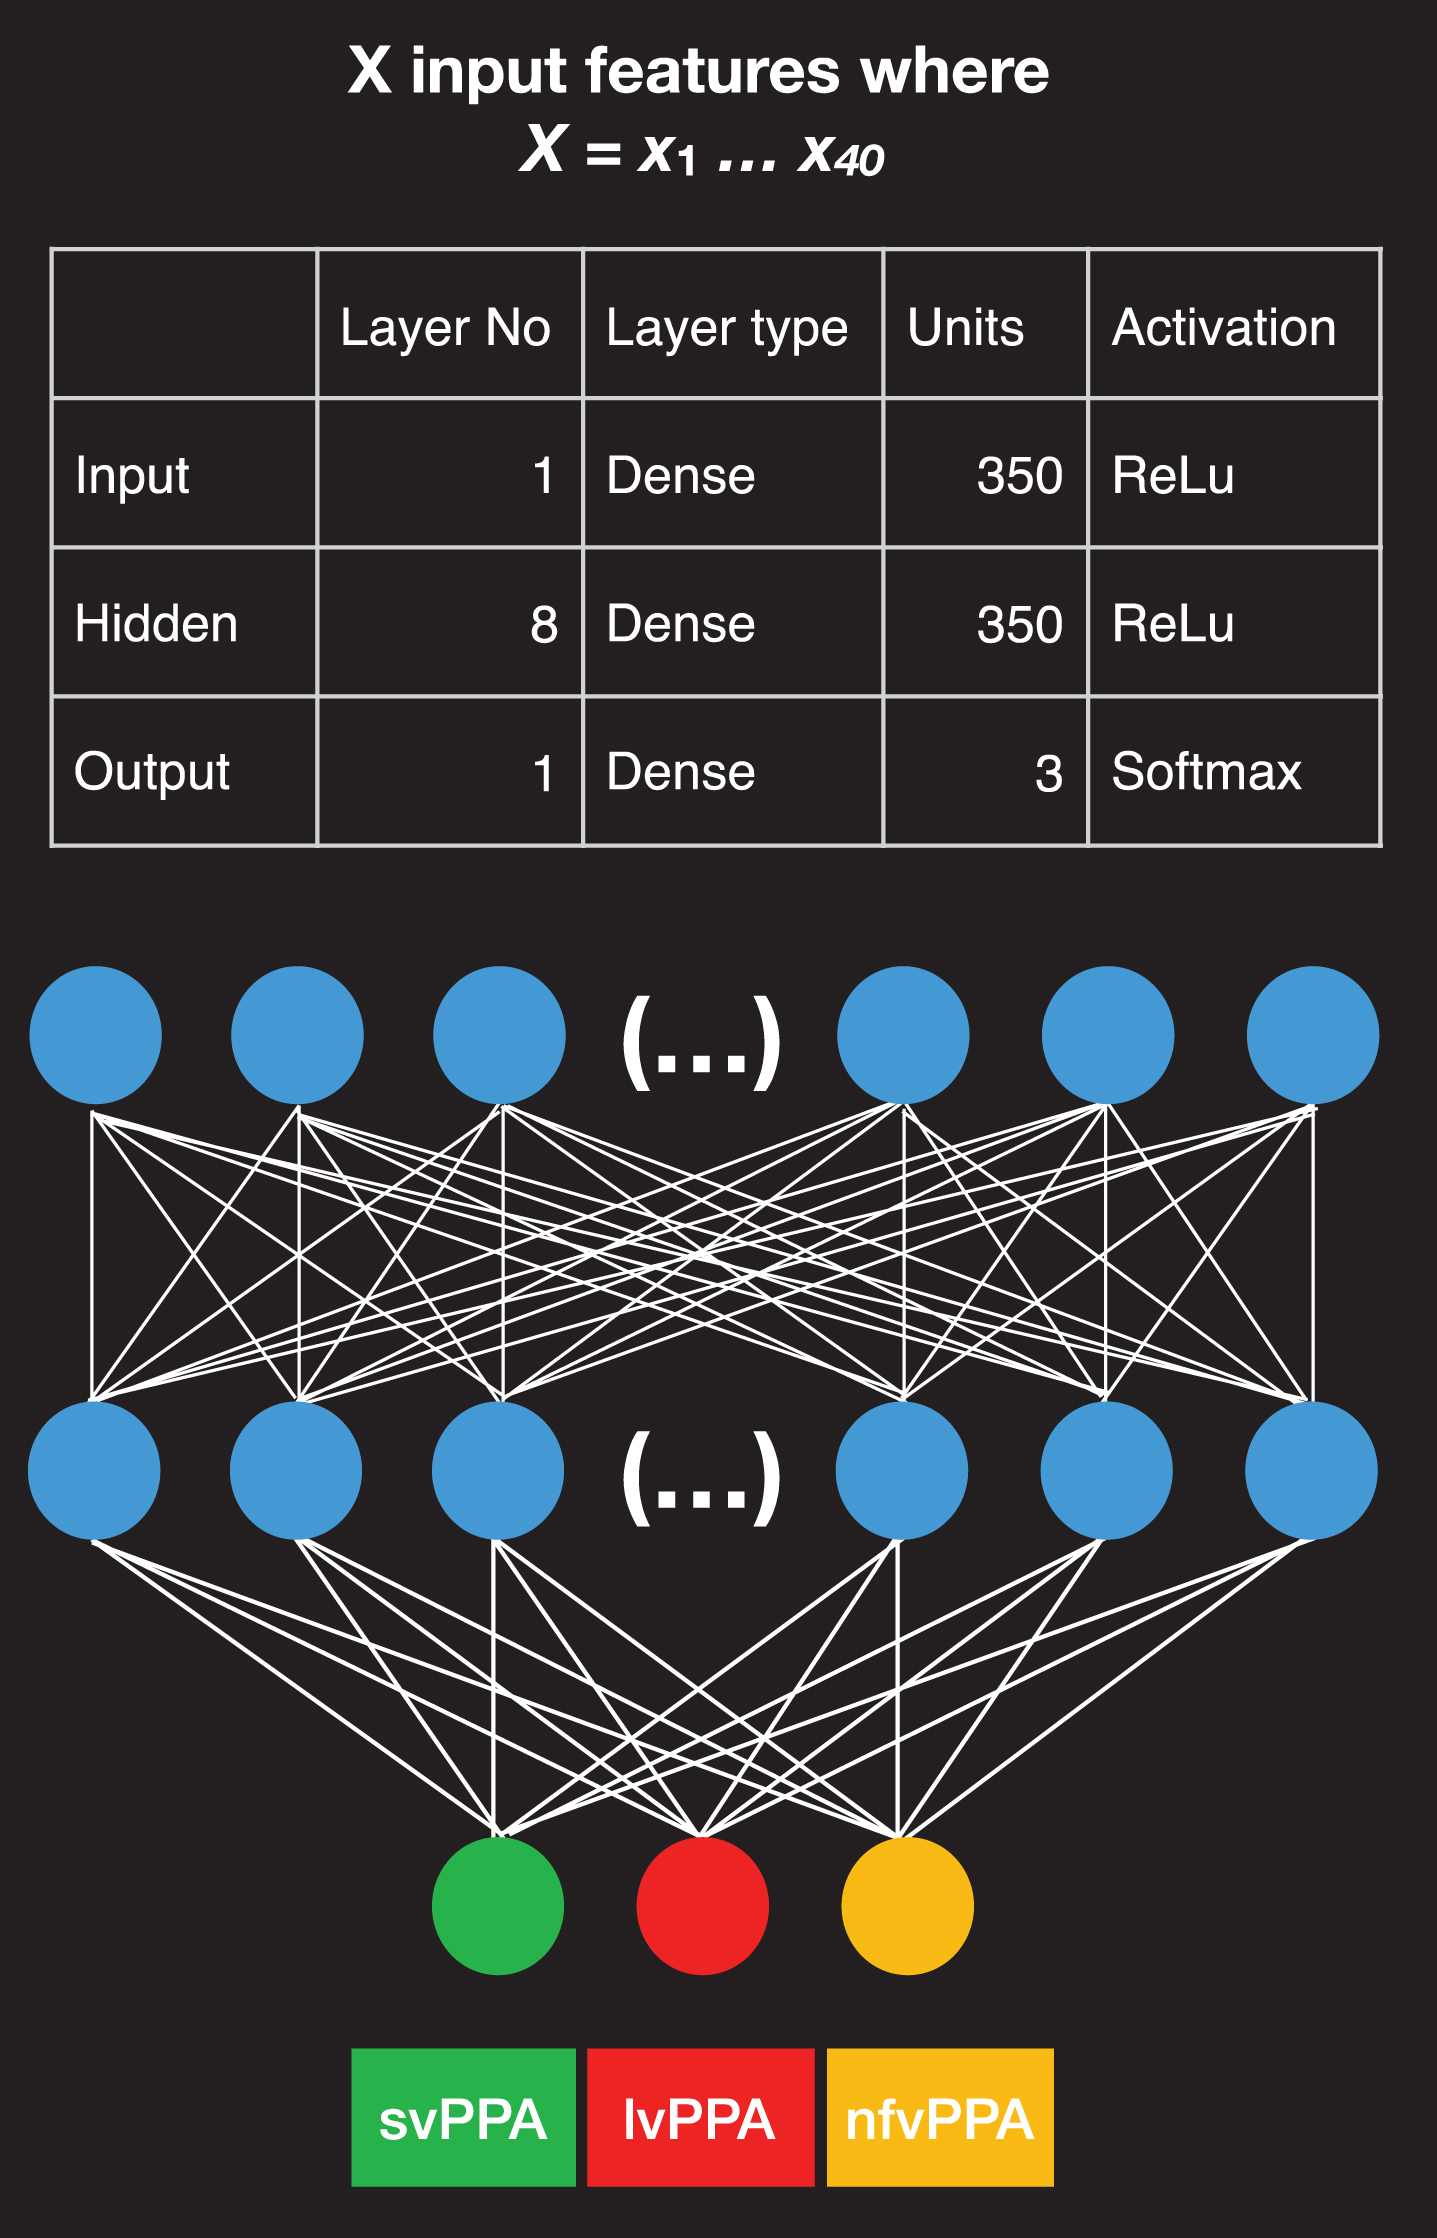
The prediction of the variant is provided by the last layer, a.k.a. output layer. All layers in our model contain units or nodes that are interconnected. The input layer consists of 350 dense units. A Rectified Linear Unit (ReLu) was selected as the activation function of the input and the hidden layers. A ReLu is a mathematical function that returns 0 if it gets any negative input but if it gets a positive value, it will return that value back, f (x) = max (0, x). ReLu activations have the advantage that they compute and converge faster than other activation functions [21]. The output layer contains a softmax activation function that provides an output, which is either 0 or 1 to facilitate the three-class classification of the PPA variants [22].
We compiled the model using a Root Mean Square Propagation (RMSProp) optimizer [23]. The RMSProp optimizer is a mathematical function that adapts the learning rate for each of the parameters. The learning rate is the step size made towards minimizing the loss function of the network. The RMSProp divides the learning rate for a weight by a running average of the magnitudes of recent gradients for that weight (i.e., mean square). The advantage of RMSProp is that it displays an outstanding adaptation of the learning rate. The loss function we employed was set to categorical cross-entropy, which is most suitable for multiclass classification. A higher value for the loss function implies a greater error for the predictions of the model. We fitted the network batch size set to 32. The model was trained and evaluated eight times, in an 8-fold cross-validation task (see the section on Model comparison and evaluation). In each fold of the crossvalidation, the neural net was trained and evaluated for 30 epochs (an epoch is a single evaluation of the data from the neural network), using an 80% versus 20% validation split that divides data into an 80% training set and a 20% evaluation set. This evaluation demonstrates the learning progress of the neural network.
Model comparison and evaluation
To estimate how well the model performs and how it generalizes on unknown data, we employed established evaluation methods that select data from a set of participants that were subtyped by clinicians manually to train the model and a different set of participants to evaluate the model. During the training phase the input of the model are the measurements from the cookie theft picture description task produced by a certain patient. The model is tra-ined multiple times on the measurements to identify the patterns that correspond to the PPA variant of that patient, as was estimated from the clinical neuropsychological assessment, MRI scans, etc. In other words, the goal of the training phase is to find speech and language patterns from the input measurements that characterize the provide PPA variant of the patient. The training phase is followed by the evaluation phase of neural network model. For the evaluation, the input of the model are data from patients that were not employed during the training phase, the PPA variant of these new patients is not pr-ovided to the model but it is withheld to evaluate the model predictions. Based on its training and using the new input, the neural network predicts the PPA variant of the new patient. For example, if the neural network predicts, based on the input data, that a patient corresponds to the lvPPA variant and that patient has been classified during neuropsychological assessment as lvPPA, then the assessment is scored as being correct; if it is incorrect, then the prediction is evaluated as incorrect. The accuracy of the model is based on the count of correct predictions, true positives, true negatives, and incorrect predictions, false positive and false negatives. The true positive and true negative are the outcomes where the machine learning model correctly predicts the positive and negative class correspondingly. Furthermore, a false positive or a false negative is an outcome where the model predicts the positive and negative classes incorrectly.
To make the best use of our collected data, we employed an eight-fold group cross-validation met-hod that allows us to use all the data as training data and all the data as test data but at different 8 different training/evaluation phases, so that we are always employing data from different patients to train the model and data from different patients to evaluate the model. The eight-fold group cross-validation method splits the randomized data into eight folds and trains and evaluates the machine learning models eight times. During each training session, seven folds are employed for training and one-fold, which contains data from participants that are not in the training folds, is employed as an evaluation set. Therefore, the machine learning models were trained on different folds of data in the training set and evaluated on different test data from unknown participants during evaluation. This evaluation ensures that data are randomized for splitting and that there are always different participants in the training and test sets.
To evaluate the models, we employed the following metrics: accuracy, precision, and recall. Accuracy is the total sum of correct predictions divided by the total number of both correct and incorrect predictions:
7.49.4 renewcommand qtoa
(2)
(3)
(4)
Finally, the F1 score is the weighted average of the precision and recall, and ranges between 0 and 1 (see Formula 5). The F1 score can offer a more balanced estimate of the outcome than the accuracy.
(5)
All models were implemented in Keras [24] running on top of TensorFlow [25] in Python 3.6.1.
Model optimization and hyperparameter tuning
For the selection of the final neural network architecture, we tested several neural network architectures by varying both the number of hidden layers (starting with minimal architectures with one hidden layer and adding hidden layers incrementally), the number of units per layer, the dropout [26], the activation methods, and the batch size. DT models are provided here as a comparison model and their output is reported without optimizations. We evaluated the SVM models with both linear and non-linear kernels and optimized the models for the number of kernels by running the SVM models with 1 –300 kernels. The SVM model contains 14 non-linear kernels, which provided the best results in SVM optimization. We evaluated the RF models by optimizing for the number of trees from 1 –300 trees. The best RF model was the one with 14 trees. Note that the minimum split number was set to two. In the following, we discuss the model comparison process and the evaluation.
Comparing the performance of neural networks to other machine learning models
To estimate the performance of the DNN, we show how three machine learning models are compared to the DNN model. We employed SVMs [12], RFs [13, 14], and DT as these are often used in medical studies [15].
DTs provide a multiclass classification of patients with three PPA variants by splitting the data using the measurement that best explains the variability of the data. For example, if the ratio of nouns explains most of the variation, the decision tree will split the data in two branches based on the ratio of nouns and will repeat the process multiple times exhaustingly, i.e., up to the point there are no data. One major advantage of DTs is that trees can be visualized and can provide an understanding of the structure of the data and the exact decisions that the model made for the classification. Nevertheless, DTs are often prone to overfitting, as they create long and complicated trees that may not generalize very well to unknown data. Even though there are methods to control overfitting, such as by pruning the lower branches of the tree that explain very little of the remaining variation, these methods are not always optimal.
ii. SVMs classify multidimensional data, using a separating hyperplane that organizes the data points into classes. The data points that delimit the hyperplane are called support vectors and the separating hyperplane is considered a classification machine. One advantage of SVMs is that they can provide good classification results. One disadvantage of SVMs is that the optimization of their tuning parameters (a.k.a., hyperparameters) can be complex and time consuming.
RFs are like DTs, but, unlike DTs, they are ensemble models, i.e., they fit several decision trees on the measurements collected and combine them using an ensemble measures such as the mean, to improve the accuracy of the model. RFs can address the overfitting that often takes place in the case of DTs.
Comparison to human raters
Three trained speech-language pathologists, who were not involved in data collection, provided a classification of nine patients by listening to Cookie Theft recordings; the nine participants were employed for the training of this model (three participants from each variant). Their responses were evaluated using the information that was provided by the combined neuro-psychological examination, MRI, etc.
RESULTS
The Cookie Theft picture description recordings were analyzed to elicit measures of speech and language from patients with PPA. These measures were then employed to train a DNN, along with three other machine learning models, namely a RF, a SVM, and a DT, to provide comparative results for estimating the performance of the DNN. All machine learning models were trained and evaluated using an 8-fold cross-validation method. “True class” variant diagnoses were given by experienced neurologists. Table 2 shows the results from the 8-fold cross-validation method. Overall, the DNN provided 80% classification accuracy and outperformed the other three machine learning methods. The SVMs had the worst performance in the cross-validation task with 45% classification accuracy (Table 4a). RFs provided a 58% classification accuracy (Table 4b), followed by the DT with 57% classification accuracy (Table 4c).
Table 2
Results from eight-fold cross-validation for the deep neural network (DNN), support vector machines (SVM), random forest (RF), and decision tree (DT). Shown is the mean cross-validation accuracy, the 95% confidence intervals (95% CI) and the standard error (SE)
| Model | Mean | 95% CI | SE |
| DNN | 80 | [53, 100] | 11 |
| SVM | 45 | [31, 59] | 5 |
| RF | 58 | [43, 73] | 8 |
| DT | 57 | [38, 75] | 8 |
Table 4
Normalized confusion matrix created from the output of the SVM (a), RF (b), and DT (c). matrices show the predicted versus actual values from the evaluation
| Predicted class | |||
| True class | svPPA | lvPPA | nfvPPA |
| (a) SVM | |||
| svPPA | 28 | 55 | 17 |
| lvPPA | 42 | 39 | 19 |
| nfvPPA | 24 | 31 | 45 |
| (b) RF | |||
| svPPA | 54 | 37 | 9 |
| lvPPA | 38 | 38 | 24 |
| nfvPPA | 8 | 34 | 58 |
| (c) DT | |||
| svPPA | 50 | 47 | 3 |
| lvPPA | 35 | 35 | 30 |
| nfvPPA | 3 | 31 | 66 |
The confusion matrix shown in Table 3 and 4 was calculated by summing the 8 confusion matrices produced during cross-validation for the DNN. The DNN provided improved identification of patients with lvPPA and nfvPPA with respect to svPPA. Patients with lvPPA were identified 95% correctly; 5% of patients with lvPPA were identified as nfvPPA. Patients with svPPA were correctly identified in 65% of the cases; 30% of patients with svPPA were misclassified as lvPPA, and 6% as nfvPPA; 90% of patients with nfvPPA were correctly identified and 10% were classified as svPPA.
Table 3
Normalized confusion matrix created from the output of the deep neural network. The confusion matrix provides the sum of scores from the 8-fold cross-validation test
| Predicted class | ||||
| True class | svPPA | lvPPA | nfvPPA | |
| svPPA | 64 | 30 | 6 | |
| lvPPA | – | 95 | 5 | |
| nfvPPA | 10 | – | 90 | |
To estimate the performance of the DNN, we also compared its accuracy with the classification performance of three trained speech-language pathologists (SLPs) who did not work with the patients who participated in the study. The SLPs’ classifications were based solely on the two-minute Cookie Theft samples. Their responses were compared to the gold standard combined subtyping that employs neuropsychological tests, imaging, language evaluation, etc. The three SLPs displayed substantial variation in their classification scores of patients’ variants with mean classification accuracy 67% (SD = 11). One SLP’s co-rrect identification of the PPA variant of patients was just above average (5/9) 56%, followed by one who had (6/9) 66%, classification accuracy, and the highest classification accuracy reached (7/9) 77.77%. Overall, using the same evaluation data, the DNN provided higher accuracy in classification than SLPs and at a much faster rate.
DISCUSSION
Manual subtyping of patients with PPA is time-consuming and requires substantial expertise on the classification criteria, costly scans, and lengthy evaluations. This study built upon the hypothesis that if there are considerable differences in the language production between individuals with nfvPPA, svPPA, and lvPPA, DNNs will identify the speech and language patterns that characterize the PPA variant of the patient and provide an accurate classification of patients. For the current study, DNNs were trained on acoustic and linguistic predictors derived from descriptive-speech samples. All models were trained eight times in an eight-fold cross-validation evaluation method, following established consensus criteria [1]. The DNN outperformed the other methods, including SVMs, RFs, and DTs [27, 28] in the classification problem, suggesting that DNNs are more suitable models for this classification task.
Given the challenging nature of the classification of language in neurodegenerative conditions, the findings were revealing. The DNN achieved a high classification accuracy, namely 80%, by identifying complex patterns in the acoustic and morphosyntactic data that characterize patients with nfvPPA, svPPA, and lvPPA. Pattern recognition is what enables the DNN to model complex multifactorial problems in several domains, such as natural language processing, speech recognition, image recognition, and machine translation [29]. Studies that employ combined data from MR imaging and batteries of neurophysiological tests provide the same accuracy as the DNN, which does not employ such complex tests. For exa-mple, a recent study following the consensus criteria for PPA subtyping [1], classified 80% of patients using standardized tests and explicit cut-off scores [3]. These results highlight three important concl-usions: (a) a minimal amount of acoustic and linguistic information from connected speech has great discriminatory ability, providing an identification fingerprint of patients with nfvPPA, svPPA, and lvPPA when used in a DNN model, (b) the DNN can simultaneously perform classification of all three PPA variants, and (c) the present automated end-to-end program may assist considerably both the expert clinician by confirming the variant diagnosis, as well as the novice or less experienced clinician by guiding the variant diagnosis.
Patients with nfvPPA and patients with lvPPA had a high identification profile. 90% of patients with nfvPPA was identified correctly and 95% of patients with lvPPA. In fact, the DNN model performed better than other machine learning models for subtyping patients with lvPPA [30, 31]. For example, Hoffman et al. [30] employed unsupervised classification methods and analyzed results from linguistic (e.g., hesitations, phonological errors, picture-naming sc-ores, single-word comprehension, category fluency scores, written competence) and non-linguistic (cube analysis, paired associate learning, etc.) neuropsychological evaluations. They found that participants with lvPPA were not identified as a separate group but were mixed with other participants in both linguistic and non-linguistic tasks [30]. Another study by Maruta et al. [31] using a combination of measures from language and neurophysiological assessments in Portuguese discriminates individuals with svPPA from nfvPPA but not individuals with nfvPPA and svPPA from lvPPA [31]. Unlike these studies, the DNN model by combining acoustics and grammar provided an improved classification of patients with lvPPA.
However, some patients with svPPA were misclassified as lvPPA. The limited amount of data employed constitutes a main limitation of our study. Although 44 patients with PPA is a very substantial number for a rare syndrome such as PPA, machine learning requires more training and evaluation data. In fact, during the evaluation of machine learning models, it became evident that the amount of data in the training set had a significant impact on model accuracy of patients with svPPA. By increasing the overall data sample and obtaining data from more patients, the detection of patients with svPPA is expected to improve substantially. The Cookie Theft picture description task provides a second limitation. The task constrains connected speech production, e.g., patients provide primarily declarative intonational patterns, whereas questions, commands, etc. are not elicited. Also, picture-description tasks tend to elicit actions in the present tense, and sentences with factual content rather than wishes, commands, embedded sentences, and other more complex structures. By contrast, other tasks, such as personal story telling or naturalistic conversation, can have the potential to provide more informative speech and language output and enable the model to distinguish between svPPA and other variants.
Future classification work is likely to benefit from machine learning models trained on simultaneous classification of PPA variants using multifactorial predictors from a variety of discourse settings and co-nversations. We will be looking into employing the DNN model to inform rehabilitation. For example, it can enable multiple evaluations of the same patient over time and estimate the stability of symptoms, considering objective assessments of memory and functionality [32]. A modification of the network will make it easier to score the symptoms of the participant by showing the degree of change (positive or negative) due to therapy or due to the progression of the condition. Also, we plan to develop neural network models that distinguish patients with PPA from healthy controls (see for example [17]). A machine learning model trained on healthy controls that can distinguish patients with PPA from individuals with similar sociolinguistic characteristics (e.g., age, education, etc.) without PPA can complement the subtyping process. DNN models open new opportunities in the evaluation and prognosis of PPA and can ultimately enable better treatment solutions.
DATA AND MATERIALS AVAILABILITY
The code is publicly available at https://github.com/themistocleous/JAD_paper; the data are not publicly available because they can potentially be employed to identify the participants.
ACKNOWLEDGMENTS
We thank our funding resources for their support: the Science of Learning Institute grant ‘Effects of tDCS in PPA’ from Johns Hopkins University to KT, and NIH/NIDCD R01 DC14475 to KT. We thank Ms. Olivia Hermann for her assistance in this work.
Authors’ disclosures available online (https://www.j-alz.com/manuscript-disclosures/20-1101r3).
REFERENCES
[1] | Gorno-Tempini ML , Hillis AE , Weintraub S , Kertesz A , Mendez M , Cappa SF , Ogar JM , Rohrer JD , Black S , Boeve BF , Manes F , Dronkers NF , Vandenberghe R , Rascovsky K , Patterson K , Miller BL , Knopman DS , Hodges JR , Mesulam MM , Grossman M ((2011) ) Classification of primary progressive aphasia and its variants. Neurology 76: , 1006–1014. |
[2] | TsapkiniK, WebsterKT, FicekBN, DesmondJ, OnyikeCU, RappB, FrangakisCE, HillisAE ((2018) ) Electrical brainstimulation in different variants of Primary Progressive Aphasia: A randomized clinical trial. Alzheimers Dement 4: , 461–472. |
[3] | Mesulam MM , Wieneke C , Thompson C , Rogalski E , Weintraub S ((2012) ) Quantitative classification of primary progressive aphasia at early and mild impairment stages. Brain 135: , 1537–1553. |
[4] | Narayanan S , Georgiou PG ((2013) ) Behavioral signal processing: Deriving human behavioral informatics from speech and language. Proc IEEE Inst Electr Electron Eng 101: , 1203. |
[5] | Themistocleous C , Webster K , Afthinos A , Tsapkini K (2020) Part of speech production in patients with primary progressive aphasia: An analysis based on natural language processing. Am J Speech Lang Pathol, doi:10.1044/2020_AJSLP-19-00114 |
[6] | Fraser KC , Meltzer JA , Graham NL , Leonard C , Hirst G , Black SE , Rochon E ((2014) ) Automated classification of primary progressive aphasia subtypes from narrative speech transcripts. Cortex 55: , 43–60. |
[7] | Fraser KC , Lundholm Fors K , Eckerström M , Themistocleous C , Kokkinakis D (2018) Improving the Sensitivity and Specificity of MCI Screening with Linguistic Information. Proceedings of the LREC 2018 Workshop “Resources and ProcessIng of linguistic, para-linguistic and extra linguistic Data from people with various forms of cognitive/psychiatric impairments (RaPID-2)”, pp. 19–26. |
[8] | Ballard KJ , Savage S , Leyton CE , Vogel AP , Hornberger M , Hodges JR ((2014) ) Logopenic and nonfluent variants of primary progressive aphasia are differentiated by acoustic measures of speech production. PLoS One 9: , e89864. |
[9] | Dalton SGH , Shultz C , Henry ML , Hillis AE , Richardson JD ((2018) ) Describing phonological paraphasias in three variants of primary progressive aphasia. Am J Speech Lang Pathol 27: , 336–349. |
[10] | Hardy CJD , Agustus JL , Marshall CR , Clark CN , Russell LL , Bond RL , Brotherhood EV , Thomas DL , Crutch SJ , Rohrer JD , Warren JD ((2017) ) Behavioural and neuroanatomical correlates of auditory speech analysis in primary progressive aphasias. Alzheimers Res Ther 9: , 1–10. |
[11] | Goodglass H , Kaplan E , Barresi B (2001) BDAE-3: Boston Diagnostic Aphasia Examination –Third Edition, Lippincott Williams & Wilkins Philadelphia, PA. |
[12] | Cortes C , Vapnik V ((1995) ) Support-vector networks. Mach Learn 20: , 273–297. |
[13] | Breiman L ((2001) ) Random forests. Mach Learn 45: , 5–32. |
[14] | Breiman L , Friedman JH , Olshen RA , Stone CJ ((1984) ) Classification and regression trees, Wadsworth, Inc. |
[15] | Maroco J , Silva D , Rodrigues A , Guerreiro M , Santana I , de Mendonça A ((2011) ) Data mining methods in the prediction of Dementia: A real-data comparison of the accuracy, sensitivity and specificity of linear discriminant analysis, logistic regression, neural networks, support vector machines, classification trees and random forests. BMC Res Notes 4: , 299. |
[16] | Knopman DS , Kramer JH , Boeve BF , Caselli RJ , Graff-Radford NR , Mendez MF , Miller BL , Mercaldo N ((2008) ) Development of methodology for conducting clinical trials in frontotemporal lobar degeneration. Brain 131: , 2957–2968. |
[17] | Themistocleous C , Eckerström M , Kokkinakis D ((2018) ) Identification of mild cognitive impairment from speech in Swedish using deep sequential neural networks. Front Neurol 9: , 975. |
[18] | Boersma P , Weenink D (2017) Praat: Doing phonetics by computer (Version 6.0.32). |
[19] | Loria S , Keen P , Honnibal M , Yankovsky R , Karesh D , Dempsey E (2014) Textblob: Simplified text processing. Secondary TextBlob: Simplified Text Processing. |
[20] | Pedregosa F , Varoquaux G , Gramfort A , Michel V , Thirion B , Grisel O , Blondel M , Prettenhofer P , Weiss R , Dubourg V , Vanderplas J , Passos A , Cournapeau D , Brucher M , Perrot M , Duchesnay E ((2011) ) Scikit-learn: Machine learning in Python. J Mach Learn Res 12: , 2825–2830. |
[21] | Zeiler MD , Ranzato M , Monga R , Mao M , Yang K , Le QV , Nguyen P , Senior A , Vanhoucke V , Dean J , Hinton GE (2013) On rectified linear units for speech processing. In 2013 IEEE International Conference on Acoustics, Speech and Signal Processing, pp. 3517–3521. |
[22] | Bridle JS (1990) Training stochastic model recognition algorithms as networks can lead to maximum mutual information estimation of parameters. In Advances in Neural Information Processing Systems 2. Morgan-Kaufmann, pp. 211-217. |
[23] | Wilson AC , Roelofs R , Stern M , Srebro N , Recht B The marginal value of adaptive gradient methods in machine learning. In Advances in Neural Information Processing Systems 30. Curran Associates, Inc., pp. 4148-4158. |
[24] | Chollet F ((2017) ) Deep Learning with Python. Manning Publications Company, New York. |
[25] | Abadi M , Agarwal A , Barham P , Brevdo E , Chen Z , Citro C , Corrado GS , Davis A , Dean J , Devin M , Ghemawat S , Goodfellow IJ , Harp A , Irving G , Isard M , Jia Y , Józefowicz R , Kaiser L , Kudlur M , Levenberg J , Mané D , Monga R , Moore S , Murray DG , Olah C , Schuster M , Shlens J , Steiner B , Sutskever I , Talwar K , Tucker PA , Vanhoucke V , Vasudevan V , Viégas FB , Vinyals O , Warden P , Wattenberg M , Wicke M , Yu Y , Zheng X (2016) TensorFlow: Large-scale machine learning on heterogeneous distributed systems. 12th USENIX Symposium on Operating Systems Design and Implementation (OSDI ’16), Savannah, GA. https://www.usenix.org/conference/osdi16/technical-sessions/presentation/abadi, pp 265-283 |
[26] | Srivastava N , Hinton G , Krizhevsky A , Sutskever I , Salakhutdinov R ((2014) ) Dropout: A simple way to prevent neural networks from overfitting. J Mach Learn Res 15: , 1929–1958. |
[27] | Hassabis D , Kumaran D , Summerfield C , Botvinick M ((2017) ) Neuroscience-inspired artificial intelligence. Neuron 95: , 245–258. |
[28] | Lecun Y , Bengio Y , Hinton G ((2015) ) Deep learning. Nature 521: , 436–444. |
[29] | De Mulder W , Bethard S , Moens MF ((2015) ) A survey on the application of recurrent neural networks to statistical language modeling. Comp Speech Lang 30: , 61–98. |
[30] | Hoffman P , Sajjadi SA , Patterson K , Nestor PJ ((2017) ) Data-driven classification of patients with primary progressive aphasia. Brain Lang 174: , 86–93. |
[31] | Maruta C , Maroco J , de Mendonca A , Guerreiro M ((2017) ) Behavior symptoms in primary progressive aphasia variants. In Neuropsychiatric Symptoms of Cognitive Impairment and Dementia. Springer, pp. 27–43. |
[32] | Oliveira FF , Marin SM , Bertolucci PH ((2017) ) Neurological impressions on the organization of language networks in the human brain. Brain Injury 31: , 140–150. |

