Pattern Recognition of Grating Perimeter Intrusion Behavior in Deep Learning Method


School of Information Engineering, Yancheng Institute of Technology, Yancheng 224051, China
*
Author to whom correspondence should be addressed.
Symmetry 2021, 13(1), 87; https://doi.org/10.3390/sym13010087
Submission received: 26 November 2020
/
Revised: 30 December 2020
/
Accepted: 30 December 2020
/
Published: 6 January 2021
(This article belongs to the Special Issue Mathematical Modeling and Computational Methods in Science and Engineering III)
Abstract
:An intrusion behavior recognition method based on deep learning is proposed in this paper in order to improve the recognition accuracy of raster perimeter intrusion behavior. The Mach–Zehnder fiber optic interferometer was used to collect the external vibration signal sensing unit, capture the external vibration signal, use the cross-correlation characteristic method to obtain the minimum frame length of the fiber vibration signal, and preprocess the intrusion signal according to the signal strength. The intrusion signals were superimposed and several sections of signals were intercepted by fixed window length; the spectrum information is obtained by Fourier transform of the intercepted stationary signals. The convolution neural network was introduced into the pattern recognition of the intrusion signals in the optical fiber perimeter defense zone, and the different characteristics of the intrusion signals were extracted, so as to realize the accurate identification of different intrusion signals. Experimental results showed that this method was highly sensitive to intrusion events, could effectively reduce the false alarm rate of intrusion signals, and could improve the accuracy and efficiency of intrusion signal recognition.
1. Introduction
The optical fiber sensing unit can measure parameters such as temperature, stress, and sound [1]. At present, the optical fiber perimeter system based on optical fiber sensing technology has the advantages of strong electromagnetic interference resistance, high sensitivity, high reliability, corrosion resistance, and small size. Small size has become a research hotspot in the field of remote perimeter invasion defense. The optical fiber sensor takes the optical fiber as the transmission medium, perceiving the change of external signal through the degree of optical fiber phase shift, and analyzing the signal of normal optical fiber signal fluctuation, so as to obtain the measured spatio-temporal change information. The optical fiber sensor is mainly composed of a light transmitter, an optical fiber, and a light receiver [2]. The light transmitter sends out the modulated pulse light, which is transmitted to the receiving end through the optical fiber for receiving. When the cable is illegally invaded, the cable will vibrate, the modulation phase of the light transmitted on the optical fiber will change, and the signal received by the receiving end will trigger the alarm system [3]. At present, the distributed optical fiber sensing system has been able to realize the measurement of temperature, electromagnetic field, radiation, force, and other traditional physical quantities, which greatly meets the needs of various security environments.
Nowadays, the research on the hardware system of the optical fiber perimeter system has essentially been completed, and optical devices are no longer the core problem that affects and restricts its development. At present, the simple mathematical model cannot meet the requirements of recognition. The optical fiber perimeter system has in essence realized the efficient recognition of a single intrusion signal, and the pattern recognition of intrusion behavior has become a research topic of wide concern for researchers in the field of optical sensing.
In [4], an intrusion signal recognition method based on echo state network is proposed. Sagnac interferometer was used to simulate the sensing optical fiber to obtain various event signals. The preprocessed signals were input into training electronic serial number (ESN) to identify different types of intrusion events. This method can realize more accurate and effective intrusion recognition. In [5], a hierarchical recognition algorithm for continuous intrusion events based on the stress response process was proposed. Using the continuity of intrusion events, a heuristic staged recognition process was established, and the stress response degree of intrusion events was analyzed. This realized the hierarchical recognition of continuous intrusion events. The processing speed of this algorithm is relatively fast, which can effectively shorten the verification time.
However, the above recognition algorithm ignores the extraction of pixel features, resulting in low recognition accuracy. Therefore, in order to improve the accuracy of intrusion signal preprocessing, we have adopted the deep learning method for intrusion behavior pattern recognition. This is because the deep learning method can use fewer parameters, thus reducing the training cost and obtaining a higher recognition accuracy in a relatively short time. This article is divided into fiber perimeter security system design, optical signal preprocessing, feature extraction, and identification model of deep learning invasion method section states building three parts. Finally, the experimental simulation analysis verified that the method can effectively reduce the false alarm rate of invading signal, can improve the sensitivity of intrusion response, and can improve the accuracy of the invasion of signal recognition and efficiency.
Firstly, the perimeter security system of optical fiber was designed. On the basis of the principle of optical sensor, we represented optical phase shift and optical intensity data by interferometric optical fiber sensor. Then, the typical structure of the fiber perimeter security system was analyzed, and the signal was collected by using the Mach–Zehnder fiber interferometer. Finally, the architecture of the optical fiber perimeter system was designed.
Secondly, fiber signal preprocessing and feature extraction were carried out. In this part, the minimum frame length of the optical fiber vibration signal was obtained by cross-correlation method, and the intrusion signal was preprocessed according to the distribution characteristics of the optical fiber signal, so as to extract the time-domain characteristics of the optical fiber signal.
Thirdly, the deep learning model of intrusion identification was constructed. In this part, according to the fixed window length, we intercepted multi-segment signals for Fourier transform to obtain the spectrum information. By introducing the convolutional neural network into the pattern recognition of the intrusion signal in the circumscribed defensive area of optical fiber, we extracted the different features of the intrusion signal and obtained the deep learning model of the intrusion recognition.
Finally, the experimental simulation analysis was carried out. In this part, the amplitude of the intrusion vibration signal was measured by the experimental environment, and the noise problem was also considered. The method in this paper was compared with the method in [4,5], and the accuracy of intrusion signal recognition, the iteration loss value of training set, the identification efficiency of intrusion events, and the response sensitivity of intrusion events were compared and analyzed. The results showed that the accuracy and efficiency of this method were high, the false alarm rate of the intrusion signal was greatly reduced, and the overall stability of the recognition system was improved.
2. Optical Fiber Perimeter Security System Design
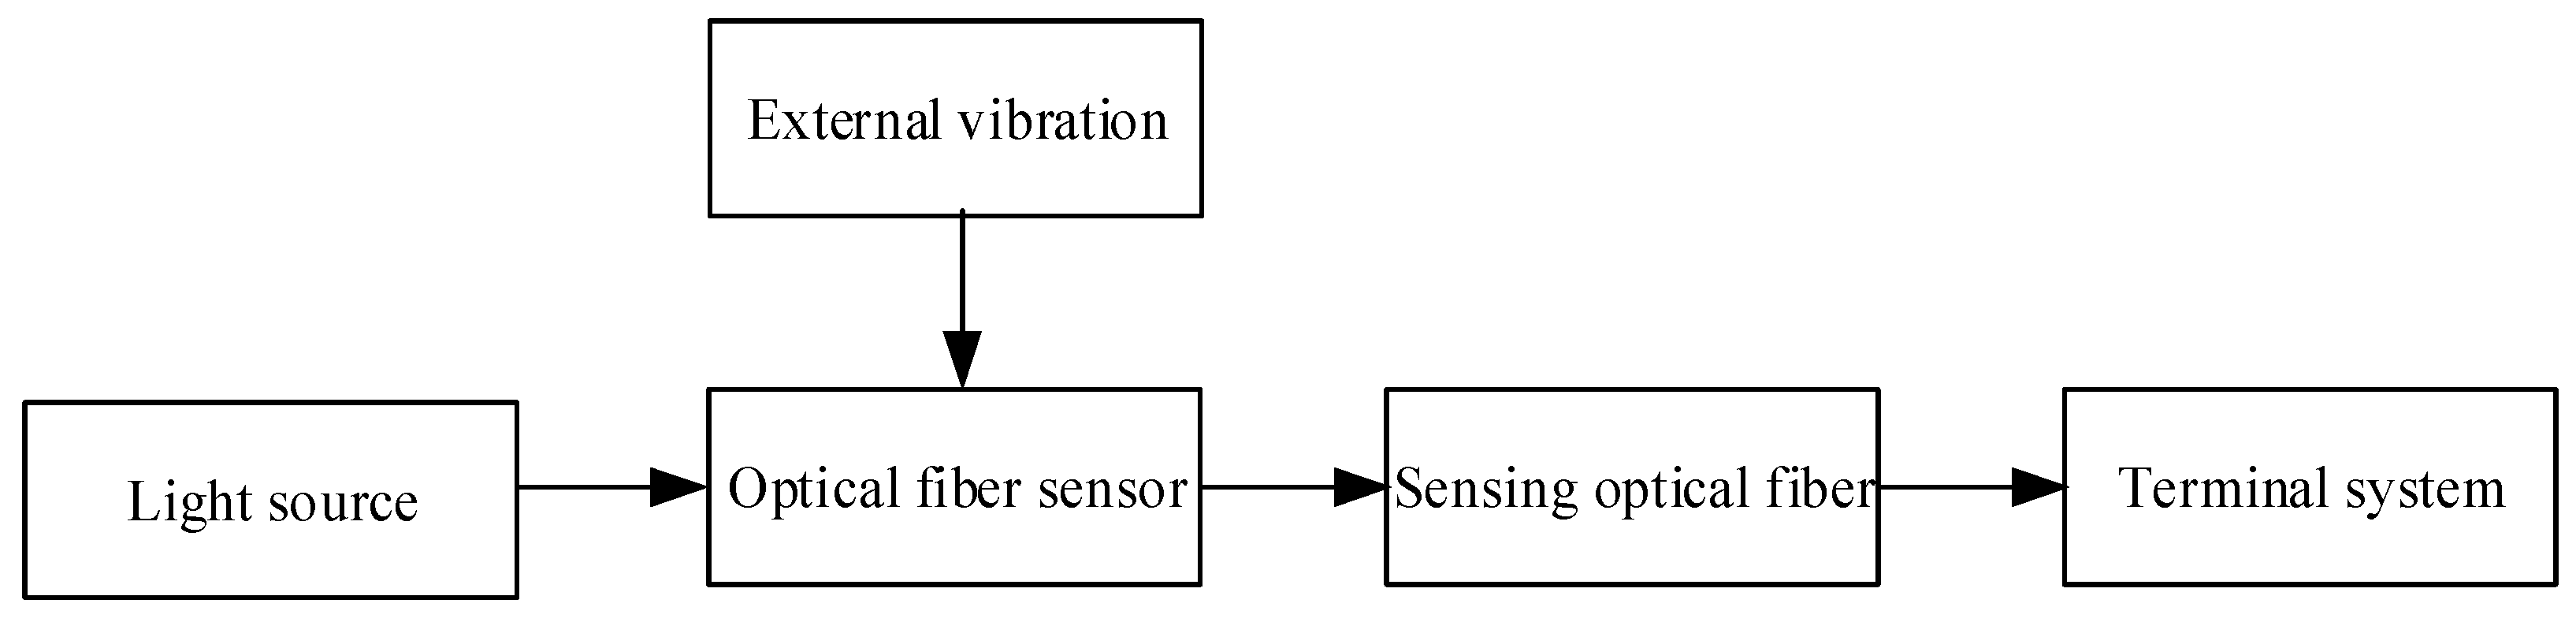
The optical fiber perimeter security system is mainly composed of light source, sensing optical fiber, optical fiber sensor, and terminal system. Its basic structure is shown in Figure 1.
The light source is the signal source of the system and is generally a narrowband light source. Optical fiber sensor is a sensing unit for collecting external vibration signal, which is used to capture external vibration signal [6]. The sensing optical fiber is arranged in the surrounding area and is the transmission medium of optical signal. The terminal equipment processes the optical fiber signal, judges according to the processing result, and generates the corresponding system response. Among them, according to the different surrounding environment and security requirements, there is a need to choose different optical fiber sensors and optical fiber layout.
2.1. Principle of Optical Fiber Sensor
An optical fiber is a dielectric optical waveguide. The optical signal can propagate along the axial direction of the optical fiber. The core of the optical fiber is made of silica material, which confirms that the optical fiber has good anti-electromagnetic interference and anti-corrosion properties.
Compared with other sensors, optical fiber sensors can be better applied in very harsh environments and have better durability and more extensive applications. The basic principle of an optical fiber sensor is to convert the light emitted by the laser into the corresponding changes in the intensity, wavelength, frequency, and phase of the corresponding optical signal according to the changes of the measured external environment [7]. The affected light signal is transmitted to a light detector in the optical fiber, and the event in the sensing region is obtained by changing different measurement parameters. The optical fiber sensor used in this paper is an interferometric optical fiber sensor. This technology uses the interference distance to represent the optical phase shift of the light, and then realizes the phase modulation of the optical signal.
2.2. Typical Structure of Optical Fiber Perimeter Security System
With the development of optical fiber manufacturing technology and related fields, optical fiber sensing technology as a new sensing technology is becoming more and more mature. Optical fiber sensor takes light as signal transmission carrier and sensing optical fiber as transmission medium. Compared with the traditional electrical sensor, optical fiber sensors have the characteristics of high sensitivity and anti-electromagnetic interference, and have been widely used in the perimeter security field. Interferometric optical fiber sensors mainly include Mach–Zehnder optical fiber interferometer (MZI), Michelson optical fiber interferometer, Sagnac optical fiber interferometer, etc.
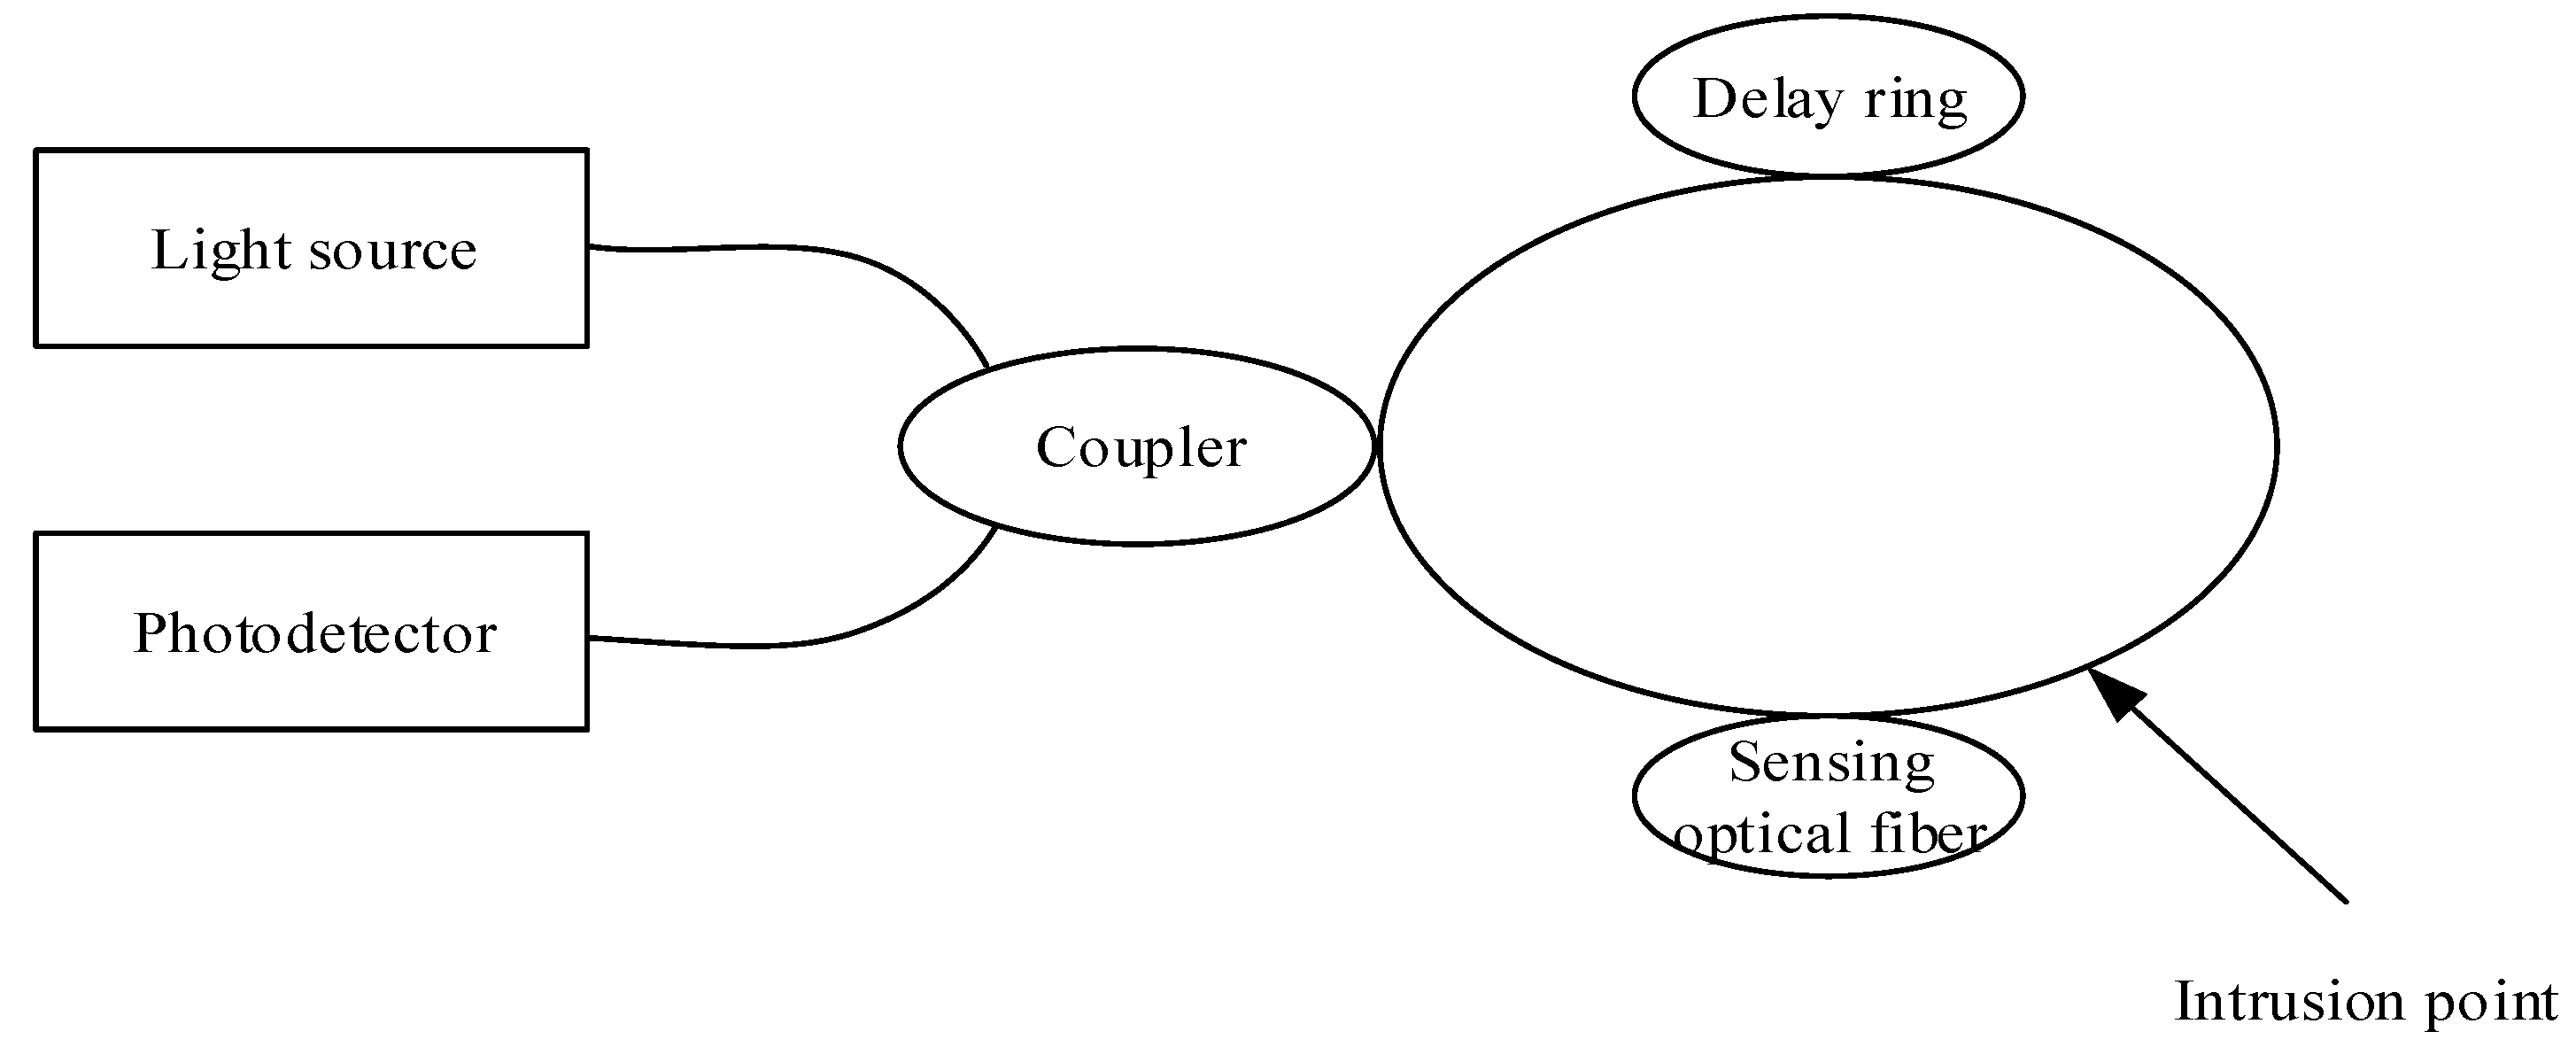
Sagnac fiber interferometer: A fiber interferometer designed and manufactured using the Sagnac effect. The basic principle is that light waves are emitted by a light source converge and interfere when they travel clockwise and counterclockwise in the same loop. Under the interference of external environmental factors, the light waves in the two optical paths will produce different phase shifts. The phase information of the interference signal is obtained by phase analysis. The structure of the optical fiber perimeter security system based on Sagnac optical fiber interferometer is shown in Figure 2.
The light beam from the light source is divided into two beams, clockwise and counterclockwise, through the 3 dB coupler. Due to the interference of the external vibration signals, the phase of a certain beam changes, and the two beams interfere at the coupler, transforming the phase change into the change of light intensity. The photoelectric detector captures the interfered light, and the signal processing equipment analyzes and processes the collected signal, and finally realizes the recognition of different signals.
When the transmission fiber catches the external disturbance, the interference phase change produced can be expressed as
In Equation (1), represents the phase change of the optical signal, represents the propagation constant of the fiber, represents the radius of the fiber core, represents the refractive index of the light in the fiber core, represents the fiber length, represents the light wave caused by the change of the fiber length caused by the vibration signal phase change, represents the phase change caused by the change in the refractive index of the fiber, and represents the phase change caused by the Poisson effect.
The advantages of fiber perimeter security system based on Sagnac fiber interferometer are that the optical path of two coherent beams is equal, andis not subject to external interference and has a higher signal-to-noise ratio than other interferometers. At the same time, when Sagnac interferometer is working, the light source should be modulated or the demodulated optical path should be scanned in order to determine the zero-frequency position. If the intrusion occurs at the midpoint of the loop, the system will not be able to detect it [8]. Therefore, the fiber perimeter security system based on Sagnac fiber interferometer is more suitable for small-scale and relatively simple system structure.
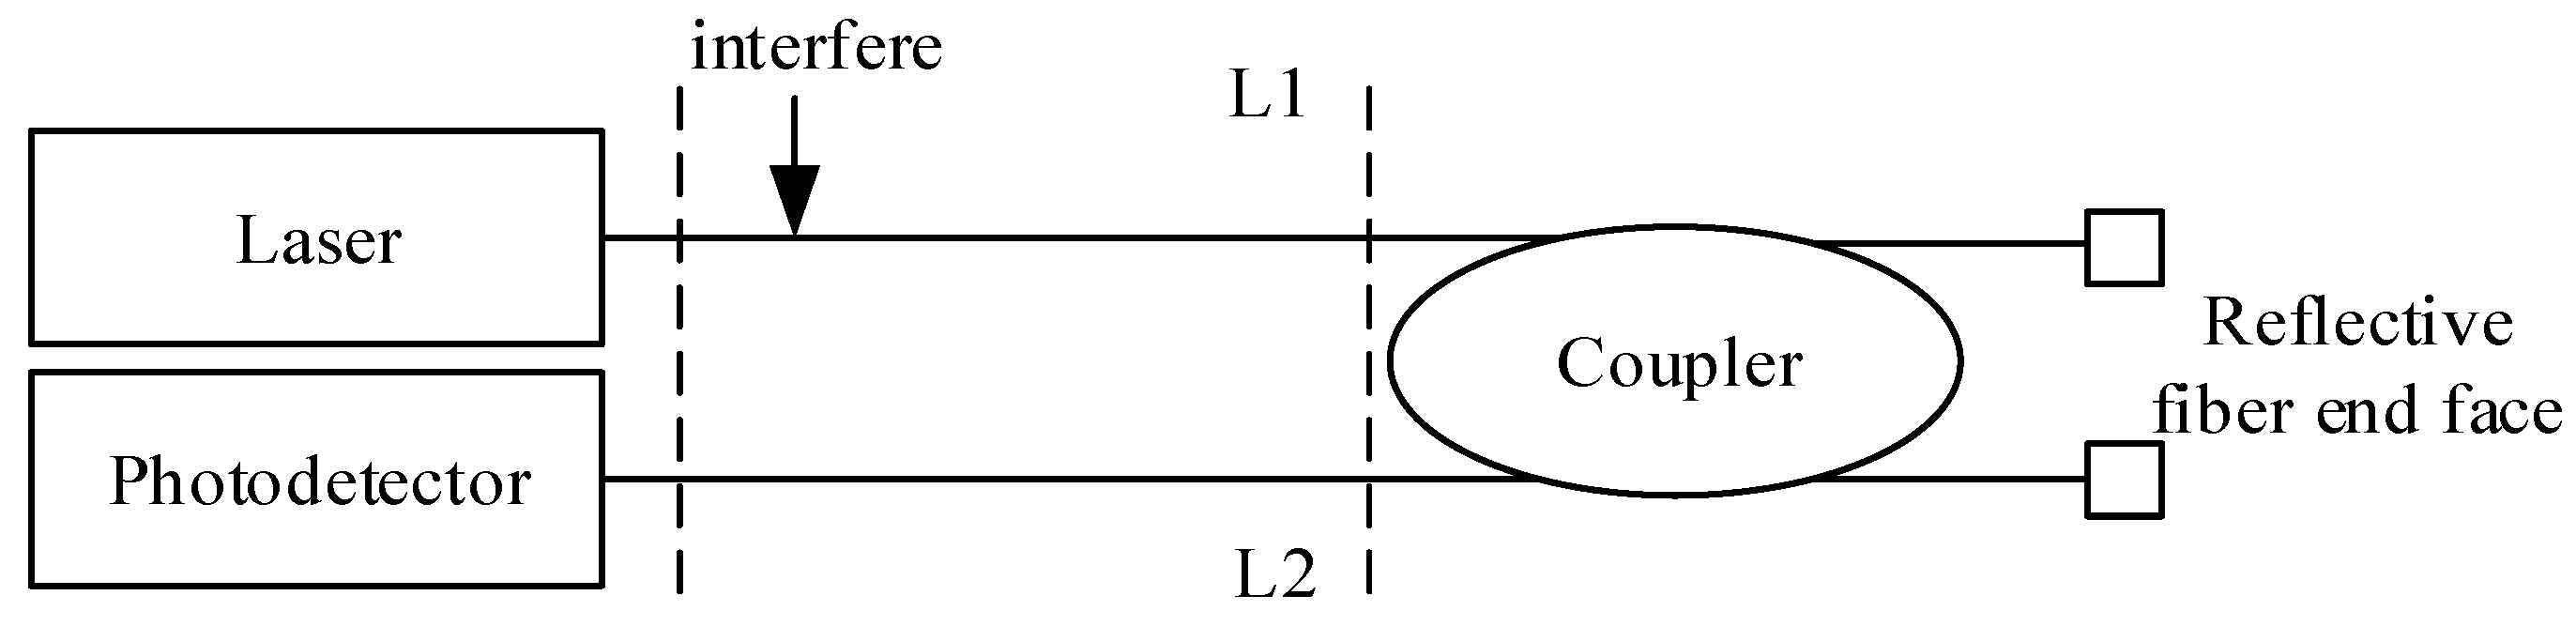
Michelson fiber interferometer: Composed of laser, photodetector, coupler, and two optical fibers coated with high reflectivity film. The structure of its Michelson fiber interferometer is shown in Figure 3.
Monochromatic light is produced by lasers. After the monochromatic light passes through the 3dB coupler, it is divided into two beams with the same intensity and divided into two optical fibers on the right side of the coupler. The optical signal is reflected on the reflection surface and the end surface of the fiber. Because the two fibers are of the same length, the optical path difference between the two beams is the same. After two beams of reflected light pass through the coupler, one is transmitted to the optical detector and the other to the laser. Interference is generated at the photodetector, assuming that the optical fiber in Figure 3 is the reference arm and the optical fiber is the sensing arm. When there is an intrusion action on the sensing arm, the phase of the optical signal in the sensing arm will change, and the optical signal in the two arms of the optical fiber sensor will produce phase difference, which will produce Michelson interference in the coupler. The signal received by the optical fiber detector will change accordingly.
Because the structure of the optical fiber interferometer is a double beam interference structure, the intensity of the two beams is positively correlated with the cosine value of the phase difference between the two fibers. Due to the influence of external factors, the length of the middle sensing arm of the fiber interferometer and the refractive index of the light in the fiber core will change, because
In Equation (2), represents the propagation constant of light in vacuum, and represents the optical path.
According to Equation (2), the phase change of the signal in the optical fiber can be calculated as
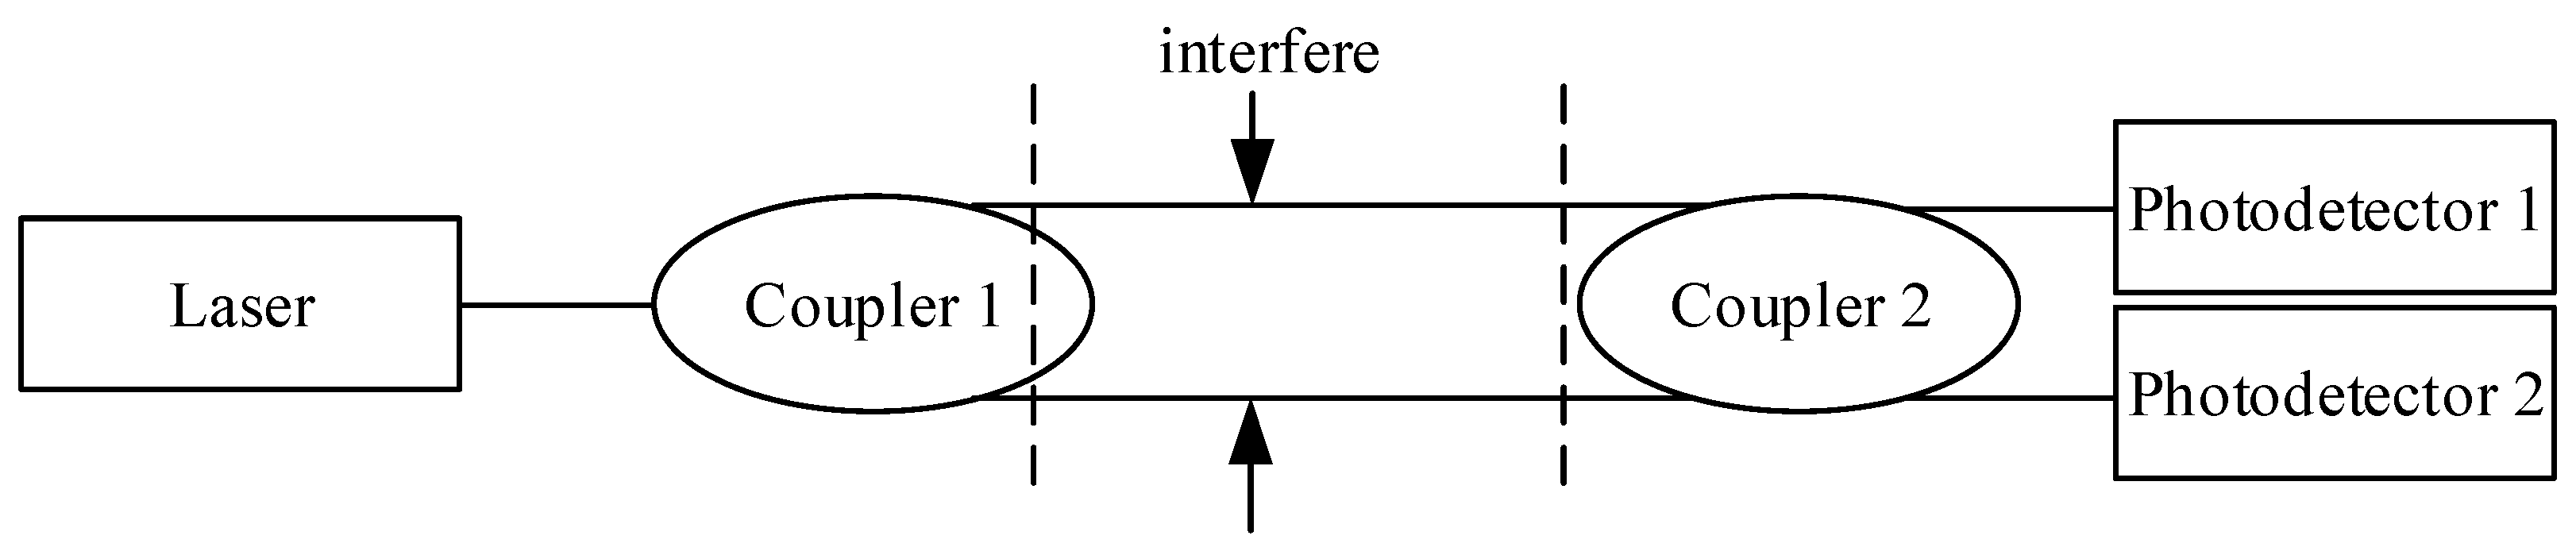
Mach–Zehnder fiber interferometer: This interferometeris made on the basis of the principle of optical phase modulation and has the characteristics of phase modulation and double-beam interferometry. The reason for choosing the Mach–Zehnder fiber interferometer is that its phase modulation characteristics make its internal working space wide, and there are multiple choices for the formation position of interference fringes. It is the best choice for observing the gas flow, thereby effectively capturing external vibration signals. Moreover, it effectively suppresses the influence of random interference signals on measurement accuracy. The optical path structure consists of a reference arm and a detection arm [9]. The reference arm is used for isolation, and the detection arm is located in the detection area to receive external sensing signals. The structure of the Mach–Zehnder fiber interferometer is shown in Figure 4.
The detection process is as follows. The light signal from the light source is divided into two beams through the beam splitter to ensure that the two beams have the same path. Once the probe area moves, the length of the probe arm, refractive index, and core radius all change, thus changing the phase of the two light signals. Their phase difference can be obtained by detecting the coherent intensity of the two beams. According to the corresponding calculation Equation, we can calculate the force of the detected area.
Suppose that at a certain point in space, two light vectors with the same frequency and phase are and ,
If the two vectors are parallel, the combined light vector of the two beams is
In Equation (5), represents amplitude, and represents angle.
Assuming that the time interval is expressed as and the average light intensity is expressed as , then
If the two beams of light are coherent, the value of and is a fixed value. Therefore,
If a 3 dB coupler is used as the beam splitter of the sensor and there is at this time, then
Therefore, as long as the value of is measured, the phase change can be calculated by Equation (8). Through the phase difference, the disturbance detection of the external event signal can be realized.
Through the analysis of several optical fiber interferometers, combined with the characteristics and application effects of various optical fiber interferometers, the Mach–Zendell optical fiber interferometer is mainly used in this paper. In order to make full use of the information in the Mach–Zehnder optical fiber interferometer system, we established the optical fiber perimeter security system based on the Mach–Zehnder optical fiber interferometer; its structure is shown in Figure 5.
In Figure 5, the laser is the laser source; ISO is the optical isolator; C1, C2, and C3 are 3dB couplers; and Detector1 and Detector2 are photodetectors. L1 and L2 are the sensing arm and reference arm, respectively, and L3 and L4 are guiding optical fibers. The laser sends a monochromatic light through the optical isolator to the coupler C1. The coupler C1 divides the optical signal into two equal parts and sends it to C2 and C3. The couplers C2 and C3 divide the received optical signal into two again. The shares are transferred to the optical fibers L1 and L2. The two beams of light split by C2 pass through the optical fibers L1 and L2 and interfere at C3, which are received by Detector2 and converted into amplitude signals; the two beams of light split by C3 interfere at C2 and interfere at Detector1 [10]. Couplers C1, C2, and C3 and fibers L1, L2, L3, and L4 form two Mach–Zehnder fiber interferometers with opposite directions. The signals received by two optical signal receivers are generated by the same intrusion signal, which makes the signal acquisition more accurate and flexible, and the signals collected by the two sensors can be compared to confirm whether there is intrusion signal.
2.3. Optical Fiber Perimeter System Design Architecture
Optical fiber perimeter system is composed of optical fiber vibration system, signal processing system, and terminal display system. The structure design is shown in Figure 6.
The optical fiber vibration system is composed of optical fiber, optoelectronic devices, sensing cables, and sensors. The sensing optical fiber is extremely sensitive, and the vibration in the covered area generates phase shift through the sensing optical fiber. The optical signal generated by the laser is divided into two optical fibers through the optical fiber at the coupler. After the interference of the sensor coupler at the end point, it is converted into electrical signals and sent to the A/D sampler for conversion into digital signals.
The signal processing system includes time extraction module, event processing module, and event recognition module. The system detects the digital signal obtained by A/D sampling through the division of sampling rules, and preliminarily judges whether there is event signal through preprocessing. If there is an event signal that exceeds the threshold value, FFT (fast Fourier transform) is applied to the signal and the feature of the event signal is extracted from the frequency domain. The processed features of the event signal are classified by the corresponding pattern recognition algorithm.
The terminal display system is mainly responsible for human–computer interaction. Users can monitor the security area in real time in the computer software. After A/D sampling, the data will be sampled and sent to the monitoring module of the terminal display system to display the time-domain waveform of the collected signals. Template adjustment module is mainly responsible for recording various event templates. The event template is obtained and stored in the database through cluster analysis of recorded event information through machine learning algorithm [11]. Users can view the frequency domain waveform of the template to understand the main intrusion and environmental noises in the environment. At the same time, the adjustable parameters in the recognition process can also be adjusted by this module. The alarm module is responsible for timely feedback after detecting the intrusion signal and recording the intrusion event.
3. Optical Fiber Signal Preprocessing and Feature Extraction
3.1. Optical Fiber Signal Framing Method
In the perimeter security system, the collected optical fiber signal has nonlinear and intermittent characteristics. In addition, the direct processing of long discrete signal sequence will bring great computational burden to the recognition system and reduce the real-time performance of the system. Therefore, the optical fiber signal must be reasonably divided into frames. On the basis of the estimation of the signal′s inherent dynamic trajectory, in order to reduce the influence of signal nonlinearity and intermittent characteristics on the frame length, this paper adopted the cross-correlation method to obtain the minimum frame length of the fiber vibration signal. The calculation equation of the cross-correlation coefficient is as follows:
The cross-correlation number describes the degree of similarity between two sequences, ; the larger the cross-correlation value, the higher the degree of similarity between the sequences. In the optical fiber perimeter security system, when the correlation coefficient of adjacent optical fiber signal frames is greater than a certain threshold , it indicates that the two frames are highly similar and can be combined into one frame.
3.2. Optical Fiber Signal Time Domain Feature Extraction
In this paper, by selecting the time-domain characteristics of short-time energy and short-time zero crossing rate, the intrusion signal and non-invasive signal are distinguished, and the signal features are extracted from the time-domain to construct a relatively complete feature set of optical fiber intrusion signal. Using the voice signal processing method for reference, we adopted the double threshold method of short-term energy combined with short-term zero-crossing rate to extract the intrusion signal. The short-term zero-crossing rate and short-term energy of each signal frame are calculated as follows:
In Equation (10), represents the starting point of the signal frame, represents the sign function, represents the short-term energy, and represents the short-term zero-crossing rate. According to the above formula, the short-time energy and short-time zero crossing rate of a frame signal are calculated. When the calculated short-term energy and zero-crossing rate exceed the threshold at the same time, we can determine that the signal frame is an intrusion signal, and the intrusion signal frame is recorded as .
Using the filtering characteristics of empirical mode decomposition (EMD) to Gaussian white noise and the uncorrelation of intrinsic mode function (IMF) corresponding to white noise sequence with zero mean value but different amplitude distribution, pulse interference and aliasing among different intrinsic mode components are suppressed [12]. After obtaining IMF component, kurtosis is calculated as time-domain characteristic vector of intrusion signal as follows:
In Equation (11), represents the number of points of , and represents the kurtosis value corresponding to the IMF component. Through the above steps, selecting the time domain feature can effectively identify different intrusion behaviors, thereby obtaining the time domain feature vector of the intrusion signal.
4. Intrusion Recognition Deep Learning Model Construction
4.1. Short-Time Fourier Transform
The short-time Fourier transform (STFT) is a time–frequency analysis method for unsteady signals. It can transform the intrusion signal applied to the surrounding system structure of optical fiber into a time-varying characteristic spectrum of frequency. The basic idea is to treat the intrusion signal as the superposition of a series of short-term signals, intercept multiple signals with a fixed window length, and then conduct Fourier transform on the intercepted stationary signals to obtain all the spectral information during this period. The basic calculation Equation is as follows:
In Equation (12), represents the interference signal, represents the time window centered on , and represents the modulation operator that converts the signal from the time domain to the frequency domain. It can be seen that the short-time Fourier transform is to first multiply the signal by a window function centered on , and then perform the Fourier transform. In the practical application of short-time Fourier transform, in order to reduce energy leakage and avoid loss of characteristic frequency, different window functions and window lengths can be used to collect time-frequency characteristics.
Choosing a good window function can effectively reduce the frequency leakage and improve the accuracy of amplitude identification. The size of the window also affects the resolution in the time and frequency domains. Wide windows correspond to low temporal resolution, while narrow windows correspond to high temporal resolution and low frequency domain resolution [13]. Therefore, choosing the right window length can balance the resolution of time domain and frequency domain, so as to analyze the characteristic frequency and relative position of the intrusion signal. The resolution in the time domain and frequency domain is calculated as follows:
In Equation (13), represents the sampling frequency, represents the number of Fourier transform points, represents the window length of the window, and represents the number of overlap points between the window and the window.
4.2. Convolution Neural Network
Different from the traditional neural network, the convolutional neural network includes an input layer, a convolutional layer, a pooling layer, a fully connected layer, and an output layer, and the convolutional layer and the pooling layer are alternately connected. The structure is shown in Figure 7.
The main function of the convolution layer is to extract pixel features. The purpose of the pool layer is to reduce the calculation of parameters and avoid over-fitting during training. The function of the fully connected layer is to obtain a vector feature dimension to be classified, where the largest element represents the proximity between the convolutional network and the target judgment [14].
The convolution neural network is introduced into the pattern recognition of intrusion signals in the perimeter defense zone of optical fiber. The different characteristics of each type of intrusion signals are extracted from a large number of time–frequency diagrams, and the accurate classification of different intrusion signals is realized. The calculation expression of the convolution process is
In Equation (14), represents the connection output of the feature map in the layer; represents the nonlinear activation function used for task classification; represents the input feature processed by the convolutional layer; represents the local feature of the layer; represents a convolution operation; and and represent the weight matrix value and the bias term, respectively. Choosing cross entropy as the loss function, the expression is
In Equation (15), represents the number of samples of the intrusion signal, represents the item that is 0 or 1 in the output of the intrusion signal in the output layer of the convolutional network, and represents the intrusion signal. The true value of represents the predicted probability of type intrusion signals in the fiber perimeter defense zone, and represents the predicted probability of not including type intrusion signals.
In the training process, the first-order partial derivative of is calculated, and the updated weight and the offset value are calculated according to the existing weight and offset . The calculation Equation can be expressed as
In Equation (16), represents the learning rate. The smaller learning rate makes the model converge slowly and increases the network training time. The larger learning rate will lead to no solution or over fitting of the model [15,16,17].
In the construction of the model, the time–frequency diagrams of four intrusion signals after STFT are divided into training sets and test sets. Using the training set to train the network parameters, the gradient descent method is used to adjust the weight and deviation value. By applying the test set to the training network model, the accurate classification of the intrusion signals is obtained. The pattern recognition of grating boundary intrusion based on deep learning is realized.
5. Experimental Simulation and Analysis
5.1. Set up the Experiment Environment
In order to verify the application performance of the raster perimeter intrusion behavior pattern recognition method based on deep learning, we used the fiber grating vibration sensor with a distance of 30 m as the vibration signal acquisition terminal; the data were collected through a 16Hz fiber grating demodulator, and the computer in the central control room was connected for subsequent data analysis and processing. In the experiment, the fiber grating vibration sensor was used to convert the external intrusion signal into the modulation region through the incident fiber, and the signal was adjusted to the vibration signal of the intrusion behavior. Three typical intrusion vibration signals, namely, shaking protection nets, knocking protection nets, and other protection fences, were selected as non-intrusive vibration signals of wind, rain, and small animal crawling. In the experiment, 500 samples were collected—there were 200 Shake protection net signals, 150 Strike protective net signals, and 150 Crossing fence signals. The sampling time of 2 s was set, and the sampling point length was set to 1500. The experiment was repeated 50 times and the average value was taken from it.
First, the amplitude results of the three intrusive vibration signals were obtained through the experimental environment built, the noise problem of the signal was considered at the same time, and the empirical mode decomposition (EMD) was used to reduce the noise of the amplitude signal; the result is shown in Figure 8.
In summary, the intrusion vibration signal after noise reduction processing was used as experimental data, and the intrusion signal identification accuracy, training set iteration loss value, identification efficiency, and response sensitivity were compared and analyzed.
5.2. Comparison of Intrusion Signal Recognition Accuracy
With reference to the above experimental setup, according to this method, the characteristic of fiber vibration signal was extracted, obtaining the characteristics of intrusion signals such as shaking protection nets, knocking protection nets, and over-protection fences, and obtaining their respective feature sets after condensing. The method of reference from [4], the method of reference from [5], and the proposed method were used to identify and identify the intrusion signals. The recognition results were obtained by identifying and comparing the features. Dividing the correct recognition of each category by the number of test signals and calculating the accuracy of their identification, we received the results shown in Table 1.
According to the data in Table 1, the average recognition accuracy rate of intrusion signal of reference [4] method is 79.9%, that of reference [5] method is 76.6%, and that of the proposed method is as high as 94.4%. It can be seen that the recognition accuracy of intrusion signals such as the shaking protection net, striking protection net, and crossing the protection fence of the proposed method are higher than those of the reference [4] method and the reference [5] method. The recognition accuracy rate of intrusion signals includes the net and over the fence. Because the proposed method adopts the pattern recognition method based on the combination of short-time Fourier transform and convolution neural network, it retains the complete time–frequency features and extracts the easily recognized feature information, thus improving the accuracy of intrusion signal recognition.
5.3. Comparison of Iterative Loss Values of Training Set
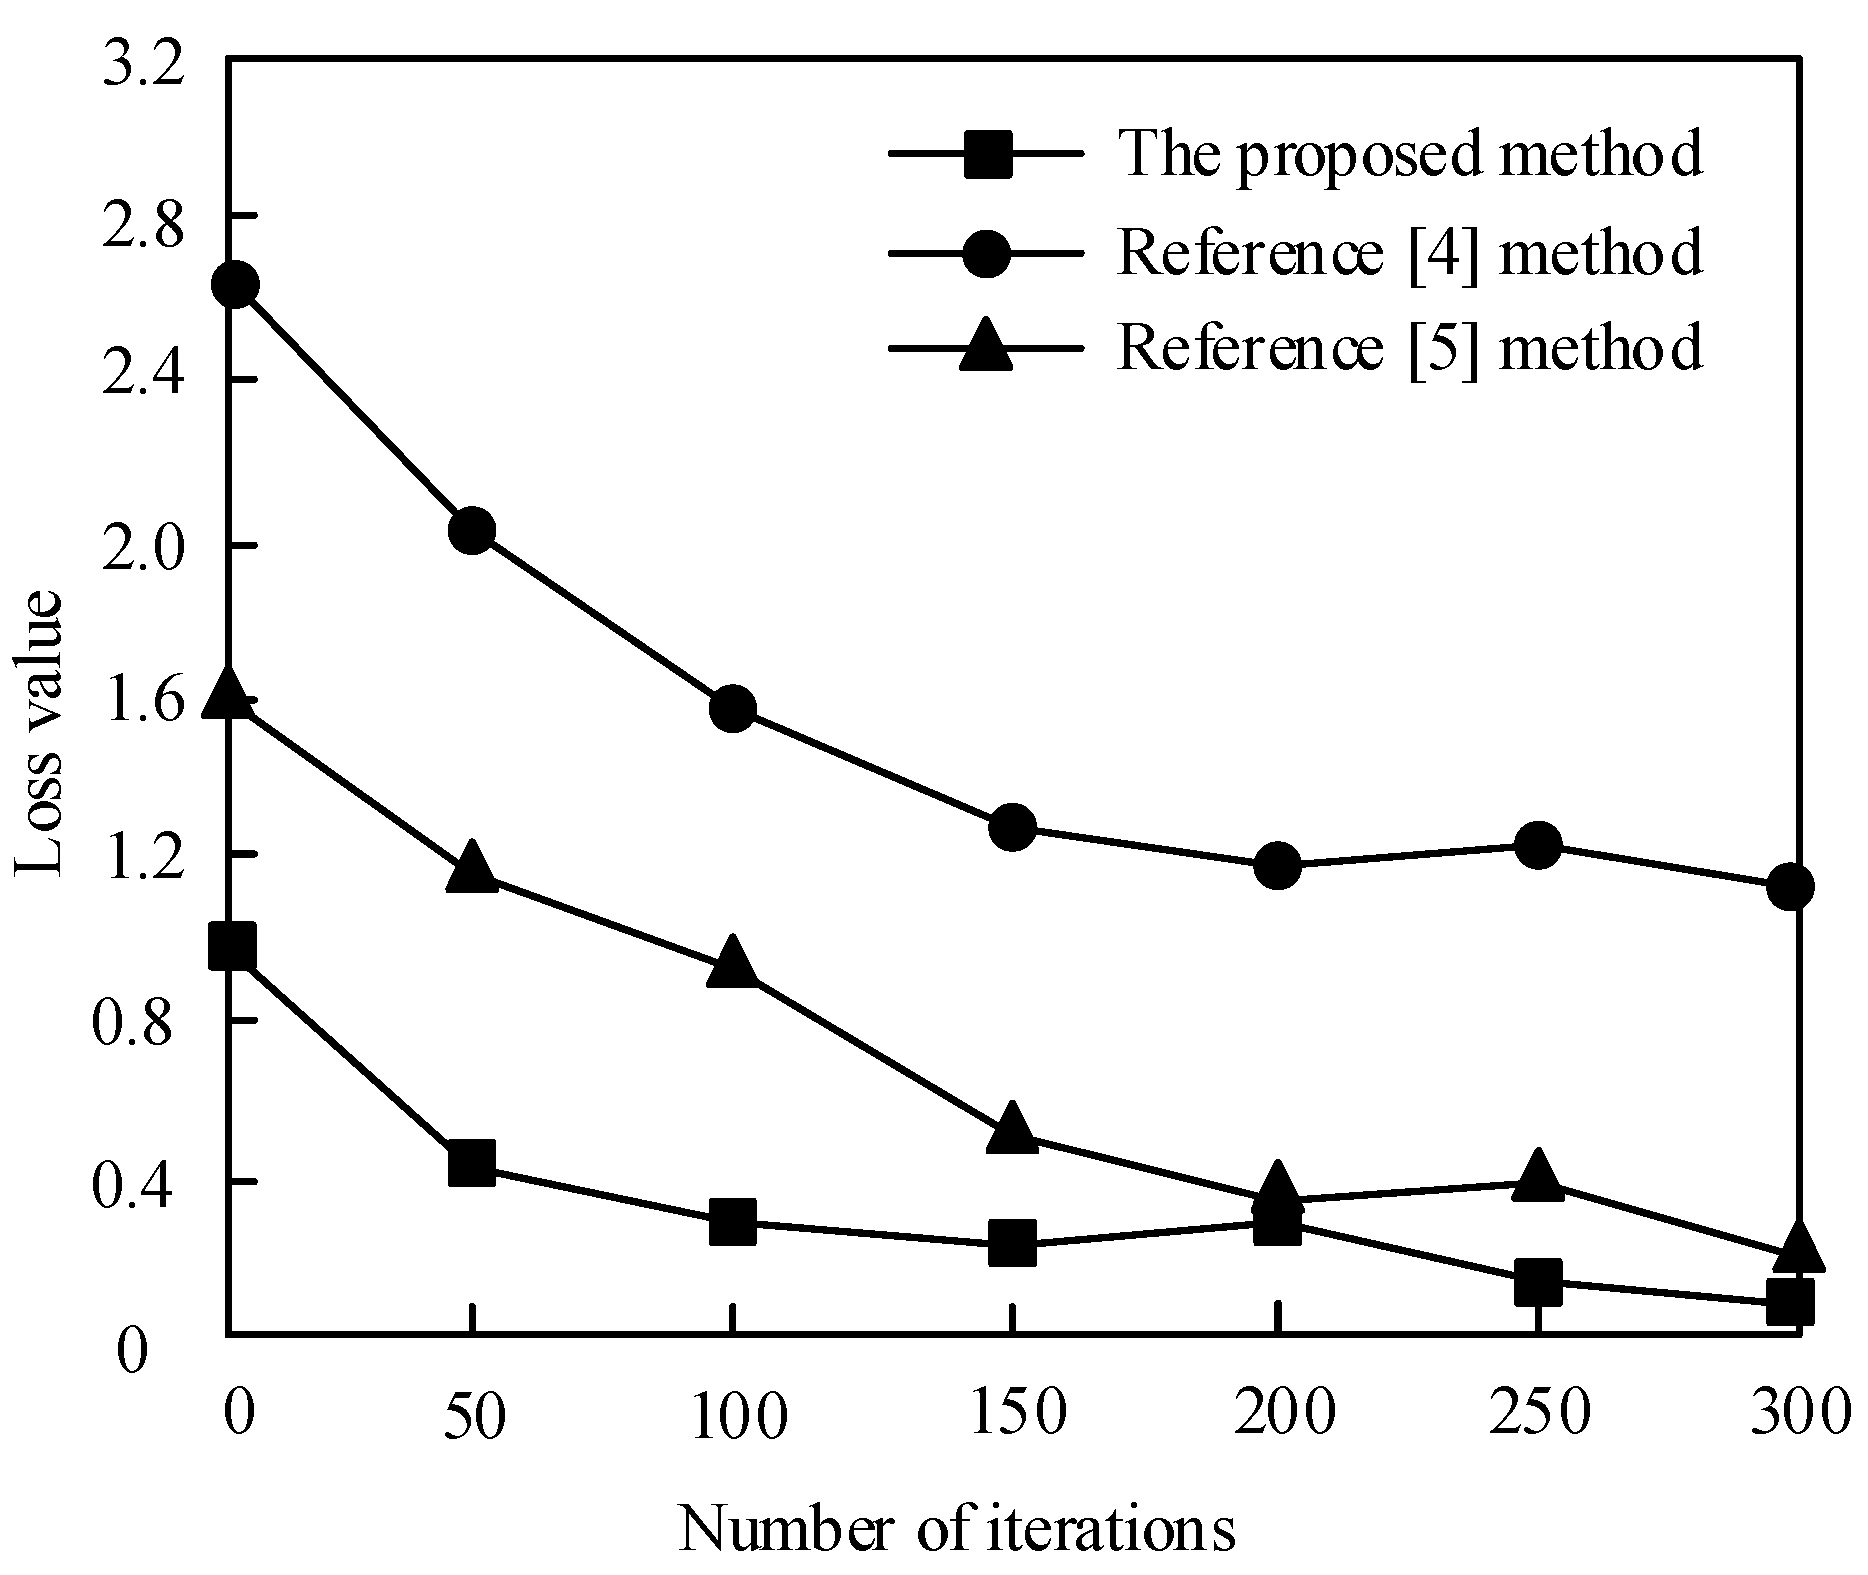
For perimeter protection systems, there is also a very important indicator, that is, false alarm rate. In order to eliminate noise interference, a certain signal feature is usually lost by cross-correlation operation and Fourier transform, which leads to inaccurate identification and false alarm. Considering the adaptability of the network model to the dataset, in order to make the comparison results more valuable, this paper selected the method of reference [4], the method of reference [5], and the method proposed for experimental analysis. The training parameters batch size and epoch are 15 and 5, respectively; the number of iterations is 300; and the learning rate is 0.003. The Hanning window with a window length of 4500 was selected to perform short-time Fourier transform on 1000 training samples of shaking protection net, knocking protection net, and crossing guard fence, and then the obtained binary figure was used as a random training set to calculate the training loss value. By comparing the loss value, we could effectively test the false alarm of this method. The results are shown in Figure 9.
According to Figure 9, when the number of iterations reached 300, the average loss value of the method in reference [4] method was1.63, that of the method in reference [5] method was0.8, and that of the proposed method was0.35. It can be seen that the iterative loss of the proposed method was smaller, and the convergence efficiency and fluctuation degree of the proposed method were better than those of reference [4] method and reference [5] method. This was because the proposed method can adjust the ratio of main lobe and side lobe, reduce the leakage of energy spectrum, have better time resolution, retain more image features, and reduce the false alarm rate of intrusion signal.
5.4. Comparison of Intrusion Event Recognition Efficiency
In intrusion signal recognition, in addition to the need to pay attention to recognition accuracy, there is also the need to pay attention to recognition time. The average training time, average recognition time, and average recognition rate of a single intrusion signal were taken as the evaluation indexes of intrusion event recognition efficiency. The differences of input data formats of different methods under the same dataset under three different evaluation indicators were compared. The comparison results are shown in Table 2.
According to the data in Table 2, the recognition rate of the input format of the proposed method was14.9% and 17.1% higher than that of the reference [4] method and reference [5] method. This was because the intrusion signals of the proposed method had non-stationary characteristics, and the recognition degree between signals was easily interfered with by external noise; moreover, the frequency and energy distribution of intrusion signals had good regularity and they were easily extracted by convolution neural network. According to the average training time per step and the average recognition time, the average training time of the proposed method input was0.59s and 0.24s higher than that of the reference [4] method and reference [5] method, respectively. The average recognition time of the proposed method input was0.17s and 0.09s higher than that of the reference [4] method and the reference [5] method, respectively. It can be seen that the proposed method significantly improved the identification efficiency of intrusion events.
5.5. Response Sensitivity Comparison of Intrusion Events
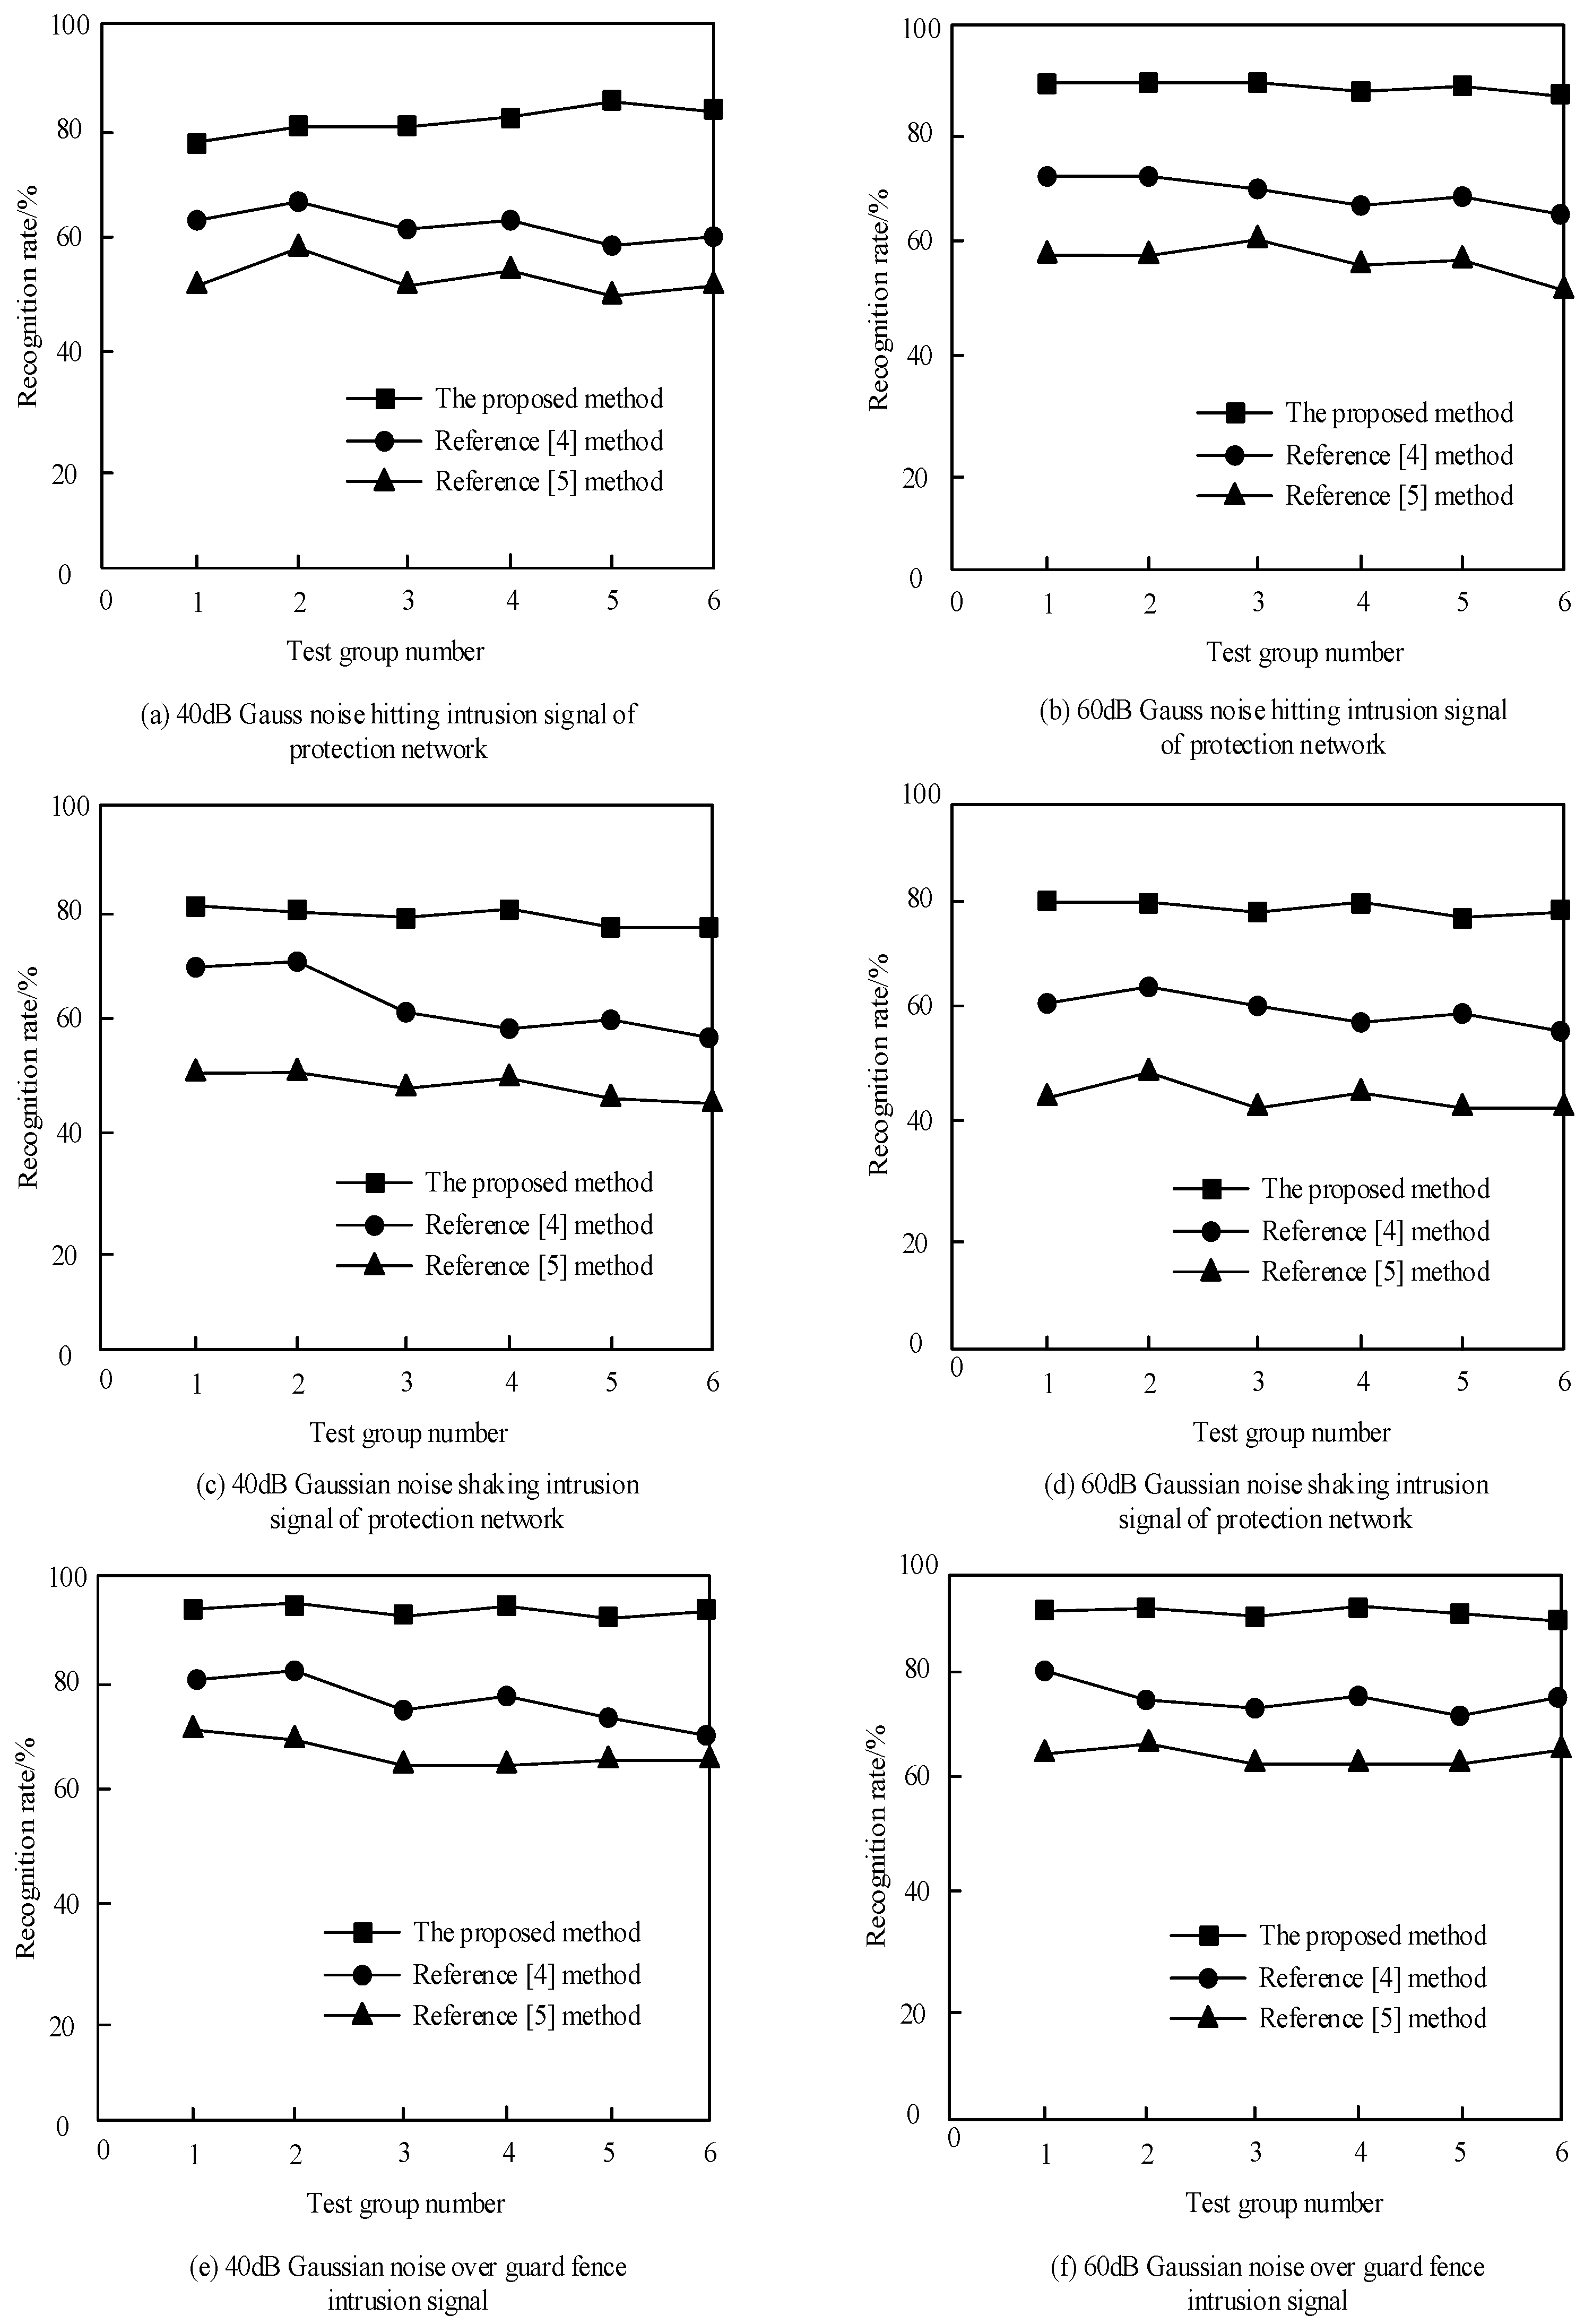
In the warning events of intrusion events in the perimeter defense area, the intrusion signals often contain different levels of noise due to the influence of external environment noise. In this case, the recognition rate of intrusion events is quite different. In order to verify the response sensitivity of the proposed method to external environmental noise, we compared the method of reference [4], the method of reference [5], and the proposed method. We added 40 dB and 60 dB Gaussian noise to 1000 intrusion signals, such as rocking protective net, knocking protective net, and crossing guard fence, and divided them into six groups. The comparison results are shown in Figure 10.
According to the analysis of Figure 10, under the condition of 40 dB gauss noise hitting intrusion signal of protection network in Figure 10a and 60 dB gauss noise hitting intrusion signal of protection network in Figure 10b, under the condition of 40 dB gaussian noise shaking intrusion signal of protection network in Figure 10c and 60 dB gaussian noise shaking intrusion signal of protection network in Figure 10d, under the 40 dB gaussian noise over guard fence intrusion signal in Figure 10e and the 60 dB gaussian noise over guard fence intrusion signal in Figure 10f, the recognition rate of the proposed method is higher than that of the methods in reference [4] and reference [5]. It can be seen from Figure 10 that as the signal-to-noise ratio increased, the intrusion signal recognition rate of the proposed method continuously increased from 80.3% to 83.42%, and finally stabilized at 90.26% as the signal-to-noise ratio increased. This was mainly because most of the energy of the percussion signal is concentrated in a certain period of time, and it is more sensitive to external noise. The proposed method uses the robustness of the convolutional neural network to increase the types and quantities of intrusion signals with different Gaussian noises. Further, it extracts more time–frequency characteristics of intrusion signals in harsh environments, so as to obtain a higher recognition rate. For the proposed method, the intrusion signal recognition rate of the shaking protection net was stable at 80.56%, and it did not increase with the increase of the signal-to-noise ratio. This was due to the influence of low-frequency white noise on the intrusion signal of the rocking protection network, and the energy distribution became more uniform, which made the characteristics of the spectrum closer to the characteristics of the external environment. Finally, the recognition rate of the swaying protection network intrusion signal did not increase with the increase of the signal-to-noise ratio. The recognition rate of the intrusion signal was stable at 96.86%. This was because the energy distribution of the intrusion signal over the fence was in the low-frequency characteristic section, and it was not sensitive to the impact of external noise. Therefore, the recognition rate did not change significantly with the increase of the signal-to-noise ratio of Gaussian noise. Thus, the proposed method had higher sensitivity to intrusion events.
6. Conclusions
In this paper, the pattern recognition method of grating perimeter intrusion behavior based on deep learning method was proposed, which can give full play to the advantages of an optical fiber perimeter security system. It can automatically identify the vibration signals of rocking protection net, knocking protection net, and crossing guard fence. The intrusion signal recognition accuracy and efficiency of the proposed method are high, which greatly reduces the false alarm rate of intrusion signals and improves the overall stability of the system. However, in the process of model recognition, there were afew kinds of optical fiber vibration signals collected in this paper, which may lead to the limitation of intrusion behavior detection and determination. Therefore, in the next study, it is necessary to extend the recognition of other kinds of signals.
Author Contributions
Conceptualization, X.L.; Data curation, S.X.; Formal analysis, X.H. All authors read and approved the final manuscript.
Funding
This work was supported in part by National Natural Science Foundation of China under Grant, Research on Text Deep Cluster Ensemble based on Point-Cluster-Partition Three-Layer Architecture, NO:62076215.
Institutional Review Board Statement
Not applicable.
Informed Consent Statement
Not applicable.
Data Availability Statement
All data generated or analysed during this study are included in this published article.
Conflicts of Interest
The authors declare no conflict of interest.
References
- Marques, C.; Webb, D.; Andre, P. Polymer optical fiber sensors in human life safety. Opt. Fiber Technol. 2017, 36, 144–154. [Google Scholar] [CrossRef] [Green Version]
- Carlos, M.; Andreas, P.G.; Khan, D. Fast Bragg Grating Inscription in PMMA Polymer Optical Fibres: Impact of Thermal Pre-Treatment of Preforms. Sensors 2017, 17, 891. [Google Scholar]
- Leal-Junior, A.G.; Avellar, L.; Frizera, A.; Marques, C. Smart textiles for multimodal wearable sensing using highly stretchable multiplexed optical fiber system. Sci. Rep. 2020, 10, 1–12. [Google Scholar] [CrossRef] [PubMed]
- Wang, N.; Fang, N.; Wang, L. Intrusion recognition method based on echo state network for optical fiber perimeter security systems. Opt. Commun. 2019, 451, 301–306. [Google Scholar] [CrossRef]
- Qu, H.; Yuan, S.; Wang, Y.; Yang, D. Stress reaction process-based hierarchical recognition algorithm for continuous intrusion events in optical fiber prewarning system. Opt. Eng. 2018, 57, 046112. [Google Scholar] [CrossRef]
- Kim, S.H.; Lim, S.-C.; Kim, D.Y. Intelligent intrusion detection system featuring a virtual fence, active intruder detection, classification, tracking, and action recognition. Ann. Nucl. Energy 2018, 112, 845–855. [Google Scholar] [CrossRef]
- Liu, D.; Yue, S. Event-Driven Continuous STDP Learning with Deep Structure for Visual Pattern Recognition. IEEE Trans. Cybern. 2018, 49, 1377–1390. [Google Scholar] [CrossRef] [PubMed]
- Wang, J.Y.; Cai, J.Y. Research on modelling vehicle safety lane-changing timing decision based on RBF Neural Network. J. Chongqing Inst. Tech. 2019, 33, 47–51. [Google Scholar]
- Xu, L.; Cao, Z.; Ma, R.-L.; Wang, Z.; Qin, Q.; Liu, E.; Su, B. Visualization of Latent Fingermarks by Enhanced Chemiluminescence Immunoassay and Pattern Recognition. Anal. Chem. 2019, 91, 12859–12865. [Google Scholar] [CrossRef] [PubMed]
- Lu, J.; Wang, R.; Mian, A.; Kumar, A.; Sarkar, S. Distance metric learning for pattern recognition. Pattern Recognit. 2018, 75, 1–3. [Google Scholar] [CrossRef]
- Talaat, N.; Tillmann, H.L. Injury pattern recognition to discriminate competing causes of liver injury. Liver Int. 2019, 39, 821–825. [Google Scholar] [CrossRef] [PubMed]
- Feller, D.J.; Marissa, B.; Levine, M.E.; Smaldone, A.; Davidson, P.G.; Albers, D.J.; Mamykina, L. A visual analytics approach for pattern-recognition in patient-generated data. J. Am. Med. Inform. Assoc. 2018, 25, 1366–1374. [Google Scholar] [CrossRef] [PubMed]
- Chatterjee, S.; Matthew, R.L. Reordered (Sorted) Spectra. A Tool for Understanding Pattern Recognition Entropy (PRE) and Spectra in General. Bull. Chem. Soc. Jpn. 2018, 91, 824–828. [Google Scholar] [CrossRef]
- Kim, H.; Hwang, S.; Park, J.; Yun, S.; Lee, J.B.; Park, B.G. Spiking Neural Network Using Synaptic Transistors and Neuron Circuits for Pattern Recognition with Noisy Images. IEEE Electron Device Lett. 2018, 39, 630–633. [Google Scholar] [CrossRef]
- Schütz, N.; Leichtle, A.; Riesen, K. A comparative study of pattern recognition algorithms for predicting the inpatient mortality risk using routine laboratory measurements. Artif. Intell. Rev. 2018, 52, 2559–2573. [Google Scholar] [CrossRef]
- Fernández-Pousa, C.R. Perfect phase-coded pulse trains generated by Talbot effect. Appl. Math. Nonlinear Sci. 2018, 3, 23–32. [Google Scholar] [CrossRef] [Green Version]
- Li, W.; Wu, T.; Wang, W.; Zhai, P.; Guan, J. Broadband patterned magnetic microwave absorber. J. Appl. Phys. 2014, 116, 044110. [Google Scholar] [CrossRef]
Figure 1.
Structure of optical fiber perimeter security system.

Figure 2.
Structure of optical fiber perimeter security system based on Sagnac optical fiber interferometer.
Figure 2.
Structure of optical fiber perimeter security system based on Sagnac optical fiber interferometer.

Figure 3.
Structure of Michelson fiber interferometer.

Figure 4.
Structure diagram of Mach–Zehnder fiber interferometer.

Figure 5.
Structure diagram of fiber perimeter security system based on Mach–Zehnder fiber interferometer.
Figure 5.
Structure diagram of fiber perimeter security system based on Mach–Zehnder fiber interferometer.

Figure 6.
Optical fiber perimeter system design architecture.

Figure 7.
Convolution neural network structure.

Figure 8.
The amplitude of the intrusion vibration signal after noise reduction.

Figure 9.
Iterative loss graph of different methods when the Hanning window length is 4500.

Figure 10.
Comparison results of the recognition rate of intrusion signals with different methods under different levels of Gaussian noise.
Figure 10.
Comparison results of the recognition rate of intrusion signals with different methods under different levels of Gaussian noise.


Publisher’s Note: MDPI stays neutral with regard to jurisdictional claims in published maps and institutional affiliations. |
© 2021 by the authors. Licensee MDPI, Basel, Switzerland. This article is an open access article distributed under the terms and conditions of the Creative Commons Attribution (CC BY) license (http://creativecommons.org/licenses/by/4.0/).
Share and Cite
MDPI and ACS Style
Li, X.; Xu, S.; Hua, X. Pattern Recognition of Grating Perimeter Intrusion Behavior in Deep Learning Method. Symmetry 2021, 13, 87. https://doi.org/10.3390/sym13010087
AMA Style
Li X, Xu S, Hua X. Pattern Recognition of Grating Perimeter Intrusion Behavior in Deep Learning Method. Symmetry. 2021; 13(1):87. https://doi.org/10.3390/sym13010087
Chicago/Turabian StyleLi, Xianfeng, Sen Xu, and Xiaopeng Hua. 2021. "Pattern Recognition of Grating Perimeter Intrusion Behavior in Deep Learning Method" Symmetry 13, no. 1: 87. https://doi.org/10.3390/sym13010087
Note that from the first issue of 2016, this journal uses article numbers instead of page numbers. See further details here.