Article

Characterization of Insulin Mucoadhesive Buccal Films: Spectroscopic Analysis and In Vivo Evaluation

1
School of Pharmacy, University of Jordan, Amman 11942, Jordan
2
Al-Taqaddom Pharmaceutical Industries, Amman 11947, Jordan
3
Faculty of Pharmacy, Philadelphia University, Amman 19392, Jordan
4
Diamond Light Source Ltd., Harwell Science and Innovation Campus, Didcot OX11 0DE, Oxfordshire, UK
5
Faculty of Pharmacy and Medical Sciences, Petra University, Amman 11196, Jordan
*
Author to whom correspondence should be addressed.
Corresponding author for the FTIR part.
Symmetry 2021, 13(1), 88; https://doi.org/10.3390/sym13010088
Submission received: 21 November 2020 / Revised: 24 December 2020 / Accepted: 30 December 2020 / Published: 6 January 2021
(This article belongs to the Special Issue Symmetric and Asymmetric Structure in Drug Design and Biomolecules)

Abstract

:
Insulin mucoadhesive buccal films (MBF) are a noninvasive insulin delivery system that offers an advantageous alternative route of administration to subcutaneous injection. One major concern in the formulation of insulin MBF is the preservation of an insulin secondary structure in the presence of the other film components. Buccal films were formulated using chitosan, glycerin, and L-arginine. The MBF-forming solutions (MBF-FS) and the films (MBF) were examined for their chemical and structural stability and for their in vivo activity. Enzyme-Linked Immunosorbent Assay (ELISA) of the insulin-loaded MBF showed that each individualized unit dose was at least loaded with 80% of the insulin theoretical dose. Results of Synchrotron Radiation Circular Dichroism (SRCD) measurements revealed that MBF-FS retained the α-helices and β–sheets conformations of insulin. Fourier transform infrared (FTIR)-microspectroscopy (FTIR-MS) examination of insulin MBF revealed the protective action of L-arginine on insulin structure by interacting with chitosan and minimizing the formation of an unordered structure and β-strand. A blood glucose-lowering effect of insulin MBF was observed in comparison with subcutaneous (S.C) injection using a rat model. As a result; chitosan-based MBFs were formulated and characterized using SRCD and FTIR-MS techniques. Furthermore, the results of in vivo testing suggested the MBFs as a promising delivery system for insulin.

1. Introduction

Insulin is the main therapeutic agent for the treatment for type I diabetes and many advanced cases of type 2 patients [1]. The conventional way to supply the body with insulin is through subcutaneous or intravenous injections, but these methods have drawbacks, as around 60% of patients fail to achieve glycemic control in the long-term as a result of non-compliance due to the invasive nature of injectable route of administration. On the other hand, alternative routes such as orally administered insulin can be easily degraded in the gastrointestinal tract [2]. However, mucoadhesive buccal films (MBF) are considered as attractive drug delivery systems in spite of the formulation and delivery challenges. The permeability-limiting properties of the buccal mucosa were addressed by the inclusion of additives such as chitosan [3] and L-arginine [4,5], which were incorporated in the MBF to enhance delivery. The physiologically active form of human insulin monomer is less stable than the higher associated forms, and it is subjected to form amyloid fibril-aggregates under different formulation conditions [6]. Long time ago, molecular symmetry was found central to the arrangement of the commonly existing insulin dimers and hexamers [7,8], and correlation of such arrangements with biological activity of insulin was studied [9]. In addition, MBF components as well as the preparation methodology might lead to changes in the insulin secondary structure, including disturbance of molecular symmetry. L-arginine is known to suppress insulin aggregation, and it widely used as a stabilizing agent against insulin aggregation [10,11]. Changes in insulin secondary structure can be examined using spectroscopy methods such as circular dichroism and infrared spectroscopy. Circular dichroism is a powerful technique used for the examination of conformational changes that might take place in peptides and proteins as a function of environment factors such as temperature, chemical agents, pH, and aging [12,13,14]. Infrared vibrational circular dichroism (VCD) is used for the investigation of insulin fibril structure. The method is sensitive to the fibril type and can distinguish between normal and reversed fibril that are produced in response to different pH values [15] or solvents [16]. Native insulin shows a characteristic positive band at 193 nm and double negative at 208 and 222 nm that are indicative of the amount of the alpha and beta conformations [11,12,13]. Pocker et al. [17] obtained the circular dichroism spectrum for bovine insulin at pH7, the calculated percentages of alpha helix, beta sheets, and the unordered were 40, 18, and 42% respectively. Provencher et al. [18] reported slightly different values for alpha helix (46%), beta sheets (27%), and unordered (27%); these values were described to be comparable to those obtained using X-ray crystallography. Synchrotron radiation circular dichroism (SRCD) offers additional advantages compared to the conventional instruments [19,20,21]. The increased intensity of a synchrotron radiation light source makes it possible to obtain higher signal-to-noise ratios implying smaller sample requirements, in addition to the rapid measurements and the possibility of examining samples in the presence of high concentrations of buffers and other absorbing components [21].
Another biophysical technique; infrared spectroscopy, offers a valuable tool for studying the secondary structures of proteins, particularly in the solid state. Proteins exhibit characteristic spectral features in the amide I and amide II regions. The amide I peak at 1650 cm−1 arises mainly from the C=O stretching of amide groups, whereas the amide II peak at 1550 cm−1 arises from N–H bending and C-N stretching vibrations of amide groups of the peptide backbone in proteins. In particular, the amide I peak is sensitive to the protein secondary structure [22,23,24,25,26]. Recently, Delbeck et al. [27] reported the application of Fourier transform infrared (FTIR) spectroscopy as a fast and reliable approach for monitoring changes in the secondary structure of insulin within commercial formulations. Lannuzzi et al. and Martinez-Lopez et al. described the role of the FTIR technique in the monitoring of the formation of β-sheets structure as an indicator for insulin aggregation [11,28]. FTIR-microspectroscopy (FTIR-MS) is an imaging technique that allows the acquisition of a large number of spectra for each tested sample. The data acquired are subjected to multivariate statistical analysis and the principal component analysis (PCA), which permits reliable analysis of the spectra.
The present study aims to examine the secondary structure of insulin loaded in MBF-FS and MBF using in vitro techniques; mainly SRCD and FTIR-MS in addition to the in vivo evaluation of insulin activity in the MBF using a rat model.

2. Materials and Methods

2.1. Materials

Insulin was purchased from SAFC Biosciences Inc. (Lenexa, KS, USA). Chitosan 1500 Da and Chitosan 13,000 Da (deacetylation 95% and viscosity 11 cP) were purchased from GTC Union Group Ltd. (Qingdao, Shandong, China). L-arginine was purchased from BDH Laboratory Supplies (Poole, England), and glycerin was purchased from Gainland chemical co. (Clwyd, UK).Glacial acetic acid was purchased from Surchem products LTD (Ipswich, UK). Ketamine was purchased from Hikma Pharmaceuticals (Amman, Jordan) and Xylazine hydrochloride was purchased from Tokyo Chemical Industry CO., LTD (Tokyo, Japan). Sodium carbonate anhydrous was purchased from Daejung Chemicals and Metals (Siheung-si, Gyeonggi-do, Korea), and phosphate buffer saline was purchased from EurocloneS.p.A. (Pero MI, Italy). Disodium hydrogen phosphate was purchased from BiochemChemopharma (Cosne-Cours-sur-Loire, France), and potassium dihydrogen phosphate was purchased from Scharlau (Barcelona, Spain). Sodium chloride was purchased from Sigma-Aldrich (Saint Louis, MO, USA), and phosphoric acid was purchased from Fischer Chemical Limited (Parsippany, NJ, USA).

2.2. Methods

2.2.1. Insulin MBF Preparation

Mucoadhesive buccal films (MBF) were formed from water-soluble chitosan grade of 1500 Da molecular weight (CH1500 Da) and a slightly water-soluble chitosan grade of molecular weight 13,000 Da (CH13,000 Da). The MBF-forming solution (MBF-FS) was prepared in two steps: the CH13,000 Da solution, which consists of 3% chitosan 13,000 Da, 30% glycerin (based on dry weight of chitosan), and 10% L-arginine (based on dry weight of chitosan) was dissolved in 2% acetic acid using the homogenizer and mixed for 2 to 3 min followed by sonication for up to 5 min. The CH1500 Da solution of 6% chitosan 1500 Da, 15% glycerin (based on dry weight of chitosan), and10% L-arginine (based on dry weight of chitosan) was dissolved in 2% acetic acid by stirring the components in a glass rod followed by sonication for up to 10 min. Then, both solutions were combined at a ratio of 2 CH13,000 Da:1 CH1,00 Da (2:1). The pH of the final solution was adjusted using 2% acetic acid solution until a pH of 3.0–3.3 was obtained. For loaded films, an accurately weighed amount of human insulin powder was added to the solutions to produce the required insulin concentration. Similar protocols were used for the preparation of MBF-FS, which was further treated to prepare the MBF used for Enzyme-Linked Immuno-Sorbent Assay (ELISA), the in vivo experiments and for the FTIR-MS measurements. For SRCD measurements, the composition of the MBF-FS was slightly modified, where the concentration of chitosan 1500 Da was lowered to 3%, while the concentration of glycerin was raised to 30%, and the ratio between the two solutions was raised to 3 CH13,000 Da:1 CH1500 Da(3:1). This modification was necessary to make the film more transparent. Film casting and drying procedures were tailored for each application and will be described in the related sections.
In order to observe the effect of the film components at an insulin secondary structure, different formulations containing 0.57 mg/mL insulin were prepared, listed in Table 1, and examined using SRCD (as solutions and films) and FTIR-MS (as films).

2.2.2. Assay of Insulin Films Using ELISA

ELISA analysis was conducted using the Elecsys Insulin kit—Roche at AL-Mahabba Hospital located in Madaba, Jordan; it is a fast immunoassay for insulin measurement in serum samples without anti-insulin antibodies. The high precision of this method and relatively fast results are useful in insulin studies. This assay uses two monoclonal antibodies which together are specific for human insulin and is based on the Sandwich principle; the principle and steps of the assay are described in detail by Sapin et al. [29].
In this work, ELISA was applied to determine the insulin content of the MB films that were used in the in vivo experiments. In addition, ELISA was also applied to examine the effect of drying method on the content of insulin in MBF. The insulin content in films obtained by drying for 48 h at 2–8 °C in the fridge was compared with that obtained by drying at room temperature at about 25 °C for the same length of time. Fresh units of dose films were prepared by placing 0.3 mL of the loaded MBF-FS in the well of the aluminum foil tray (Figure 1B). The films were left to dry using both conditions. The trays containing the fully dried films were put in plastic bags and kept in the fridge for no more than 24 h.
On site, each film was dissolved in 10 mL of deionized water and subjected to ELISA measurements. A stock solution was prepared on site to establish a calibration curve by mixing a pre-weighted insulin powder with the same blank chitosan solution used to prepare the films followed by dilution with distilled water (DW) and then serial dilution in a concentration of 4–400 µ IU/mL using DW.

2.2.3. Preparation of Simulated Saliva Solution

Simulated saliva was prepared according to the method described by Marques et al. [30] where disodium hydrogen phosphate (2.382 g), potassium dihydrogen phosphate (0.190 g), and sodium chloride (8.0 g) were dissolved in one liter of distilled water, and the solution pH was adjusted to 6.85 using phosphoric acid.

2.2.4. SRCD Measurements

SRCD measurements in the far-UV region (190–260 nm) were conducted at Diamond Light Source, UK. The measurements were carried out for both solution and films either at constant temperature of 25 °C or while heating the solution from 20 °C up to 90 °C at 10 degrees intervals and cooling back to 20 °C.
Freshly prepared solutions were measured using a 0.1 mm demountable fused silica cuvette cell (Hellma, Essex, UK). Films were prepared by spreading 50µL of insulin solution on a fused silica window of 9 mm diameter and drying at room temperature for no more than 4 h. For each insulin solution or insulin film, the corresponding unloaded solution or film was measured to serve as baseline. The SRCD spectra were processed by subtracting the corresponding baselines and were reported in ∆ɛ (M−1cm−1). The insulin secondary structure was estimated from the SRCD results using the BeStSel algorithm [31].

2.2.5. FTIR-MS Measurements

For the FTIR-MS measurements, twenty microliters of solution were mounted on CaF2 windows (Crystran Ltd., Poole, Dorset, UK).The applied solution aliquots were dried, forming a film, for 60 min in a closed chamber purged with compressed dry air.
Measurement for each film was initiated immediately after preparation. The measurement was conducted at the IR laboratory of SESAME synchrotron (Jordan) using a ThermoNicolet 8700 spectrometer coupled with a continuum IR microscope and OMNIC 9.1 software (Thermo Fisher scientific, Wien, Austria). For each sample, an IR map was acquired using a double path single masking aperture size of 50 × 50 μm2 at a step size of 10 μm and a spectral resolution of 4 cm−1. For each spectrum, 256 repeated consecutive scans were recorded in transmission mode. The obtained IR maps were split into spectra using Omnic software.
FTIR-MS measurements were carried out for the films listed in Table 1 and for their unloaded equivalents. In addition, a single spectrum was obtained for each of the individual components of the MBF in order to be used in the data interpretation.
The resultant raw spectral sets (about 60 spectra for each unloaded film and 80 spectra for each loaded film) were processed in the spectral range corresponding to protein amide I using the Unscrambler 10.3 software (CAMOAnalytics, Oslo, Norway).The spectra were suitably smoothed and base line corrected. Savitsky–Golay second derivatives were calculated using third polynomial order and 9 smoothing points; then, they were range normalized. Principal component analysis (PCA) was performed on the processed spectral sets where the unit vector normalized average spectra and range normalized average Savitsky–Golay second-derivative spectra of the datasets were obtained. A representative raw spectrum for native insulin and its corresponding Savitsky–Golay second-derivative spectrum was also obtained using the same procedure utilizing diamond compression cells.

2.2.6. In-Vivo Evaluation

Ethical Statement

In-vivo experiments were conducted at Petra University Pharmaceutical Center, while the ethical approval (No.1/2018–2019) was obtained from the Deanship of Scientific Research, the University of Jordan.

Rats Handling, Feeding and Anesthesia

Forty Sprague–Dawley albino laboratory male rats (about 6–8 weeks old) weighing 211.1(±2.95) g were used in the study. The rats were placed in 4 cages, each cage containing 10 rats. The rats were left for 2 weeks to acclimatize. They were fed with regular high protein feed. Prior to the experiments, all rats were fasted overnight with free access to water until the initiation of the experiment. The rats were divided according to their insulin intake into 4 groups. Each group consisted of 10 rats, of which two rats were dropped by the end of the study. The dosing details for each group are given in Table 2.
In preparation for the experiment, the rats were individually anesthetized with ketamine (40 mg/kg) and xylazine (5 mg/kg) per rat weight [32] by two separate intramuscularinjections given to each thigh muscle of each rat. Zero-time measurements were taken 15 min post anesthesia. A single drop of blood was taken from the tail vein from each rat post-dosing at time intervals (0, 0.25, 0.5, 0.75, 1, 2, 3, 4, and 6 h) then at post feeding times at (7.0, 8.0, and 24.0 h). The 24 h sample served as an indication for the safety and reversibility of the given dosage forms and the used anesthetics agents as well as a confirmation for the zero point, which was then used in the calculations.

Dose Administration

Whenever MBFs were administered, an individualized MBF (unit dose) was cast for each rat using an aluminum foil tray (Figure 1B) in order to ensure dose uniformity. The MBF was folded in half and then cut into two halves with each half placed on one cheek and wetted with 50 µL of water. The subcutaneous insulin solution was freshly prepared by dissolving insulin powder in 1 mL of 0.1 N HCl and then diluted with distilled water. The MBF-FS was freshly prepared, and the insulin powder was added to give the required insulin content in the individual administered dose. For both subcutaneous (S.C) and MBF-FS, the dose volume was adjusted per weight of each rat, leading to a final dose of 2 IU/kg. The MBF-FS was administered in the buccal cavity, and the rat was placed on one side in order to reduce the chance of potential swallowing. The S.C dose was injected into the loose skin over the inter-scapular aria. Table 2 lists the composition of doses administered to the different animal groups. For all groups, blood samples were taken at the pre-set time intervals, and blood glucose was directly measured using Accu-Chek Performa® Blood Glucose Meter.

2.2.7. Statistical Treatment

Statistical analysis was carried out using free GraphPad software, and results were presented as mean ± SEM, while statistical significance was calculated using one-way analysis of variance (ANOVA) followed by post hoc tests (Tukey’s test) and tested at p < 0.05.

3. Results and Discussion

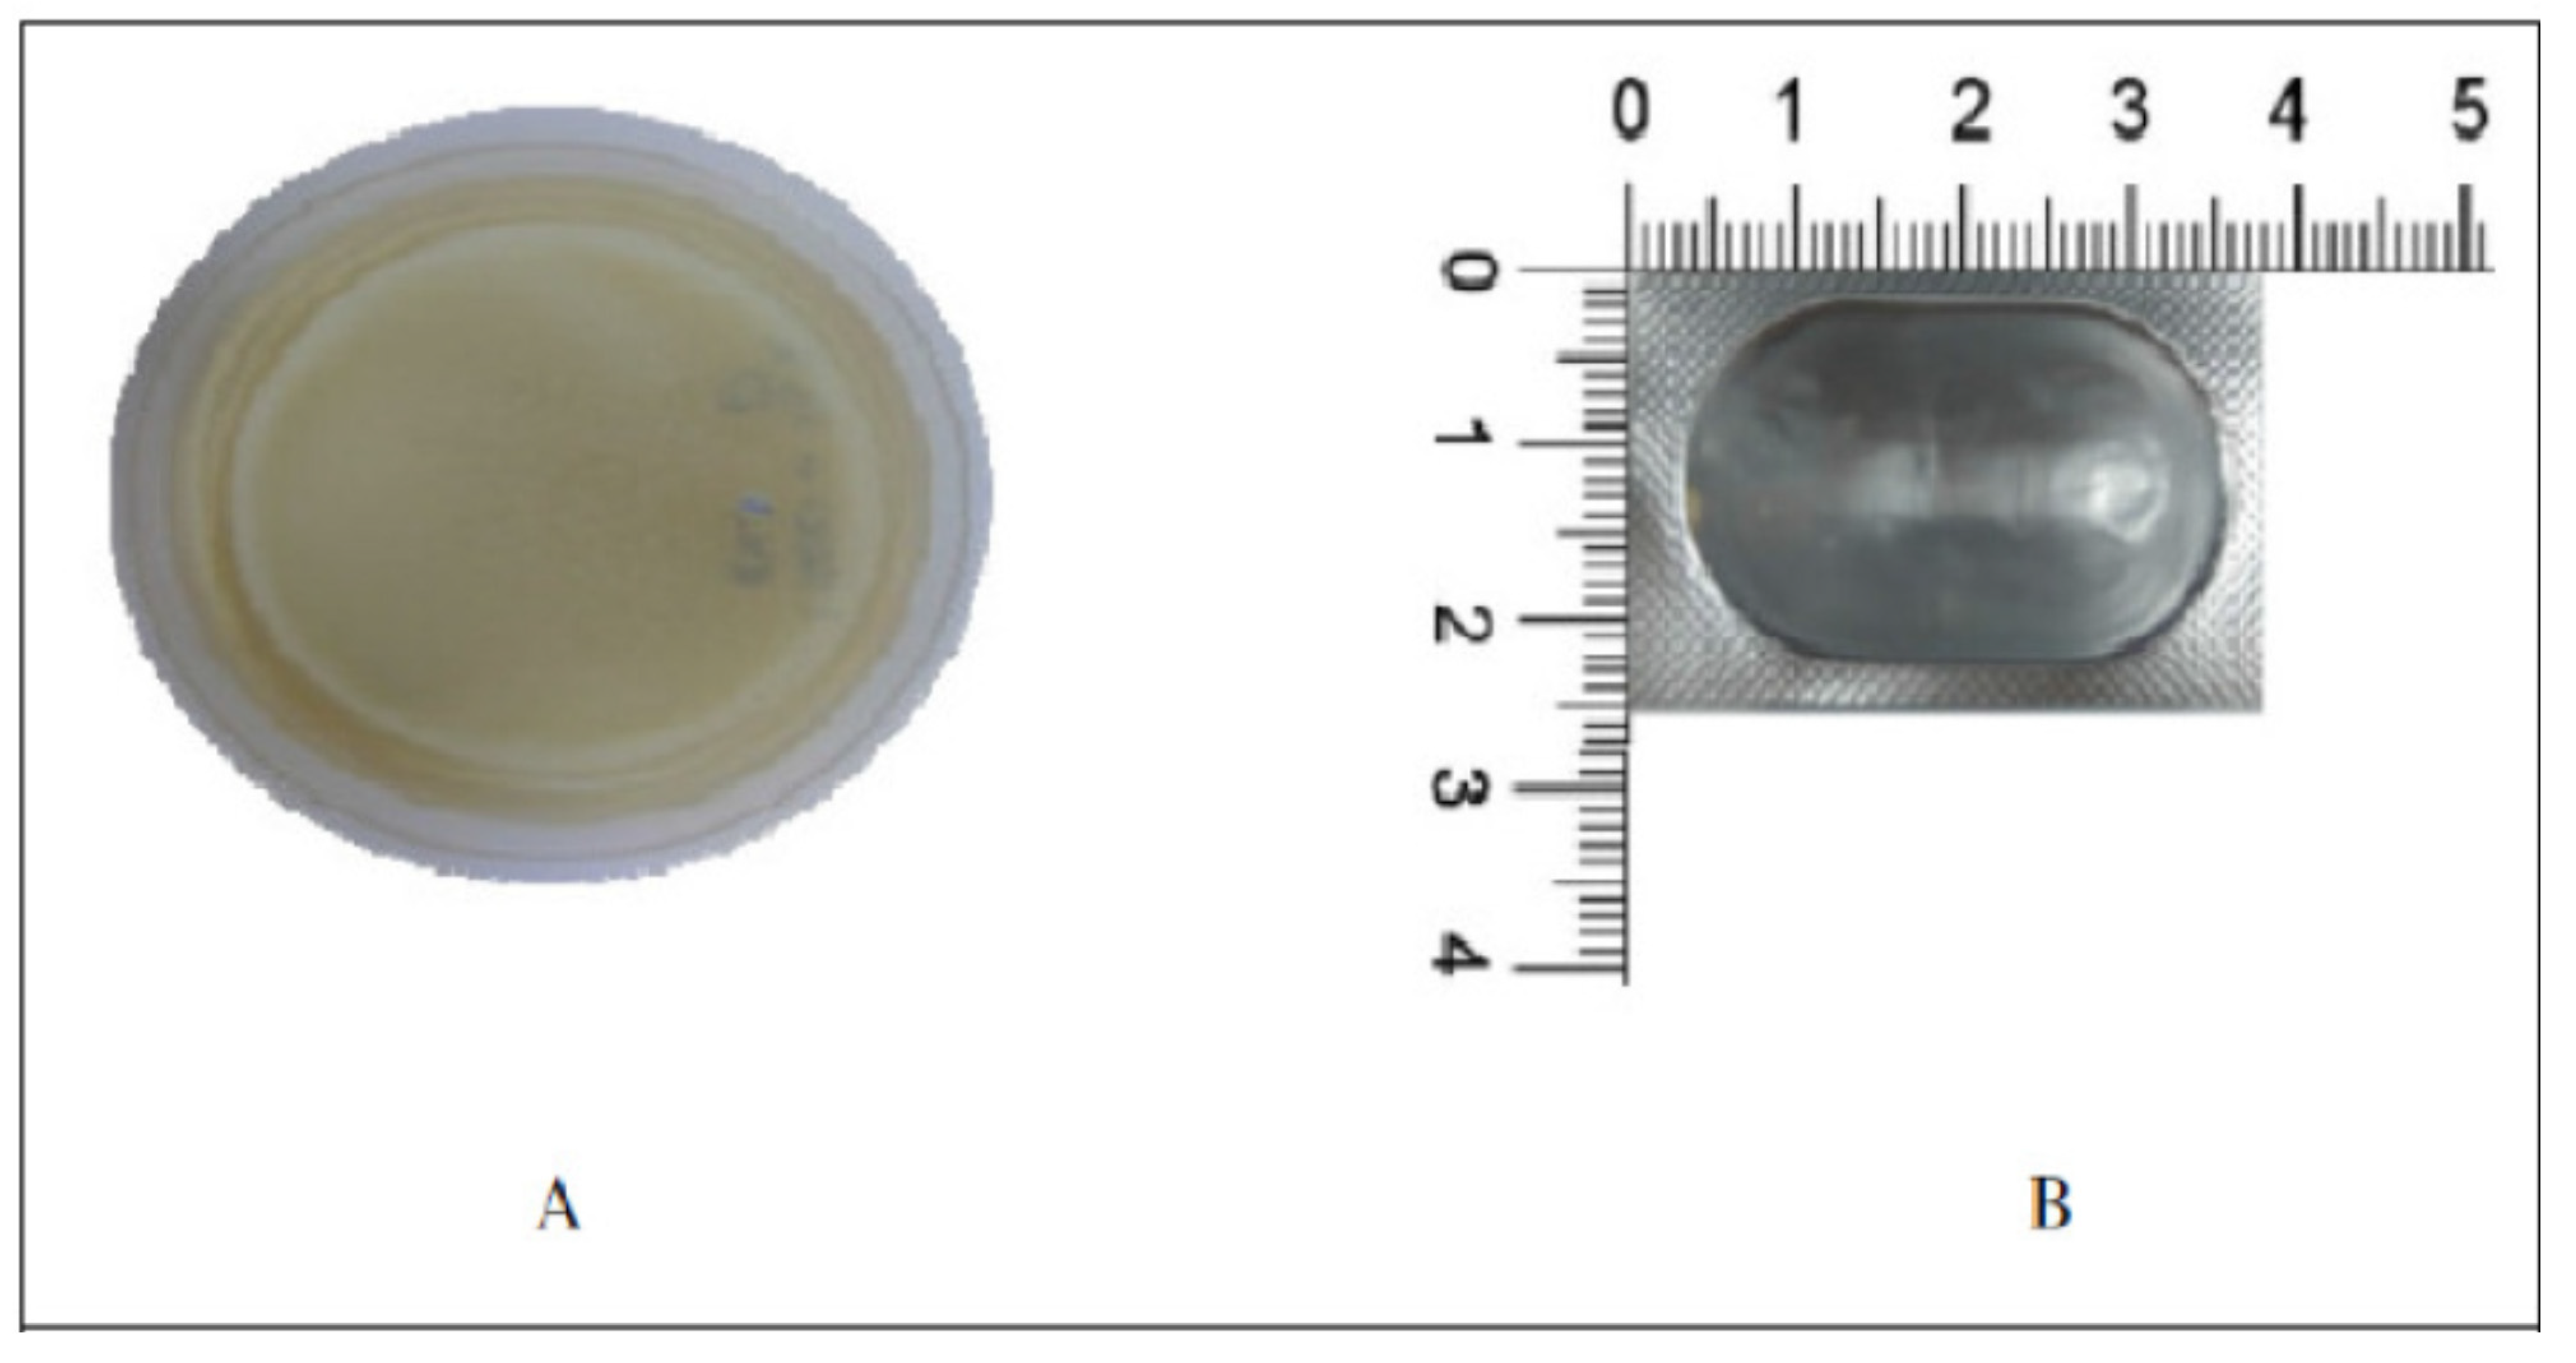
3.1. Insulin MBF Preparation

The quality of the MBF is affected by several factors including but not limited to chitosan grades and concentrations, solvent pH, and drying methods. Initially, two grades of chitosan were tested: water soluble (molecular weight 1500 Da) and slightly water soluble (molecular weight 13,000 Da).Distilled water and 2% acetic acid solutions were used as solvents, and their ratios were adjusted to produce pH values between 3.0 and 3.3. The films were also assessed in the presence and absence of additives such as glycerin, which was added as a plasticizer, and L-arginine, which was added as an insulin stabilizer and penetration enhancer [5]. Primary results indicated that films prepared using chitosan alone were mostly fragile with irregular consistency. The addition of glycerin and L-arginine produced flexible, peelable, and translucent films (Figure 1A). Consequently, the optimized MBF is composed of chitosan, glycerin, and L-arginine in proper proportions.

3.2. Assay of Insulin Films Using ELISA

The insulin content was calculated using the calibration equation:
Actual measured insulin concentration, μU/mL =0.523× theoretical insulin concentration, μU/mL +9.096 R2 = 0.998.
Compared to the theoretical loading, the insulin content of the MBF dried in the fridge and at room temperature was found to be 80% ± 3.95% (n = 6) and 59% ± 1.93% (n = 4) respectively, and the difference between the two drying methods was found to be significant (p = 0.0048). Consequently, films used in the in vivo experiments were dried in the fridge.

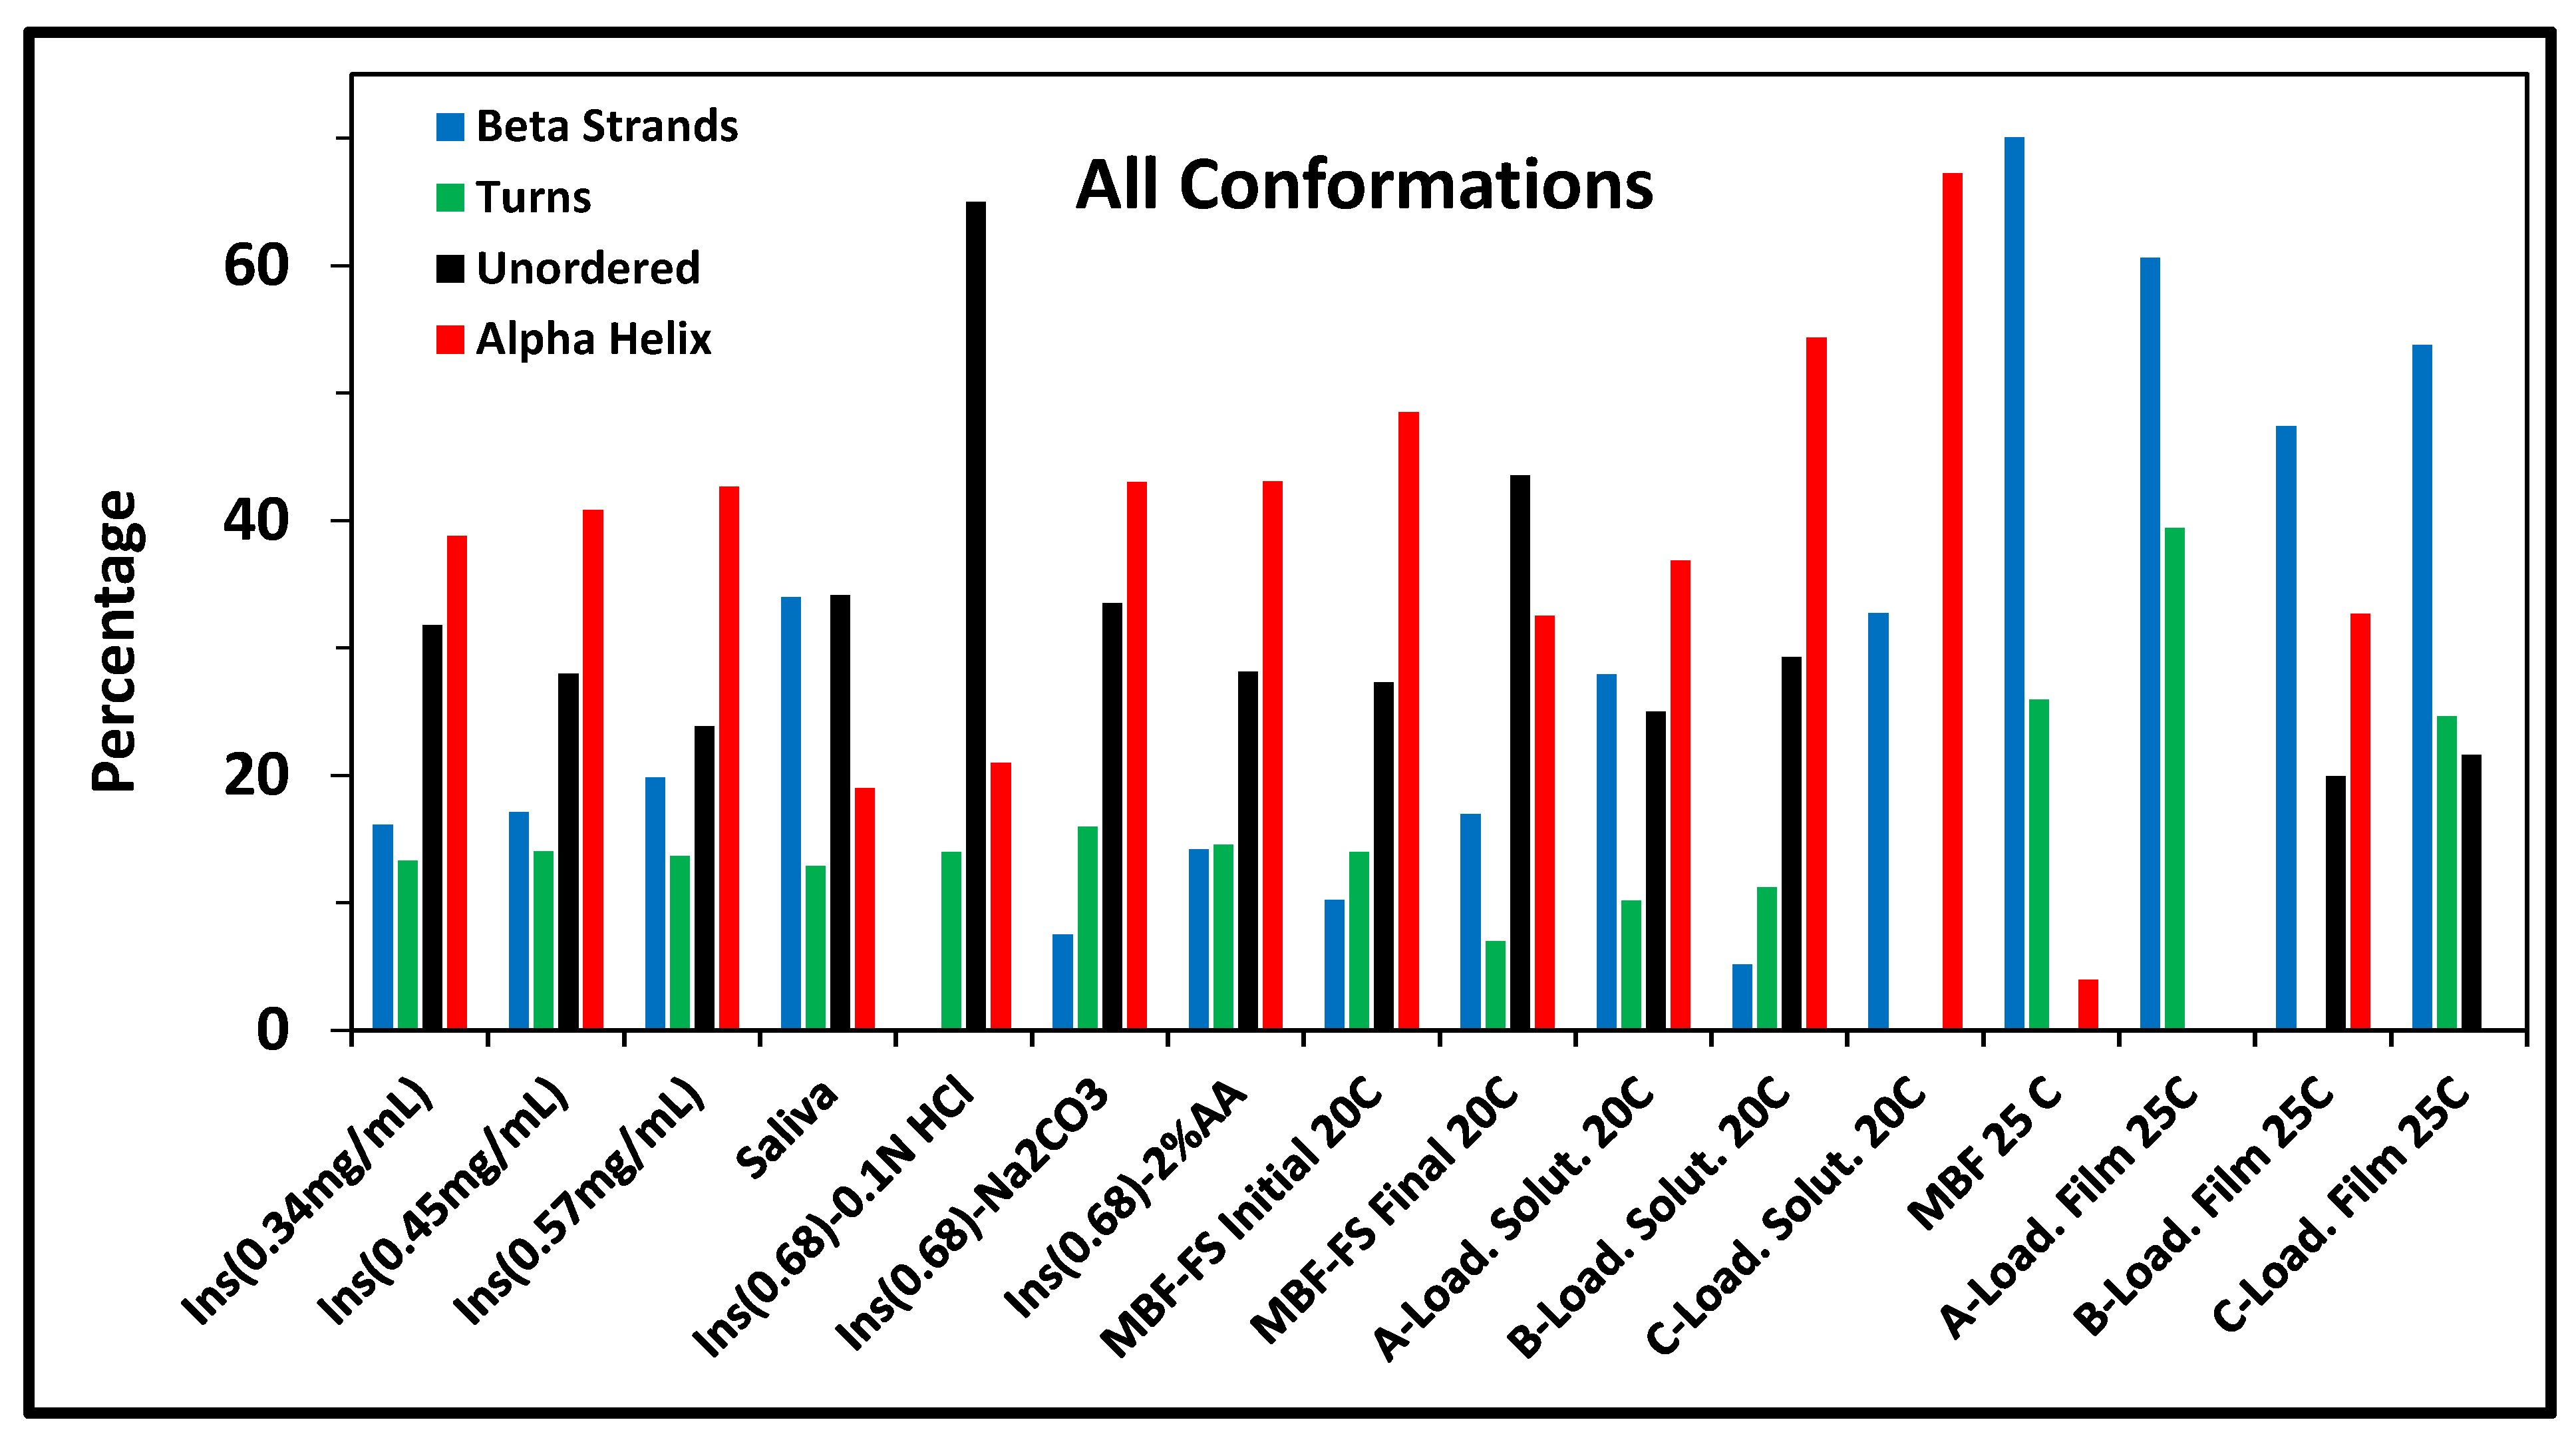
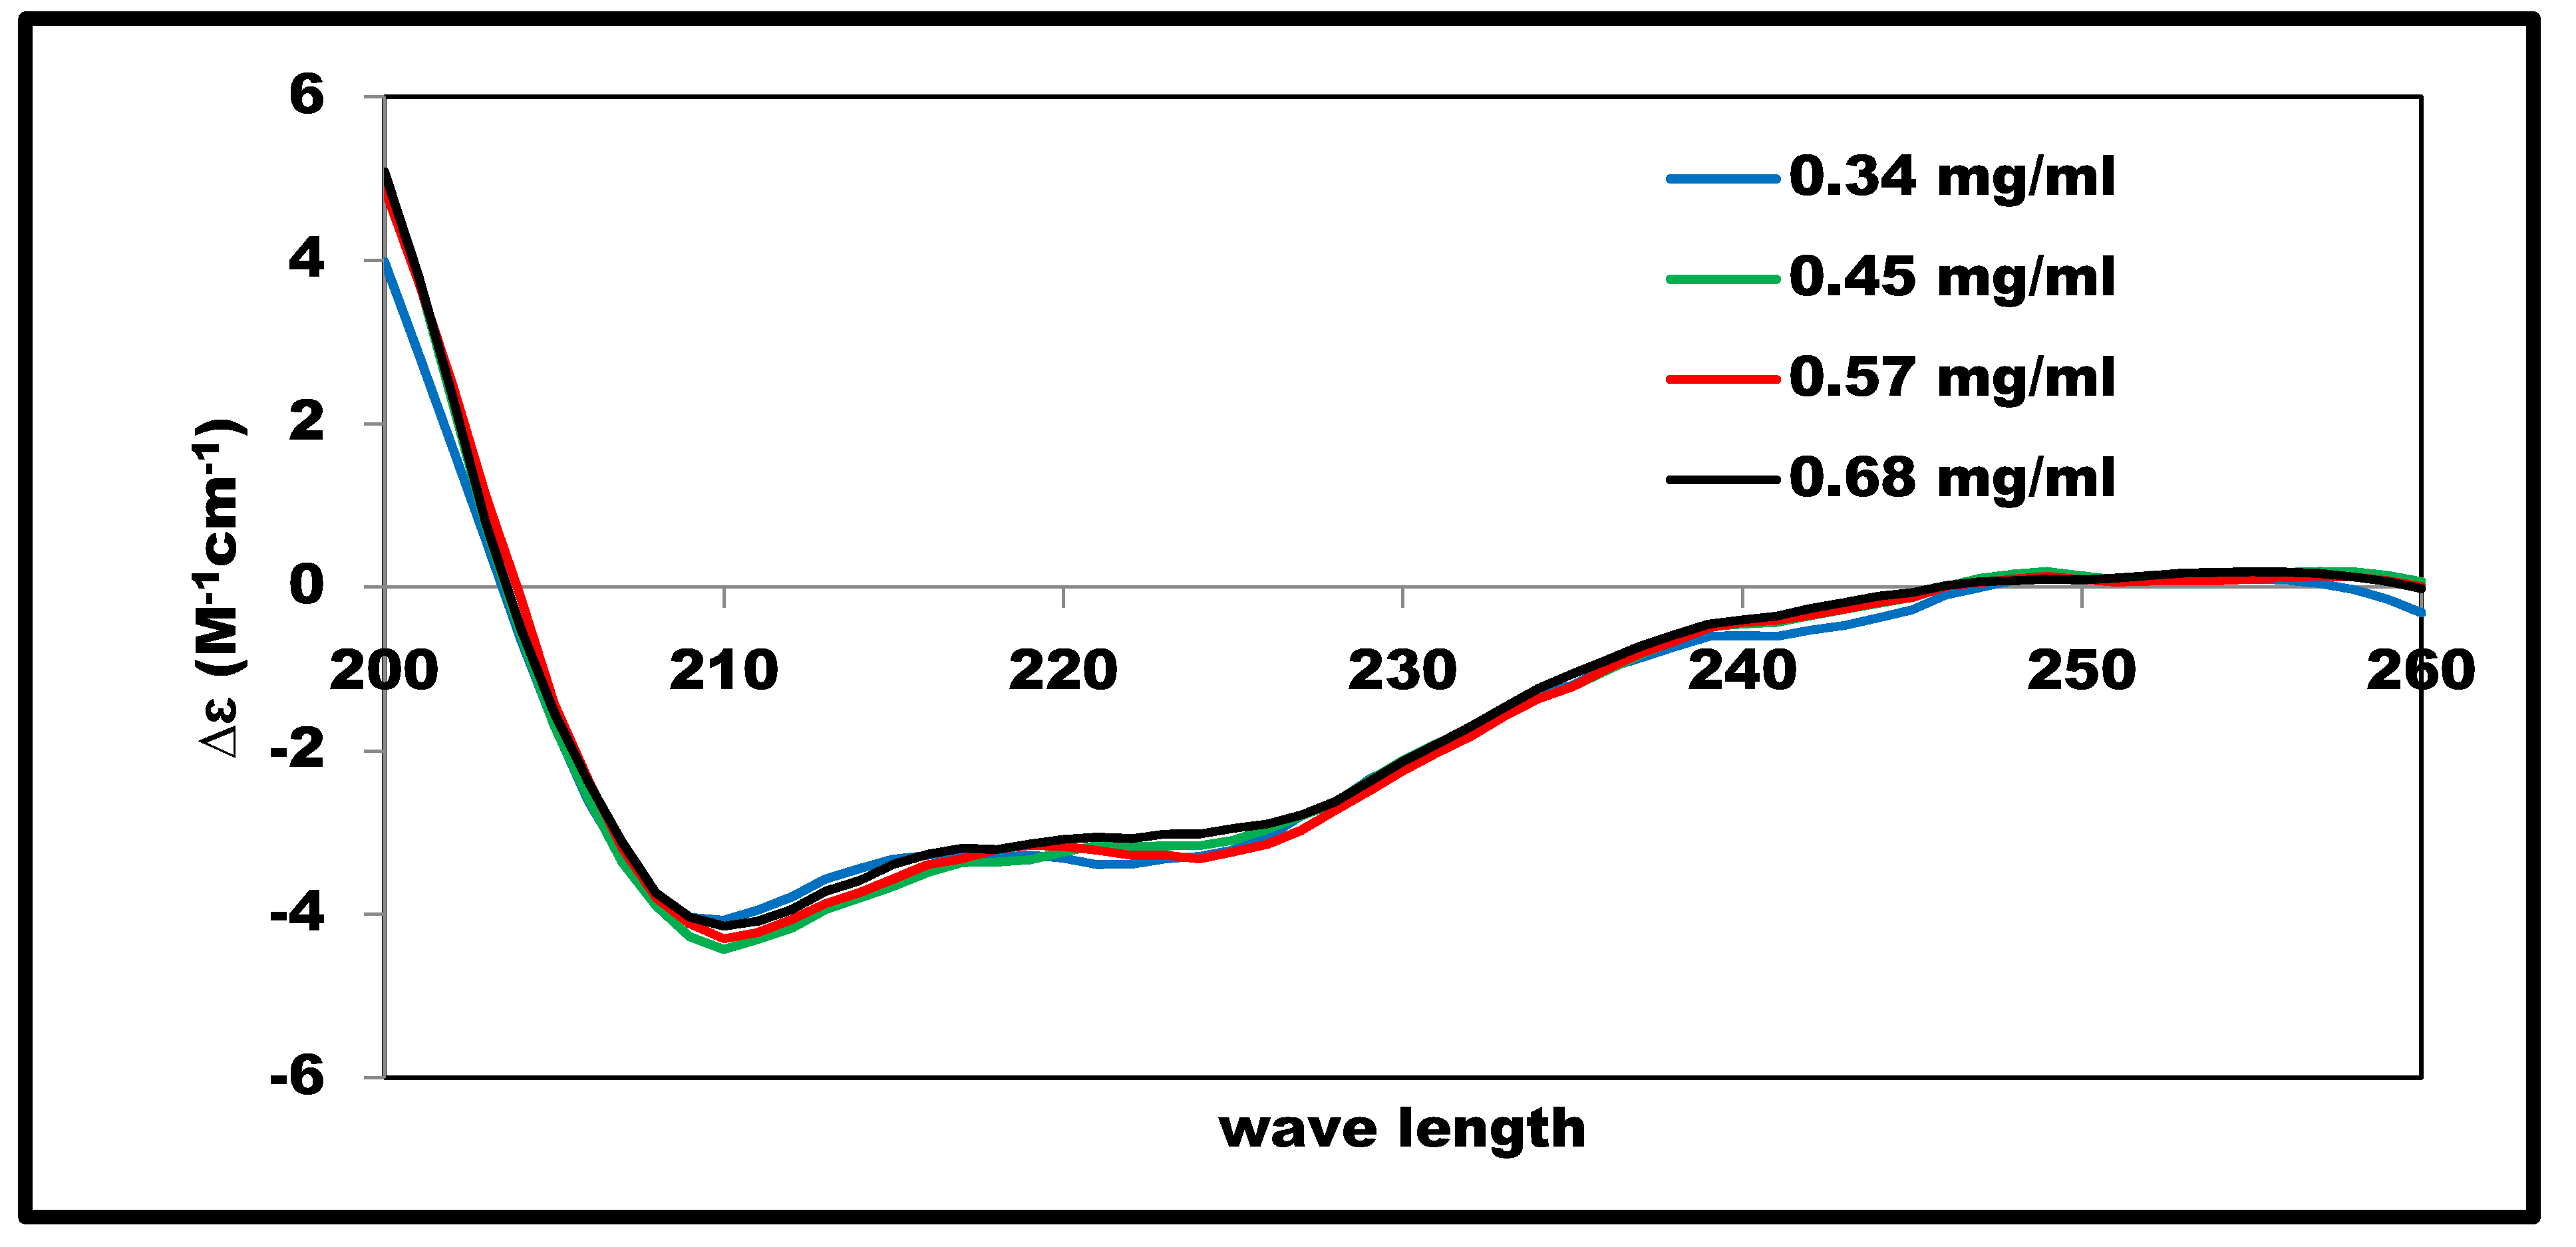
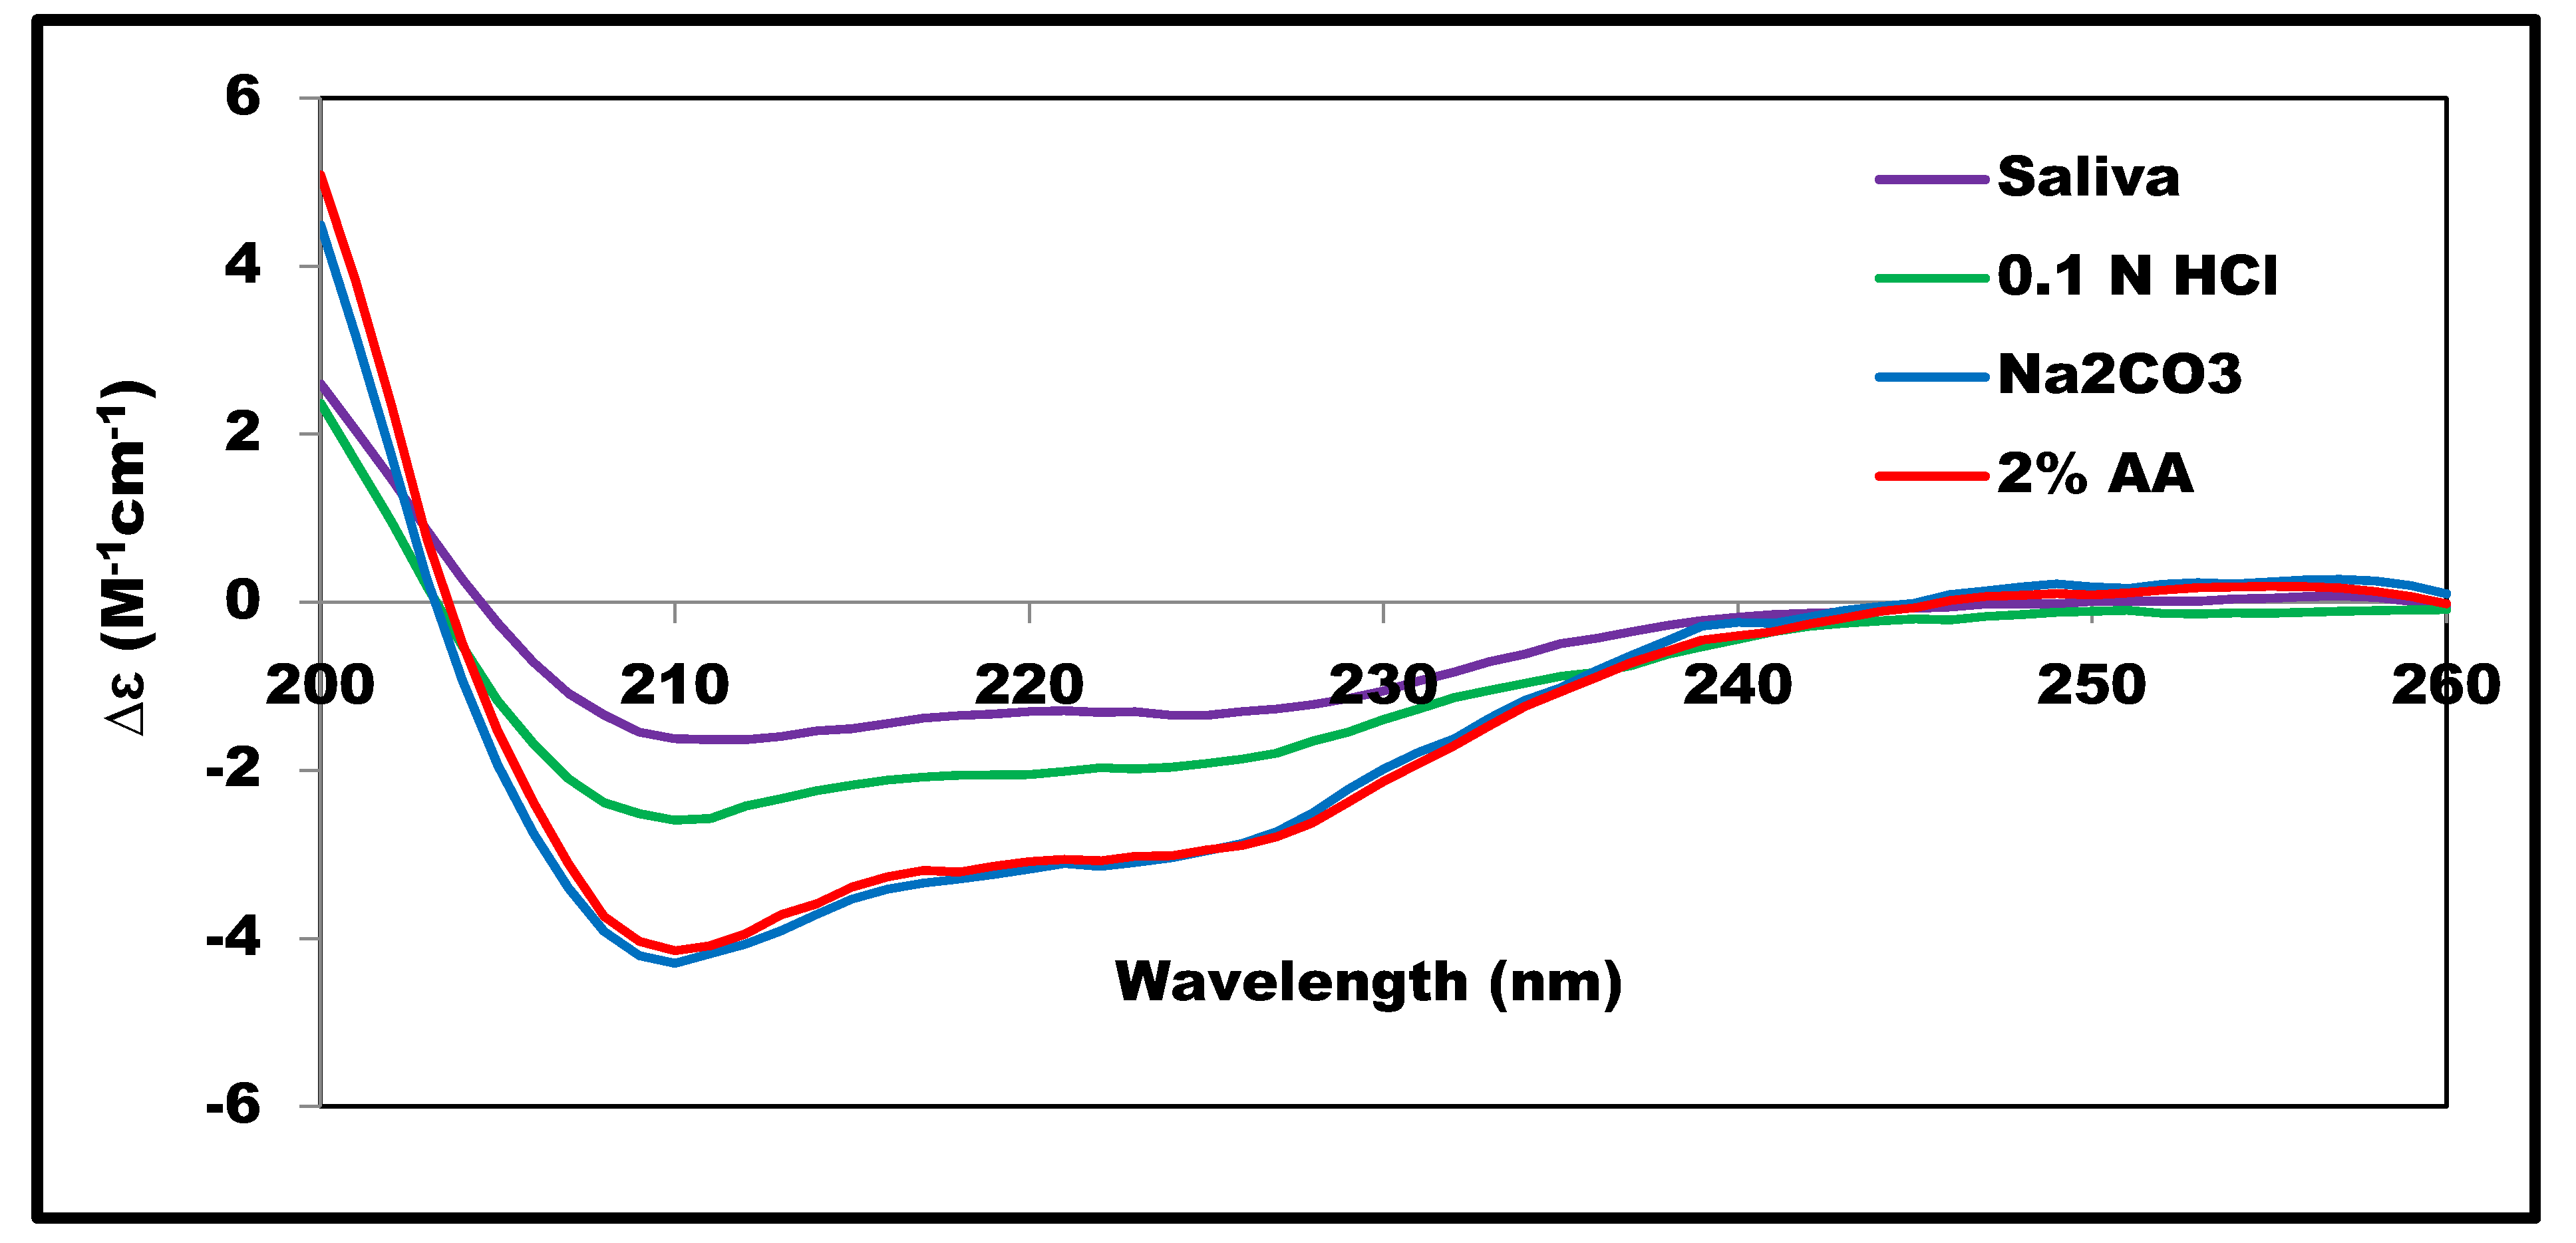
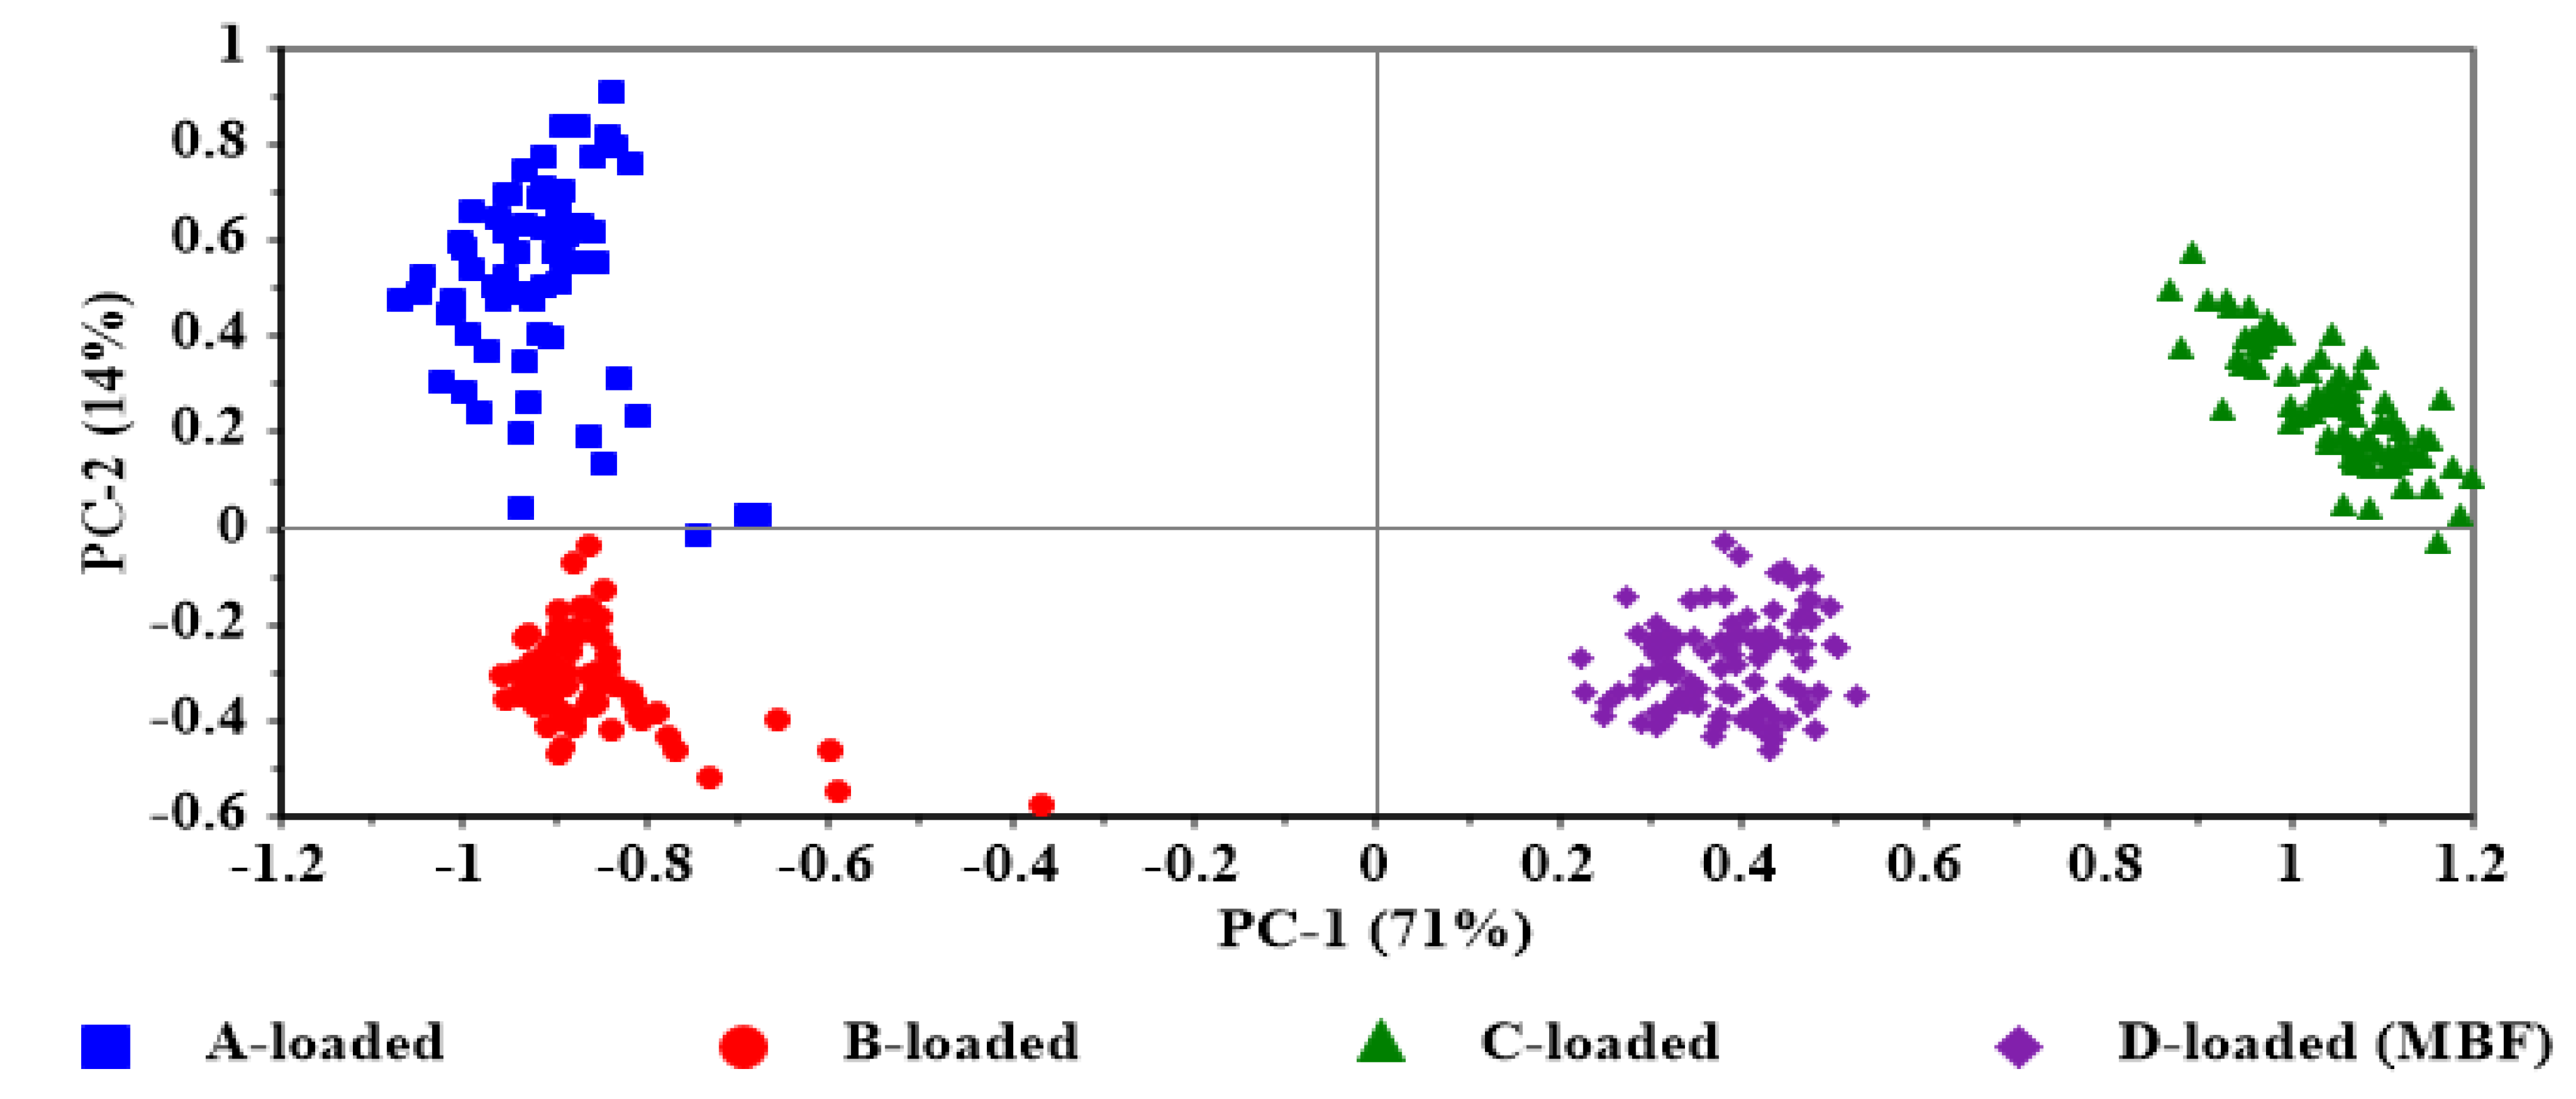
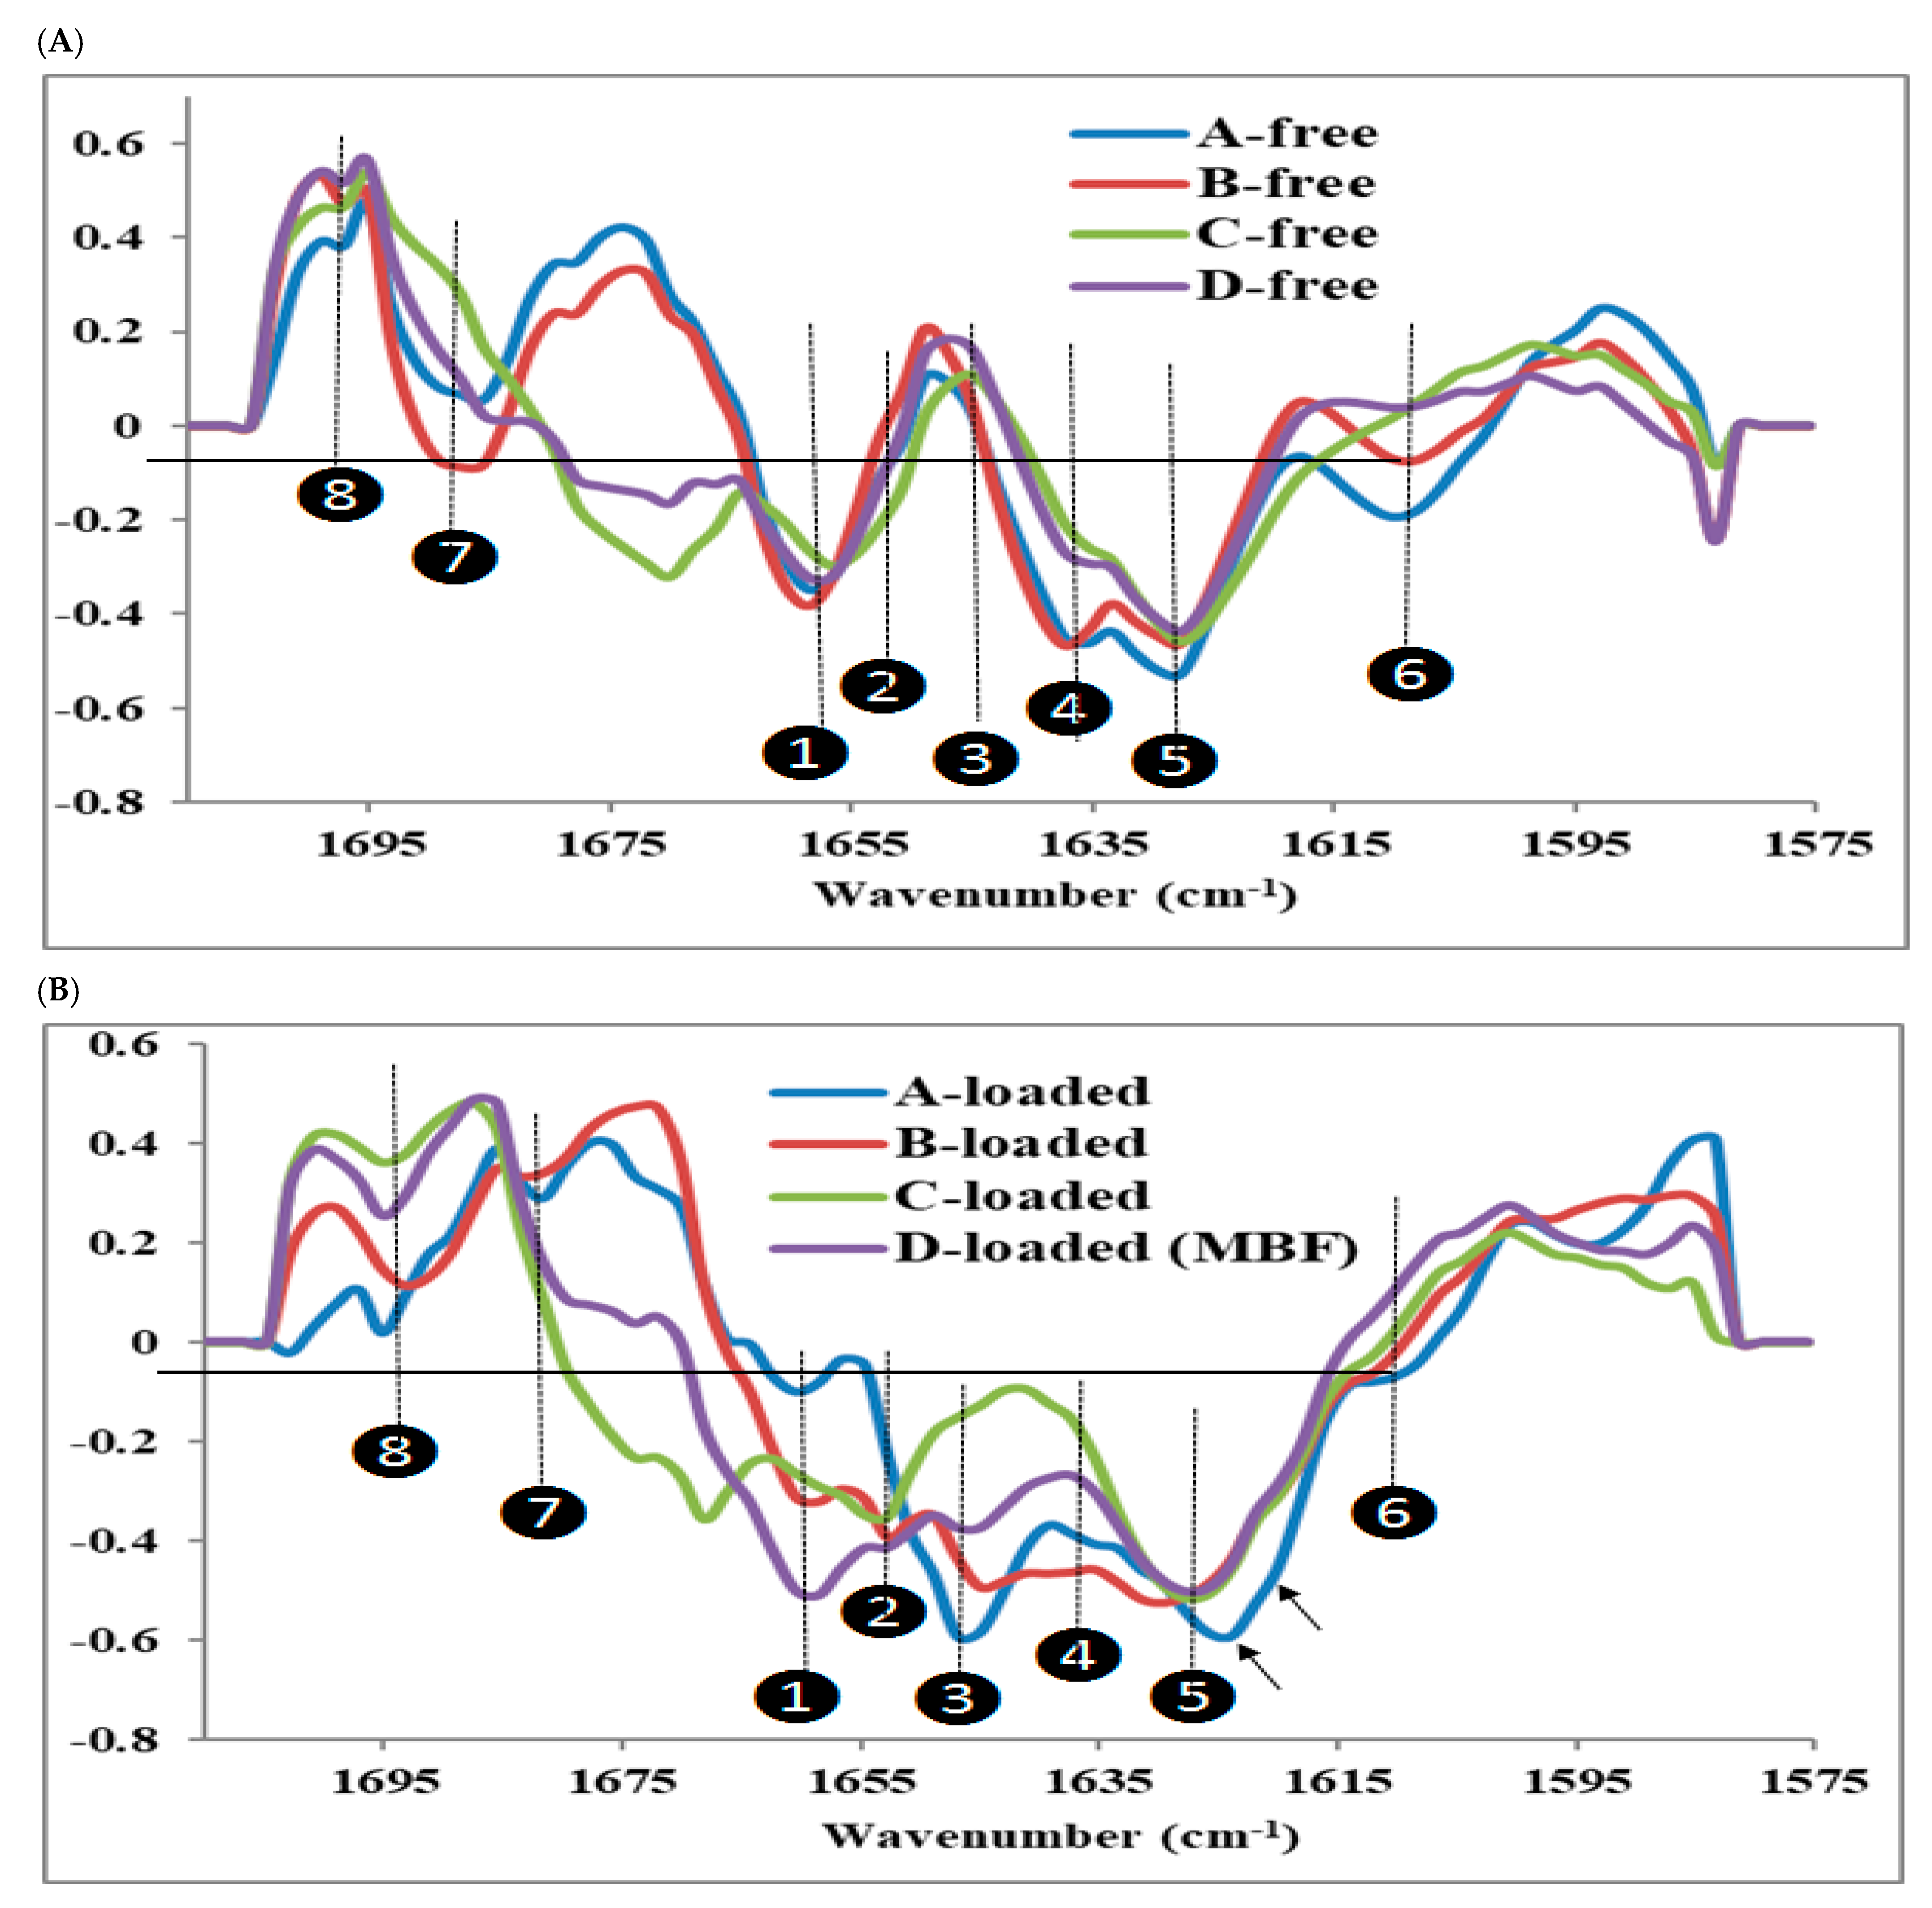
3.3. SRCD Measurements

The SRCD is used for the assessment of the effect of different formulation parameters such as insulin concentration, solvent composition, chemical excipients, and pH on the secondary structure of insulin. The SRCD results were subjected to secondary structure analysis using the BeStSel algorithm [31]. Figure 2 compares between the secondary structure estimates (SSE) values for all measured samples. The effect of some formulation parameters on the SRCD spectrum is demonstrated in the following sections.

3.3.1. Effect of Insulin Concentration

It is known that insulin aggregates under different stress conditions including agitation, high concentration, incompatible ionic strength, extreme pH, and temperature. Thus, we have examined different insulin concentrations in order to be sure that this range of insulin concentrations did not exhibit aggregation tendency.
Solutions of insulin in 2% acetic acid at the examined concentrations showed very similar SRCD spectra, as illustrated in Figure 3. The estimated fractions of secondary structure components, as shown in Figure 2, were 38–41% for α-helix, 16–19% for β-sheets, and 13–14% for the turns; these values were consistent with previous studies of native insulin conformations [17,18].

3.3.2. Effect of Insulin Media

The SRCD-spectra obtained for insulin dissolved in HCl (pH ≈ 2.0), saliva simulated fluid (pH ≈ 6.85), and Na2CO3 (pH ≈ 9.0) are shown in Figure 4. For acetic acid and Na2CO3, the SRCD profiles and the SSE% values were almost similar, indicating similarity in the extent of interaction with insulin leading to negligible effect at the insulin structure. On the other hand, a noticeable difference was observed in the HCL and the saliva-simulated media. This difference was accompanied by a decrease in α-helix content from 52% to 18–20%, as observed in Figure 2. Sodium chloride, as a component of the simulated saliva solution, was reported to affect insulin structure and to enhance insulin amyloid fibril formation [33].

3.3.3. Effect of the Film Components

In order to examine the effect of the film components at the insulin secondary structure, SRCD-spectra were obtained for the formulations listed in Table 1 and compared to the reference spectrum obtained for insulin (0.57 mg/mL) in 2% acetic acid; the results are shown in Figure 5. For insulin solutions, the presence of chitosan (A-Loaded) or glycerin (B-Loaded) did not cause noticeable changes in insulin spectrum, while the presence of L-arginine (C-Loaded) in the solution appeared to increase the intensity magnitude. Interestingly, this effect of L-arginine was reduced when combined with glycerin, as shown in the D-Loaded solution, and it reduced further upon the film formation, as shown in the case of the D-Loaded MBF. The secondary structure estimate values (Figure 2) clearly show the reduction in the alpha helix content of the SRCD data of the D-Loaded MBF. This effect might be attributed to the change in the extent and nature of interaction between insulin and the different film components upon drying. It is well documented that L-arginine acts as an aggregation inhibitor, and it stabilizes the secondary structure of insulin [34,35]. At the pH (3.3) of the measured solutions, insulin is expected to be predominantly positively charged; this implies that the electrostatic attractions between the positively charged L-arginine and negative residues of insulin are not the only mechanism of the L-arginine stabilizing effect. The interaction between chitosan and L-arginine is expected to shield the insulin-destabilization effect of chitosan. In addition, previous studies have demonstrated the important role of the guanidinium side chain of L-arginine, which tends to bind to neutral hydrophilic amino acid residues through hydrogen bonding with the carbonyl group of the protein. L-arginine was also shown to bind to tryptophan residues through pi–cation interactions [36,37].
In order to investigate insulin stability as function of temperature, SRCD data were collected for the D-Loaded MBF-FS while gradually raising the temperature from 20 to 90 degrees followed by cooling back to 20 degrees. The SSE values were obtained at the initial temperature (initial, 20 °C) and the final temperature (final, 20 °C) and presented in Figure 2. The heating–cooling process leads to lowering the total alpha-helix content from 48 to 32%, increasing the beta structures from 10 to 17%, and increasing the turns and unordered forms from 41 to 50%. These results indicate that upon exposure to higher temperature, the insulin undergoes the process of denaturation, which is irreversible with the loss of helical content and the increase in beta structure upon cooling.

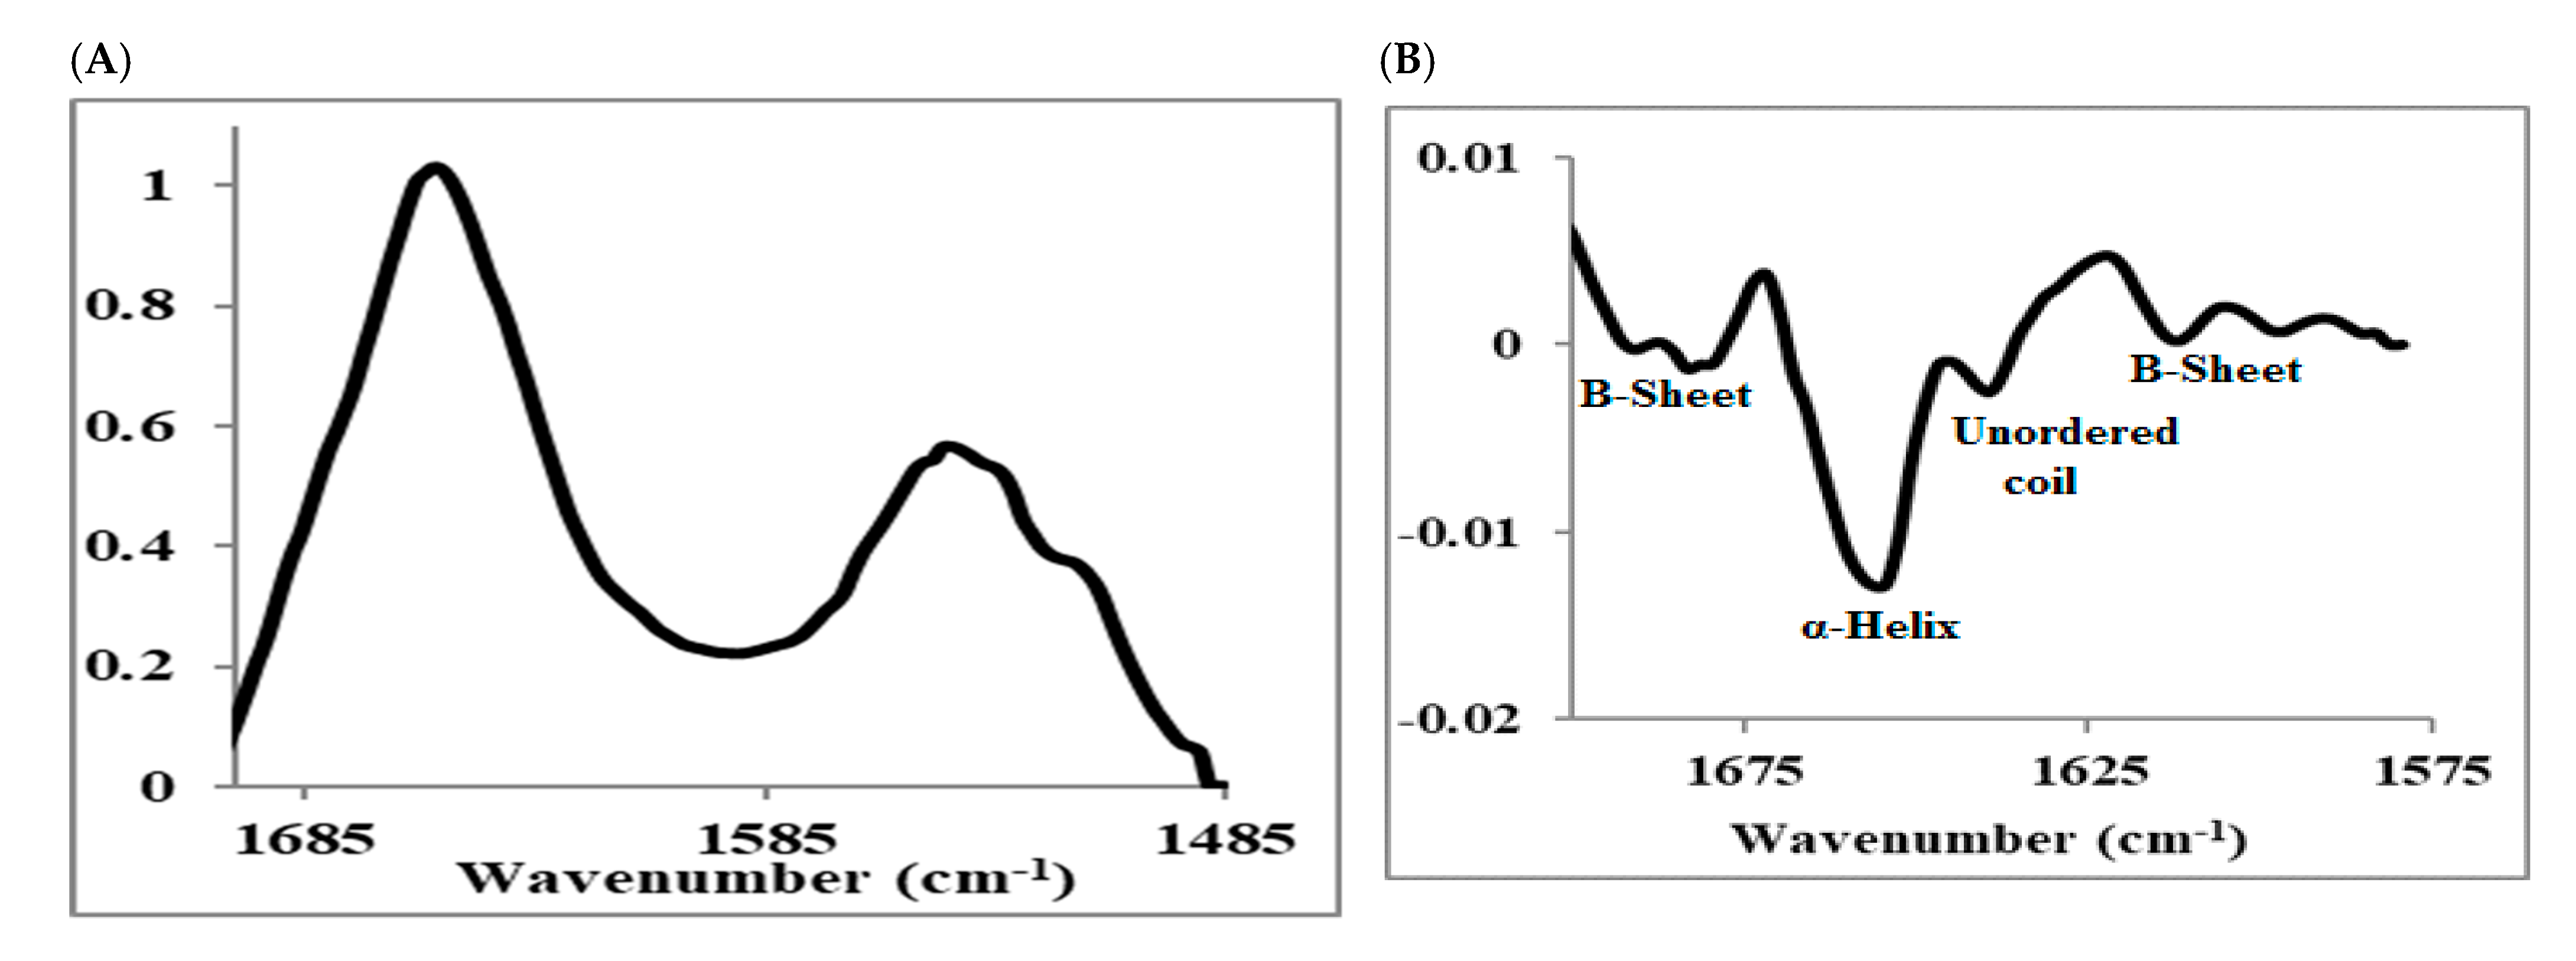
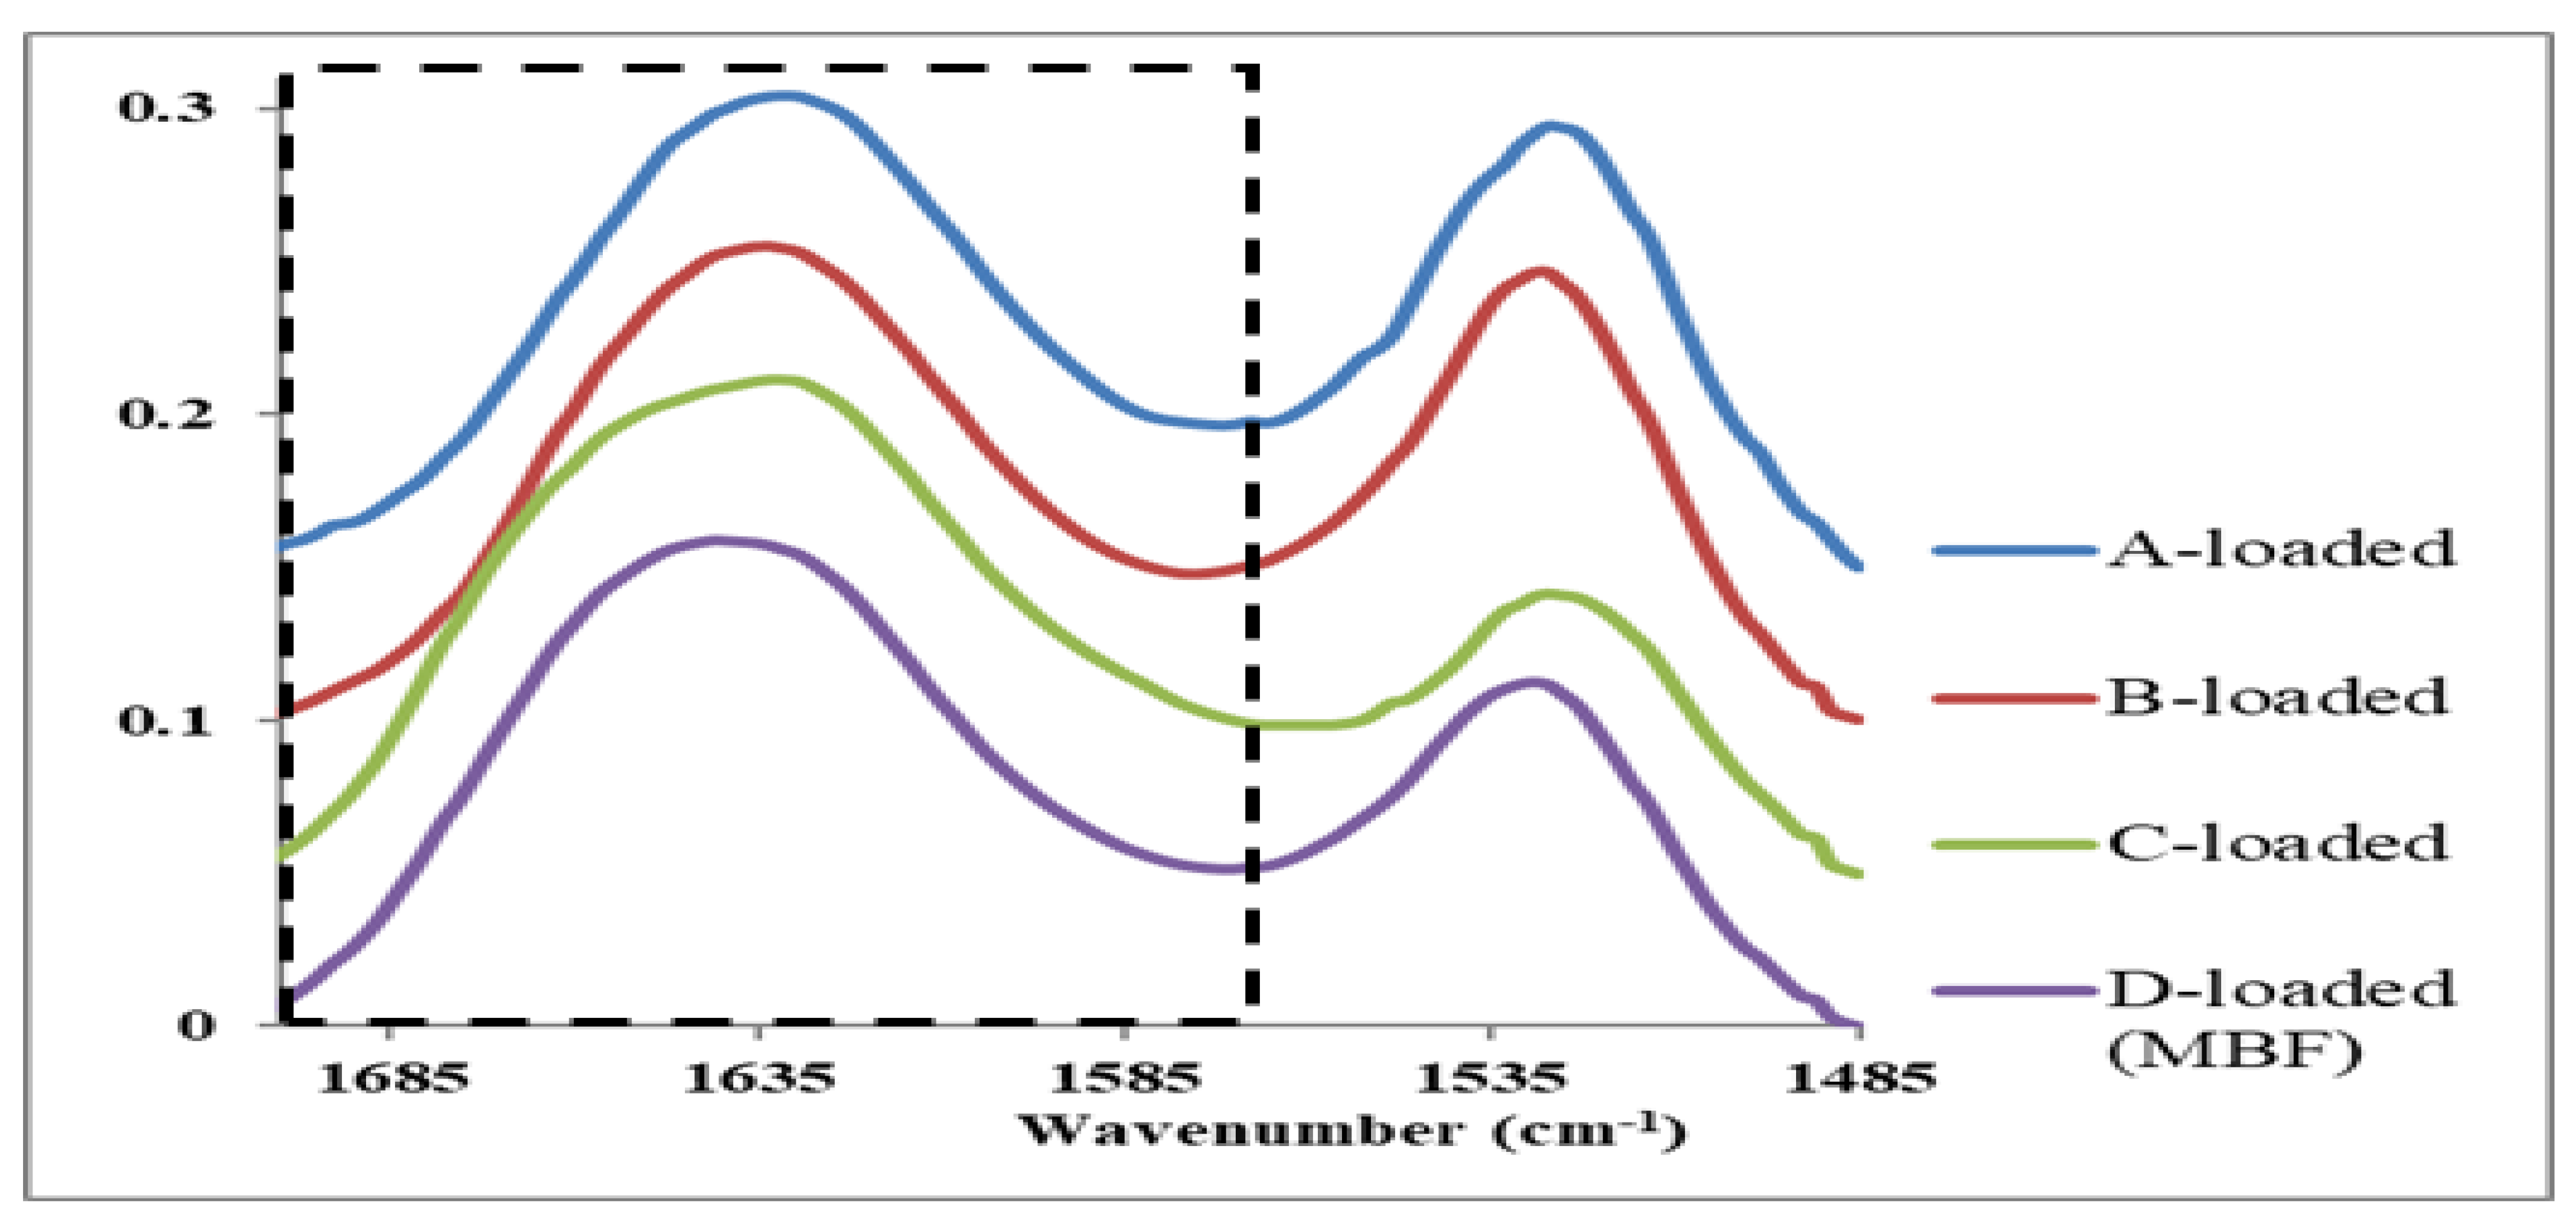
3.4. FTIR-MS Measurements

For proteins, the amide I region from 1600 to 1700 cm−1 is mostly composed of several bands corresponding to the elements of secondary structures such as α-helices, β-sheets, turns, and unordered conformations (Figure 6). The second derivative analysis of the amide I bands is used to enhance the resolution of the overlapped bands and identify the various elements of the protein secondary structure. Figure 6B shows the second derivative spectrum of insulin obtained in this study with the band at 1655 cm−1 assigned to the dominant α-helical conformation, the bands in the 1680–1695 cm−1 region and 1612 cm−1 assigned to β-sheets, and the band at 1639 cm−1 assigned to unordered conformation [22,23,24,25,26,38].
For investigating the effect of the film matrix components (Table 1) on the stability of the insulin α-helical structure, the amide I spectral range of the insulin-loaded films is of particular interest. The unit vector normalized average raw spectra of the insulin-loaded films in Figure 7 show the amide I and II regions. The result of PCA based on the second-derivative spectra of the amide I region is displayed in the score plot in Figure 8. There are evident trends of separation between different films and clustering for each tested individual film reflecting inter-film spectral differences and intra-film spectral similarities. Furthermore, the D-loaded film (MBF), which contains all the matrix components (chitosan mixture, glycerin, and L-arginine) showed the highest similarity, whereas the A-loaded film that contains only the chitosan mixture as the matrix possessed the highest variability. In order to reveal these effects, a comparison of the average second-derivative spectra of the tested loaded films was conducted and illustrated in Figure 9A. The results of the PCA are interpreted as a direct contribution of the structure of the matrix components and the possible interaction between them; in addition, it might be due to possible variations in the secondary structure of insulin in different films (Figure 2) as a function of the matrix-forming components. It is also useful to compare each loaded film with its corresponding free one (Figure 9B) to delineate the spectral features resulting from a variation of secondary structures of insulin from those arising from the film matrix components or their interactions.
Within the studied spectral range, eight second-derivative peaks were identified (Figure 9). Peak1 of the insulin-free films appears at 1656.5–1658.5 cm−1 and originates from the film matrix components and could be assigned to chitosan [39]. These peaks occur near the α-helix conformation of insulin. In the insulin-loaded films, these particular peaks appear in the range 1656.5–1662 cm−1 except in the C-loaded film, where it seems to be fused with peak2. Peak2 occurs as a clear peak in the loaded films of B, C, and D-loaded at 1650.8–1652.5 cm−1 in the range of α-helix conformation and at the same time is absent in the insulin-free films of A, B, and D or forms a faint shoulder in C-free. Accordingly, these peaks are attributed to the α-helix conformation of loaded insulin. In A-loaded film, this particular peak is exhibited as a faint shoulder, indicating the inability of the chitosan mixture alone to stabilize this form of insulin α-helix conformation. This conclusion agrees well with the SRCD results (Figure 2) where the alpha helix conformation was absent from the A-loaded film. No peaks were observed at position 3, 1643–1644 cm−1 was assigned to an unordered structure for the insulin-free films, whereas peaks appeared in the loaded films with an intensity magnitude of A > B> D > C. This second-derivative peak assigned to unordered conformation implies that L-arginine, in C and D-loaded films, reduced the formation of an unordered structure of insulin. The high intensity of the unordered structure was associated with the very low intensity of α-helix in the A-loaded film, which emphasizes the impact of the chitosan mixture on the destabilization of insulin folding. The ability of chitosan to interact with insulin was reported for insulin-loaded chitosan noano/micro-particles [39,40,41]; in addition, the negative effect of chitosan on insulin stability in insulin Lispro was pointed out [42].
Interesting findings were observed for peaks 4, 6, and 7, which were found in A and B-free films as distinct peaks at 1635–1637 cm−1, 1608–1612 cm−1, and 1685 cm−1, respectively. In C and D-free films, these peaks either disappeared or showed significant reduction of intensity magnitude that were attributed to the interaction of L-arginine with the chitosan mixture. L-arginine interaction with chitosan could minimize the destabilizing effect of chitosan on insulin folding with repercussion on its activity. Furthermore, it was observed that native insulin (Figure 6B) showed a peak at 1635 cm−1arising from an unordered structure and that was not present in C and D-loaded films, which is consistent with the stabilizing effect of L-arginine. Nevertheless, L-arginine was found to suppress the heat-induced amorphous aggregation of insulin; accordingly, it is possible that arginine could exert its stabilizing effect through interaction with insulin [10,35].
In both free and loaded B, C, and D films, no changes were observed for the peaks at position 5 of 1627.6 cm−1, which is the lower wave number associated to β-sheets. However, since it is present in both free and loaded films and that the higher wave number peak was not observed might indicate that this conformation was not present. In A-loaded film, this peak is shifted to 1623 cm−1 in addition to the emergence of a faint shoulder at 1621 cm−1, which may be due to the formation of some type of β–sheets; the latter could be indicative of the formation of β-structure typically observed in amyloid fibrils [43,44,45,46].
Low intensity peaks at position 7 of 1692–1695 cm−1 were observed for insulin- loaded films as well as native insulin (Figure 6B), which could be due to another form of β-sheets. Insulin loading has intensified the peaks at position 5 in all films confirming the presence of this particular type of β–sheets of insulin in the loaded films. This spectral behavior was more pronounced for A and B-loaded films, showing an adjacent peak consistent with the stabilizing effect of L-arginine in C and D-loaded films.
The variations in the secondary structure of insulin between different films were significant. L-arginine favors the reduction in the formation of an unordered structure and β–sheets, hence stabilizing the insulin structure. This effect may be mediated by the interaction of L-arginine with chitosan, shielding and preventing the destabilizing effect of chitosan on insulin. Although the structural differences and interactions in the matrix components contribute greatly to the inter-film separation in the PCA score plot (Figure 8), the lower intra-film spectral variability of D-loaded film (MBF) is very likely to be a consequence of the lower variability in insulin secondary structures as a result of the protective effect of L-arginine, while the higher spectral variability detected in A-loaded film reflects the variations in the insulin secondary structure induced by chitosan.
Overall, the data obtained for the different films using FTIR-MS measurements and PCA analysis were in good agreement with that obtained for the film-forming solutions using SRCD measurements. In both methods, the stabilizing effect of L-arginine on the secondary structure of insulin was evident. L-arginine appeared to enhance the a-helix content at the expense of an unordered structure. Conversely, the presence of the chitosan mixture and glycerin in the formulations appeared to increase the content of the unordered structure at the expenses of a-helix, hence neutralizing the stabilizing effect of L-arginine on the secondary structure of insulin.

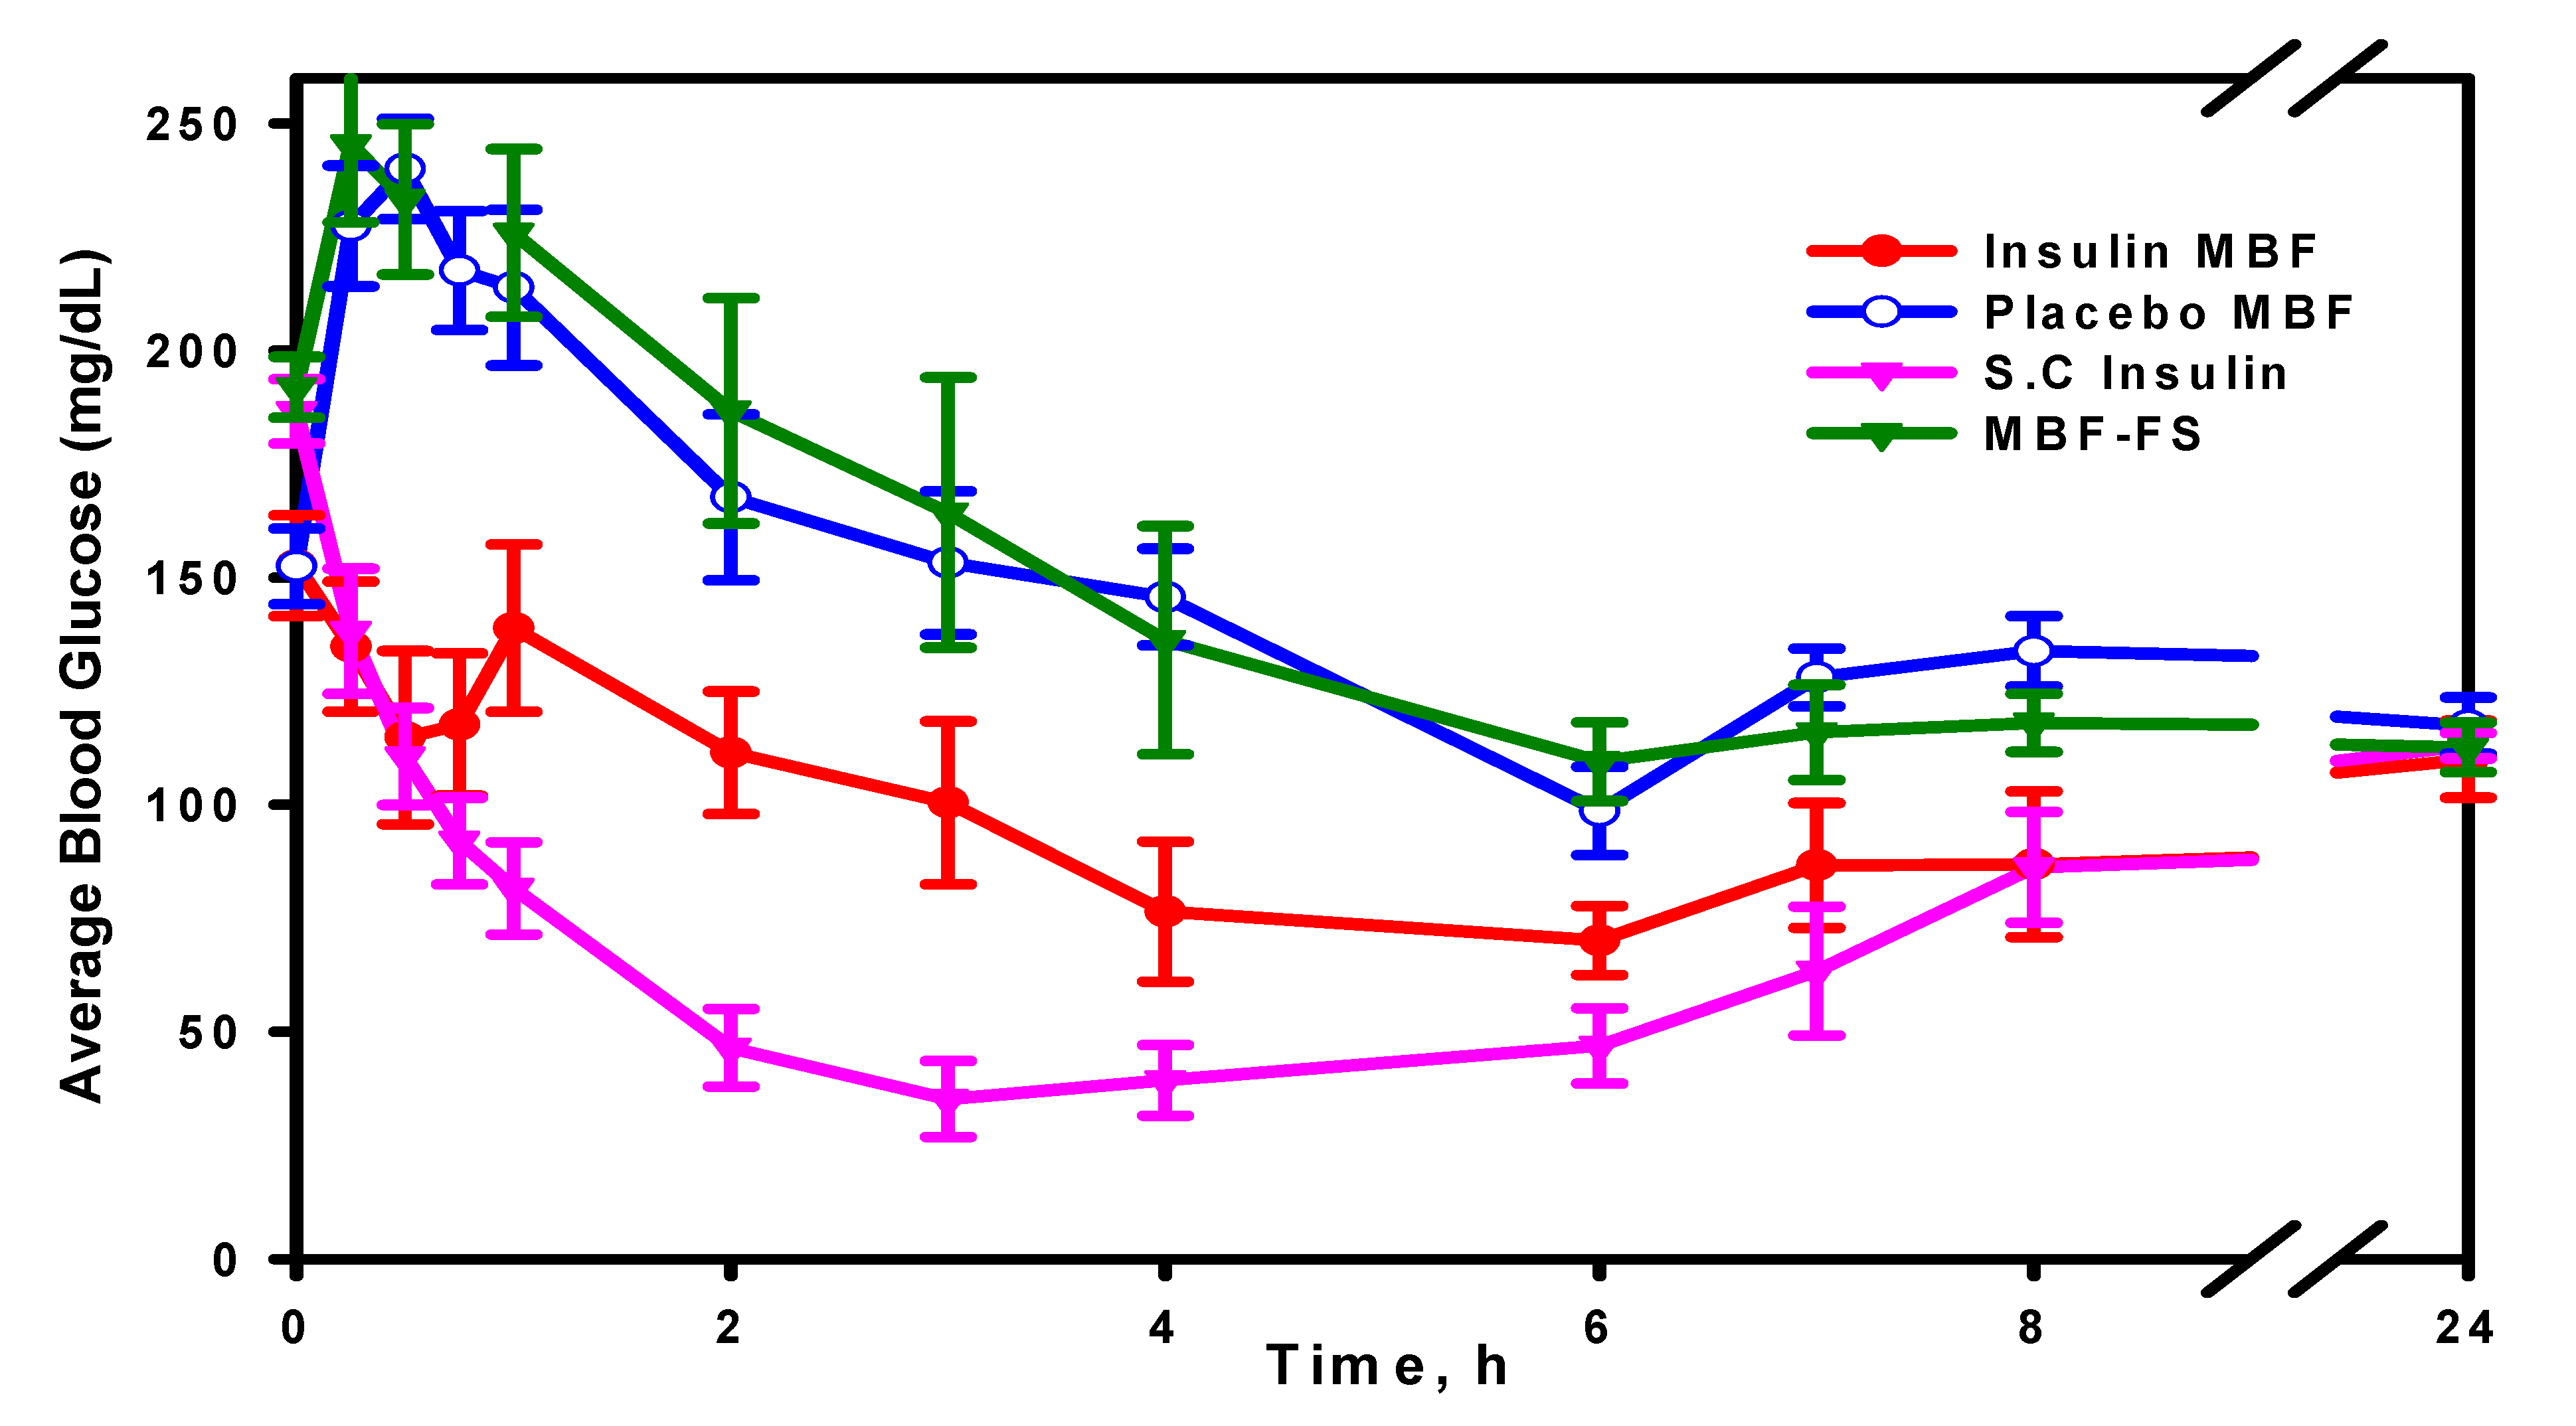
3.5. InVivo Evaluation

Insulin activity was evaluated using four groups of animals. The averages of the blood glucose (mg/dL) measured for all four groups from time zero to 24 h are illustrated in Figure 10.
The apparent area under the glucose concentration curve (AUC, 0–8 h), as shown in Figure 11, was calculated using “Linear Trapezoidal Rule” in an Excel spreadsheet and then translated into glucose reduction percentage. Insulin S.C and insulin MBF showed an AUC (0–8 h) significantly lower than the placebo MBF (p < 0.05), while insulin MBF-FS did not show any significant difference from placebo MBF (p > 0.05). Furthermore, it was found that over the first 8 h, insulin MBF exerted up to about a 40% reduction of glucose concentration compared to about a 70% reduction caused by the subcutaneously injected insulin. The minimum glucose concentrations (Cmin, mean ± SEM) for insulin MBF (54.3 ± 7.11) and for S.C (30.8 ± 6.17) were significantly different (p < 0.05) from that calculated for the placebo MBF (103.9 ± 7.36) and for MBF-FS (96.1 ± 9.60). The difference in activity between the solution (MBF-FS) and the MBF highlights the success and advantage of the formulation approach adapted in this work, where the mucoadhesion property of the MBF improved insulin bioavailability. Compared to the S.C. route, the MBF activity was satisfactory, especially if we take into consideration that the MBF contains about 80% of the loaded dose, as shown by the ELISA results. Additionally, the in vivo activity of MBF described in this work is comparable to other reported buccal formulations. Nusaiba et al. [47] examined the in vivo activity of mucoadhesive buccal films composed of chitosan nanoparticles loaded with insulin at a dose of 12.5 IU/kg, and they observed a 52.2% decrease in blood glucose level in diabetic rats over 5 h relative to a control group. In another study, Amogh et al. [48] administered an ionic liquid-based buccal formulation of insulin (7.5 IU/kg) to anesthetized rats, and they observed a moderate decrease in the glucose blood level, which then plateaued beyond 2 h to 82 ± 3% of the initial levels.
The results of the FTIR-MS and the in vivo evaluation proved the preservation of insulin secondary structure in the MBF, which indicates insulin stability upon drying and film formation. However, the MBF alpha helix content calculated using the SRCD results was low compared to its forming solution (MBF-FS), which might indicate some sort of interaction that took place in the dried film.

4. Conclusions

Insulin-loaded MBFs were formulated successfully using a mixture of 1500 Da and 13,000 Da chitosan in addition to glycerin and L-arginine. The obtained films were of good appearance and texture in terms of flexibility and transparency. The insulin content of the MBF was about 80% of the loaded insulin as estimated using an ELISA test.
Analysis of insulin-loaded MBF spectral data obtained using FTIR-MS techniques was in good agreement the SRCD obtained for the MBF-FS; both methods confirmed the preservation of insulin secondary structure and in particular the stabilizing effect of L-arginine In vivo studies on rats showed that insulin MBF reduced blood glucose at promising levels, which achieved 57% of the effect of insulin S.C injection.

Author Contributions

M.D. carried out the experimental work and shared in the data analysis and the manuscript writing. A.-S.S., I.H. and E.K. shared in the research idea, project design, data analysis and manuscript drafting. R.M. shared in FTIR data acquisition, carried out the FTIR data analysis and writing. R.H., G.S. and E.K. shared in CD data acquisition, analysis and writing. R.H., G.S. made proof reading for the manuscript. N.Q. and A.-S.S. designed the in vivo experiments and shared in the discussion of the results. All authors have read and agreed to the published version of the manuscript.

Funding

This research was funded by the Deanship for Scientific Research, The University of Jordan grants numbers 1143K1453 and 1143K19/2017/3447.

Institutional Review Board Statement

The study was conducted according to the guidelines of the Declaration of Helsinki, and approved by the Ethics Committee of the Deanship of Scientific Research, the University of Jordan (No.1/2018–2019).

Informed Consent Statement

Not applicable.

Data Availability Statement

The data presented in this study are available on request from the corresponding author. The data are not publicly available due to privacy reasons.

Acknowledgments

The authors thank the Deanship for Scientific Research, The University of Jordan for the financial support, Jordan Atomic Energy Commission for Maram travel support, TQ Pharma for providing facilities and support, Diamond Light Source for the beamtime and instruments access to B23 beamline (SM19787) and SESAME Light Source for the beamtime.

Conflicts of Interest

The authors declare no conflict of interest.

References

  1. Peyrot, M.; Rubin, R.R.; Khunti, K. Addressing barriers to initiation of insulin in patients with type 2 diabetes. Prim. Care Diabetes 2010, 4, S11–S18. [Google Scholar] [CrossRef]
  2. Madhav, N.S.; Shakya, A.K.; Shakya, P.; Singh, K. Orotransmucosal drug delivery systems: A review. J. Control. Release 2009, 140, 2–11. [Google Scholar] [CrossRef]
  3. Sohi, H.; Ahuja, A.; Ahmad, F.J.; Khar, R.K. Critical evaluation of permeation enhancers for oral mucosal drug delivery. Drug Dev. Ind. Pharm. 2010, 36, 254–282. [Google Scholar] [CrossRef] [PubMed]
  4. Figueiras, A.; Hombach, J.; Veiga, F.; Bernkop-Schnürch, A. In Vitro evaluation of natural and methylated cyclodextrins as buccal permeation enhancing system for omeprazole delivery. Eur. J. Pharm. Biopharm. 2009, 71, 339–345. [Google Scholar] [CrossRef] [PubMed] [Green Version]
  5. Kamei, N.; Khafagy, E.-S.; Hirose, J.; Takeda-Morishita, M. Potential of single cationic amino acid molecule “Arginine” for stimulating oral absorption of insulin. Int. J. Pharm. 2017, 521, 176–183. [Google Scholar] [CrossRef] [PubMed]
  6. Baynes, B.M.; Wang, D.I.; Trout, B.L. Role of arginine in the stabilization of proteins against aggregation. Biochemistry 2005, 44, 4919–4925. [Google Scholar] [CrossRef]
  7. Low, B.W.; Einstein, J.R. Symmetry of insulin dimers and hexamers. Nature 1960, 186, 470. [Google Scholar] [CrossRef]
  8. Dodson, E.; Harding, M.M.; Hodgkin, D.C.; Rossmann, M.G. The Crystal structure of insulin: III. Evidence for a 2-fold axis in rhombohedral zinc insulin. J. Mol. Biol. 1966, 16, 227–241. [Google Scholar] [CrossRef]
  9. Blundell, T.L.; Hodgkin, D.C.; Mercola, D.A.; Cutfield, J.F.; Cutfield, S.M.; Dodson, E.J.; Dodson, G.G. Three-Dimensional atomic structure of insulin and its relationship to activity. Diabetes 1972, 21, 492–505. [Google Scholar] [CrossRef]
  10. Varughese, M.M.; Newman, J. Inhibitory effects of arginine on the aggregation of bovine insulin. J. Biophys. 2012, 2012, 434289. [Google Scholar] [CrossRef] [Green Version]
  11. Iannuzzi, C.; Borriello, M.; Portaccio, M.; Irace, G.; Sirangelo, I. Insights into insulin fibril assembly at physiological and acidic pH and related amyloid intrinsic fluorescence. Int. J. Mol. Sci. 2017, 18, 2551. [Google Scholar] [CrossRef] [PubMed] [Green Version]
  12. Fasman, G.D. Circular Dichroism and the Conformational Analysis of Biomolecules 1996; Plenum Press: New York, NY, USA, 1996. [Google Scholar]
  13. Berova, N.; Nakanichi, K.; Woody, R.W. Circular Dichroism Principles and Applications, 2nd ed.; Wiley-VCH: Weinheim, Germany, 2000. [Google Scholar]
  14. Mawhinney, M.T.; Williams, T.L.; Hart, J.L.; Taheri, M.L.; Urbanc, B. Elucidation of insulin assembly at acidic and neutral pH: Characterization of low molecular weight oligomers. Proteins Struct. Funct. Bioinform. 2017, 85, 2096–2110. [Google Scholar] [CrossRef] [PubMed]
  15. Kurouski, D.; Lombardi, R.A.; Dukor, R.K.; Lednev, I.K.; Nafie, L.A. Direct observation and pH control of reversed supramolecular chirality in insulin fibrils by vibrational circular dichroism. Chem. Commun. 2010, 46, 7154–7156. [Google Scholar] [CrossRef] [PubMed]
  16. Dzwolak, W.; Kalinowski, J.; Johannessen, C.; Babenko, V.; Zhang, G.; Keiderling, T.A. On the DMSO-Dissolved State of Insulin: A Vibrational Spectroscopic Study of Structural Disorder. J. Phys. Chem. B 2012, 116, 11863–11871. [Google Scholar] [CrossRef] [PubMed]
  17. Pocker, Y.; Biswas, S.B. Conformational dynamics of insulin in solution. Circular dichroic studies. Biochemistry 1980, 19, 5043–5049. [Google Scholar] [CrossRef] [PubMed]
  18. Provencher, S.W.; Gloeckner, J. Estimation of globular protein secondary structure from circular dichroism. Biochemistry 1981, 20, 33–37. [Google Scholar] [CrossRef] [PubMed]
  19. Hussain, R.; Jávorfi, T.; Siligardi, G. Spectroscopic Analysis: Synchrotron Radiation Circular Dichroism. In Comprehensive Chirality; Erick, M.C., Yamamoto, H., Eds.; Elsevier: Amsterdam, The Netherlands, 2012; pp. 438–448. ISBN 9780080951683. [Google Scholar]
  20. Hussain, R.; Jávorfi, T.; Siligardi, G. Circular dichroism beamline B23 at the Diamond light source. J. Syn. Rad. 2012, 19, 132–135. [Google Scholar] [CrossRef]
  21. Calzolai, L.; Laera, S.; Ceccone, G.; Gililand, D.; Hussain, R.; Siligardi, G.; Rossi, F. Gold nanoparticles’ blocking effect on UV-induced damage to human serum albumin. J. Nanopart. Res. 2013, 15, 1412–1416. [Google Scholar] [CrossRef]
  22. Byler, D.M.; Susi, H. Examination of the secondary structure of proteins by deconvolved FTIR spectra. Biopolymers 1986, 25, 469–487. [Google Scholar] [CrossRef]
  23. Jackson, M.; Mantsch, H.H. The use and misuse of FTIR spectroscopy in the determination of protein structure. Crit. Rev. Biochem. Mol. Biol. 1995, 30, 95–120. [Google Scholar] [CrossRef]
  24. Susi, H.; Byler, D.M. Protein structure by Fourier transform infrared spectroscopy: Second derivative spectra. Biochem. Biophys. Res. Commun. 1983, 115, 391–397. [Google Scholar] [CrossRef]
  25. Susi, H.; Byler, D.M.; Purcell, J.M. Estimation of B-structure content of proteins by means of deconvolved FTIR spectra. J. Biochem. Biophys. Methods 1985, 11, 235–240. [Google Scholar] [CrossRef]
  26. Tori, H.; Tasumi, M. Infrared Spectroscopy of Biomolecules; Mantsch, H.H., Chapman, D., Eds.; Wiley-Liss: New York, NY, USA, 1996; pp. 1–18. [Google Scholar]
  27. Delbeck, S.; Heise, H.M. Quality Assurance of Commercial Insulin Formulations: Novel Assay using Infrared Spectroscopy. J. Diabetes Sci. Technol. 2020. [Google Scholar] [CrossRef]
  28. Martínez-López, A.; Carvajal-Millan, E.; Sotelo-Cruz, N.; Micard, V.; Rascón-Chu, A.; López-Franco, Y.; Lizardi-Mendoza, J.; Canett-Romero, R. Enzymatically cross-linked arabinoxylan microspheres as oral insulin delivery system. Int. J. Biol. Macromol. 2019, 126, 952–959. [Google Scholar] [CrossRef]
  29. Sapin, R.; Le Galudec, V.; Gasser, F.; Pinget, M.; Grucker, D. Elecsys insulin assay: Free insulin determination and the absence of cross-reactivity with insulin lispro. Clin. Chem. 2001, 47, 602–605. [Google Scholar] [CrossRef] [Green Version]
  30. Marques, M.R.; Loebenberg, R.; Almukainzi, M. Simulated biological fluids with possible application in dissolution testing. Dissolut. Technol. 2011, 18, 15–28. [Google Scholar] [CrossRef]
  31. Micsonai, A.; Wien, F.; Kernya, L.; Lee, Y.-H.; Goto, Y.; Réfrégiers, M.; Kardos, J. Accurate secondary structure prediction and fold recognition for circular dichroism spectroscopy. Proc. Natl. Acad. Sci. USA 2015, 112, E3095–E3103. [Google Scholar] [CrossRef] [Green Version]
  32. Elsayed, A.M.; Khaled, A.H.; Al Remawi, M.M.; Qinna, N.A.; Abu Farsakh, H.; Badwan, A.A. Low molecular weight chitosan-insulin complexes solubilized in a mixture of self-assembled labrosol and plurol oleaque and their glucose reduction activity in rats. Mar. Drugs 2018, 16, 32. [Google Scholar] [CrossRef] [Green Version]
  33. Muzaffar, M.; Ahmad, A. The Mechanism of Enhanced Insulin Amyloid Fibril Formation by NaCl Is Better Explained by a Conformational Change Model. PLoS ONE 2011, 6, e27906. [Google Scholar] [CrossRef] [Green Version]
  34. Oki, S.; Iwashita, K.; Kimura, M.; Kano, H.; Shiraki, K. Mechanism of co-aggregation in a protein mixture with small additives. Int. J. Biol. Macromol. 2018, 107, 1428–1437. [Google Scholar] [CrossRef]
  35. Haghighi-Poodeh, S.; Kurganov, B.; Navidpour, L.; Yaghmaei, P.; Ebrahim-Habibi, A. Characterization of arginine preventive effect on heat-induced aggregation of insulin. Int. J. Biol. Macromol. 2020, 145, 1039–1048. [Google Scholar] [CrossRef] [PubMed]
  36. Tsumoto, K.; Umetsu, M.; Kumagai, I.; Ejima, D.; Philo, J.S.; Arakawa, T. Role of arginine in protein refolding, solubilization, and purification. Biotechnol. Prog. 2004, 20, 1301–1308. [Google Scholar] [CrossRef] [PubMed]
  37. Kumar, N.; Kishore, N. Arginine inhibits aggregation of α-lactalbumin but also decreases its stability: Calorimetric, spectroscopic, and molecular dynamics studies. J. Chem. 2014, 78, 159–166. [Google Scholar] [CrossRef]
  38. Kong, J.; Yu, S. Fourier transform infrared spectroscopic analysis of protein secondary structures. Acta Biochim. Biophys. Sin. 2007, 39, 549–559. [Google Scholar] [CrossRef] [Green Version]
  39. Azevedo, J.R.; Sizilio, R.H.; Brito, M.B.; Costa, A.M.B.; Serafini, M.R.; Arau’jo, A.A.S.; Santos, M.R.V.; Lira, A.A.M.; Nunes, R.S. Physical and chemical characterization insulin-loaded chitosan-TPP nanoparticles. J. Anal. Calorim. 2011, 106, 685–689. [Google Scholar] [CrossRef]
  40. Sarmento, B.; Ribeiro, A.; Veiga, F.; Sampaio, P.; Neufeld, R.; Ferreira, D. Alginate/chitosan nanoparticles are effective for oral insulin delivery. Pharm. Res. 2007, 24, 2198–2206. [Google Scholar] [CrossRef] [PubMed] [Green Version]
  41. Boonsongrit, Y.; Mueller, B.W.; Mitrevej, A. Characterization of drug–chitosan interaction by 1 H NMR, FTIR and isothermal titration calorimetry. Eur. J. Pharm. Biopharm. 2008, 69, 388–395. [Google Scholar] [CrossRef] [PubMed]
  42. Misra, G.P.; Janagam, D.R.; Lowe, T.L. Effect of Excipients on the Stability of Insulin Lispro. Macromol. Symp. 2015, 351, 46–50. [Google Scholar] [CrossRef]
  43. Sarroukh, R.; Goormaghtigh, E.; Ruysschaert, J.M.; Raussens, V. ATR-FTIR: A “rejuvenated” tool to investigate amyloid proteins. Biochim. Biophys. Acta 2013, 1828, 2328–2338. [Google Scholar] [CrossRef]
  44. Natalello, A.; Doglia, S.M. Insoluble protein assemblies characterized by fourier transform infrared spectroscopy. Methods Mol. Biol. 2015, 1258, 347–369. [Google Scholar]
  45. Barth, A. Infrared spectroscopy of proteins. Biochim. Biophys. Acta 2007, 1767, 1073–1101. [Google Scholar] [CrossRef] [PubMed] [Green Version]
  46. Yang, H.; Yang, S.; Kong, J.; Dong, A.; Yu, S. Obtaining information about protein secondary structures in aqueous solution using Fourier transform IR spectroscopy. Nat. Protoc. 2015, 10, 382–396. [Google Scholar] [CrossRef] [PubMed]
  47. Al-Nemrawi, N.K.; Alsharif, S.S.; Alzoubi, K.H.; Alkhatib, R.Q. Preparation and characterization of insulin chitosan-nanoparticles loaded in buccal films. Pharm. Dev. Technol. 2019, 24, 967–974. [Google Scholar] [CrossRef] [PubMed]
  48. Vaidya, A.; Mitragotri, S. Ionic liquid-mediated delivery of insulin to buccal mucosa. J. Control. Release 2020, 327, 26–34. [Google Scholar] [CrossRef]
Figure 1. (A) The optimized mucoadhesive buccal films (MBF), (B) the individualized MBF unit dose.
Symmetry 13 00088 g001
Figure 2. Effect of different parameters on the insulin secondary structure, expressed in percentage calculated using BestSel algorithm [31]. Bar chart of secondary structure estimates (SSE) of insulin in different media. The “Total β- Sheets” equals the sum of Anti1, Anti2, Anti3, and Para conformations, while the “Total α-Helix” is the sum of Helix1 and Helix2.
Symmetry 13 00088 g002
Figure 3. SRCD-spectra of insulin at different concentrations in 2% acetic acid solution measured at 25 °C.
Symmetry 13 00088 g003
Figure 4. SRCD-spectra of 0.68 mg/mL insulin in different media measured at 25 °C.
Symmetry 13 00088 g004
Figure 5. SRCD-spectra of insulin in different film forming solutions measured at 20 °C and the D-Loaded MBF measured at 25 °C, all compared to the reference; insulin in 2% acetic acid.
Symmetry 13 00088 g005
Figure 6. (A) Raw IR-spectrum of insulin showing amide I and II peaks and (B) corresponding second-derivative spectrum of amide I peak.
Symmetry 13 00088 g006
Figure 7. Unit vector normalized average IR-spectra of amide I (dashed box) and II peaks for the insulin-loaded films. The spectra are offset.
Symmetry 13 00088 g007
Figure 8. Principal component analysis (PCA) score plot of amide I region of insulin-loaded films.
Symmetry 13 00088 g008
Figure 9. Overlaid range normalized average second derivative IR-spectra of amide I peaks of (A) insulin-free films and (B) insulin-loaded films.
Symmetry 13 00088 g009
Figure 10. Average blood glucose (mg/mL) measured at times from zero to 24 h.
Symmetry 13 00088 g010
Figure 11. Apparent area under the 0–8 h curve (AUC, mean ± SEM) calculated for the different treated groups. * p values were significant for insulin MBF and insulin subcutaneous(S.C); 0.0014 and 0.0001 respectively versus Placebo MBF, # p values were non-significant (0.682) for insulin MBF-FS versus Placebo MBF.
Symmetry 13 00088 g011
Table 1. Composition of the different formulations examined using Synchrotron Radiation Circular Dichroism (SRCD) and Fourier transform infrared-microspectroscopy (FTIR-MS).
FormulaFilm Components
ChitosanGlycerinL-Arginine
A-Loadedyesnono
B-Loadedyesyesno
C-Loadedyesnoyes
D-Loaded(MBF-FS) or (MBF)yesyesyes
Table 2. The composition of the doses administered to the different animal groups.
GroupAdministered DoseComponent (mg/Unit Dose)
InsulinChitosanL-ArginineGlycerin
CH1500 DaCH13,000 Da
1Placebo MBF0661.22.4
2MBF *0.0138661.22.4
3S.C Insulin0.01380000
4MBF-FS **0.0138440.81.6
*: One rat (No. 6) was excluded as it ate the dosage form immediately. **: Sample at 45 min. was missed.
Publisher’s Note: MDPI stays neutral with regard to jurisdictional claims in published maps and institutional affiliations.

