Article

Controls of Distinct Mineral Compositions on Pore Structure in Over-Mature Shales: A Case Study of Lower Cambrian Niutitang Shales in South China

1
School of Geosciences, Yangtze University, Wuhan 430100, China
2
Key Laboratory of Tectonics and Petroleum Resources of Ministry of Education, China University of Geosciences, Wuhan 430074, China
*
Author to whom correspondence should be addressed.
Minerals 2021, 11(1), 51; https://doi.org/10.3390/min11010051
Submission received: 5 November 2020 / Revised: 9 December 2020 / Accepted: 30 December 2020 / Published: 6 January 2021
(This article belongs to the Section Mineral Geochemistry and Geochronology)

Abstract

:
Investigating the impacts of rock composition on pore structure is of great significance to understand shale gas occurrence and gas accumulation mechanism. Shale samples from over-mature Niutitang formation of Lower Cambrian in south China were measured by X-ray diffraction (XRD), field emission scanning electron microscopy (FE-SEM), low pressure N2 and CO2 adsorption to elucidate the controls of distinct mineral composition on pore development. Two distinct lithofacies, namely siliceous shale and argillaceous shale, were ascertained based on their mineral composition. Due to the variability of mineral composition in different lithofacies, pore structure characteristics are not uniform. Pores in siliceous shales are dominated by interparticle pores and organic matter (OM) pores, among which the interparticle pores are mainly developed between authigenic quartz. Furthermore, most of these interparticle pores and cleavage-sheet intraparticle pores within clay minerals are usually filled by amorphous organic matter that is host to OM pores. Due to the lack of rigid minerals, argillaceous shale was cemented densely, resulting in few interparticle pores, while cleavage-sheet intraparticle pores within clay minerals are common. Comparing siliceous shales with argillaceous shales, specific surface areas and pore volumes are higher on the former than on the latter. The content of total organic carbon (TOC) and authigenic quartz have a great influence on micropore structures, but less on mesopore structure for siliceous shales. The rigid framework structure formed by authigenic quartz is believed to be able to prevent primary interparticle pores from mechanical compaction and facilitate the formation of organic matter-associated pores. In terms of argillaceous shales, due to the lack of authigenic quartz, interparticle pores were rarely developed and its pore structure is mainly controlled by illite content.

1. Introduction

In recent years, as a result of the huge resource potential of shale gas, organic rich shales have received renewed attention [1]. Shale gas, as the most significant natural gas resource, mainly exists in the heterogeneous pore spaces of shales in the form of adsorbed and free gas [2,3,4]. Pore structure is feature by size, shape, volume, area, connectivity, and spatial distribution, which has significant influence on shale gas enrichment [5]. The intense heterogeneity of shale pore structure results in distinct shale gas storage mechanisms and distribution characteristics [5,6,7], while pore structure is influenced by rock type, mineral composition (mineral types, sizes, and percentage), organic maturity and total organic carbon content [5,8,9]. Many studies have reported the effects of organic matter content [6,10,11] and organic maturity on shale pore structure [12,13,14,15,16,17]. For example, Wang et al. [10] conducted FE-SEM observation, helium porosity measurement, low pressure nitrogen adsorption analyses, high-pressure methane sorption measurements and mechanical tests to investigate the characteristics and dominant controlling factors of Niutitang shales. and their results show that TOC plays an important role in the brittleness, pore structure and sorption capacity of shale reservoirs, potentially controlling the enrichment and productivity of shale gas. Topór et al. [15] studied the pore characteristics and CH4 sorption capacity for immature, mature, and overmature shales from the Baltic Basin via supercritical CH4, subcritical CO2 and N2 gas adsorption measurements and SEM observation. Organic matter (OM) maturity not only controls OM pore volume and CH4 adsorption in micropores, but also exerts a dominant control on porosity evolution in micro- and mesoscale [15]. However, the influence of different mineral composition on pore structure, pore volume and surface area distribution of shale remains unclear.
The Lower Cambrian Niutitang shales are widespread units in most areas of the Yangtze Block and are marked by great thickness, high TOC content, high maturity, and great potential for hydrocarbon generation with high brittleness and fracture development [10,18]. As one of the greatest potential target intervals for shale gas exploration and development, pore characteristics of the Niutitang shale have been paid close attention. Up to now, previous studies mostly focused on the variability of pore morphology and structure and the effect of organic carbon content on pore structure [10,19,20,21]. However, scant attention has been paid to the influence of different mineral composition on pore structure, pore volume and surface area distribution of shale.
With samples from over-mature Niutitang Formation in south China, the objectives of this work are to (1) clarify mineral composition of different lithofacies shales; (2) illustrate the pore structure characteristics of different lithofacies shales; (3) elucidate the influence of different mineral composition on pore development of over-mature shales.

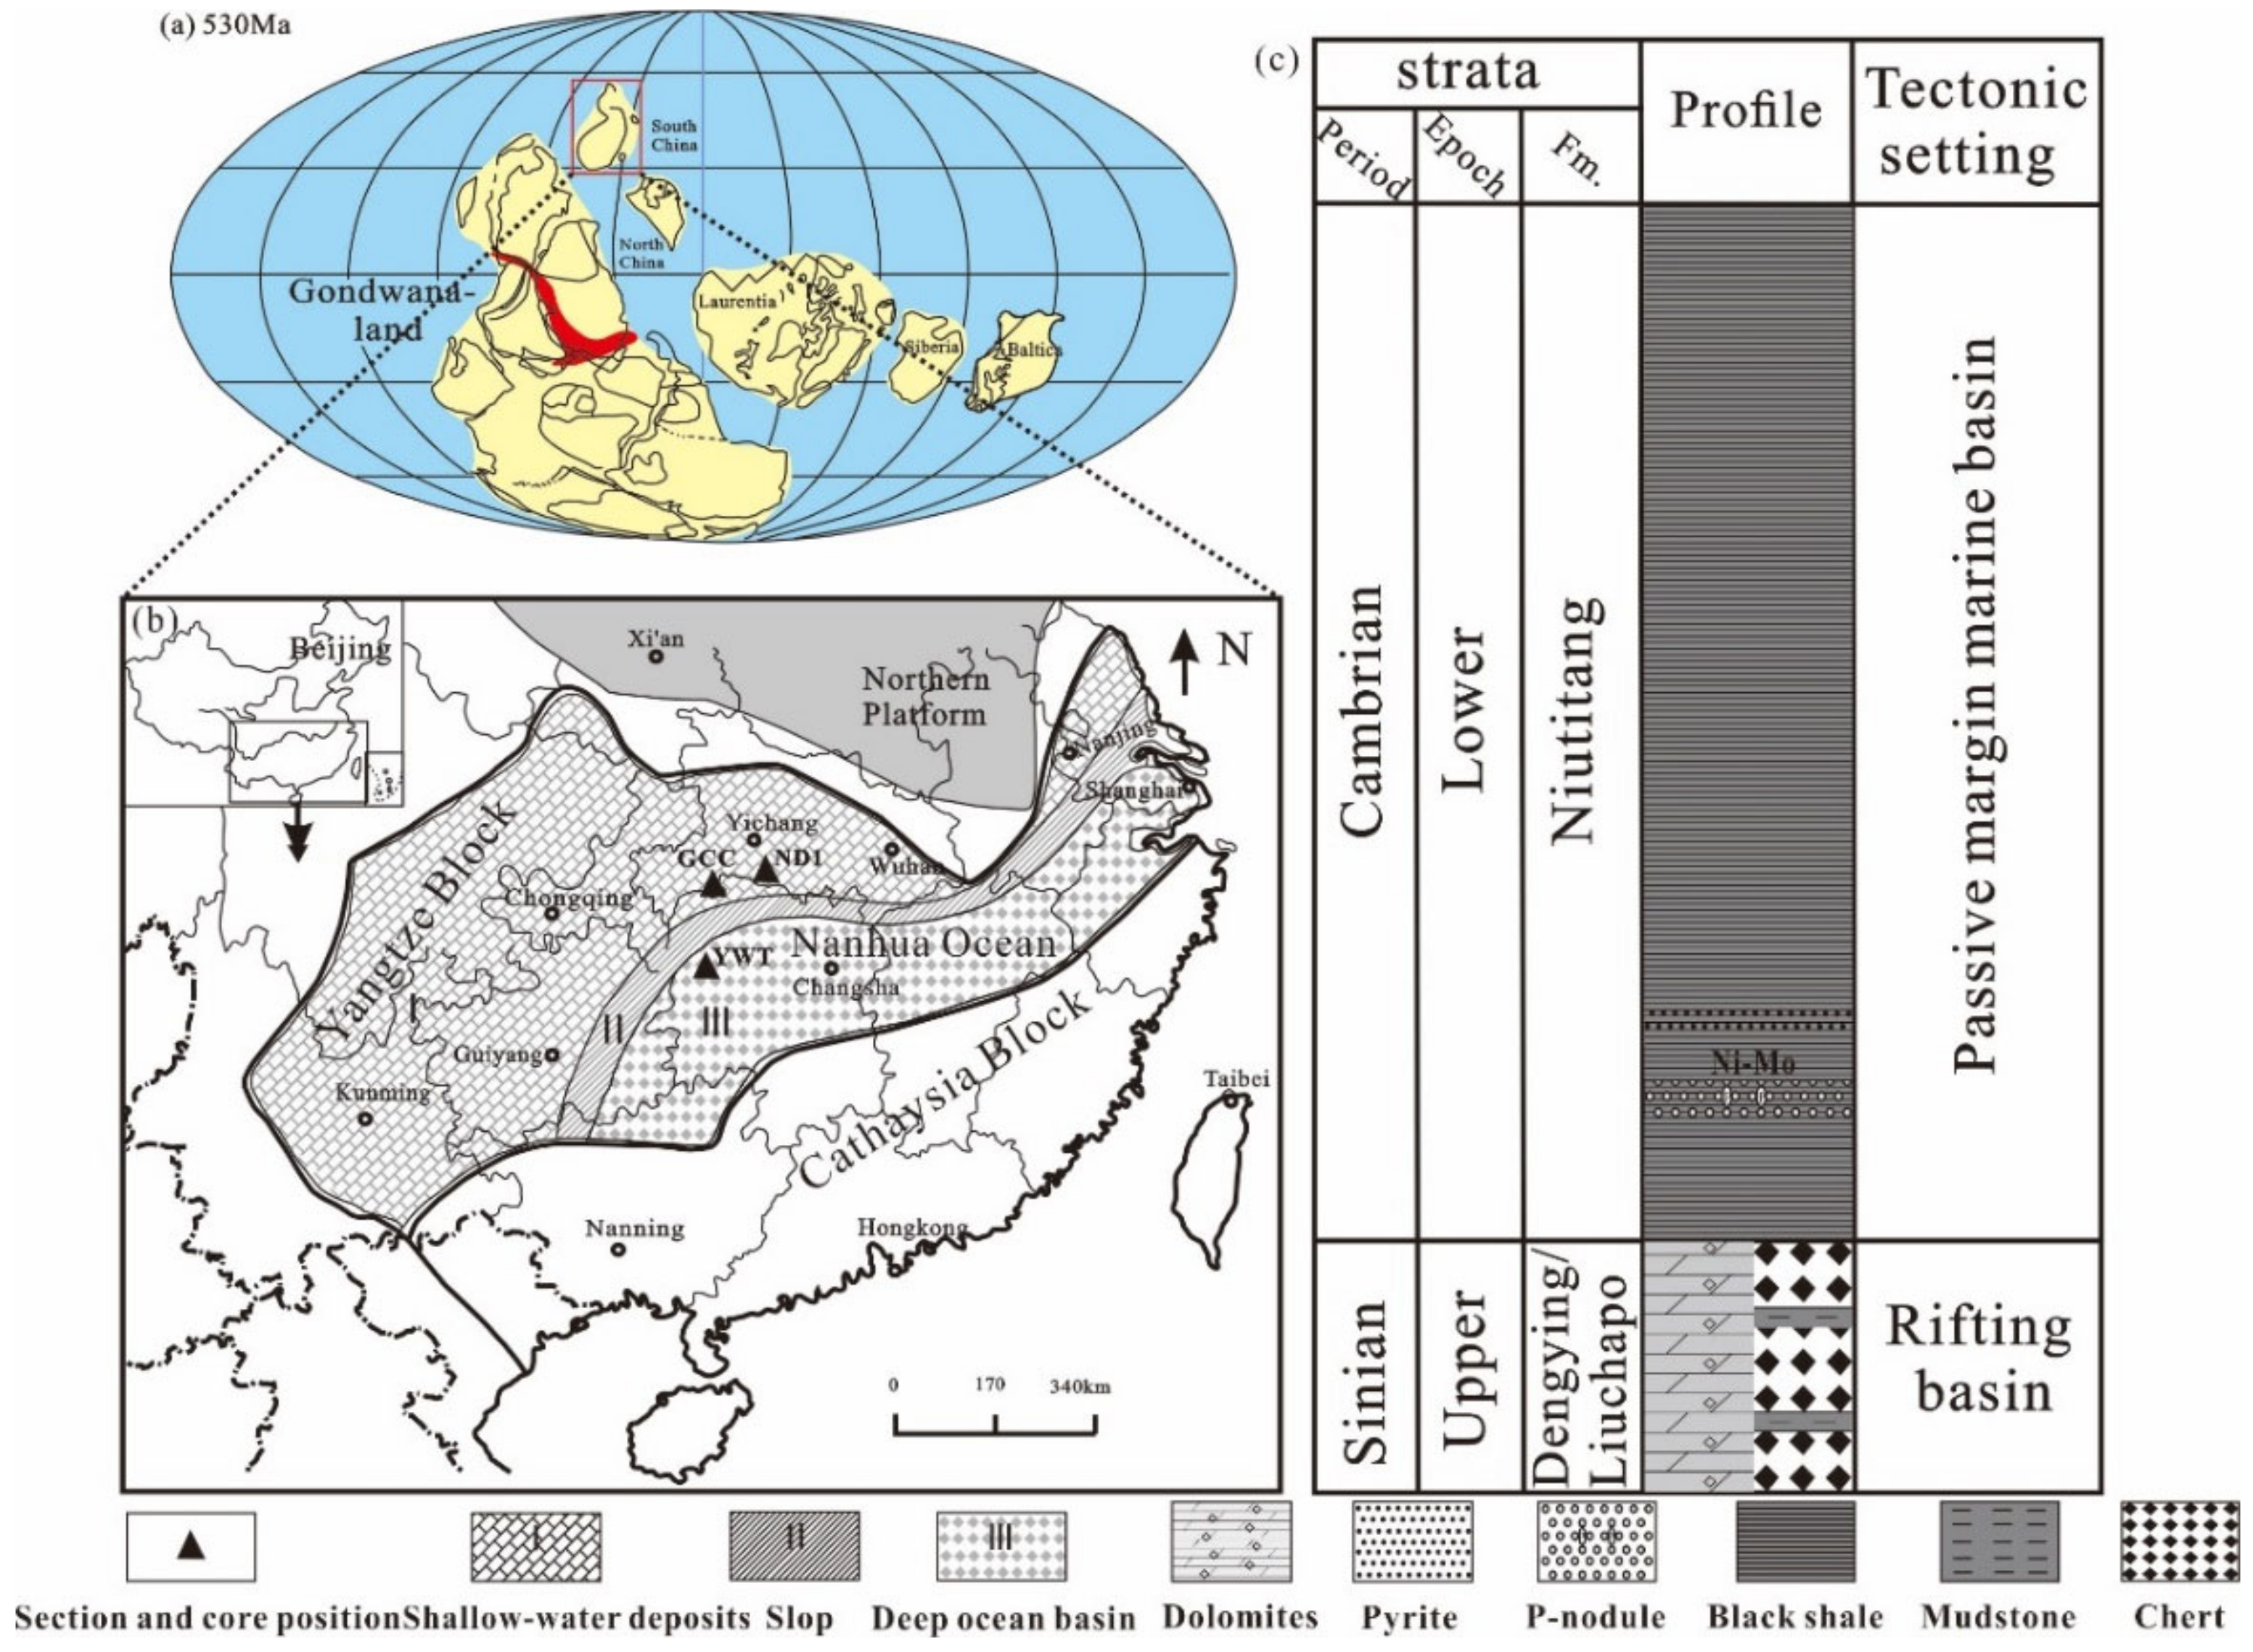
2. Geological Settings

By ca. 530 Ma, the South China Craton was positioned between 30 degrees and 60 degrees north latitude (Figure 1a) [22]. In mid-Neoproterozoic, South China consisted of two tectonic blocks, Yangtze and Cathaysia. The Nanhua Basin formed between them, which was the result of a failed intracratonic rift in the late Neoproterozoic (Figure 1b) [23]. After the rift events in Neoproterozoic, the Yangtze Block entered the passive continental margin basin stage during the transitional period of Ediacaran-Cambrian [24,25]. During Early Cambrian, the Yangtze Block presented three sedimentary belts from NW to SE: (1) shallow water deposits of Yangtze Platform, (2) slop, (3) deep ocean Basin of Nanhua (Figure 1b) [26,27,28,29].
As a result of global sea level rise in the Early Cambrian, black shales distributed almost over the whole Yangtze Block, which was in unconformity contact with the underlying Ediacaran Dengying Formation dolomite or conformable contact with the coeval black chert-shale successions of Liuchapo Formation basinwards (Figure 1c) [23]. Niutitang Formation consisted of a thick layer of black shale sequence with a phosphorite nodule-rich horizon and a Ni–Mo-PGE sulfide-rich layer at the base. Meanwhile, abundant pyrites can be found in the lower part in deeper water sections (Figure 1c). Two outcrop sections (GCC and YWT) and one well (ND1) were selected for this study. Paleo-geographically, the GCC section and the ND1 well are both located in shallow water deposits facies (Figure 1b), while the YWT section is located in basin facies (Figure 1b).

3. Samples and Methods

3.1. Samples

All the samples collected from GCC section, ND1 well and YWT sections were described at decimeter scale. Total organic carbon (TOC) and mineralogical composition of 36 shale samples were analyzed by vario EL III CHNOS elemental analyzer (Langenselbold, Germany) and by X’Pert PRO DY2198 Diffractometer (Almelo, The Netherlands), respectively. Six samples (four siliceous shale samples and two argillaceous shale samples) were ion milled for scanning electron microscopy (SEM)- cathodoluminescence (CL) imaging analyses at the state key laboratory of geological processes and mineral resources, China University of Geosciences (Wuhan). Moreover, low pressure gas adsorption (N2 and CO2) experiments were conducted on eleven samples (six samples of siliceous shale and five samples of argillaceous shale) using a Micromeritics ASAP 2020 surface area analyzer (Norcross, GA, USA).

3.2. Organic Geochemical Analysis and Mineralogical Composition

To determine the total organic carbon of Niutitang shales, samples selected from GCC section, ND1 well and YWT section were cut into small pieces and then crushed to powder using Agate mortar. After that these powder were pretreated with 5% HCl to remove inorganic carbon, then dried for element analyzer test.
To measure the mineralogical composition and different clay minerals of Niutitang shales, Thirty-six shale samples were milled into less than 200 mesh powders and tested by X-ray diffraction. The percentages of minerals in shale samples were estimated semi-quantitatively by using Lorentz Polarization to correct the main peaks area [30].

3.3. FE-SEM Observation

The pore morphology of Niutitang shale samples were determined under high vacuum by using FEI Quanta 450 FEG field emission scanning electron microscope (Hillsboro, OR, USA), with a resolution of 1.2 nm at 30 kV. All the samples for FE-SEM observation were polished by argon ion in advance, which can protect the true pore morphology of the sample surface from the mechanical polishing damage. A thin carbon layer was then sprayed on the surface of samples.

3.4. Low Pressure N2 and CO2 Isotherm Analyses

By applying the Micromeritics ASAP 2020 surface area instrument, low pressure gas (N2 and CO2) adsorption analyses were performed to measure the pore structure of Niutitang shales at China University of Geosciences (Wuhan). Prior to analysis, the shale samples were ground into 60–80 mesh size and degassed under vacuum for 16 h at 110 °C to remove adsorbed moisture and volatile material. The relative pressure (P/P0, P = equilibrium pressure and P0 = saturated vapor pressure) for N2 adsorption and desorption ranges from 0.001 to 0.995. Based on the data of N2 adsorption branch, specific surface areas (SA) were obtained using Barrett-Emmett-Teller (BET) theory and pore volumes (PV) were calculated by using Barrett-Joyner-Halenda (BJH) method. CO2 adsorption experiments were measured within a relative pressure ranging from 0.0004–0.032 at 273 K. Applying the density functional theory (DFT) method, the SA, PV, and PSD (pore size distributions) of micropores were obtained.

4. Results

4.1. Organic Geochemistry and Petrology

The TOC content and mineralogical compositions of shale samples from Niutitang formation in GCC section, ND1 well and YWT section are presented in Table 1. TOC content ranges from 0.32 wt% to 13.2 wt% in our sample set, averaging 1.40 wt% for GCC section, 3.02 wt% for ND1 well and 10.53 wt% for YWT section.
The mineral compositions of Niutitang shale samples are dominated by quartz and clay minerals. The contents of quartz and clay minerals range from 25% to 96% and 3% to 64%, respectively. Besides, illite is dominant in clay minerals. The average content of quartz increases from GCC section to ND1 well to YWT section (mean 35%, 47%, 85%, respectively), while the average content of clay minerals decreases (mean 52%, 13%, 11%, respectively) (Table 1). Moreover, carbonate minerals content is high in samples from ND1 well, except ND1-28 sample (Table 1).

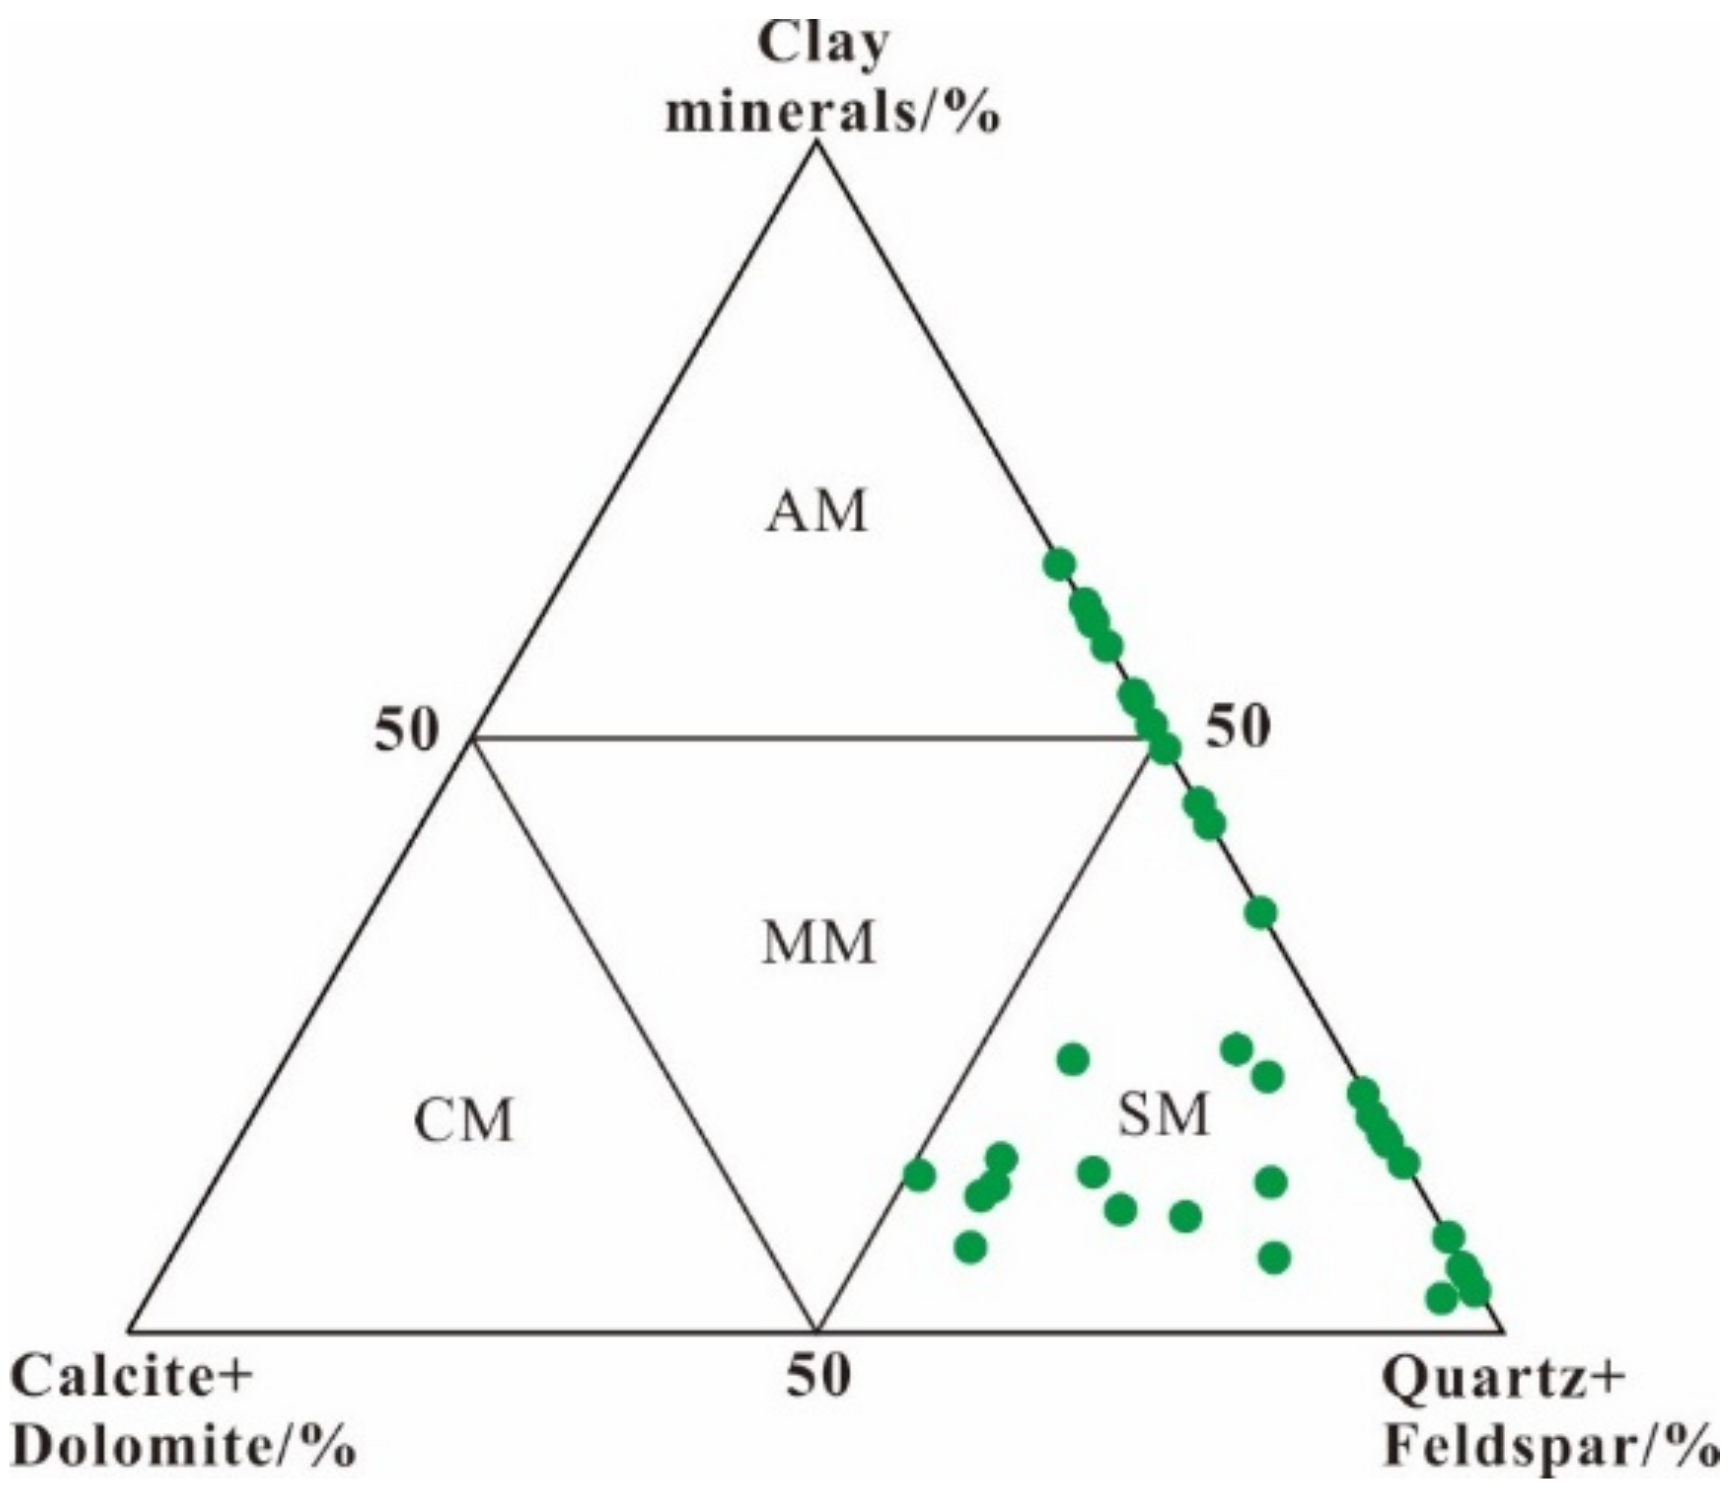
4.2. Lithofacies Classification

According to the ternary diagram of siliceous minerals (quartz + feldspar)-carbonate minerals-clay minerals, shale could be divided into four lithofacies: argillaceous shale (AM), siliceous shale (SM), calcareous shale (CM) and mixed shale (MM) [31,32,33,34]. As presented in Figure 2, the Niutitang shales are divided into two lithofacies: siliceous shale and argillaceous shale. The siliceous shales contain higher siliceous minerals contents (51–96%), with the clay minerals contents range from 4–49%. The argillaceous shales contain less siliceous minerals contents (40–49%) and more clay minerals contents (51–64%) (Table 1).

4.3. Pore Structure Characterization by FE-SEM Observation
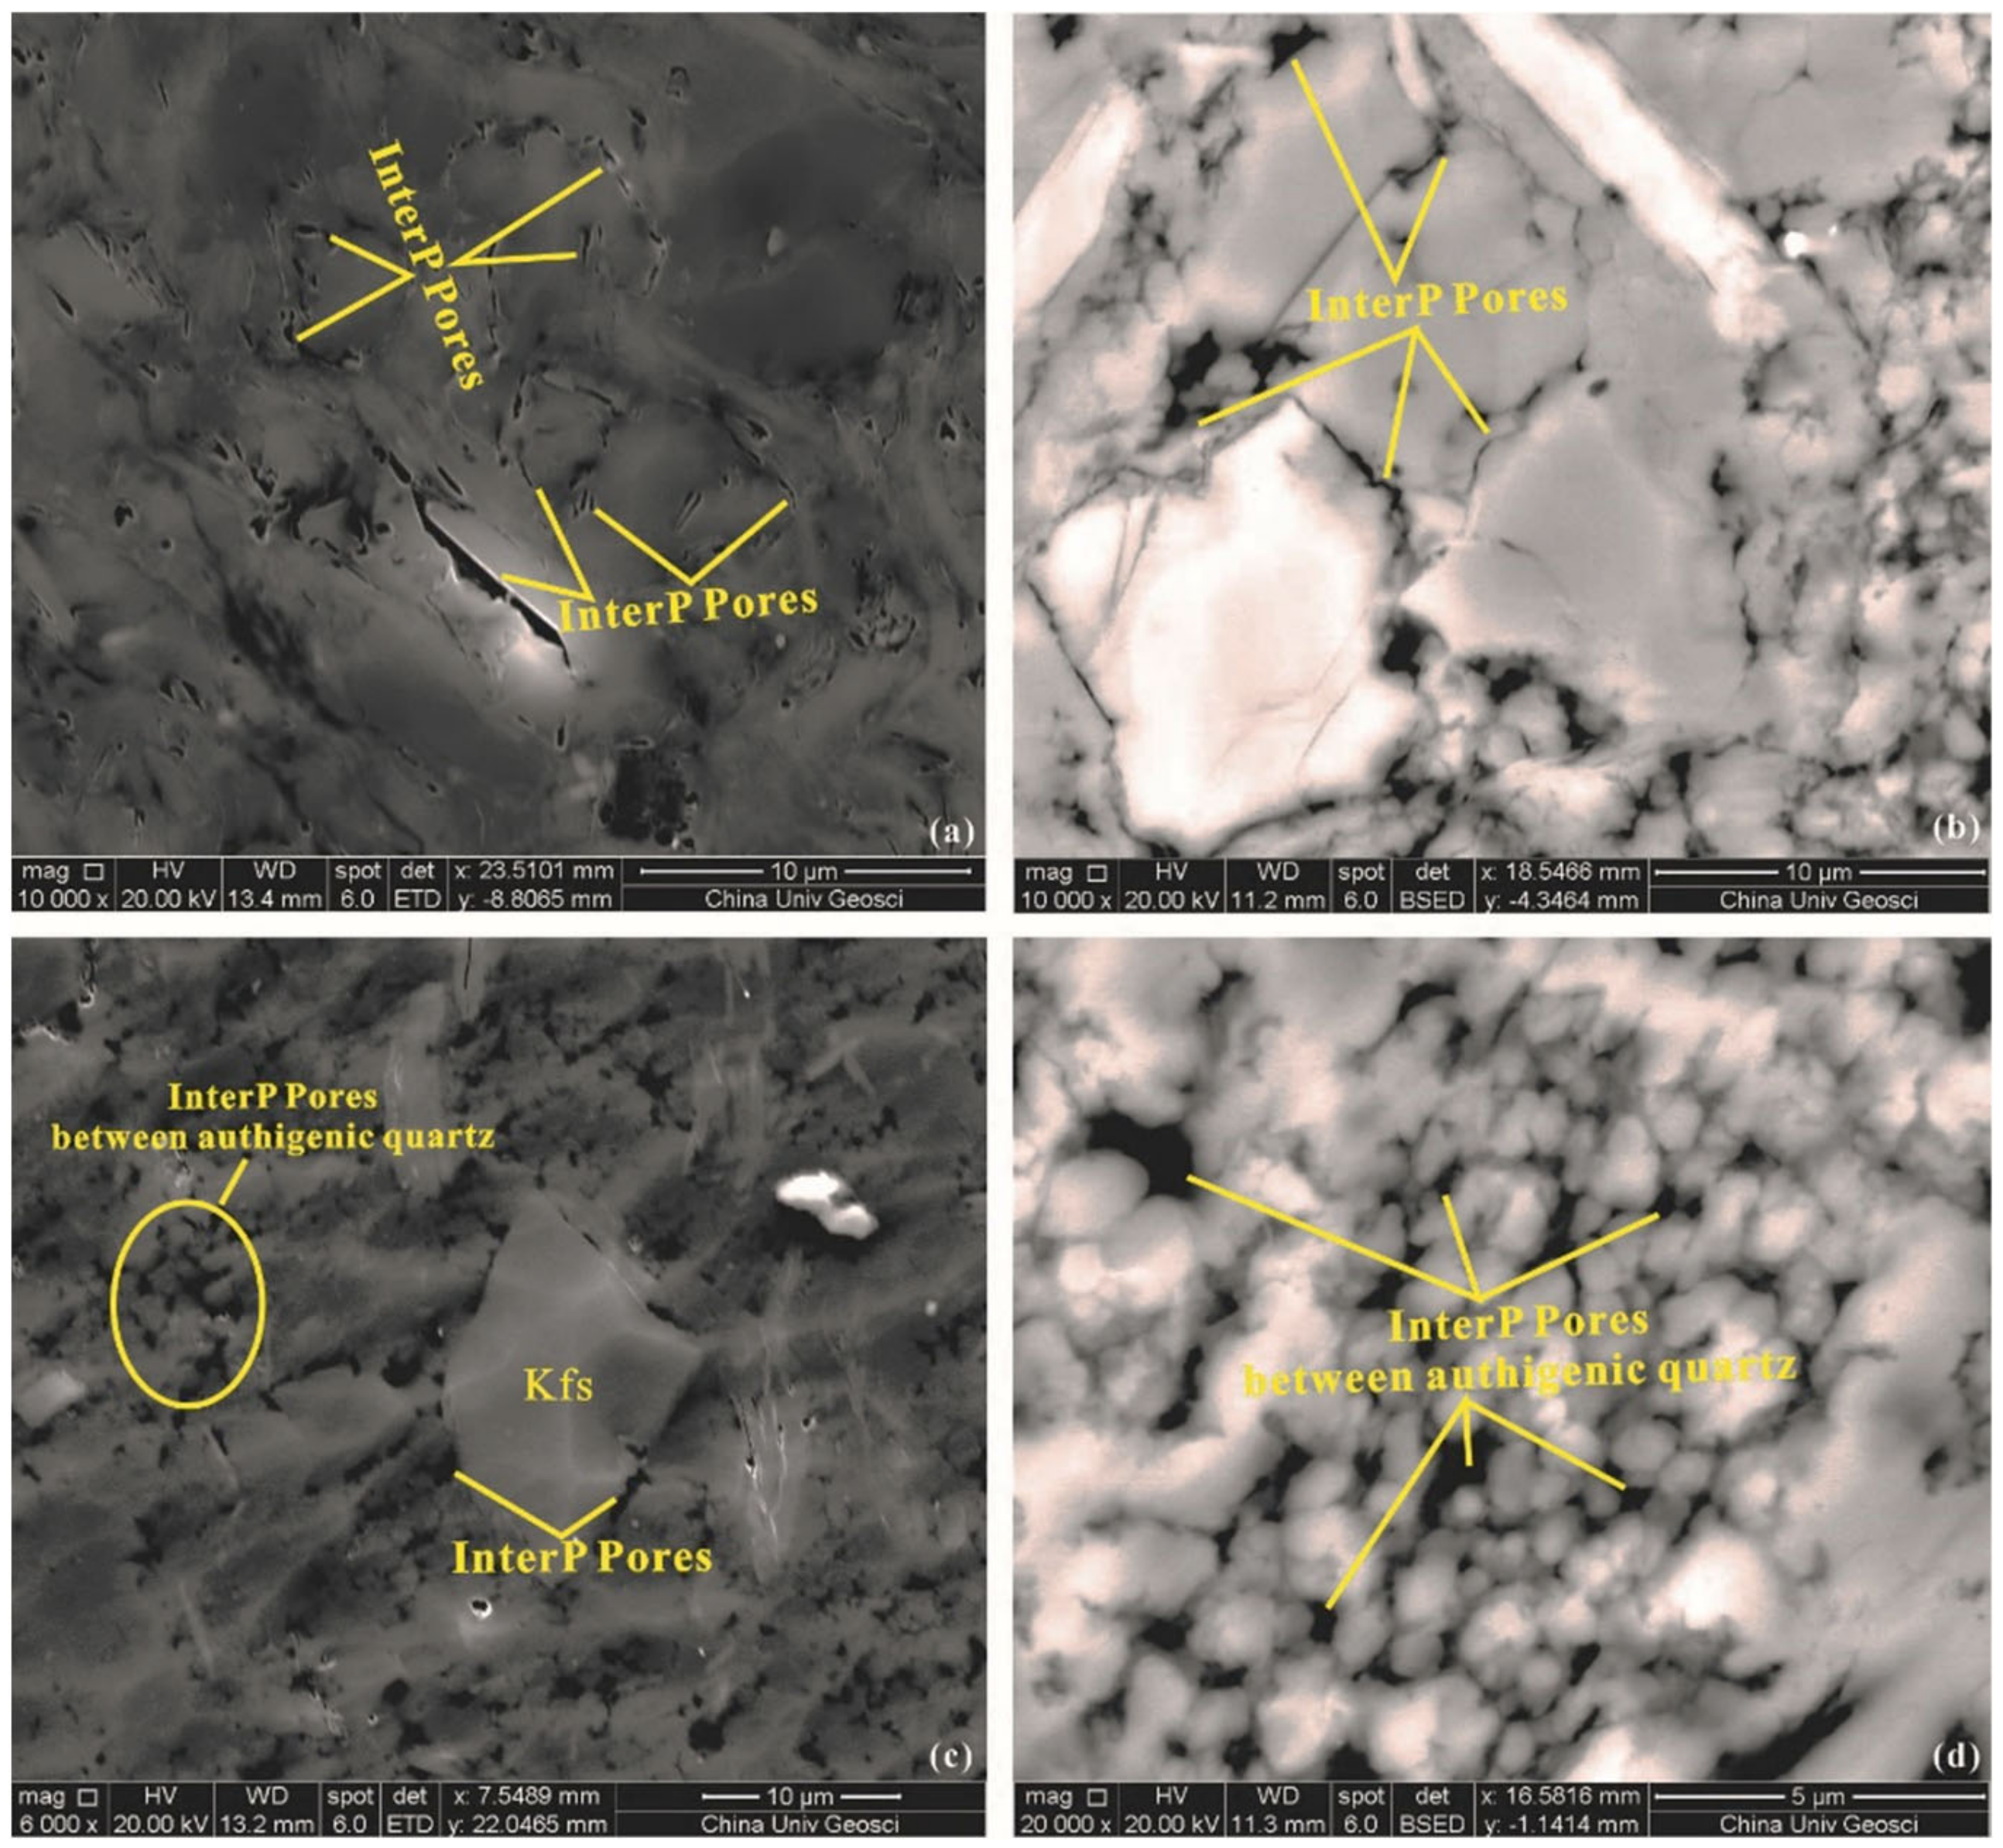
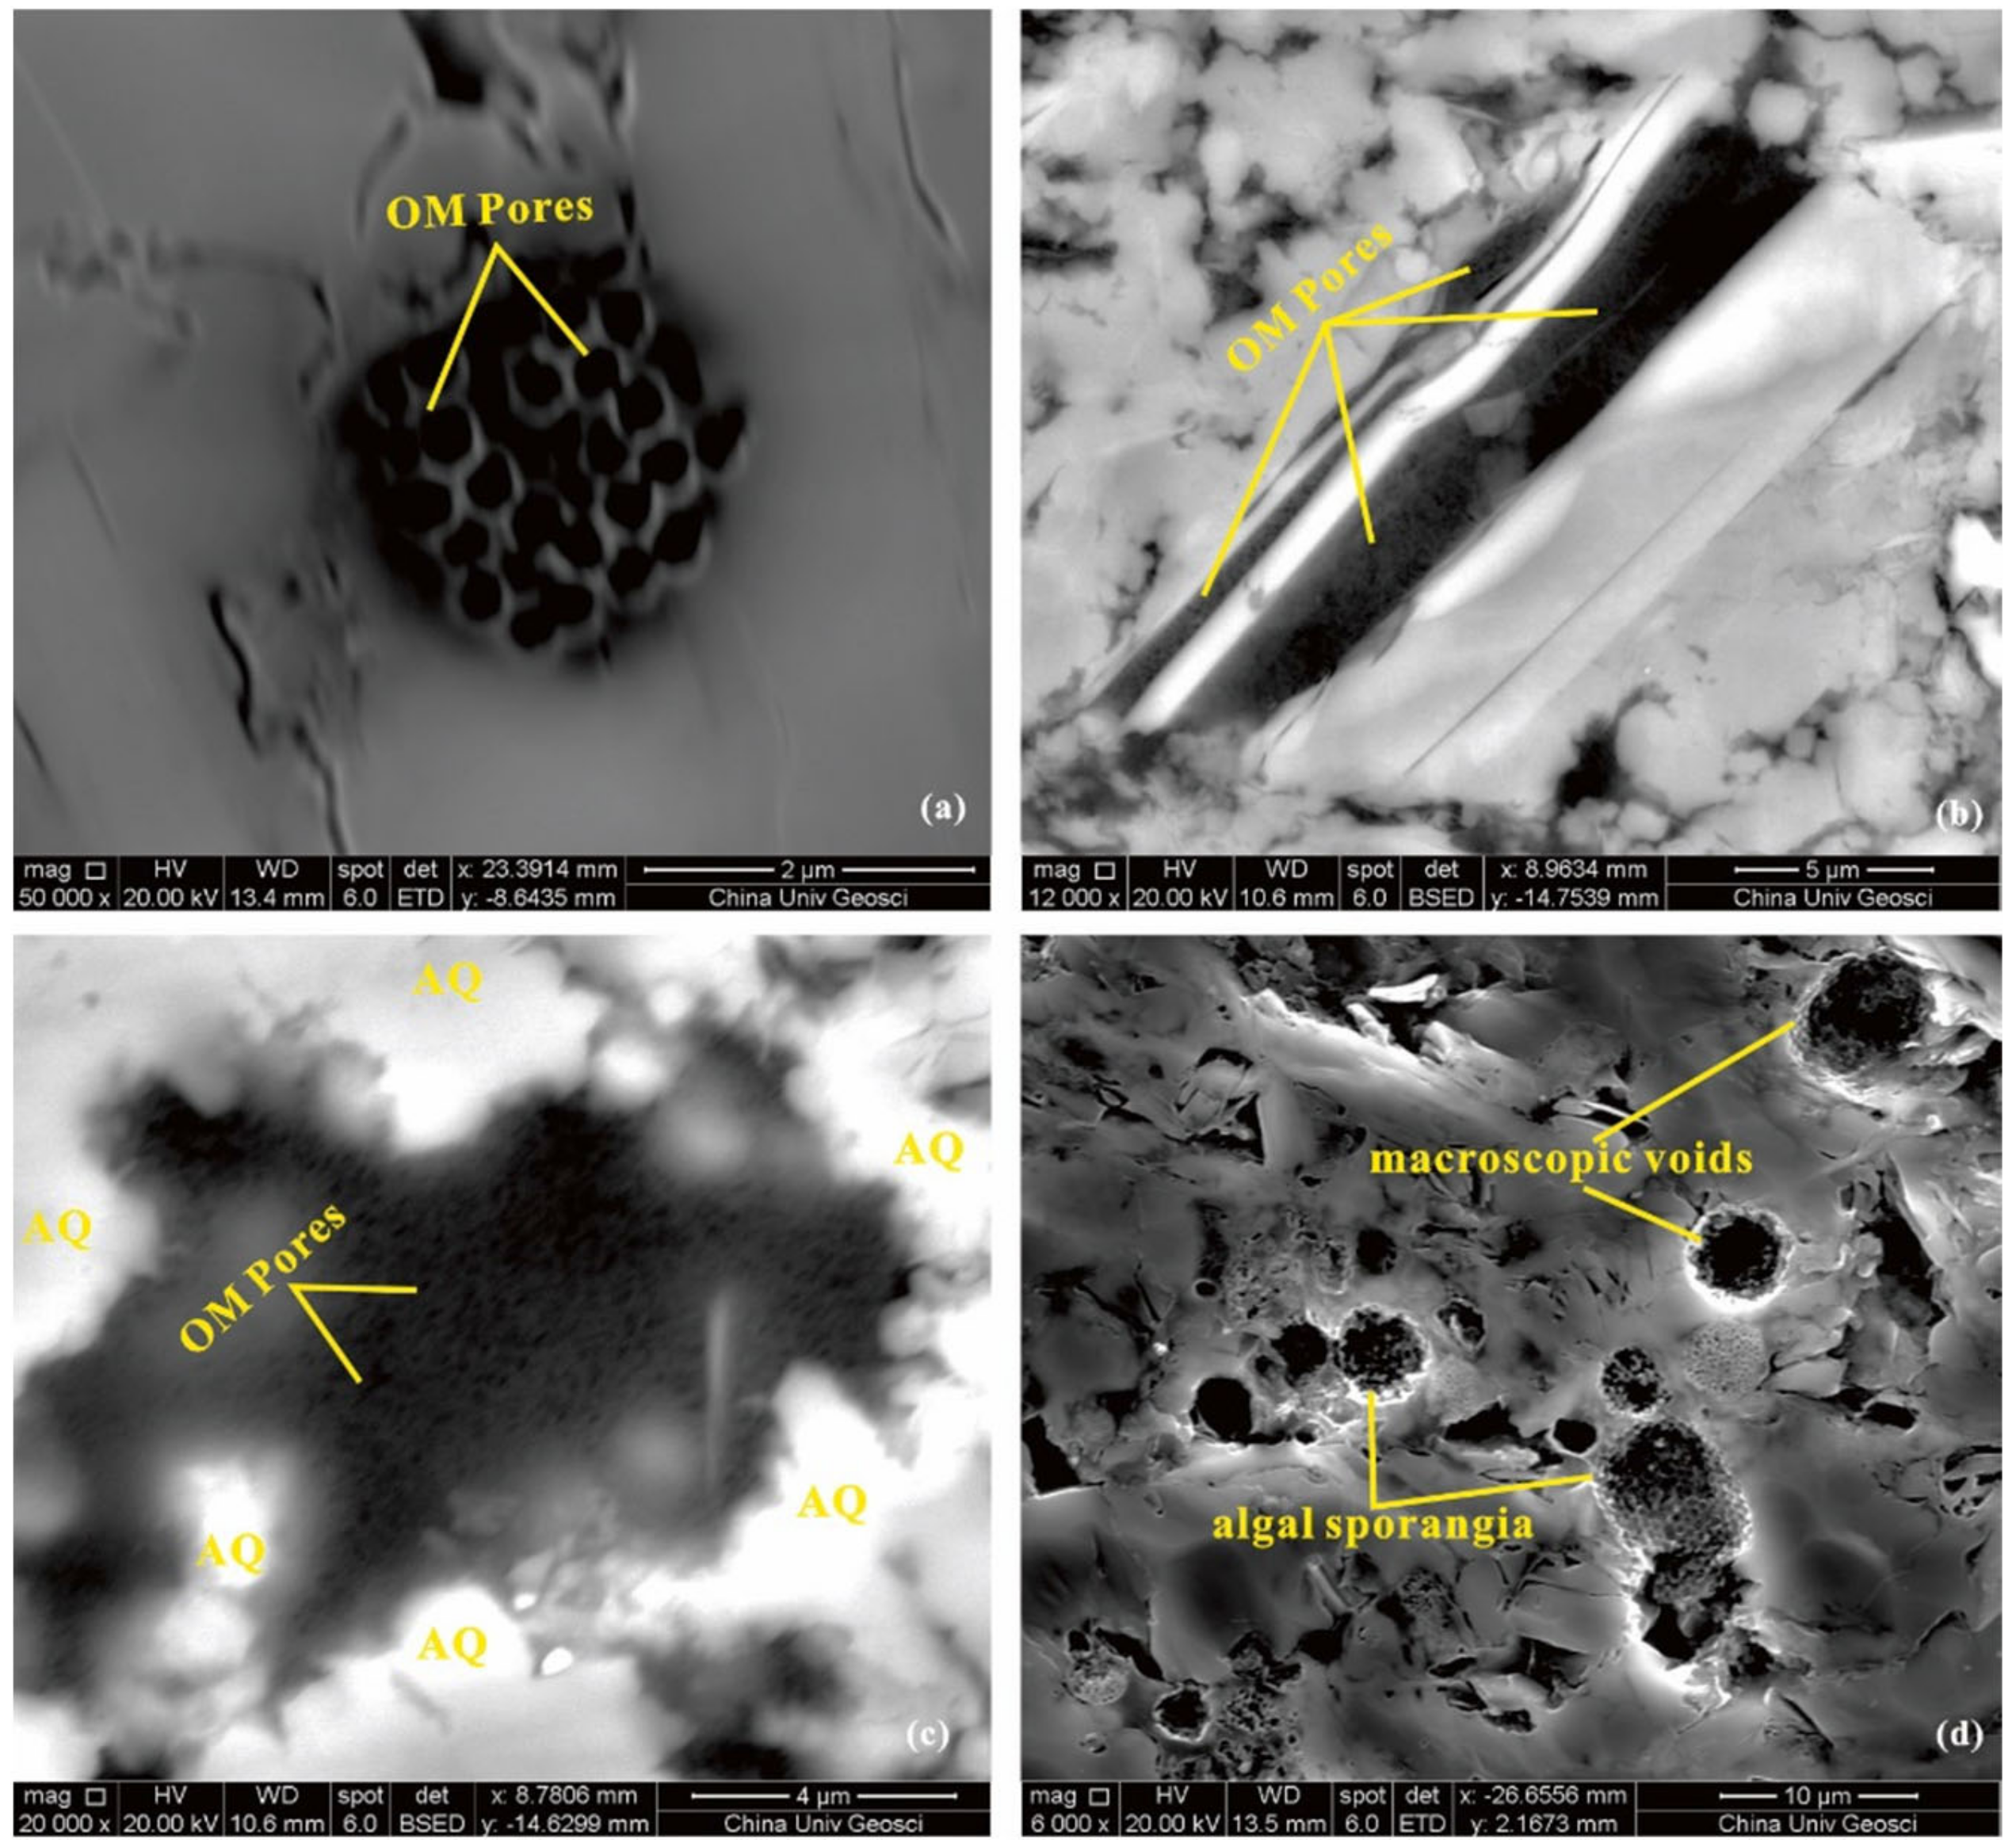
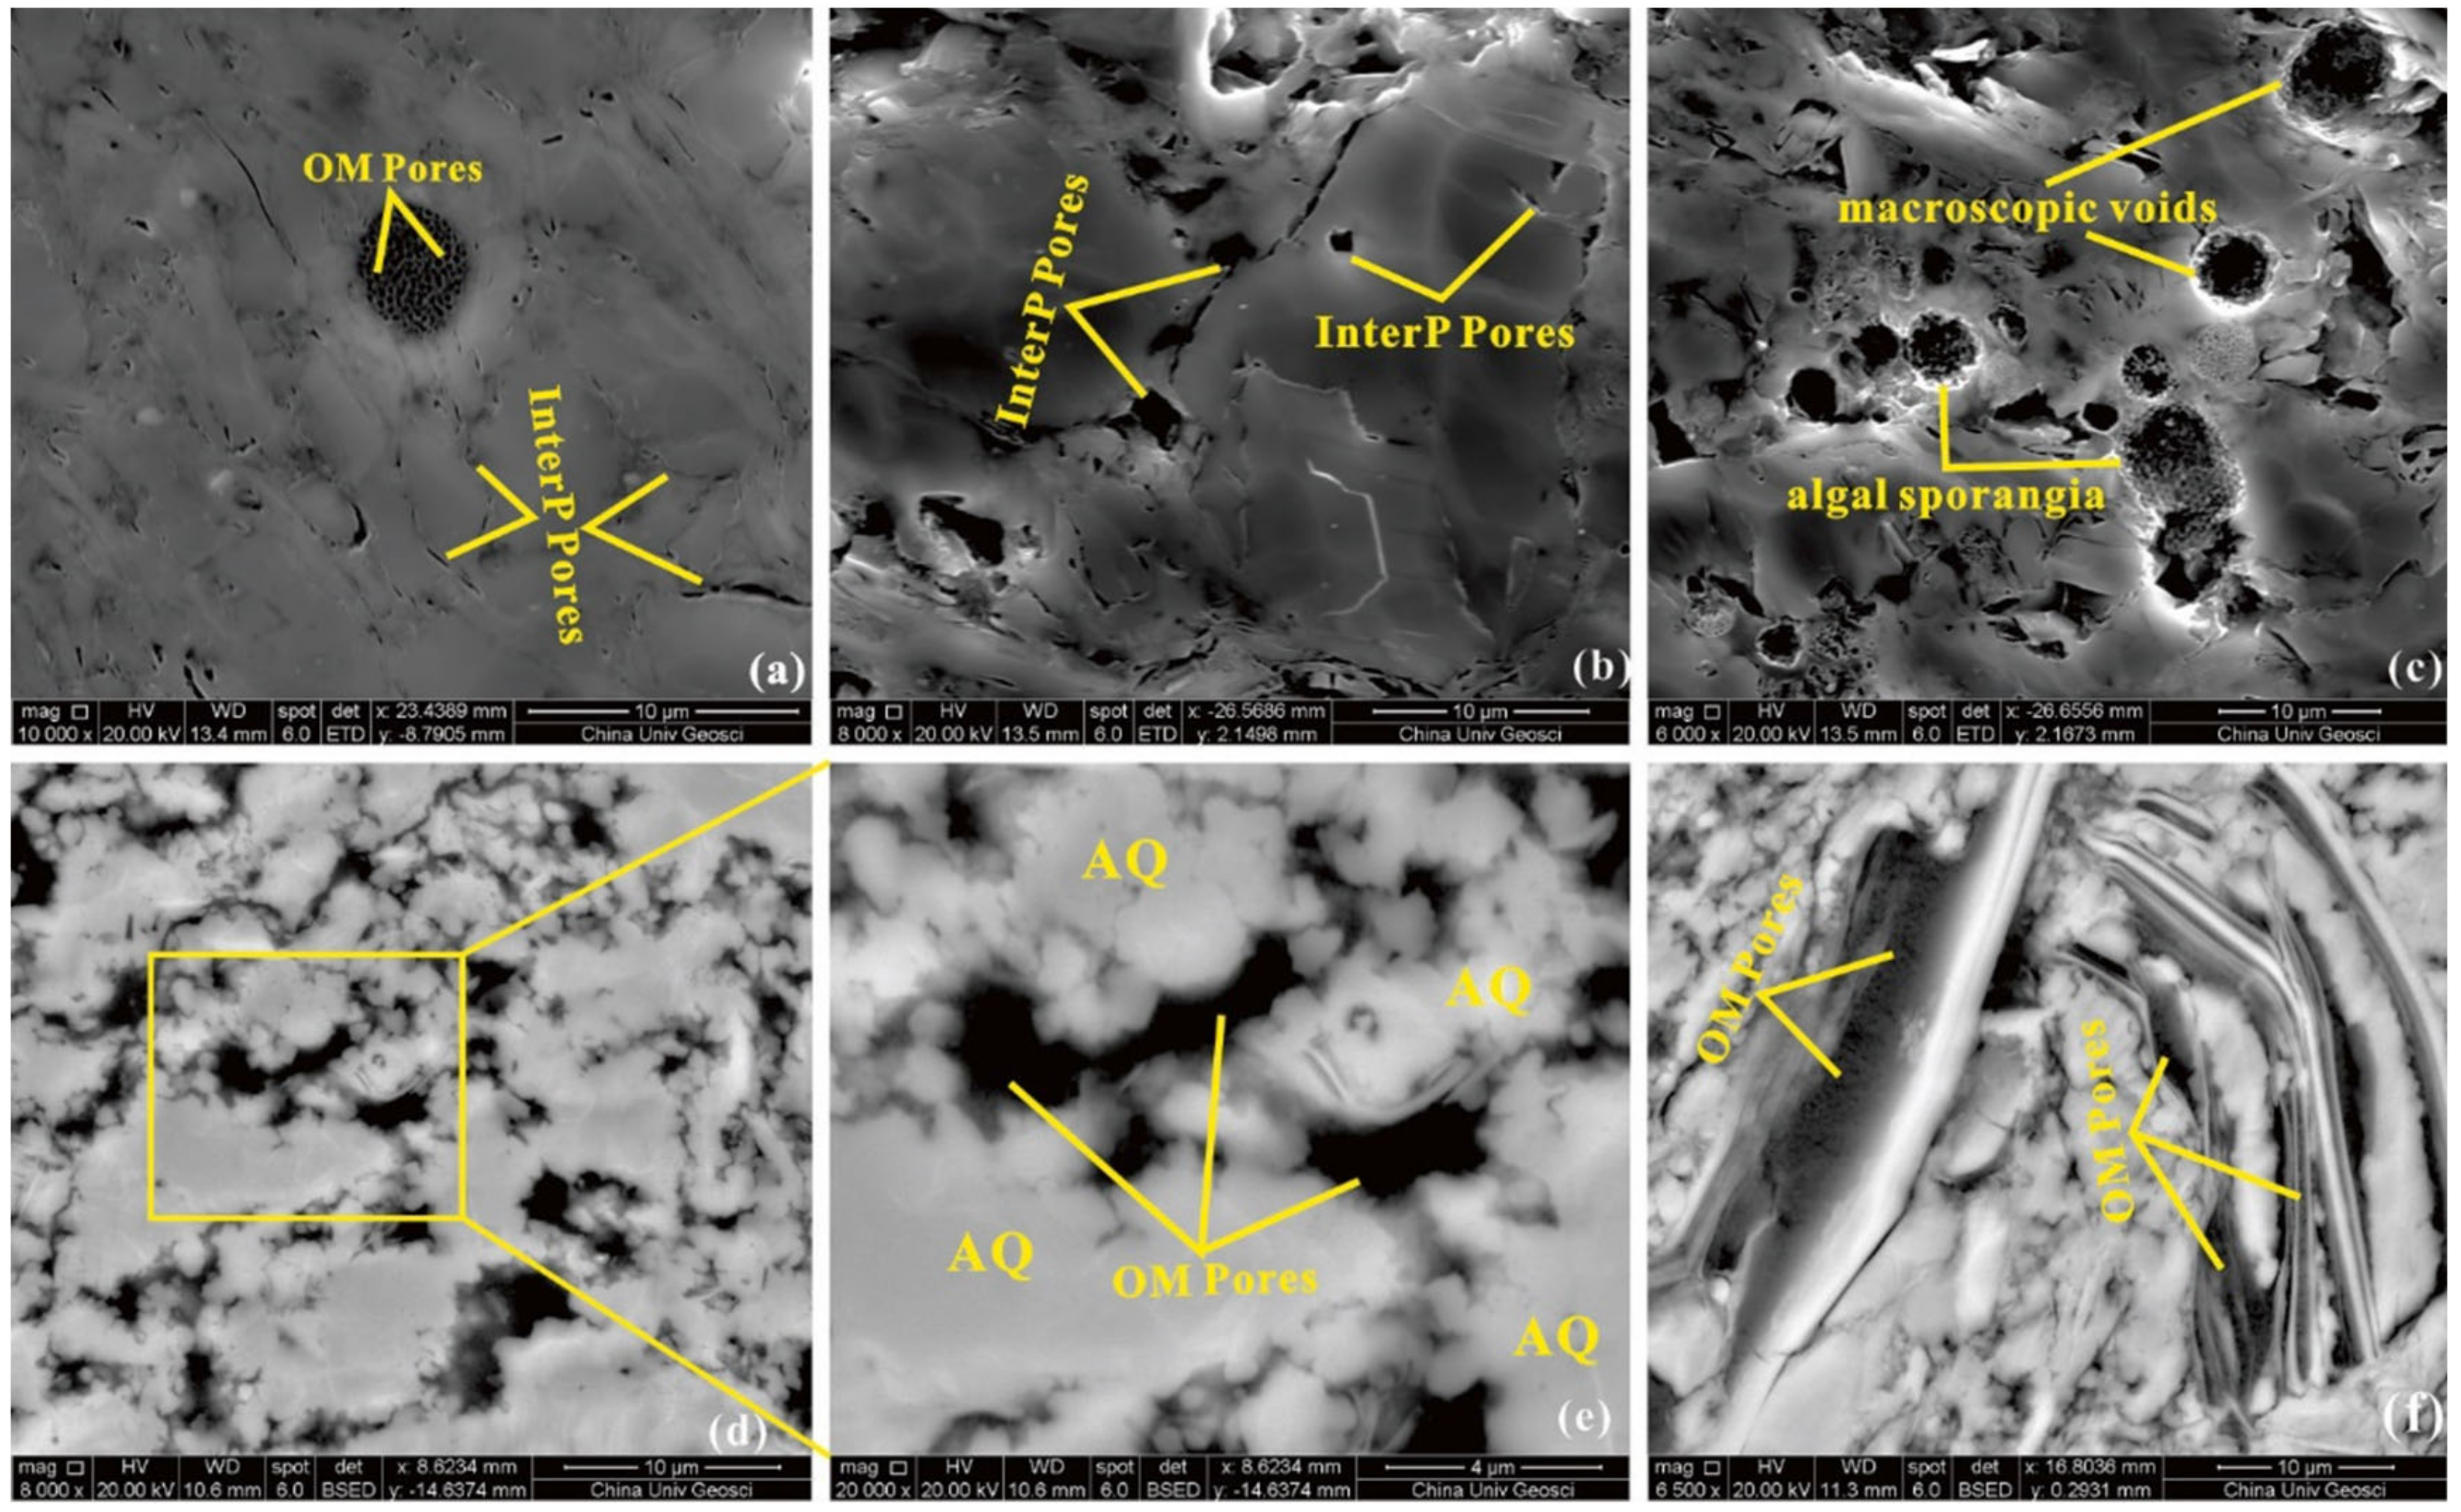
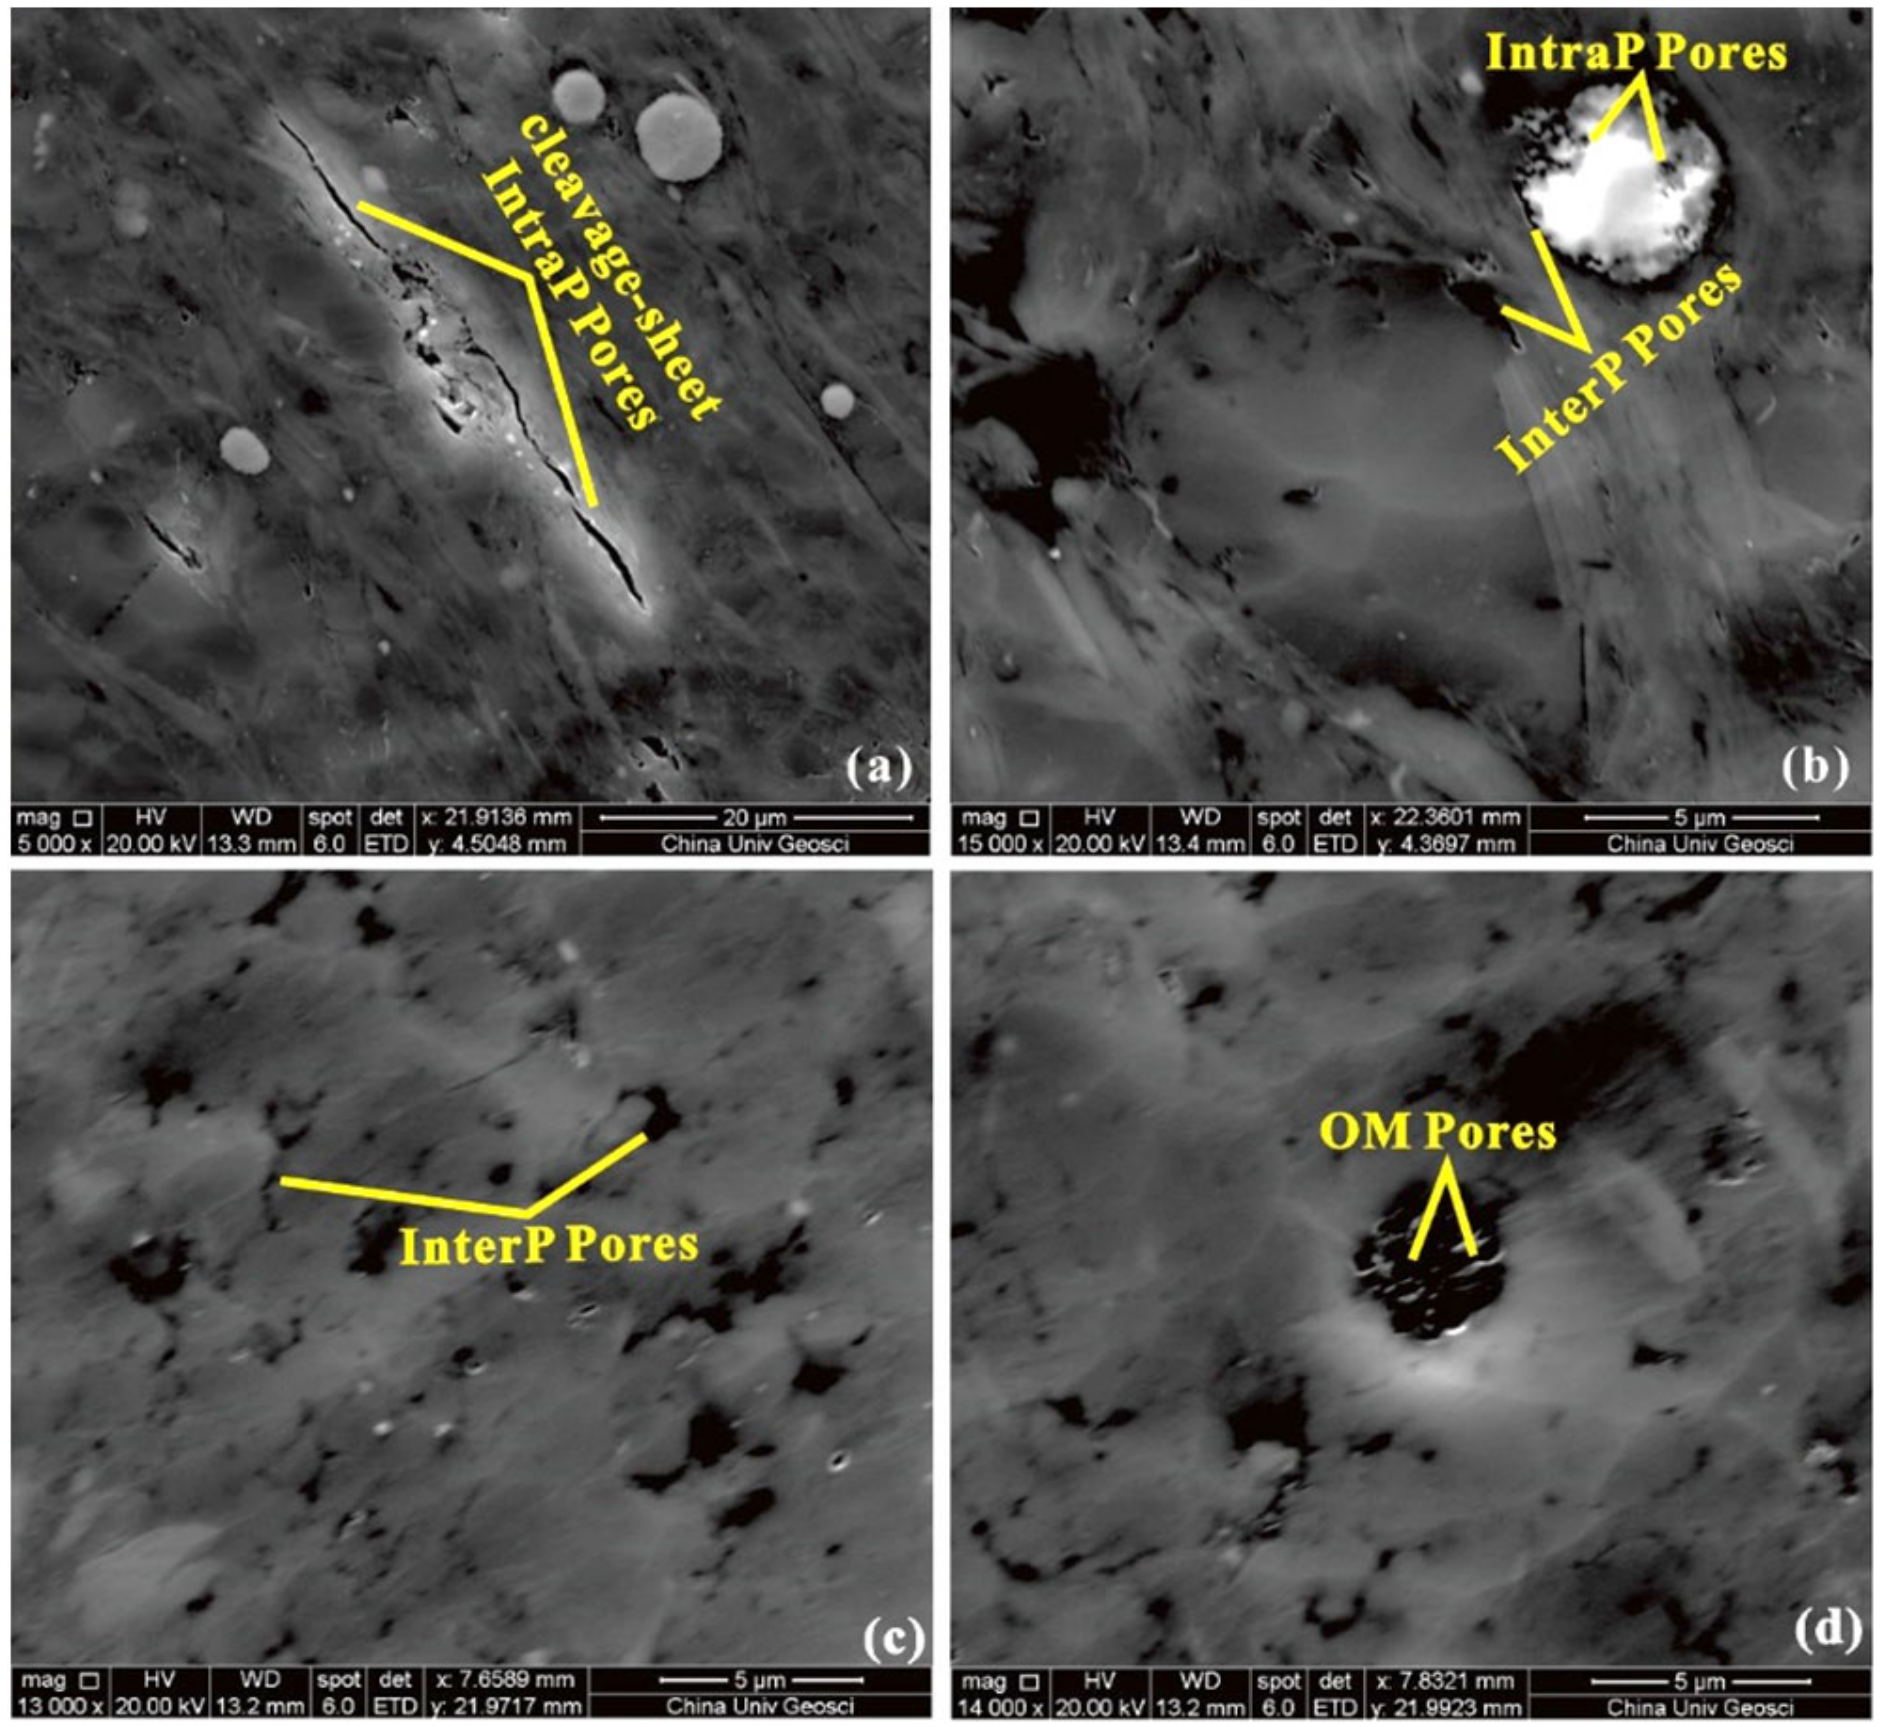
4.3.1. Pore Type

According to the pore morphology, pores in shales are classified into three categories: interparticle pores (interP), intraparticle pores (intraP) and organic pores [35,36]. The pore morphology of Niutitang shales were investigated by FE-SEM.
Interparticle pores are observed between particles that vary from soft and ductile (such as clay) to hard and rigid (such as quartz) and have multifarious shapes with pore size ranging from tens of nanometers to about 3 μm (Figure 3). Moreover, interparticle pores between authigenic microcrystalline quartz are identified, which are well preserved and connected (Figure 3c,d).
The intraparticle pores in Niutitang shale occur in three forms: (1) as cleavage-sheet intraparticle pores within clay minerals, (2) as intraP pores within framboidal pyrite, (3) as corrosion pores developed within certain unstable minerals, such as quartz, carbonate, feldspar and euhedral pyrite (Figure 4). Cleavage-sheet intraparticle pores within clay minerals are usually linear-shaped, with several micrometers long and tens to hundreds of nanometers wide (Figure 4a,b). A certain amount of OM and clay minerals have transformed into organo−clay complexes (Figure 4b). Pyrite framboids formed in anoxic sea environments consists of many small pyrite crystals. Most pore sizes between pyrite crystals is about 100 nm (Figure 4c). Dissolution-related intraP pores are usually observed within primary detrital particles, such as quartz, carbonate, feldspar, and euhedral pyrite (Figure 4d–f). When there are relatively high content carbonate grains in shale, a mass of dissolution intraP pores can be observed (Figure 4e). Most dissolution pores are spherical, ellipsoidal and some are slit-shaped (Figure 4). IntraP pores are usually in a dispersive distribution and have poor connectivity or even disconnection, with pore size ranging from tens nanometers to several micrometers (Figure 4).
OM pores are produced by the generation and expulsion of hydrocarbons during the thermal evolution of organic matter or related to the skeleton structure of organic organisms [3,34,37]. OM pores created by hydrocarbon generation are mostly spherical, ellipsoidal, or honeycomb-shaped (Figure 5a–c), while OM pores related to paleontology, which may be algal sporangia [19], are generally featured by large pore size, local concentration and good connectivity (Figure 5d). Most OM pores in Niutitang shales occur within clay minerals or between microcrystalline quartz (Figure 5b,c). InterP pores between authigenic quartz provided enough space for the filling of amorphous OM (probably bitumen) during hydrocarbon generation and protected OM pores from collapsing during compactional gas expulsion (Figure 5c) [6]. The organic pores show narrow size distribution with width ranging from tens to hundreds of nanometers. According to the current 2D images, theses OM pores display isolated or connected with each other (Figure 5).

4.3.2. Pore Structure Characteristics in Different Lithofacies

Any shale facies that given perhaps are characterized by one pore type or an association of several pore types. Mineralogy and sedimentary features of shale highly control pore network and pore distribution [38]. As described above, two lithofacies were recognized in Niutitang Formation, and show various mineralogical compositions. Hence, pore structure characteristics should be diverse from facies to facies. The pore structure characteristics of different lithofacies are described in the sections below.

The Pore Characteristics of Siliceous Shale

Two siliceous shale samples from GCC section (GCC-09 and GCC-66) and two siliceous shale samples from YWT section (YWT-49 and YWT-75) were investigated by FE-SEM for the pore morphology of siliceous shale in Niutitang formation. FE-SEM images demonstrate that organic pores are mainly developed in siliceous shale, and tend to increase as the TOC content increases. The siliceous shale in GCC section are dominated by interparticle pores with minor organic pores and intraparticle pores (Figure 3a; Figure 6a,b). The organic pores in samples GCC-09 (TOC = 1.55 wt.%) and GCC-66 (TOC = 2.59 wt.%) are mostly in honeycomb shape (Figure 5a; Figure 6a). In addition, a large number of macroscopic voids, similar to algal sporangia as described by Yang et al., 2016, are observed in GCC-66 (Figure 5d; Figure 6c). The major pore types in siliceous shale of YWT section are interparticle pores (Figure 3b,d), while abundant organic pores are also observed, especially in YWT-49 (TOC = 9.46 wt.%) (Figure 6d–f). Moreover, numerous interparticle pores between authigenic microcrystalline quartz are identified, which are well preserved and connected (Figure 4d; Figure 6d,e). These interparticle pores and cleavage-sheet intraparticle pores within clay minerals in both samples YWT-75 and YWT-49 are usually filled by amorphous organic matter, probably bitumen, in which abundant organic matter pores developed (Figure 5b,c; Figure 6d–f). As describes above, authigenic microcrystalline quartz and clay minerals (probably illite and smectite mixed-layer or illite) are blend with amorphous OM (Figure 6e,f; Figure 5a–c), which indicates that the generation and migration of hydrocarbon occurred after, or overlapped with authigenic quartz formation and the transformation of smectite to illite, moreover, the secondary pores between authigenic minerals were filled by the newly formed bitumen [38].

The Pore Characteristics of Argillaceous Shale

Two argillaceous shale samples (GCC-43 and GCC-67) from GCC section were investigated by FE-SEM for the pore morphology of argillaceous shale in Niutitang formation. Compared with siliceous shales, the argillaceous shales contain less siliceous minerals and more clay minerals. Due to the high content of clay minerals, the argillaceous shales are cemented tightly, resulting in interparticle pores are fewer compared with the siliceous shales (Figure 7). Cleavage-sheet intraparticle pores within clay minerals are common, and organic pores are rare and in honeycomb shape (Figure 7).

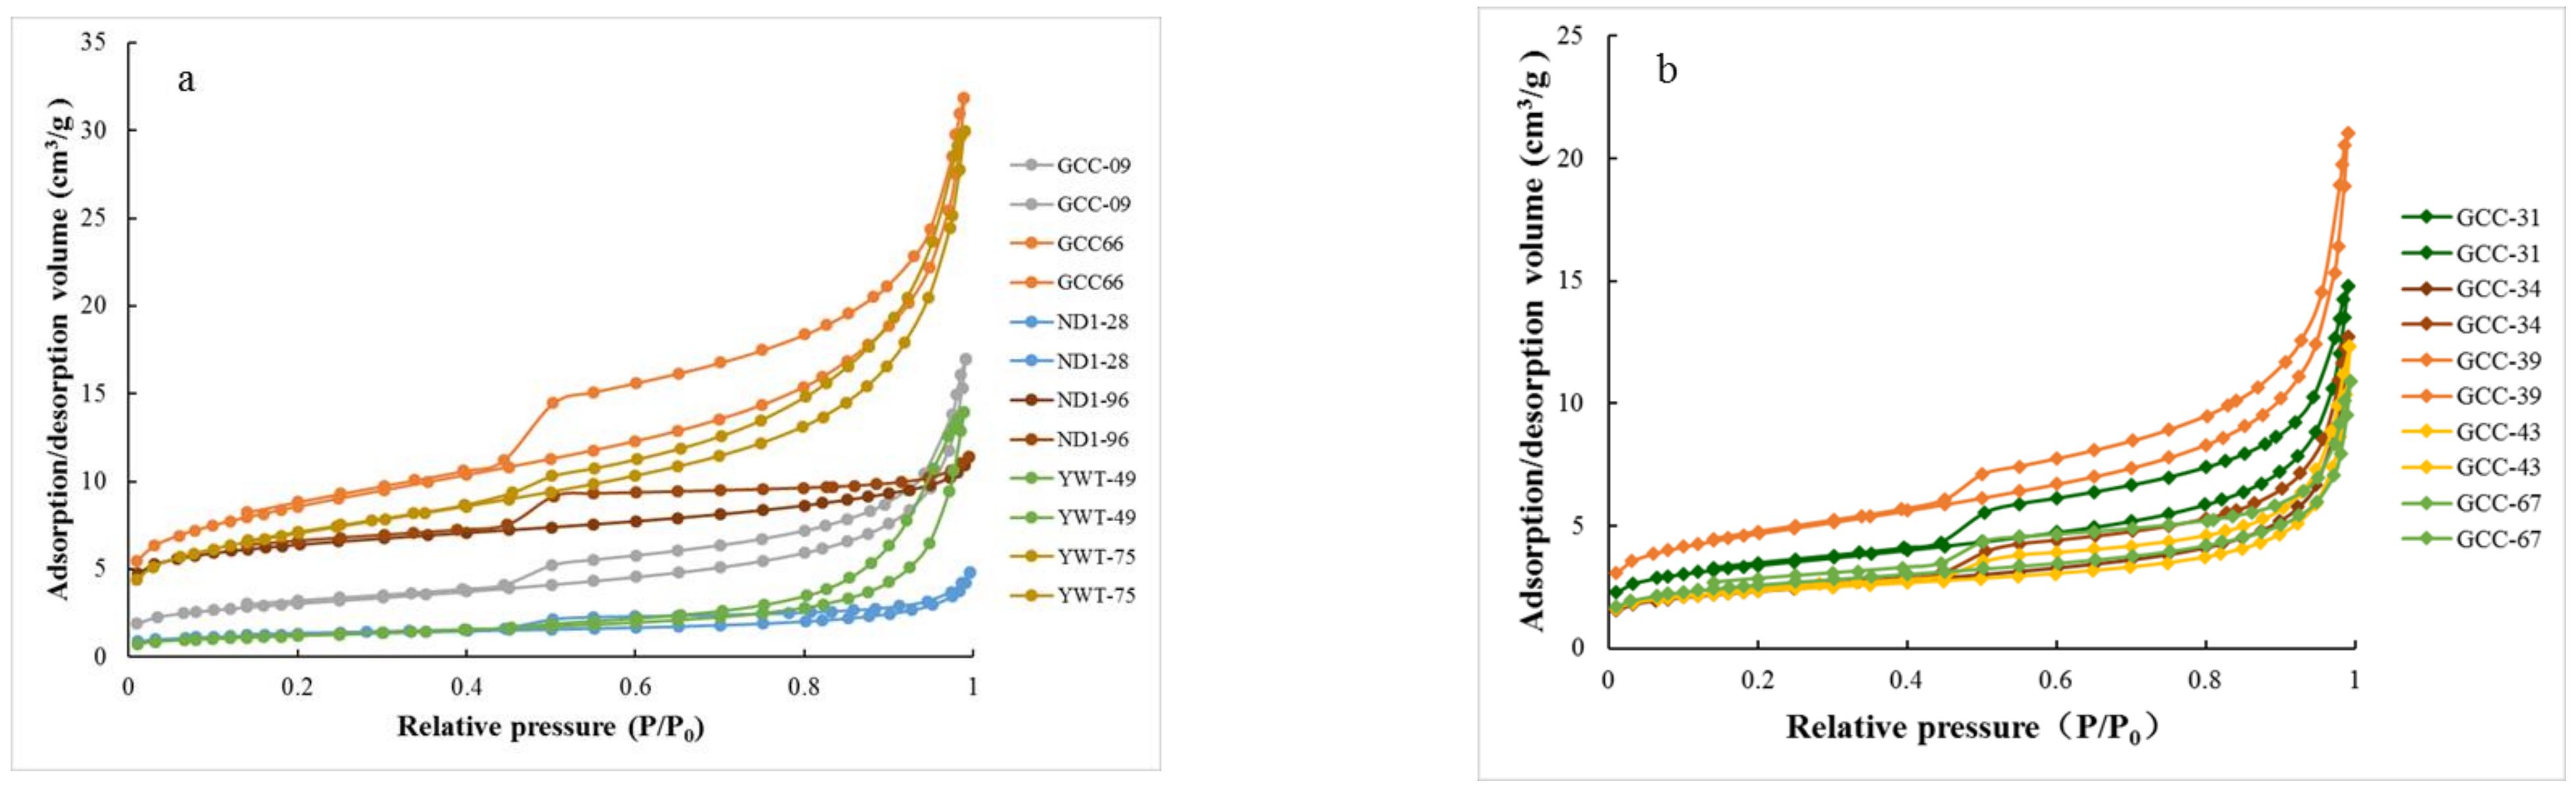
4.4. Pore Characterization by Low Pressure Nitrogen Adsorption

Low pressure nitrogen adsorption was applied to quantitatively analyze mesopore (2 nm < d < 50 nm) structure. The isotherm of N2 adsorption-desorption of Niutitang shale samples are shown in Figure 8. Based on the classification of International Union of Pure and Applied Chemistry (IUPAC), the isotherms of siliceous shales can be divide into type H3 and H4, among which the hysteresis loops of ND1-28 and ND1-96 belong to H4, mainly corresponding to narrow slit-like pores, and the other siliceous shale samples (GCC09, GCC66, YWT-75, YWT-49) are similar to H3 hysteresis loop associated with slit-shaped pores (Figure 8a). The hysteresis loops of argillaceous shale samples are of type H3, indicating mainly slit-shaped pores (Figure 8b).
The specific surface areas and the mesopore volumes figured by the BET model and the BJH model, respectively, are presented in Table 2. The BET surface areas of siliceous shales and argillaceous shales range between 4.3–30.43 m2/g (average 16.19 m2/g) and 8.15~11.91 m2/g (average 10.8 m2/g), respectively; the mesopore volumes of siliceous shales and argillaceous shales range between 0.66–4.61 cm3/100 g (average 2.59 cm3/100 g) and 1.54~2.12 cm3/100 g (average 2.06 cm3/100 g), respectively; the N2 adsorbed maximum volumes of siliceous shales and argillaceous shales range between 4.80~31.84 cm3/g (average 18.15 cm3/g) and 10.89~14.81 cm3/g (average 14.36 cm3/g), respectively.

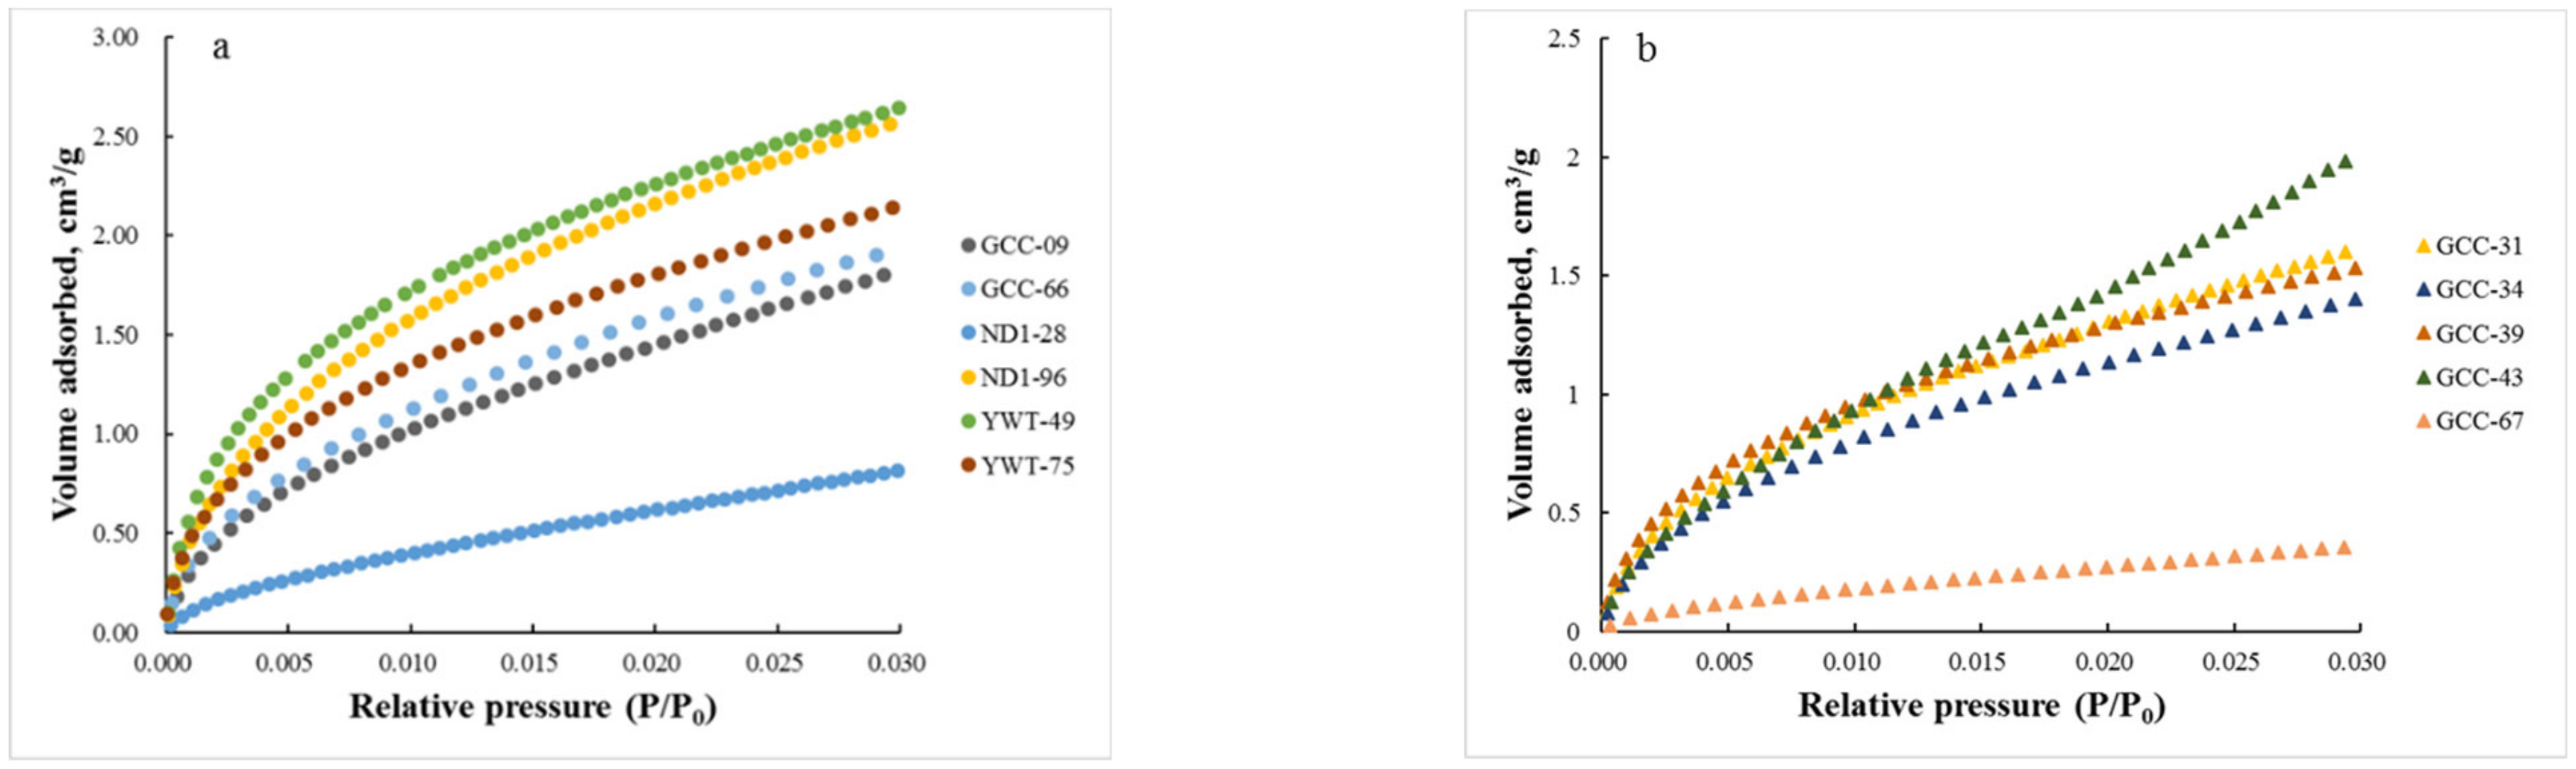
4.5. Pore Characterization by Low Pressure CO2 Adsorption

The micropore (d < 2 nm) structure was quantitatively analyzed by low pressure CO2 adsorption. The CO2 physisorption curves of the studied siliceous shales and argillaceous shales samples are presented in Figure 9, and their variations and trends are similar to Type I, indicating microporous solids [39]. DFT micropore surface areas of siliceous shales and argillaceous shales range from 2.13~13.31 m2/g (mean 8.49 m2/g) and 0.90~6.77 m2/g (mean 4.74 m2/g); DFT micropore volumes of siliceous shales and argillaceous shales are in the range of 0.071~0.394 cm3/100 g (average 0.26 cm3/100 g) and 0.031~0.188 cm3/100 g (average 0.15 cm3/100 g); the maximum volumes of CO2 adsorbed of siliceous shales and argillaceous shales range from 0.82~2.65 cm3/g (average 2.00 cm3/g) and 0.36~2.03 cm3/g (average 1.39 cm3/g), respectively (Table 2).
Micropore size distributions of the studied siliceous shales and argillaceous shales samples calculated by the DFT model are shown in Figure 10, indicating that the pore size distributions of siliceous shales and argillaceous shales are similar and present as bimodal distribution. The peak value of siliceous shales is in the range of 0.4–0.68 nm and 0.72~0.92 nm, and the peak value of argillaceous shales is in the range of 0.4–0.68 nm and 0.72~0.88 nm, indicating that pores in these pore size ranges make significant contribution to the micropore volumes.

5. Discussion

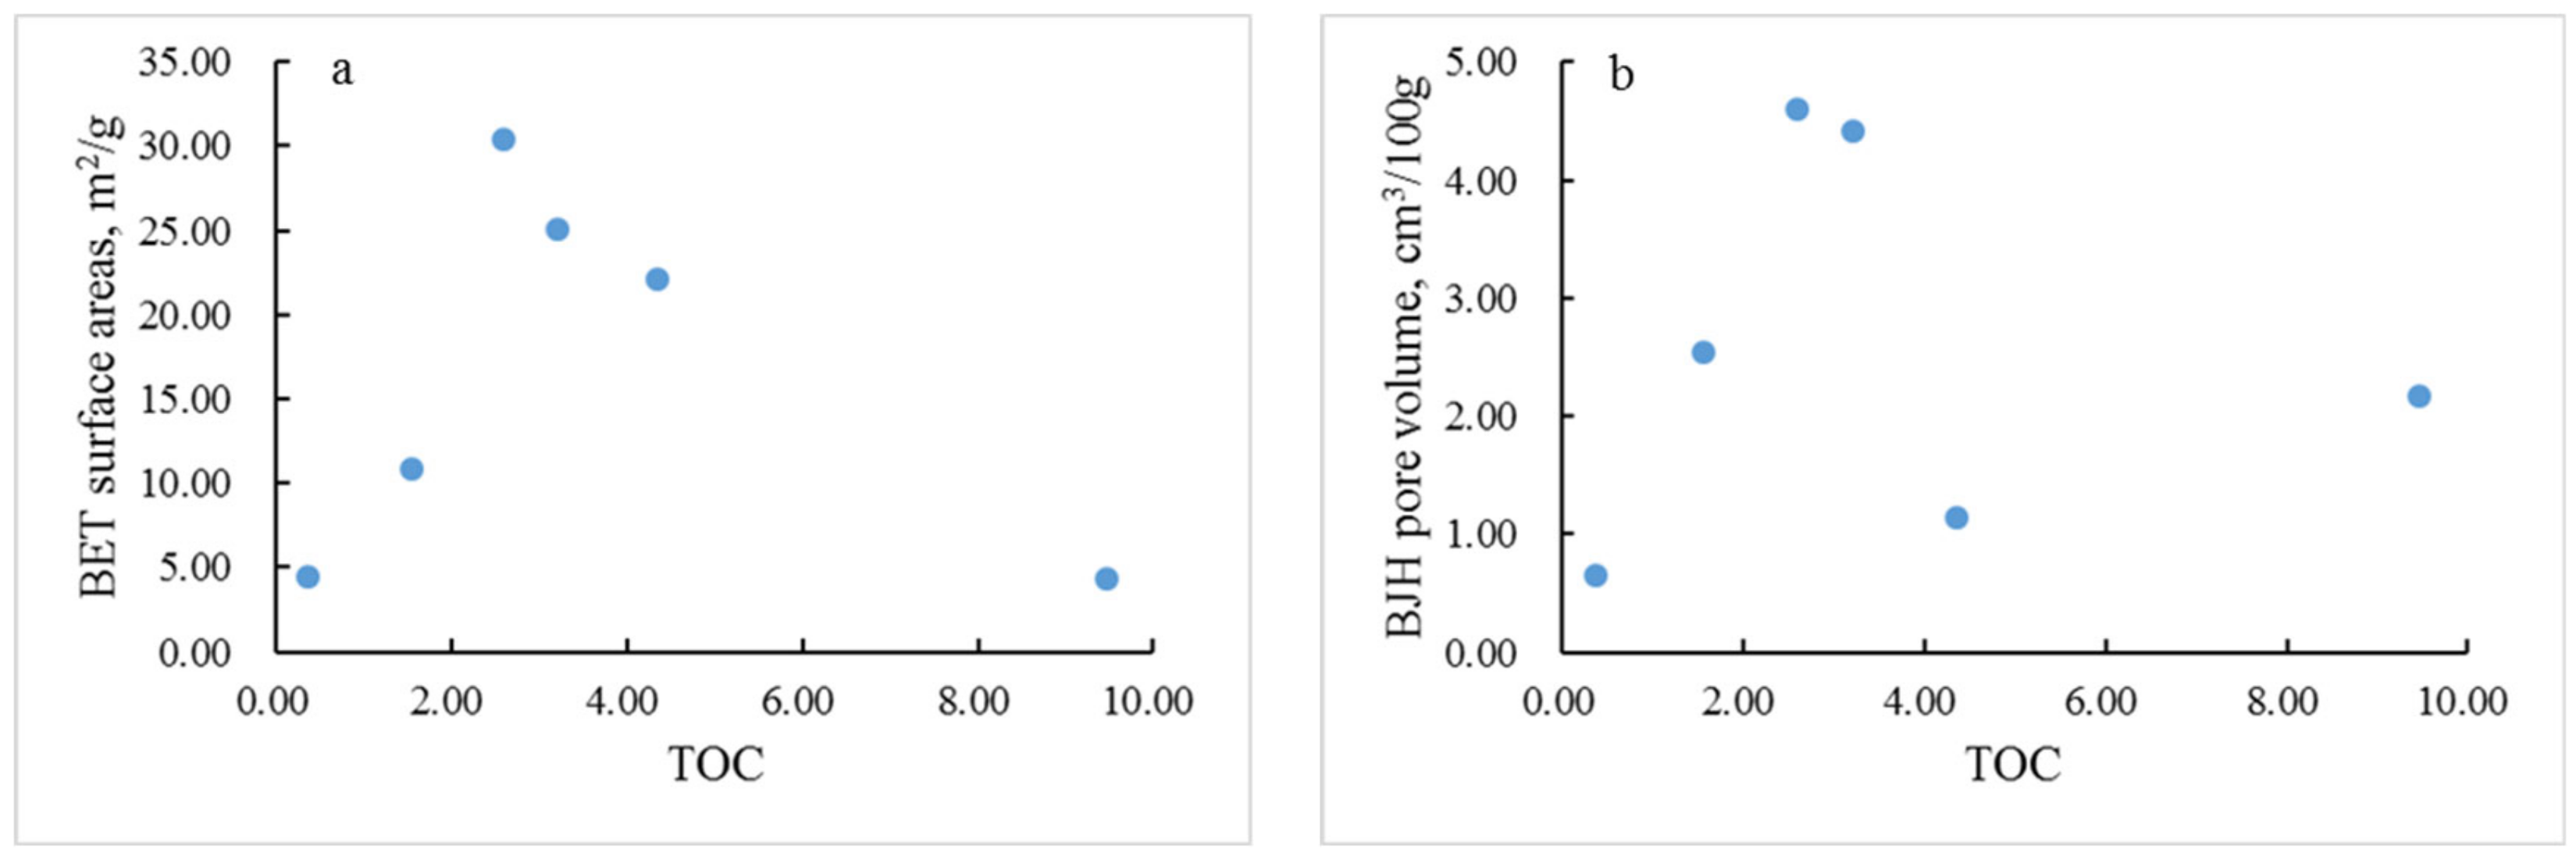
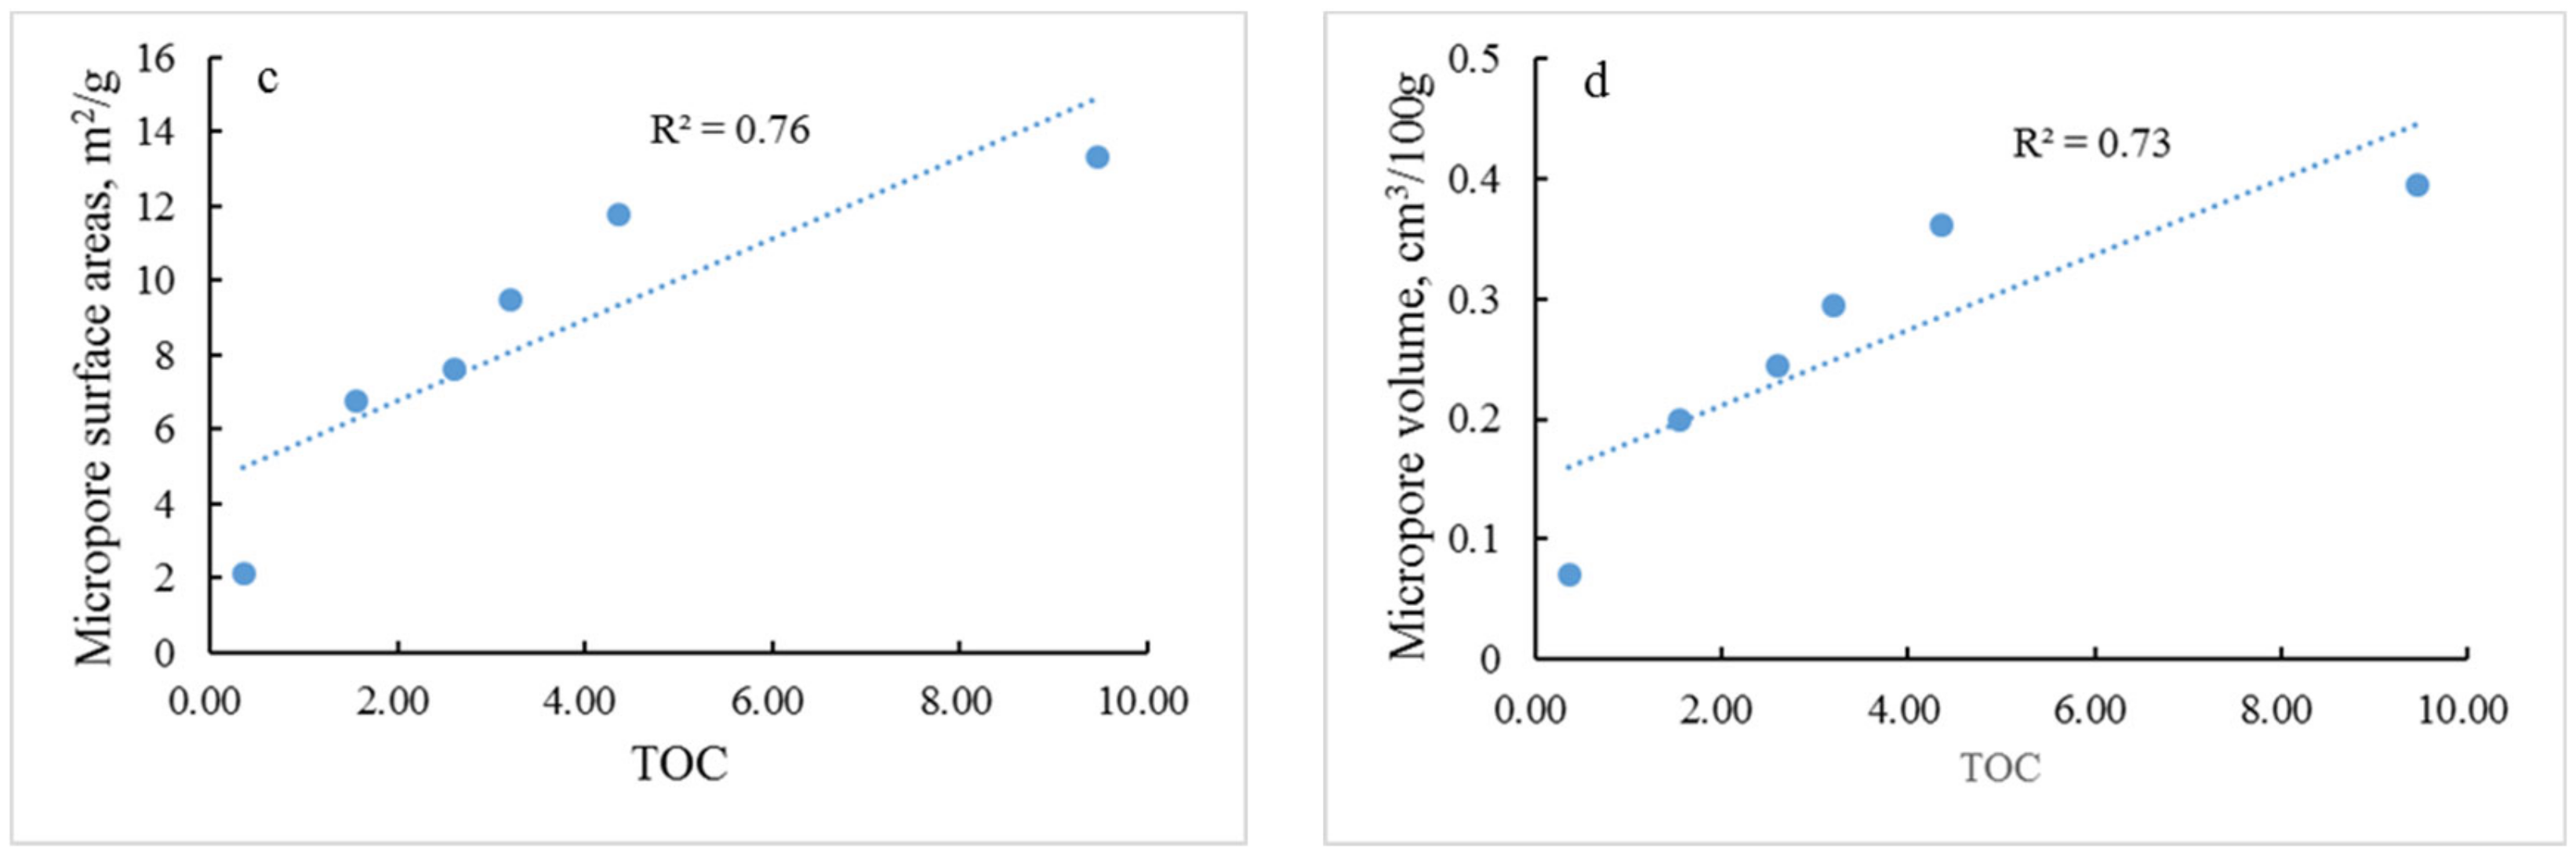
5.1. Impacts of Organic Matter on Shale Pore Structure

Figure 11 and Figure 12 show the correlations between TOC content and pore structure parameters of siliceous shales and argillaceous shales, respectively. TOC is positively correlated with micropore surface areas (R2 = 0.76) and micropore volume (R2 = 0.73) of siliceous shales (Figure 11c,d), suggesting that siliceous shales with higher TOC content tend to form more micropores, which is consistent with the results of FE-SEM observation (Figure 6d–f). While, TOC is weakly related with micropore surface areas and micropore volume of argillaceous shales (Figure 12c,d), suggesting that organic matter make little contributions to micropore structure of argillaceous shales, which is consistent with the FE-SEM observation results (Figure 7). In addition, there is no correlation between mesopore parameters and TOC both in siliceous shales and argillaceous shales (Figure 11a,b; Figure 12a,b), which may indicate OM pores are mainly nanopores of microscale.

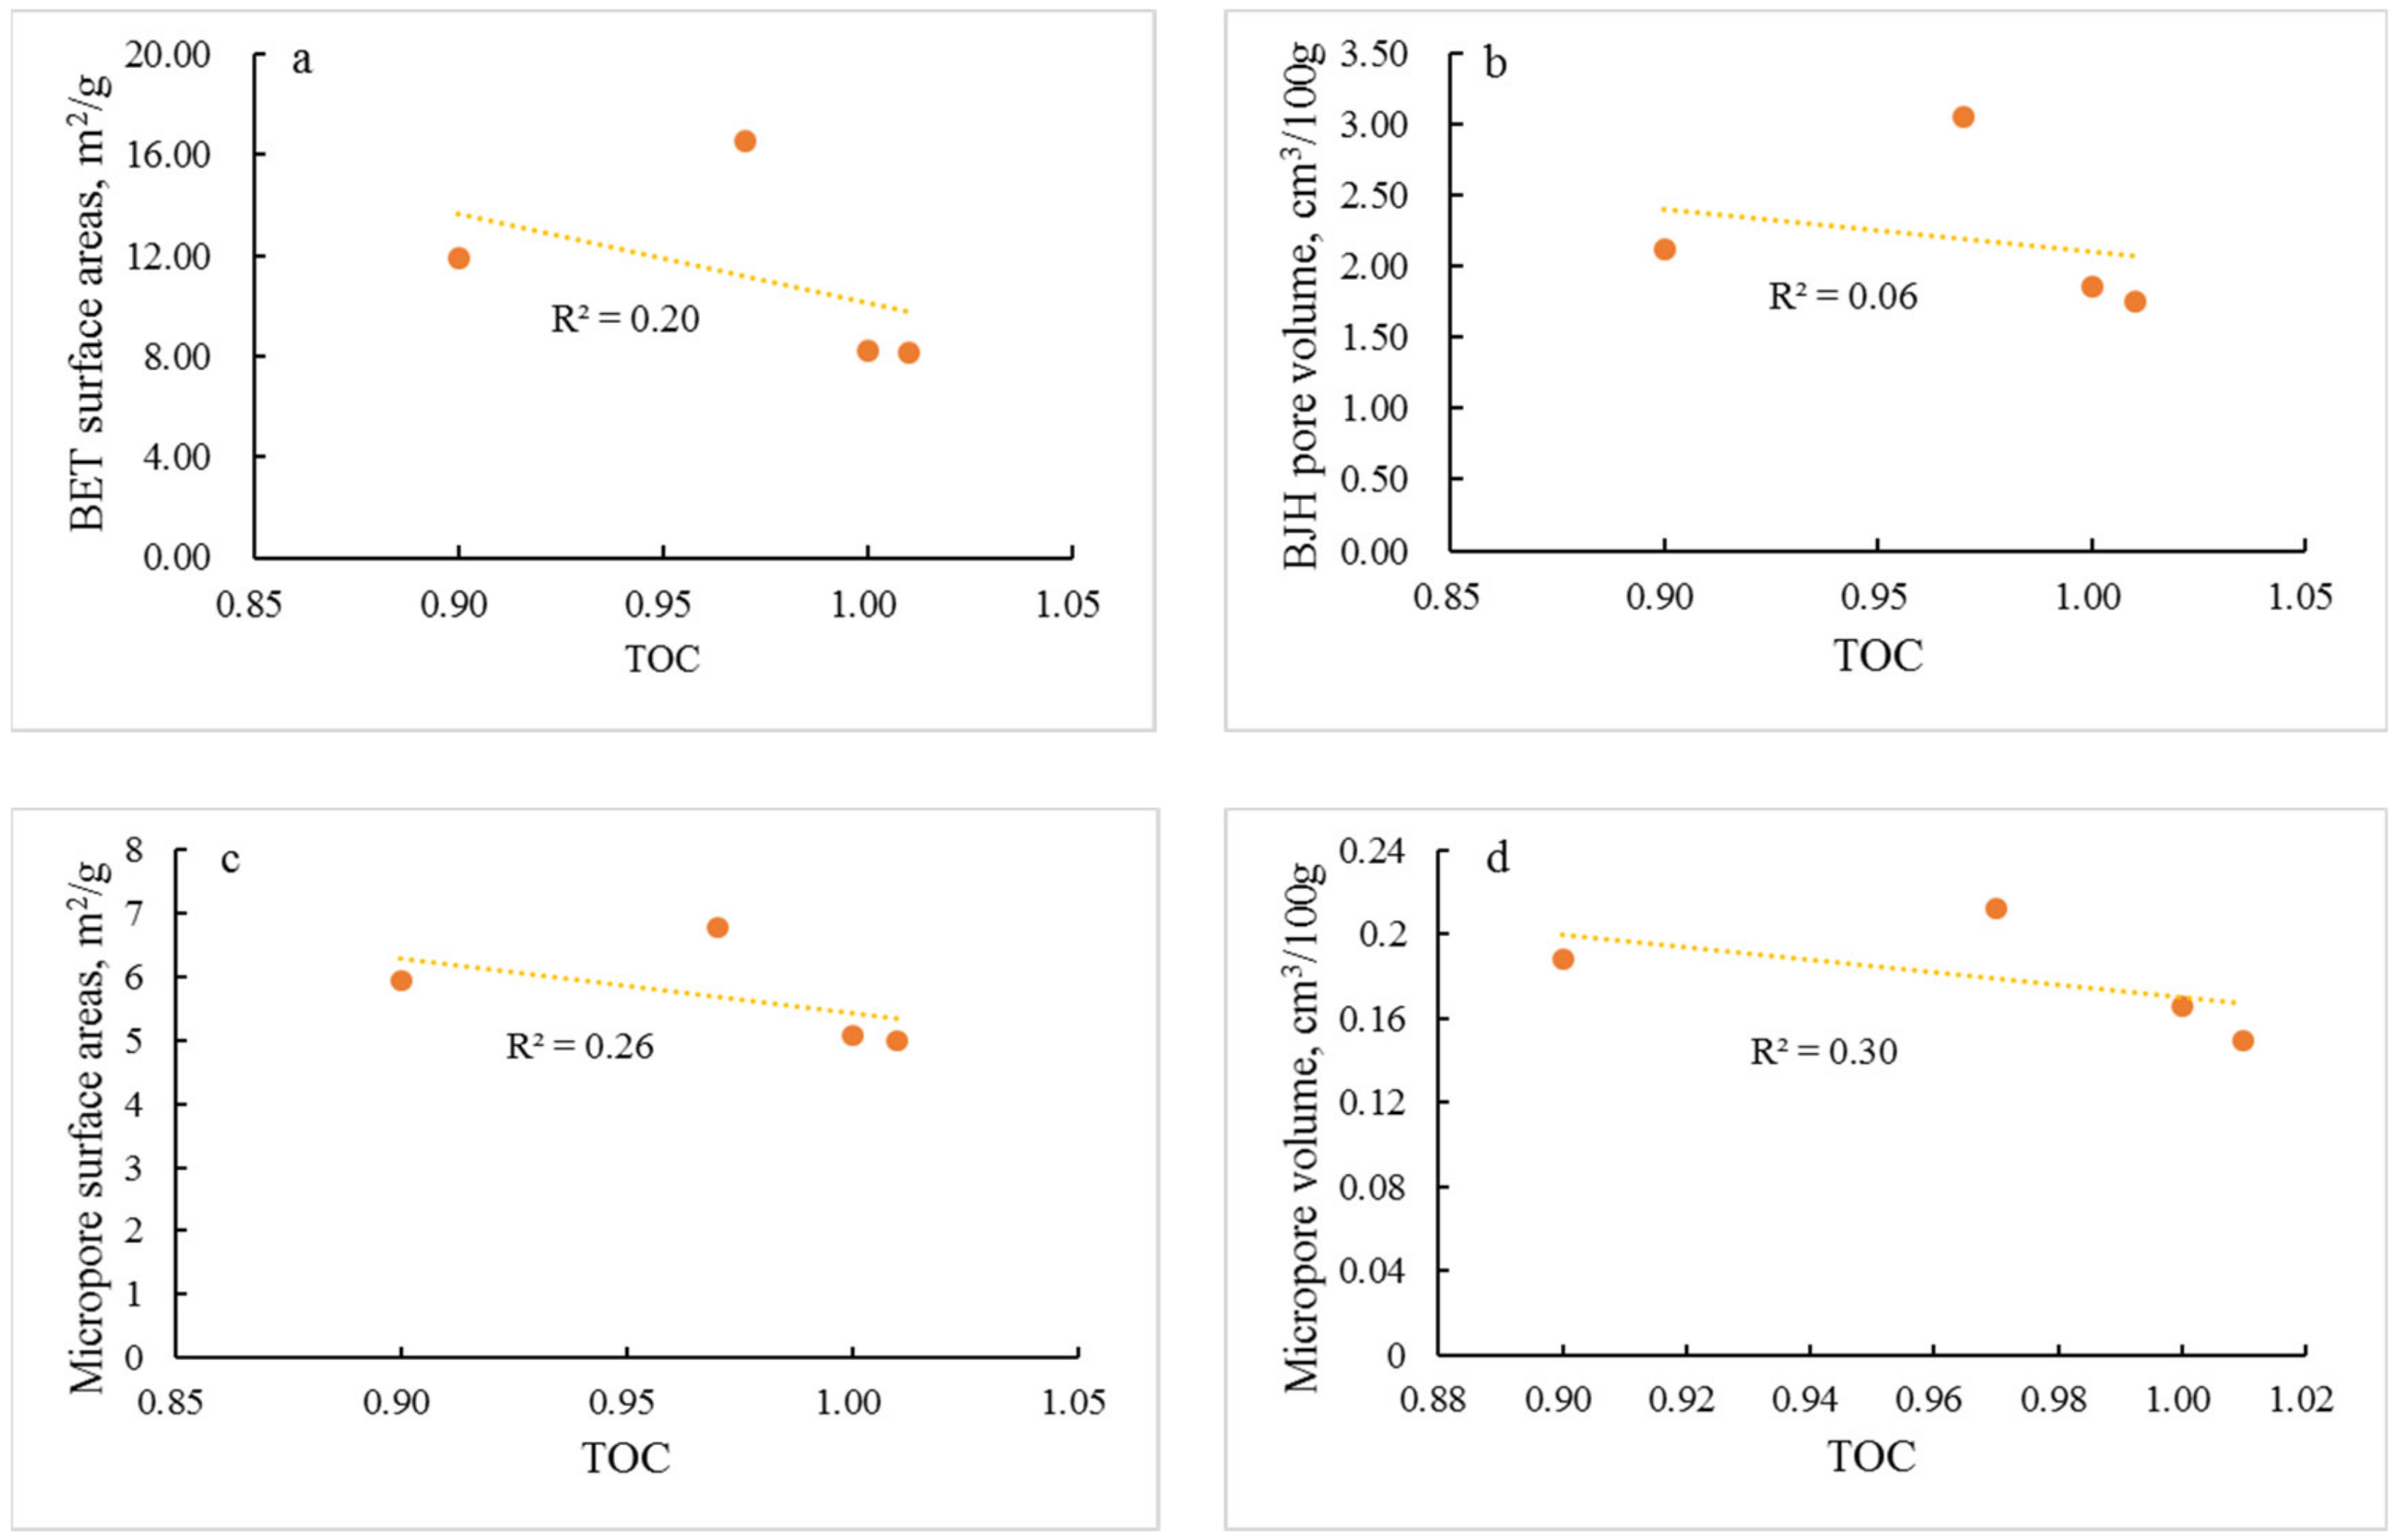
5.2. Impacts of Clay Minerals on Shale Pore Structure

The relationship between illite and pore structure parameters of siliceous shales and argillaceous shales are presented in Figure 13. The mesopore and micropore parameters of siliceous shales display no correlation with illite content (Figure 13), indicating that illite make no contributions to siliceous shales pore. Figure 13 shows both the mesopore and micropore parameters of argillaceous shales increase linearly with the increase of illite content, especially micropore parameters, suggesting that the contribution to pore surface areas and volumes of argillaceous shales is dominated by clay mineral pores. This can be confirmed by the results of FE-SEM observation, namely that argillaceous shale is dominated by cleavage-sheet intraparticle pores within clay minerals (Figure 8).

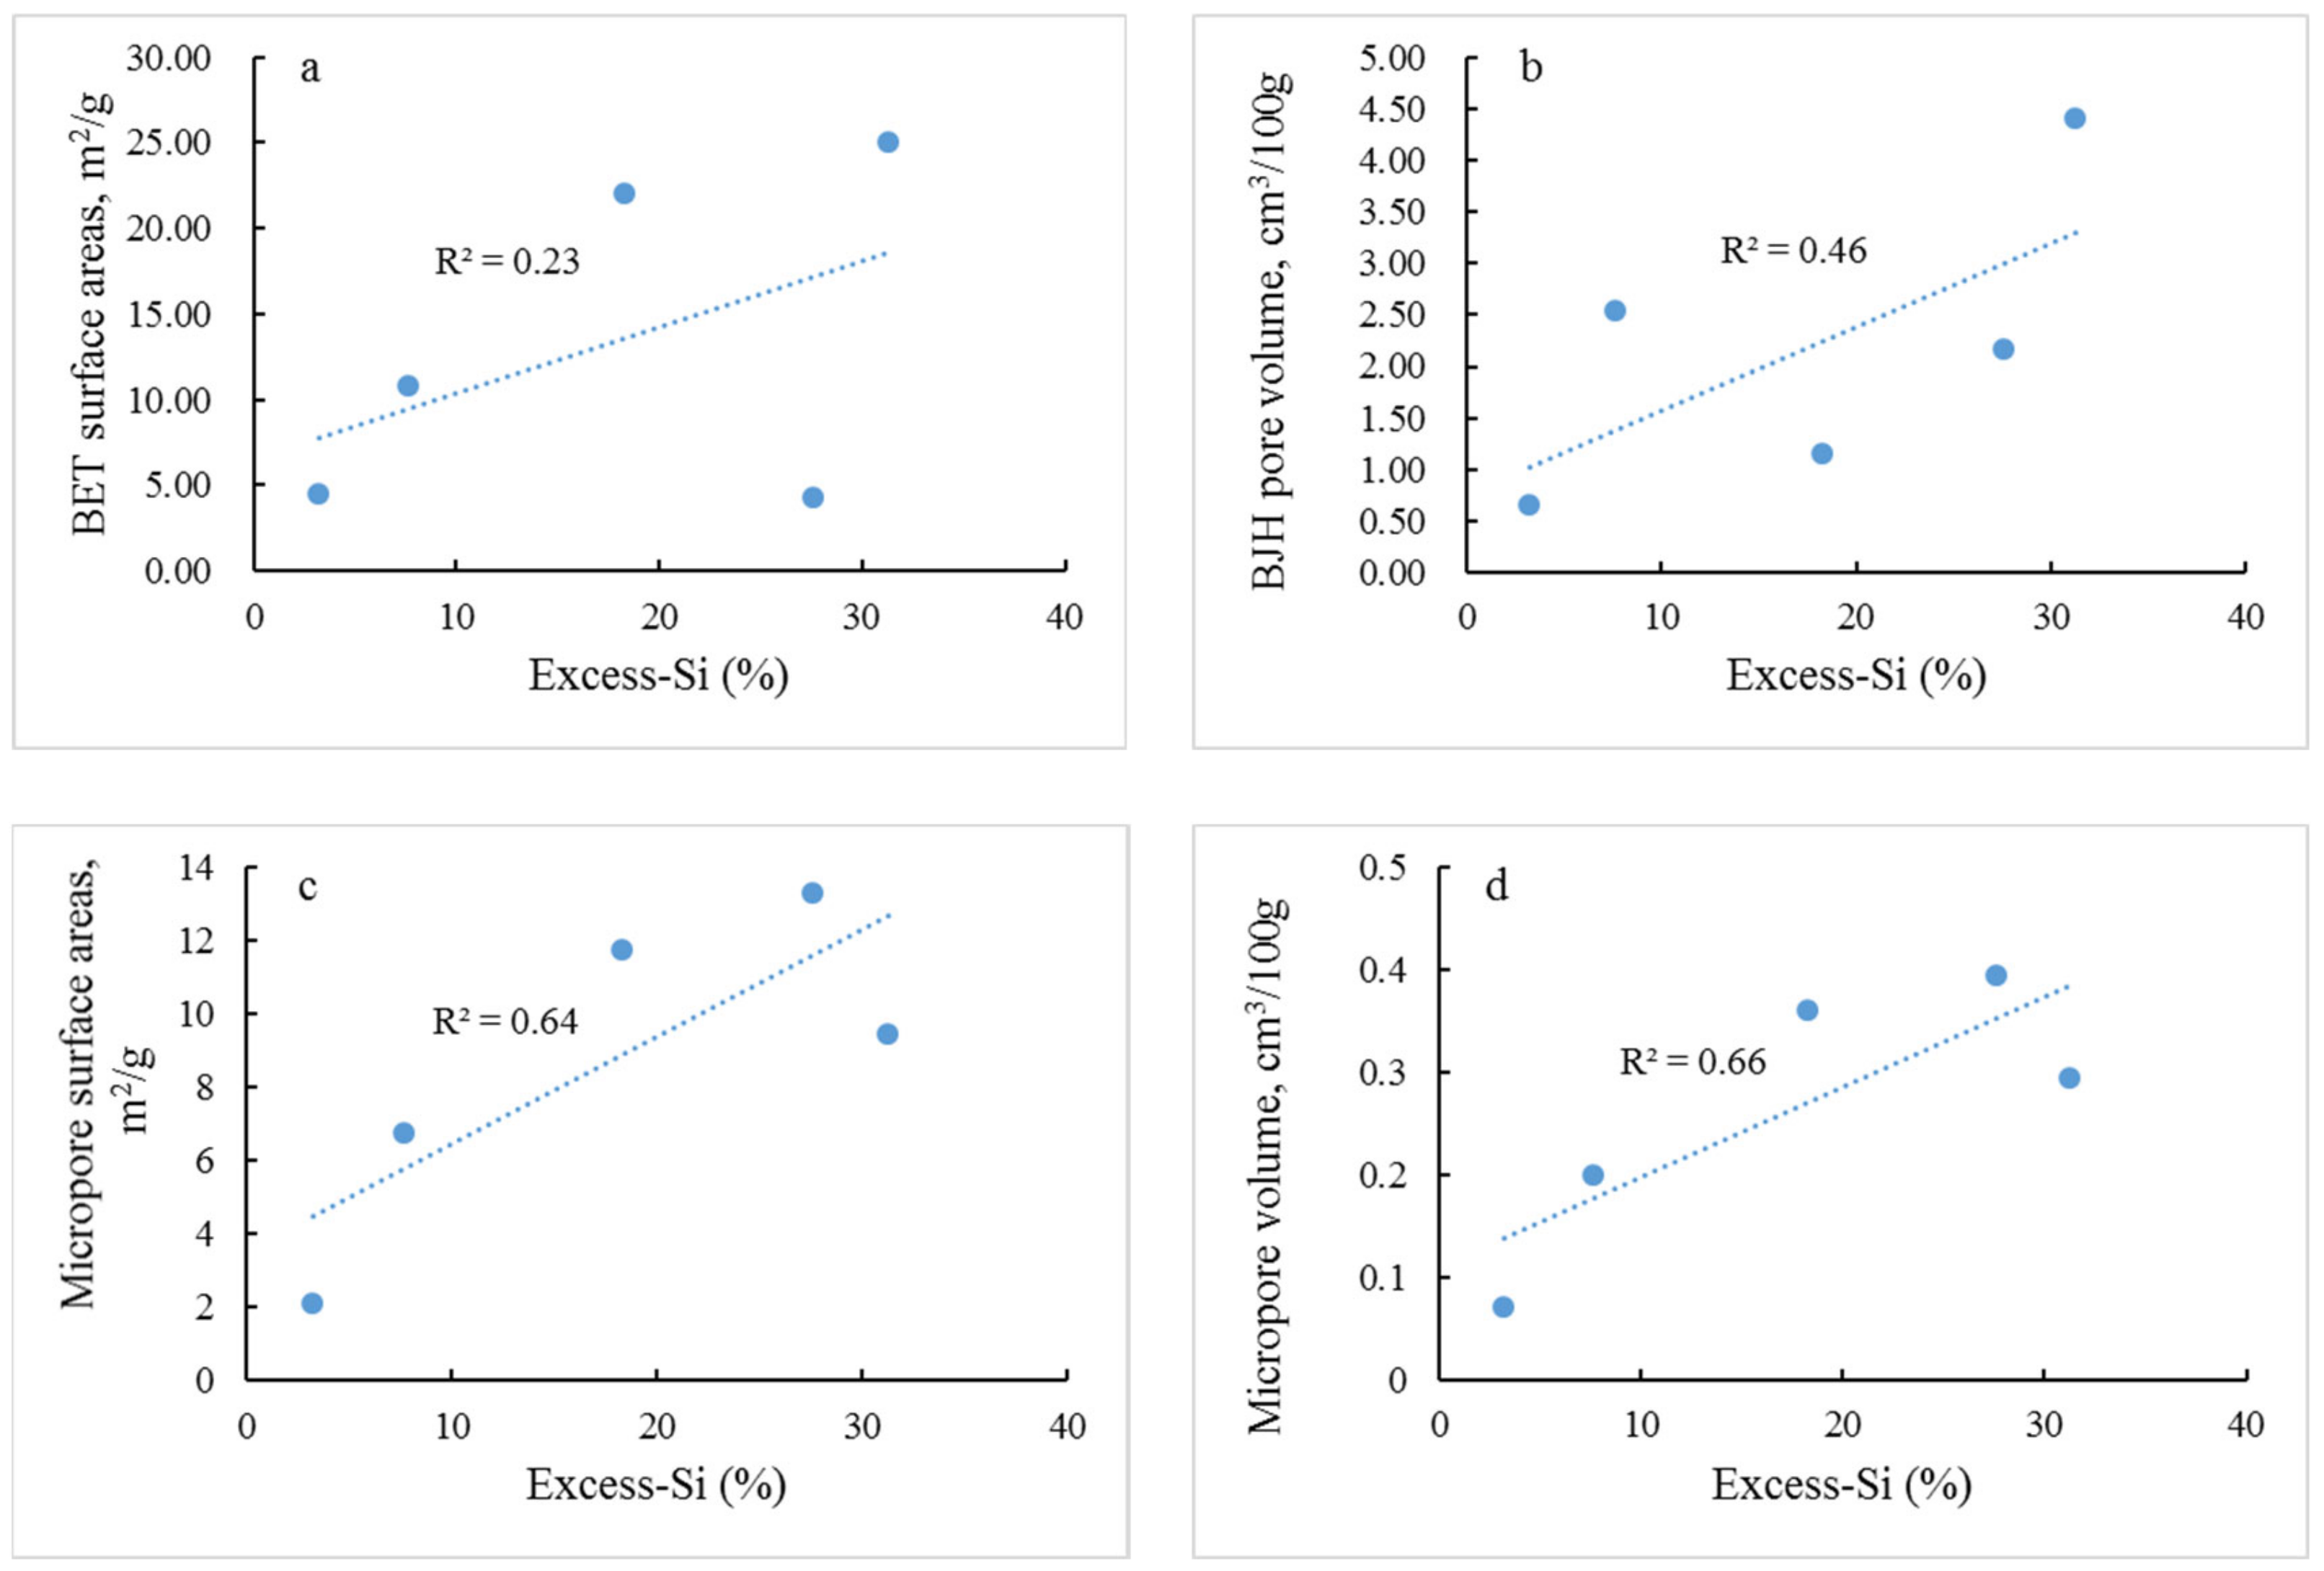
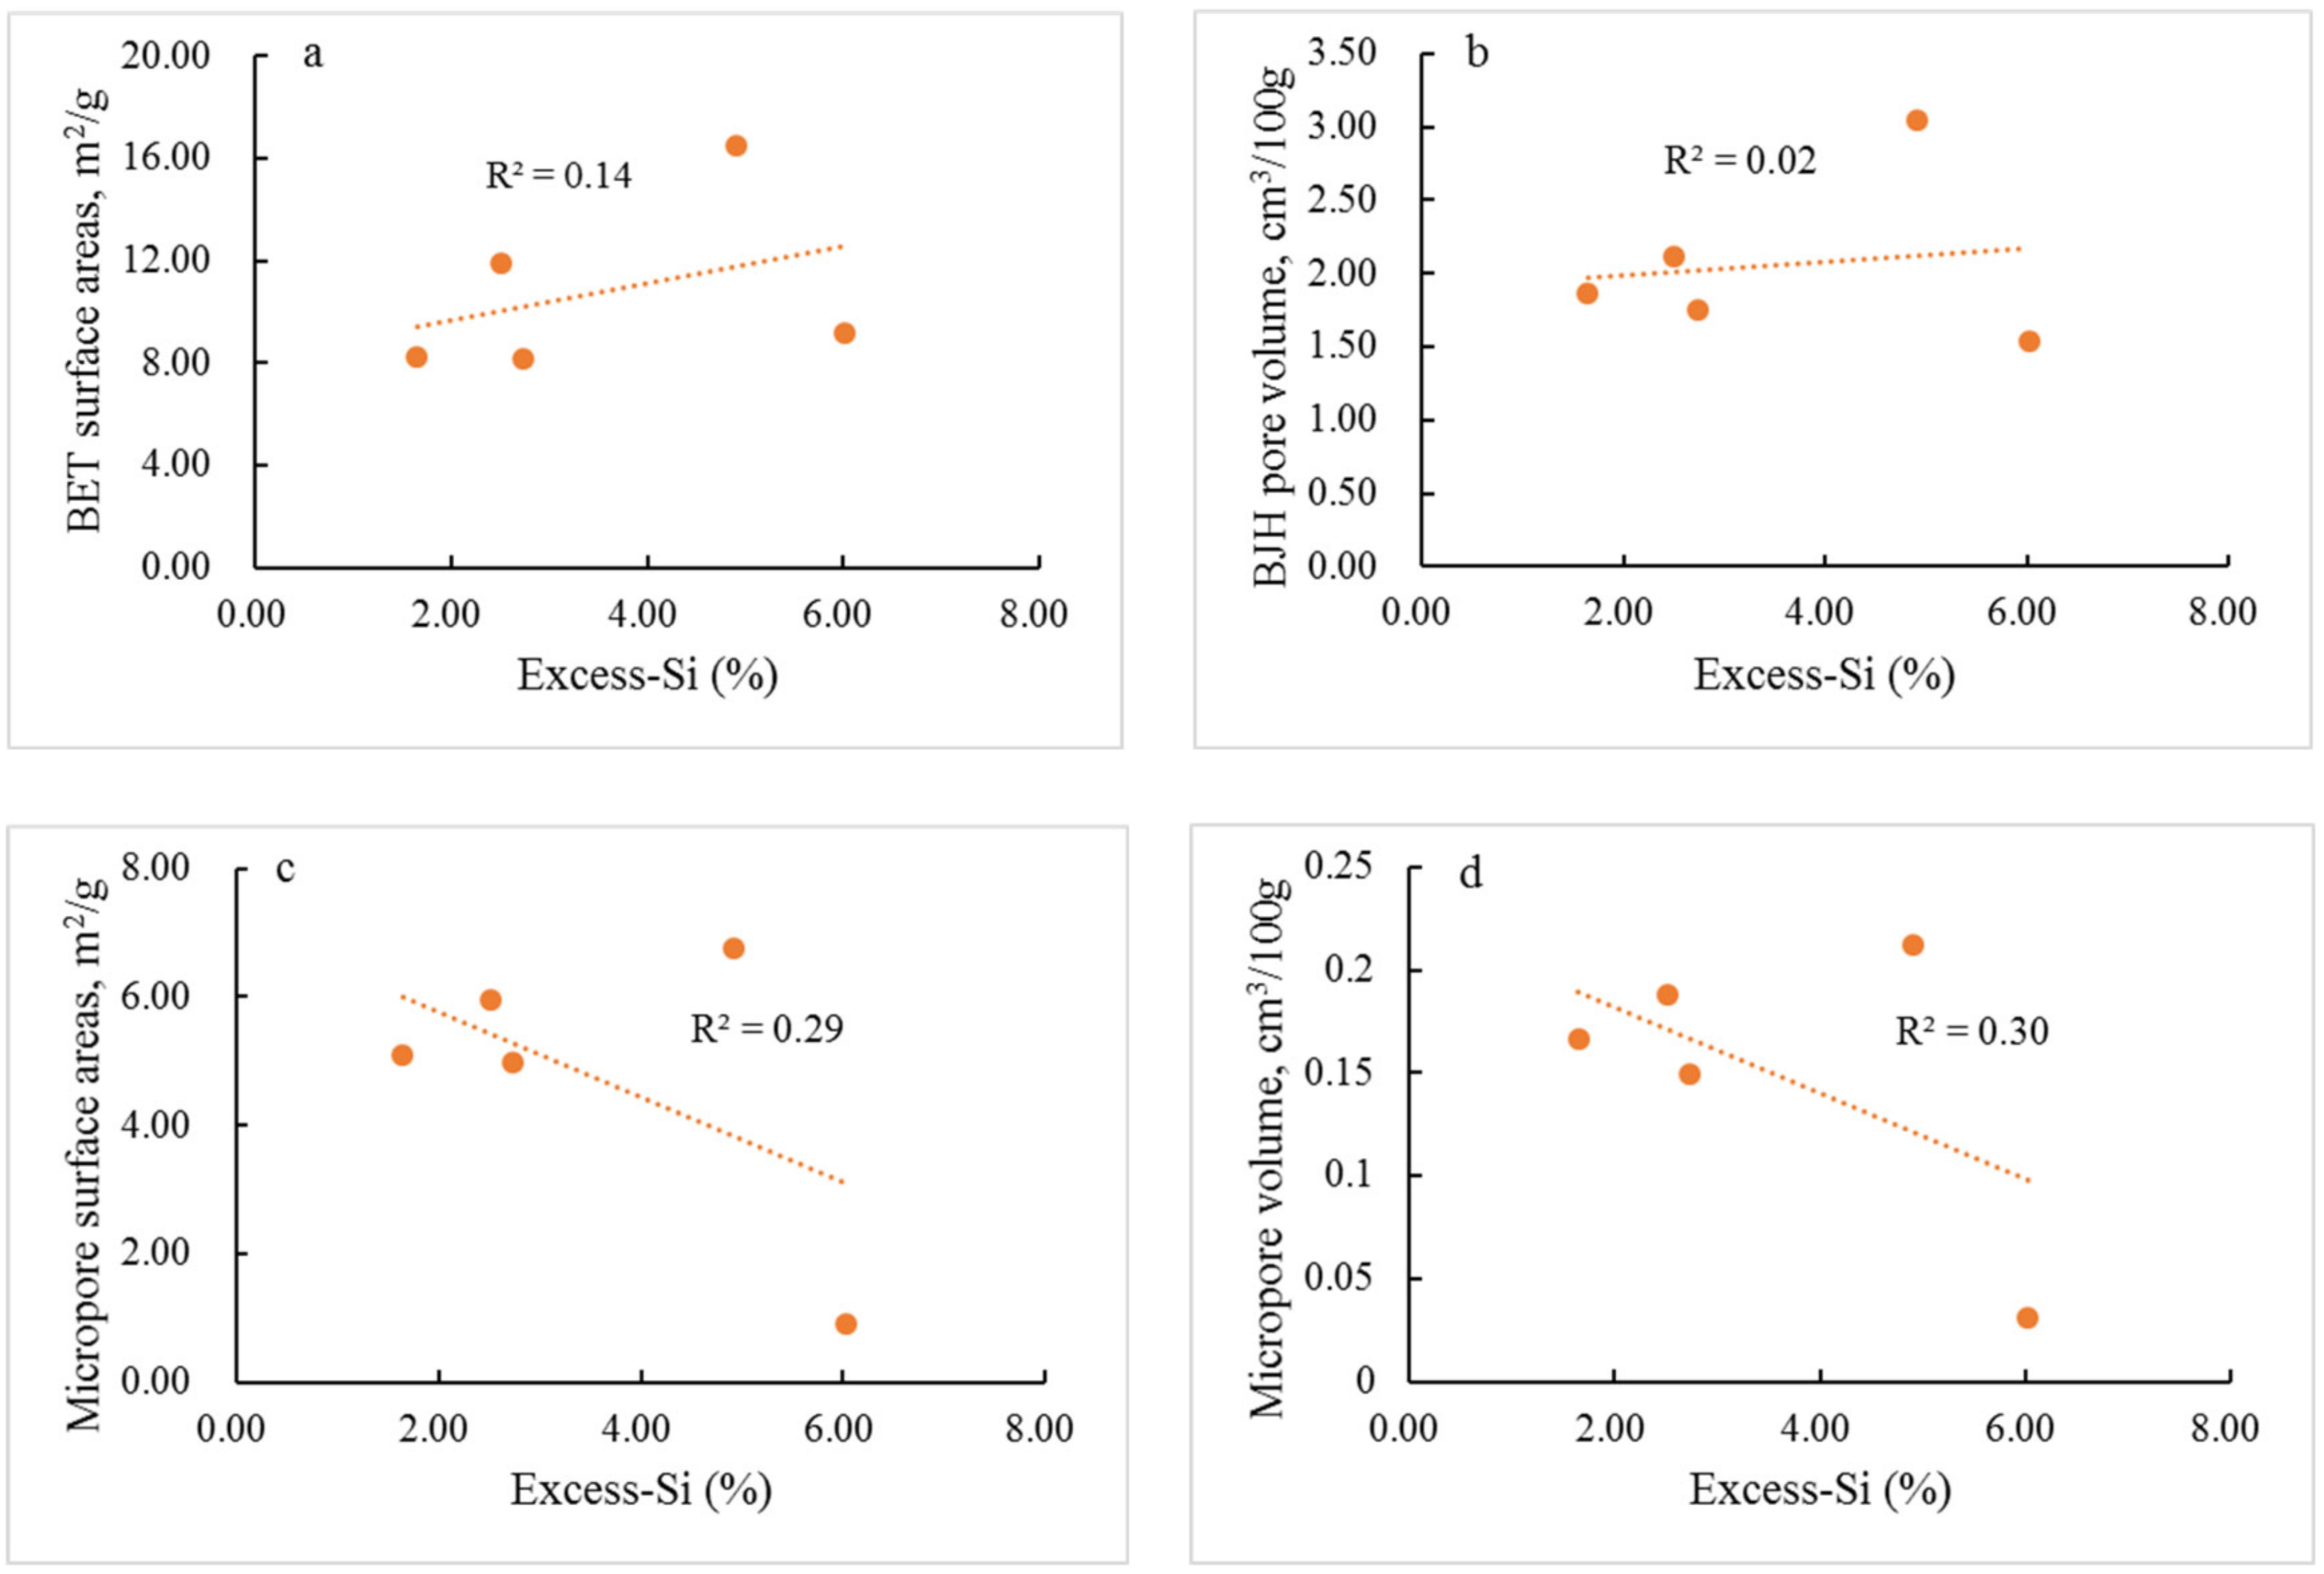
5.3. Impacts of Authigenic Quartz on Shale Pore Structure

The formation of authigenic quartz plays an important role in the pore structure of shale [40]. Li et al., 2018 [38] pointed out that porosity highly depends on the amount of interparticle pores between authigenic quartz grains and the abundance of authigenic silica and TOC is the major factor that controls the porosity of Ordovician-Silurian shale. The rigid framework created by authigenic quartz cementation can protect primary interparticle pores from compaction, as well as facilitate the formation of OM-related pores [7,41,42,43], while some scholars argued that authigenic quartz cementation leads to the decrease of shale porosity [9,44,45].
In general, the content of excess silicon (Excess-Si) is used to represent the authigenic quartz content [46], which is determined by applying the following equation:
Siexcess = Sisample − [(Si/Al)background × Alsample].
The (Si/Al)background represents the ratio of Si to Al in the background debris flow and (Si/Al)background equals 2.60 [31,47]. The content of excess silicon in siliceous shale and argillaceous shale ranges from 3.23% to 31.27% and 1.65% to 6.02%, respectively (Table 2), which indicating there are much higher authigenic quartz content in siliceous shale.
To investigate the influence of authigenic quartz on the pore structures of Niutitang shales, mesopore and micropore structure parameters were plotted against Excess-Si for samples from siliceous shales and argillaceous shales (Figure 14 and Figure 15). Both mesopore surface areas and mesopore volume of siliceous shales display a weak positive correlation with Excess-Si (Figure 14a,b), while there is a strong positive correlation between micropore parameters and Excess-Si in siliceous shales (Figure 14c,d), stressing a large number of smaller pores within authigenic quartz. As described above, the results of FE-SEM observation show that numerous interparticle pores exist within authigenic microcrystalline quartz in siliceous shales (Figure 4d; Figure 6d,e), which supports the great positive correlation between micropore parameters and Excess-Si in siliceous shales. Figure 15 shows that there is no correlation between mesopore parameters and Excess-Si and a weak negative correlation between micropore parameters and Excess-Si in argillaceous shales, indicating authigenic quartz make no or little contribution to argillaceous shales pore structure. This may be due to the low content of authigenic quartz in argillaceous shales.
Numerous previous studies have shown that mature shales pore development highly depends on TOC content, while the dataset presented herein suggests that authigenic quartz content also greatly controls the pore development of siliceous shale. The rigid framework formed by authigenic quartz is believed to be able to prevent primary interparticle pores from mechanical compaction and facilitate the formation of organic matter-associated pores. Argillaceous shales contain less quartz and more clay minerals than siliceous shales (Table 1 and Figure 2). Most of quartz in argillaceous shales is of detrital origin [30], and the pores related to detrital quartz grains were few (Figure 7). Owing to the lack of authigenic quartz formed in the shallow-intermediate burial depth in argillaceous shales, most of the interparticle pores were lost due to mechanical compaction. Therefore, the argillaceous shales were cemented tightly and interparticle pores were rarely developed (Figure 7).

6. Conclusions

(1) Three types of pores in Niutitang Formation were observed by FE-SEM. Pores in siliceous shales are dominated by interparticle pores and OM pores, among which the interparticle pores are mainly developed between authigenic quartz. Furthermore, most of these interparticle pores and cleavage-sheet intraparticle pores within clay minerals are usually filled by amorphous organic matter that is host to OM pores. Owing to the lack of rigid minerals, argillaceous shale was cemented densely, resulting in few interparticle pores, while cleavage-sheet intraparticle pores within clay minerals are common.
(2) The combined characterization of N2 adsorption and CO2 adsorption indicates that compared siliceous shales with argillaceous shales, specific surface areas and pore volumes of siliceous shales are higher than those of argillaceous shales, apart from the sample ND1-28.
(3) In terms of siliceous shales in Niutitang Formation, the content of TOC and authigenic quartz have great influence on micropore structures, but less on mesopore structure. The rigid framework formed by authigenic quartz is believed to be able to prevent primary interparticle pores from mechanical compaction and facilitate the formation of organic matter-associated pores. In terms of argillaceous shales, due to the lack of authigenic quartz, interparticle pores were rarely developed and its pore structure is mainly controlled by illite content.

Author Contributions

Writing (original draft): X.N.; Writing (review and editing): D.Y.; Supervision: D.Y. and M.H.; Data curation: X.N. and Z.L.; Formal analysis: X.N. and X.W.; Methodology: M.Z. All authors have read and agreed to the published version of the manuscript.

Funding

This study was jointly supported by Natural Science Foundation of China (Grant No. 42002148, 41690131, 41572327 and 41273001), Scientific Research Foundation of Hubei Provincial Education Department (Q20201303) and Open Foundation of Top Disciplines in Yangtze University.

Institutional Review Board Statement

Not applicable.

Informed Consent Statement

Not applicable.

Data Availability Statement

The data presented in this study are contained within the article.

Acknowledgments

We are grateful for all the funding that supported this research and thank the reviewers for the journal Minerals.

Conflicts of Interest

The authors declare no conflict of interest.

References

  1. Loucks, R.G.; Ruppel, S.C. Mississippian Barnett Shale, lithofacies and depositional setting of a deep-water shale-gas succession in the Fort Worth Basin, Texas. AAPG Bull. 2007, 91, 579–601. [Google Scholar] [CrossRef] [Green Version]
  2. Wang, Y.; Liu, L.F.; Zheng, S.S. Full-scale pore structure and its controlling factors of the Wufeng-Longmaxi shale, southern Sichuan Basin, China: Implications for pore evolution of highly over mature marine shale. J. Nat. Gas Sci. Eng. 2019, 67, 134–146. [Google Scholar] [CrossRef]
  3. Jarvie, D.M.; Hill, R.J.; Ruble, T.E.; Pollastro, R.M. Unconventional shale-gas systems: The Mississippian Barnett Shale of north-central Texas as one model for thermogenic shale-gas assessment. AAPG Bull. 2007, 91, 475–499. [Google Scholar] [CrossRef]
  4. Curtis, J.B. Fractured shale-gas systems. AAPG Bull. 2002, 86, 1921–1938. [Google Scholar] [CrossRef]
  5. Tang, X.; Jiang, Z.; Li, Z.; Gao, Z.; Bai, Y.; Zhao, S.; Feng, J. The effect of the variation in material composition on the heterogeneous pore structure of high-maturity shale of the Silurian Longmaxi formation in the southeastern Sichuan Basin, China. J. Nat. Gas Sci. Eng. 2015, 23, 464–473. [Google Scholar] [CrossRef]
  6. Milliken, K.L.; Rudnicki, M.D.; Awwiller, D.N.; Zhang, T. Organic matter-hosted pore system, Marcellus Formation (Devonian), Pennsylvania. AAPG Bull. 2013, 97, 177–200. [Google Scholar] [CrossRef]
  7. Xi, Z.D.; Tang, S.H.; Li, J.; Zhang, Z.; Xiao, H. Pore characterization and the controls of organic matter and quartz on pore structure, case study of the Niutitang Formation of northern Guizhou Province, South China. J. Nat. Gas Sci. Eng. 2019, 61, 18–31. [Google Scholar] [CrossRef]
  8. Bernard, S.; Horsfield, B.; Schulz, H.-M.; Wirth, R.; Schreiber, A.; Sherwood, N. Geochemical evolution of organic-rich shales with increasing maturity: A STXM and TEM study of the Posidonia Shale (Lower Toarcian, northern Germany). Mar. Pet. Geol. 2012, 31, 70–89. [Google Scholar] [CrossRef]
  9. Ross, D.J.K.; Bustin, R.M. The importance of shale composition and pore structure upon gas storage potential of shale gas reservoirs. Mar. Pet. Geol. 2009, 26, 916–927. [Google Scholar] [CrossRef]
  10. Wang, R.Y.; Gu, Y.; Ding, W.L.; Gong, D.J.; Yin, S.; Wang, X.H.; Zhou, X.H.; Li, A.; Xiao, Z.K.; Cui, Z.X. Characteristics and dominant controlling factors of organic-rich marine shales with high thermal maturity: A case study of the Lower Cambrian Niutitang Formation in the Cen’gong block, southern China. J. Nat. Gas Sci. Eng. 2016, 33, 81–96. [Google Scholar] [CrossRef]
  11. Han, H.; Pang, P.; Li, Z. Controls of organic and inorganic compositions on pore structure of lacustrine shales of Chang 7 member from Triassic Yanchang Formation in the Ordos Basin, China. Mar. Pet. Geol. 2019, 100, 270–284. [Google Scholar] [CrossRef]
  12. Wang, X.; Hou, J.; Li, S.; Dou, L.; Song, S.; Kang, Q.; Wang, D. Insight into the nanoscale pore structure of organic-rich shales in the Bakken Formation, USA. J. Pet. Sci. Eng. 2020, 191, 107182. [Google Scholar] [CrossRef]
  13. Sun, L.; Tuo, J.; Zhang, M.; Wu, C.; Wang, Z.; Zheng, Y. Formation and development of the pore structure in Chang 7 member oil-shale from Ordos Basin during organic matter evolution induced by hydrous pyrolysis. Fuel 2015, 158, 549–557. [Google Scholar] [CrossRef]
  14. Topór, T.; Derkowski, A.; Ziemiański, P.; Szczurowski, J.; Mccarty, D.K. The effect of organic matter maturation and porosity evolution on methane storage potential in the Baltic Basin (Poland) shale-gas reservoir. Int. J. Coal Geol. 2017, 180, 46–56. [Google Scholar] [CrossRef]
  15. Ko, L.T.; Loucks, R.G.; Zhang, T.; Ruppel, S.C.; Shao, D. Pore and pore network evolution of Upper Cretaceous Boquillas (Eagle Ford–equivalent) mudrocks: Results from gold tube pyrolysis experiments. AAPG Bull. 2016, 100, 1693–1722. [Google Scholar] [CrossRef]
  16. Ko, L.T.; Ruppel, S.C.; Loucks, R.G.; Hackley, P.C.; Zhang, T.; Shao, D. Pore-types and pore-network evolution in Upper Devonian-Lower Mississippian Woodford and Mississippian Barnett mudstones: Insights from laboratory thermal maturation and organic petrology. Int. J. Coal Geol. 2018, 190, 3–28. [Google Scholar] [CrossRef]
  17. Chen, D.; Wang, J.; Qing, H.; Detian, Y.; Li, R. Hydrothermal venting activities in the Early Cambrian, South China: Petrological, geochronological and stable isotopic constraints. Chem. Geol. 2009, 258, 168–181. [Google Scholar] [CrossRef]
  18. Yang, F.; Ning, Z.; Wang, Q. Pore structure of Cambrian shales from the Sichuan Basin in China and implications to gas storage. Mar. Pet. Geol. 2016, 70, 14–26. [Google Scholar] [CrossRef]
  19. Sun, M.; Yu, B.; Hu, Q. Nanoscale pore characteristics of the Lower Cambrian Niutitang Formation Shale, a case study from Well Yuke #1 in the Southeast of Chongqing, China. Int. J. Coal Geol. 2016, 154–155, 16–29. [Google Scholar]
  20. Zhang, J.; Fan, T.; Li, J. Characterization of the Lower Cambrian Shale in the Northwestern Guizhou Province, South China, Implications for Shale-Gas Potential. Energy Fuels 2015, 29, 6383–6393. [Google Scholar] [CrossRef]
  21. Li, Z.; Bogdanova, S.; Collins, A.; Davidson, A.; De Waele, B.; Ernst, R.; Fitzsimons, I.; Fuck, R.; Gladkochub, D.; Jacobs, J.; et al. Assembly, configuration, and break-up history of Rodinia: A synthesis. Precambrian Res. 2008, 160, 179–210. [Google Scholar] [CrossRef]
  22. Wang, J.; Li, Z.X. History of Neoproterozoic rift basins in South China, implications for Rodinia break-up. Precambrian Res. 2003, 122, 141–158. [Google Scholar] [CrossRef]
  23. Wang, S.F.; Zou, C.N.; Dong, D.Z.; Wang, Y.M.; Li, X.J.; Huang, J.L.; Guan, Q.Z. Multiple controls on the paleoenvi-ronment of the Early Cambrian marine black shales in the Sichuan Basin, SW China: Geochemical and organic carbon isotopic evidence. Mar. Pet. Geol. 2015, 66, 660–672. [Google Scholar] [CrossRef]
  24. Guo, Q.; Strauss, H.; Liu, C.; Goldberg, T.; Zhu, M.; Pi, D.; Heubeck, C.; Vernhet, E.; Yang, X.; Fu, P. Carbon isotopic evolution of the terminal Neoproterozoic and early Cambrian: Evidence from the Yangtze Platform, South China. Palaeogeogr. Palaeoclim. Palaeoecol. 2007, 254, 140–157. [Google Scholar] [CrossRef]
  25. Jin, C.S.; Li, C.; Algeo, T.J.; Planavsky, N.J.; Cui, H.; Yang, X.; Zhao, Y.; Zhang, X.; Xie, S. A highly redox-heterogeneous ocean in South China during the early Cambrian (~529–514 Ma): Implications for biota-environment co-evolution. Earth Planet. Sci. Lett. 2016, 441, 38–51. [Google Scholar] [CrossRef] [Green Version]
  26. Wen, H.; Fan, H.; Zhang, Y.; Cloquet, C.; Carignan, J. Reconstruction of early Cambrian ocean chemistry from Mo isotopes. Geochim. Cosmochim. Acta 2015, 164, 1–16. [Google Scholar] [CrossRef]
  27. Liu, Z.H.; Zhuang, X.G.; Teng, G.E.; Xie, X.M.; Yin, L.M.; Bian, L.Z.; Feng, Q.L.; Algeo, T.J. The lower cambrian niutitang formation at Yangtiao (Guizhou, sw China): Organic matter enrichment, source rock potential, and hydrothermal influences. J. Pet. Geol. 2015, 38, 411–432. [Google Scholar] [CrossRef]
  28. Guo, Q.; Strauss, H.; Zhu, M.; Zhang, J.; Yang, X.; Lu, M.; Zhao, F. High resolution organic carbon isotope stratigraphy from a slope to basinal setting on the Yangtze Platform, South China: Implications for the Ediacaran–Cambrian transition. Precambrian Res. 2013, 225, 209–217. [Google Scholar] [CrossRef]
  29. Chen, L.; Jiang, Z.; Liu, K.; Wang, P.; Ji, W.; Gao, F.; Li, P.; Hu, T.; Zhang, B.; Huang, H. Effect of lithofacies on gas storage capacity of marine and continental shales in the Sichuan Basin, China. J. Nat. Gas Sci. Eng. 2016, 36, 773–785. [Google Scholar] [CrossRef]
  30. Niu, X.; Yan, D.; Zhuang, X.; Liu, Z.; Li, B.; Wei, X.; Xu, H.; Li, D. Origin of quartz in the lower Cambrian Niutitang Formation in south Hubei Province, upper Yangtze platform. Mar. Pet. Geol. 2018, 96, 271–287. [Google Scholar] [CrossRef]
  31. Wang, P.F.; Jiang, Z.X.; Yin, L.S.; Chen, L.; Li, Z.; Zhang, C.; Li, T.W.; Huang, P. Lithofacies classification and its effect on pore structure of the Cambrian marine shale in the Upper Yangtze Platform, South China: Evidence from FE-SEM and gas adsorption analysis. J. Pet. Sci. Eng. 2017, 156, 307–321. [Google Scholar] [CrossRef]
  32. Tang, X.; Jiang, Z.; Huang, H.; Jiang, S.; Yang, L.; Xiong, F.; Chen, L.; Feng, J. Lithofacies characteristics and its effect on gas storage of the Silurian Longmaxi marine shale in the southeast Sichuan Basin, China. J. Nat. Gas Sci. Eng. 2016, 28, 338–346. [Google Scholar] [CrossRef] [Green Version]
  33. Han, C.; Jiang, Z.X.; Han, M.; Wu, M.H.; Lin, W. The lithofacies and reservoir characteristics of the Upper Ordovician and Lower Silurian black shale in the Southern Sichuan Basin and its periphery, China. Mar. Pet. Geol. 2016, 75, 181–191. [Google Scholar] [CrossRef]
  34. Loucks, R.G.; Reed, R.M.; Ruppel, S.C.; Hammes, U. Spectrum of pore types and networks in mudrocks and a descriptive classification for matrix-related mudrock pores. AAPG Bull. 2012, 96, 1071–1098. [Google Scholar] [CrossRef] [Green Version]
  35. Slatt, R.M.; O’Brien, N.R. Pore types in the Barnett and Woodford gas shales: Contribution to understanding gas storage and migration pathways in fine-grained rocks. AAPG Bull. 2011, 95, 2017–2030. [Google Scholar] [CrossRef]
  36. Loucks, R.G.; Reed, R.M.; Ruppel, S.C.; Jarvie, D.M. Morphology, Genesis, and Distribution of Nanometer-Scale Pores in Siliceous Mudstones of the Mississippian Barnett Shale. J. Sediment. Res. 2009, 79, 848–861. [Google Scholar] [CrossRef] [Green Version]
  37. Li, Y.; Schieber, J.; Fan, T.; Wei, X. Pore characterization and shale facies analysis of the Ordovician-Silurian transition of northern Guizhou, South China: The controls of shale facies on pore distribution. Mar. Pet. Geol. 2018, 92, 697–718. [Google Scholar] [CrossRef]
  38. Sing, K.S.W. Reporting physisorption data for gas/solid systems with special reference to the determination of surface area and porosity (Recommendations 1984). Pure Appl. Chem. 1985, 57, 603–619. [Google Scholar] [CrossRef]
  39. Dowey, P.J.; Taylor, K.G. Extensive authigenic quartz overgrowths in the gas-bearing Haynesville-Bossier Shale, USA. Sediment. Geol. 2017, 356, 15–25. [Google Scholar] [CrossRef] [Green Version]
  40. Chen, L.; Jiang, Z.; Liu, K.; Tan, J.; Gao, F.; Wang, P. Pore structure characterization for organic-rich Lower Silurian shale in the Upper Yangtze Platform, South China: A possible mechanism for pore development. J. Nat. Gas Sci. Eng. 2017, 46, 1–15. [Google Scholar] [CrossRef]
  41. Yang, W.; Zuo, R.; Jiang, Z.; Chen, D.; Song, Y.; Luo, Q.; Wang, Q.; Zhu, H. Effect of lithofacies on pore structure and new insights into pore-preserving mechanisms of the over-mature Qiongzhusi marine shales in Lower Cambrian of the southern Sichuan Basin, China. Mar. Pet. Geol. 2018, 98, 746–762. [Google Scholar] [CrossRef]
  42. Dong, T.; He, S.; Chen, M.; Hou, Y.; Guo, X.; Wei, C.; Han, Y.; Yang, R. Quartz types and origins in the paleozoic Wufeng-Longmaxi Formations, Eastern Sichuan Basin, China: Implications for porosity preservation in shale reservoirs. Mar. Pet. Geol. 2019, 106, 62–73. [Google Scholar] [CrossRef]
  43. Milliken, K.L.; Olson, T. Silica Diagenesis, Porosity Evolution, and Mechanical Behavior in Siliceous Mudstones, Mowry Shale (Cretaceous), Rocky Mountains, U.S.A. J. Sediment. Res. 2017, 87, 366–387. [Google Scholar] [CrossRef]
  44. Wu, C.; Tuo, J.; Zhang, L.; Zhang, M.; Li, J.; Liu, Y.; Qian, Y. Pore characteristics differences between clay-rich and clay-poor shales of the Lower Cambrian Niutitang Formation in the Northern Guizhou area, and insights into shale gas storage mechanisms. Int. J. Coal Geol. 2017, 178, 13–25. [Google Scholar] [CrossRef]
  45. Zhao, J.H.; Jin, Z.K.; Jin, Z.J.; Wen, X.; Geng, Y.K. Origin of authigenic quartz in organic-rich shales of the Wufeng and Longmaxi Formations in the Sichuan Basin, South China, Implications for pore evolution. J. Nat. Gas Sci. Eng. 2017, 38, 21–38. [Google Scholar] [CrossRef]
  46. Gambacorta, G.; Trincianti, E.; Torricelli, S. Anoxia controlled by relative sea-level changes, an example from the Mis-sissippian Barnett Shale Formation. Palaeogeogr. Palaeoclim. Palaeoecol. 2016, 459, 306–320. [Google Scholar] [CrossRef]
  47. Steiner, M.; Wallis, E.; Erdtmann, B.-D.; Zhao, Y.; Yang, R. Submarine-hydrothermal exhalative ore layers in black shales from South China and associated fossils—Insights into a Lower Cambrian facies and bio-evolution. Palaeogeogr. Palaeoclim. Palaeoecol. 2001, 169, 165–191. [Google Scholar] [CrossRef]
Figure 1. (a) Map showing the location of South China in early Cambrian [22]. (b) Paleogeographic map of Yangtze Block in Early Cambrian [25,29]. (c) Lithologic columns of the lower Cambrian Niutitang Formation in south China.
Minerals 11 00051 g001
Figure 2. Lithofacies classification of studied Niutitang shale samples.
Minerals 11 00051 g002
Figure 3. Interparticle pores between detrital grains and authigenic quartz. (a) InterP pores between clay minerals and rigid grains; (b) InterP pores between rigid grains; (c) InterP pores between K-feldspar and clay minerals; interP pores between authigenic quartz; (d) InterP pores between authigenic quartz.
Minerals 11 00051 g003
Figure 4. Characteristics of intraparticle pores. (a,b) Cleavage-sheet intraP pores within clay minerals; (c) IntraP pores within framboidal pyrite; (df) Corrosion intraP pores developed within quartz (Q), dolomite (D) and euhedral pyrite, respectively.
Minerals 11 00051 g004
Figure 5. Characteristics of organic pores. (a) honeycomb-shaped OM pores; (b) OM pores within clay minerals; (c) OM pores between microcrystalline quartz (AQ); (d) OM pores related to the skeleton structure of organic organisms.
Minerals 11 00051 g005
Figure 6. Pore structure characteristics of siliceous shale in Niutitang Formation. (ac) pores in siliceous shale from GCC section, which show interparticle pores are the main pore type; (df) pores in siliceous shale from YWT section.
Minerals 11 00051 g006
Figure 7. Pore structure characteristics of argillaceous shale in Niutitang Formation. (a) Cleavage-sheet intraparticle pores within clay minerals; (b) Intraparticle pores within pyrite framboids and interparticle pores between quartz and clay minerals; (c) interparticle pores between caly minerals and rigid grains; (d) organic pores in honeycomb shape.
Minerals 11 00051 g007
Figure 8. N2 adsorption/desorption isotherms at low temperature (77 K) for siliceous shales (a) and argillaceous shales (b).
Minerals 11 00051 g008
Figure 9. CO2 adsorption isotherms for siliceous shales (a) and argillaceous shales (b).
Minerals 11 00051 g009
Figure 10. Micropore pore size distribution characteristics of siliceous shales (a) and argillaceous shales (b) in Niutitang Formation.
Minerals 11 00051 g010
Figure 11. Mesopore surface areas and volume versus TOC content (a,b); micropore surface areas and volume versus TOC content (c,d) for siliceous shales.
Minerals 11 00051 g011aMinerals 11 00051 g011b
Figure 12. Mesopore surface areas and volume versus TOC content (a,b); micropore surface areas and volume versus TOC content (c,d) for argillaceous shales.
Minerals 11 00051 g012
Figure 13. Mesopore surface areas and volume versus illite content (a,b); micropore surface areas and volume versus illite content (c,d) for siliceous shales (blue color) and argillaceous shales (orange color).
Minerals 11 00051 g013
Figure 14. Mesopore surface areas and volume versus Excess-Si content (a,b); micropore surface areas and volume versus Excess-Si content (c,d) for siliceous shales.
Minerals 11 00051 g014
Figure 15. Mesopore surface areas and volume versus Excess-Si content (a,b); micropore surface areas and volume versus Excess-Si content (c,d) for argillaceous shales.
Minerals 11 00051 g015
Table 1. TOC and Mineral composition of Niutitang Formation in GCC section, ND1 well and YWT section.
SamplesLithologyTOC (wt%)Mineral Composition (%)
QuartzK-FeldsparAlbiteCalciteDolomitePyriteTotal ClayIlliteIllite/SmectiteChlorite
GCC-01Siliceous shale1.5142090004936013
GCC04Siliceous shale1.3953011001352760
GCC-06Siliceous shale1.2945011003423507
GCC-09Siliceous shale1.5543012001443608
GCC-15Argillaceous shale1.15250170015740017
GCC-19Argillaceous shale0.98270110026048012
GCC-23Argillaceous shale0.8131090006050010
GCC-31Argillaceous shale0.9033013001524381
GCC-34Argillaceous shale1.0026090016445019
GCC-39Argillaceous shale0.9734015000514704
GCC-43Argillaceous shale1.01280120015942017
GCC-66Siliceous shale2.59360150004934015
GCC-67Argillaceous shale3.09310150015330023
ND1-28Siliceous shale0.3650250006191180
ND1-33Siliceous shale2.223235001779720
ND1-40Siliceous shale1.7835260022513930
ND1-44Siliceous shale1.730290020109710
ND1-51Siliceous shale1.5434210030312840
ND1-58Siliceous shale2.631230031411650
ND1-67Siliceous shale8.336180820414850
ND1-76Siliceous shale4.893001213300
ND1-82Siliceous shale6.552015337201370
ND1-96Siliceous shale4.369088546510
ND1-104Siliceous shale3.347083164221570
ND1-113Siliceous shale4.01490730437520
ND1-122Siliceous shale1.95901455512930
ND1-135Siliceous shale1.43801222132131021
ND1-153Siliceous shale0.750016704231724
YWT-28Siliceous shale10.98793000414914
YWT-37Siliceous shale11.692000026510
YWT-40Siliceous shale11.238200001171133
YWT-42Siliceous shale10.677620004181440
YWT-49Siliceous shale9.4688200028620
YWT-55Siliceous shale11.26774000316922
YWT-61Siliceous shale13.289200025102
YWT-75Siliceous shale5.8196000004400
Table 2. Micropore and mesopore volumes and surface areas based on gas adsorption.
SamplesLithologyTOCIlliteExcess-SiN2 AdsorptionCO2 Adsorption
BET Surface Area, m2/gBJH Mesopore Volume, cm3/100 gMaximum Adsorption Volume, cm3/gDFT Micropore Surface Area, m2/gDFT Micropore Volume, cm3/100 gMaximum Adsorption Volume, cm3/g
GCC-09Siliceous shale1.55367.6210.842.5416.946.740.2001.82
GCC-66Siliceous shale2.5934-30.434.6131.847.590.2451.94
ND1-28Siliceous shale0.36113.234.470.664.802.130.0710.82
ND1-96Siliceous shale4.35518.2922.111.1511.4111.750.3612.59
YWT-49Siliceous shale9.46627.574.302.1713.9213.310.3942.65
YWT-75Siliceous shale3.20431.2725.024.4229.979.460.2942.15
GCC-31Argillaceous shale0.90432.5111.912.1214.815.950.1881.62
GCC-34Argillaceous shale1.00451.658.221.8612.735.090.1661.41
GCC-39Argillaceous shale0.97474.9116.533.0521.026.770.2121.55
GCC-43Argillaceous shale1.01422.748.151.7512.344.990.1492.03
GCC-67Argillaceous shale3.97306.029.181.5410.890.900.0310.36
Note: “-” means no data.
Publisher’s Note: MDPI stays neutral with regard to jurisdictional claims in published maps and institutional affiliations.

