Case Study on the User Interface of GPS Plotters to Enhance Their Usability


1
Faculty of Korea Institute of Maritime and Fisheries Technology, Busan 49111, Korea
2
Faculty of Korea Maritime and Ocean University, Busan 49112, Korea
*
Author to whom correspondence should be addressed.
J. Mar. Sci. Eng. 2021, 9(1), 57; https://doi.org/10.3390/jmse9010057
Submission received: 7 December 2020
/
Revised: 30 December 2020
/
Accepted: 4 January 2021
/
Published: 6 January 2021
(This article belongs to the Special Issue Advances in Maritime Safety)
Abstract
:In 2019, the International Maritime Organization (IMO) prescribed guidelines to standardize the user interface (UI) of navigation equipment such as radio detection and ranging (RADAR) and the electronic chart display and information system (ECDIS), which mandate the unification of various terminologies and icons to improve usability. However, comprehensive studies on the operability and standardization of global positioning system (GPS) plotters, which are auxiliary equipment installed across various domestic and commercial vessels for navigational purposes, have not been conducted. Therefore, we performed a case study to identify the user requirements for standardizing the UI of GPS plotters in South Korea. Additionally, we conducted a survey to ascertain the frequency of use of the navigational functions in a GPS plotter, in which, several deck officers and captains participated. The frequently used navigational functions that were subsequently identified confirmed the need for standardization of the UI. Furthermore, the users requested the standardization of the menus of these functions using Korean terminologies. Hence, we attempted to derive standardized items that can be applied to both the functions of the GPS plotters and the navigation information obtained, which can contribute to the improvement of the UI across the different types of plotters.
1. Introduction
The International Maritime Organization (IMO) introduced e-Navigation in 2006 to increase the efficiency of maritime trade and transport along with the infrastructure and digital information necessary for its implementation. Accordingly, the guidelines for the standardization of the user interface (UI) design in navigation equipment (“guidelines”) were developed for the integrated navigation system (INS), electronic chart display and information system (ECDIS), and radio detection and ranging (RADAR) system. These guidelines were approved by the IMO in June 2019 at the 101st session of the Maritime Safety Committee (MSC) and are effective from January 2024 [1]. Additionally, the performance standards for the presentation of navigation-related information on shipborne navigational displays (MSC.191(79)) were amended, and the terminologies of the function menu and display information groups included in appendices 2 and 3 of the guidelines were mandated. The upgraded navigational displays would be installed on bridges from July 2025 [2]; therefore, the bridge system would also be required to incorporate the improvements prescribed by the newly introduced guidelines [3,4].
The guidelines aim to improve the usability of navigational equipment and systems—such as ECDIS and RADAR—by standardizing the interface, facilitating easy access to information and enhancing situational awareness. They achieve this by including standard terminologies and icons in the UI to aid the development of a user-friendly design [5].
Currently, several shipboard users, such as the captains and deck officers of domestic and commercial vessels, primarily utilize electronic chart systems (ECS), such as global positioning system (GPS) plotters, for navigation [6]. GPS plotters are widely installed in such vessels with varying functionalities such as fishing [4], and are developed by multiple manufacturers. However, they are excluded from the scope of standardization because they are not considered as the mandatory equipement under international convention for the Safety Of Life At Sea(SOLAS), which specifies minimum standards for ships’ the construction, equipment and operation regarding to their safety. Therefore, systematic awareness and training programs to improve the quality of the UI are not mandatory. In addition, the dissimilarities among the various interfaces provided by the different manufacturers can cause further challenges in operating the equipment. To address these issues, the requirements of shipboard users, who constitute the majority of GPS-plotter users, must be investigated. Moreover, considering that the guidelines would be applied to all navigation equipment from July 2025, collating user opinions on the standardization of the UI is essential to enhance the operability of GPS plotters and could encourage further research on obtaining the necessary information and developing the relevant functions and menus to improve the overall quality of these systems.
Although several studies related to the improvement of GPS-plotter UI exist, extensive research on user requirements has not been conducted. Hence, the purpose of this study was to collate and evaluate these requirements to improve the quality of GPS-plotter UI in terms of standardization. Accordingly, a survey was conducted, wherein deck officers and captains tested both frequently and sparsely used navigational functions in GPS plotters. Subsequently, we conducted interviews to identify the standardization requirements for UI enhancement. Based on the participants’ inputs, the operability of the frequently used navigational functions of existing GPS plotters was evaluated. These results can contribute to the standardization of user interfaces in different GPS plotters.
2. GPS Plotters: Background
2.1. Literature Review
To identify the user requirements for the effective operation of navigational equipment, a questionnaire was developed using the IMO ECDIS performance standard [7]. Additionally, upon conducting an investigation on the user requirements for advancing existing guidelines, we concluded that the guidelines are crucial to develop standardized displays and user-friendly menu systems [8]. After the introduction of the ECDIS, a study [9] was conducted with 402 mariners during the period of 2012–2018 to gain user insight on the operability of the system compared with nautical paper charts, which confirmed the potential problems associated with the transition to electronic charts. In addition, the opinions of officers on the watch regarding the experience of using the ECDIS were presented [10]. To evaluate the usability of the various navigational functions, the quantitative technique of a questionnaire was conducted to analyze the effectiveness of introducing the ECDIS [11]. Alternatively, an eye-tracking device was employed to perform the usability test on the ECDIS [12,13,14].
Human factors that contribute to the level of operability of marine equipment were also studied in certain usability testing methods, where navigational tasks were monitored through simulations to capture human errors [15]. Similarly, a standard set of navigational tasks were derived and evaluated to improve the UI of navigation equipment [16]. To identify the basic functions of ECDIS and RADAR that require standardization, 22 navigational tasks for voyage planning, route monitoring, and collision prevention were selected based on the performance standards and 26 navigators contributed to the experiment using ship-control simulators by three manufacturers. An analysis of the main task execution time and differences in the operability of the equipment for each task presented a significant time difference in the performance of each simulator for eight tasks, including the line of position function, route correction, and safety contour change. This study highlighted the necessity of enhancing these functions by adopting standardized terminologies and icons.
An area-of-interest analysis was conducted based on the data collected from the navigational systems, wherein deck officers utilized eye-tracking devices on a passenger ship operating from Busan, Korea, to Osaka, Japan [17]. Consequently, the ratio of external visual observation was calculated at 49.2%, and the rate of using ECDIS and RADAR reached 44.6% during the experiment. In addition, it was confirmed that the navigator primarily used own-ship data (heading direction, ship speed, great guideway, ground speed, etc.), other-ship data (target number, ground speed, ground course, nearest point, closest time, etc.), automatic identification system (AIS) information (e.g., ship name), and the indication of the electronic azimuth line. The aforementioned studies contribute to the development of international standardization guidelines of the IMO, chiefly targeting ECDIS and RADAR used in ocean-going vessels.
Compared with previous research cases related to ECDIS and RADAR, there was no study conducted to improve GPS-plotter UI. However, a study was conducted on the usability evaluation of ECS in yachts and boats, and relevant guidelines were presented for stakeholders such as manufacturers and boat owners [18]. Another study identified that GPS plotters installed and used in domestic ships in Korea lack navigational information, and suggested the need for functions, such as alarms, particularly when the voyage speed exceeded the limit [19]. Several studies concluded that although GPS plotters are widely used in small- and medium-sized ships, they cause marine accidents owing to failures in implementing the latest updates [20,21]. Moreover, a geographic information system plotter based on common Linux was developed for small fishing vessels, similar to the GPS plotter [22].
The Korean government ruled that ECS for the intelligent maritime traffic information service would be installed as mandatory equipment on national ships from 2021 [23]. According to the Promotion of the Provision and Use of Intelligent Marine Traffic Information Services Act, the equipment is expected to improve navigation safety and provide optimal route information services based on electronic charts transmitted in real-time through long term evolution networks. This is considered to be an alternative to GPS plotters. The ECS shall be installed with type approval in accordance with the law. The recently revised type-approval standard includes the interface of the terminal and the test criteria for the requirements to implement e-Navigation service functions. It calls for compliance with the international standard for navigation information and terminologies established by the IMO [24]. However, there are no requirements for the guidelines to introduce standardized menu names or icons to implement navigational functions. In other words, performance test requirements for navigational functions exist; however, specific UI requirements, such as menu names or icons, that contribute to the usability of the functions, are not present.
To summarize, numerous studies related to the usability of ECDIS, along with surveys and experiments on the functions of ECDIS and RADAR have been conducted to develop international standardization guidelines. Conversely, there exist limited studies on the current status, problems, and solutions for the use of GPS plotters; compared to ECDIS, opinion surveys, and user evaluation experiments conducted for GPS-plotter users are relatively few. Therefore, this study seeks to highlight the importance of understanding the requirements for improving UI standardization by focusing on user feedback and evaluations on utilizing a type of ECS-GPS plotters.
2.2. Status of Type Approval Specifications and Equipment Related to GPS Plotters
A review of the government type-approval standard in Korea determined that the installation of ECS can be type-approved in accordance with the standards for type-approval tests and inspections for marine products (“type-approval standard”) mandated by Article 18 of the Ship Safety Act. This standard requires 34 items to be checked before the test, divided as 5 items including appearance and components; 15 items such as salt spray test and vibration test for environmental tests; and 14 items including standard symbol and safety depth indication for performance tests. The navigational function of the GPS plotter must test the performance of eight items: standard symbol, safe depth, and over-scale indications; planning, correction, and monitoring of routes; and the track record and electronic chart update function [25].
To analyze the actual interface, equipment that passed government type approval was investigated. When the status of the GPS plotter type approval by the Ministry of Oceans and Fisheries was inquired through the shipping and port logistics information system, only models B and C produced by company A were type-approved. The product has an electronic chart that uses the existing paper chart symbols and certain symbols established by company A.
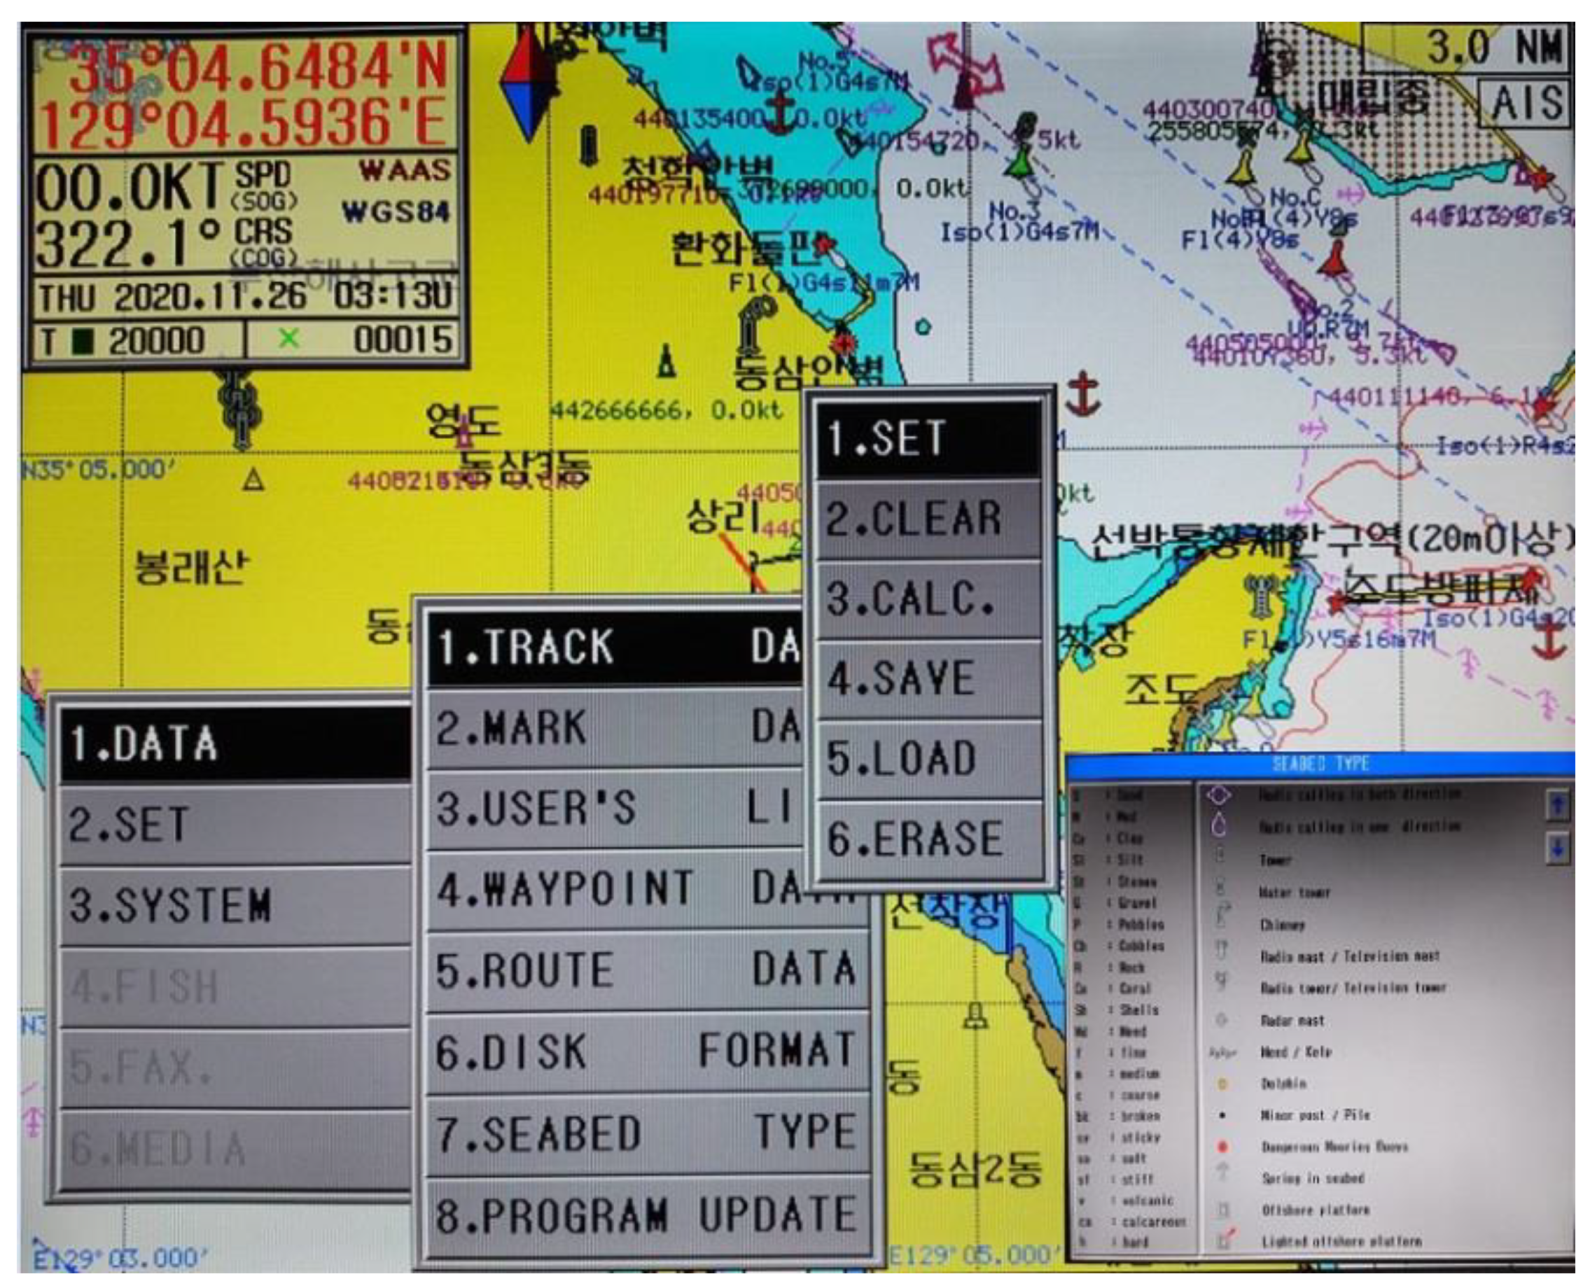
Figure 1 presents a default screen, wherein the menu structure of model B has a fixed window for displaying the position, speed, and course over the ground, whereas the symbol and vector of the own ship are displayed in the center of the screen. Detailed functions such as route setting can be operated using the menu tree obtained from the menu button, and the shape and definition of private symbols established by the company can be viewed by executing the command “View submarine symbols” [26].
The review of the type-approval standard resulted in only a few basic navigational function performance tests that require 18 standard symbols to be displayed on the GPS plotter chart. However, requirements for menu names and information items were not displayed on the screen. In addition, no equipment received the type approval except for the models included in this study, as the type approval for GPS plotters in not mandatory. Nevertheless, GPS plotters are widely used in domestic ships; therefore, a thorough investigation of the users’ opinions is essential to validate the actual scenario and propose a method for improving the usability of the equipment.
2.3. Comparison between GPS-Plotter UI and the Guidelines
It is essential to check the current status of the GPS plotter by comparing the differences with the guidelines to be applied to the future navigation equipment and analyzing them. Therefore, one GPS-plotter model was selected as a case, and the detailed requirements of the guidelines and its interface were compared and analyzed. The equipment to be compared was a GPS plotter type approved by the Korean government, which is also the equipment to be tested in this paper. The scope of analysis of the guidelines was limited to its Appendix 2, which contains navigation-related terminology and icons of functions. The Hot Keys and Shortcuts included in the Appendix 2 were compared with the GPS-plotter UI and the matched items are shown in Table 1. Here, the hot key allows a specific function to be executed immediately, and the shortcut can be used to access the group of related functions (Figure 2). As a result of the analysis, only 23.6% matched the items required in the guidelines and the function term on the GPS plotter interface, indicating that improvement for standardization is needed.
3. Setting Up of the Test
3.1. Concept of the Research Methodology
A quantitative survey was conducted to identify the need of standardization for the various terminologies, symbols, and interfaces designed by various GPS-plotter manufacturers and to identify the standardization requirements by conducting surveys on users such as captains and deck officers. To develop a questionnaire and experimental design for the research, we focused on appendices 2 and 3 of the guidelines, as they were referred by the IMO Resolution MSC.466(101) [2]. According to the IMO performance standard, these appendices will be mandatorily implemented from 2024. Appendix 2 of the guidelines provides standard terminologies and icons for commonly used functions in the navigation equipment, while Appendix 3 presents a logical grouping of information on navigational display. Therefore, we investigated user requirements for the standardization of GPS plotter functions and information display items.
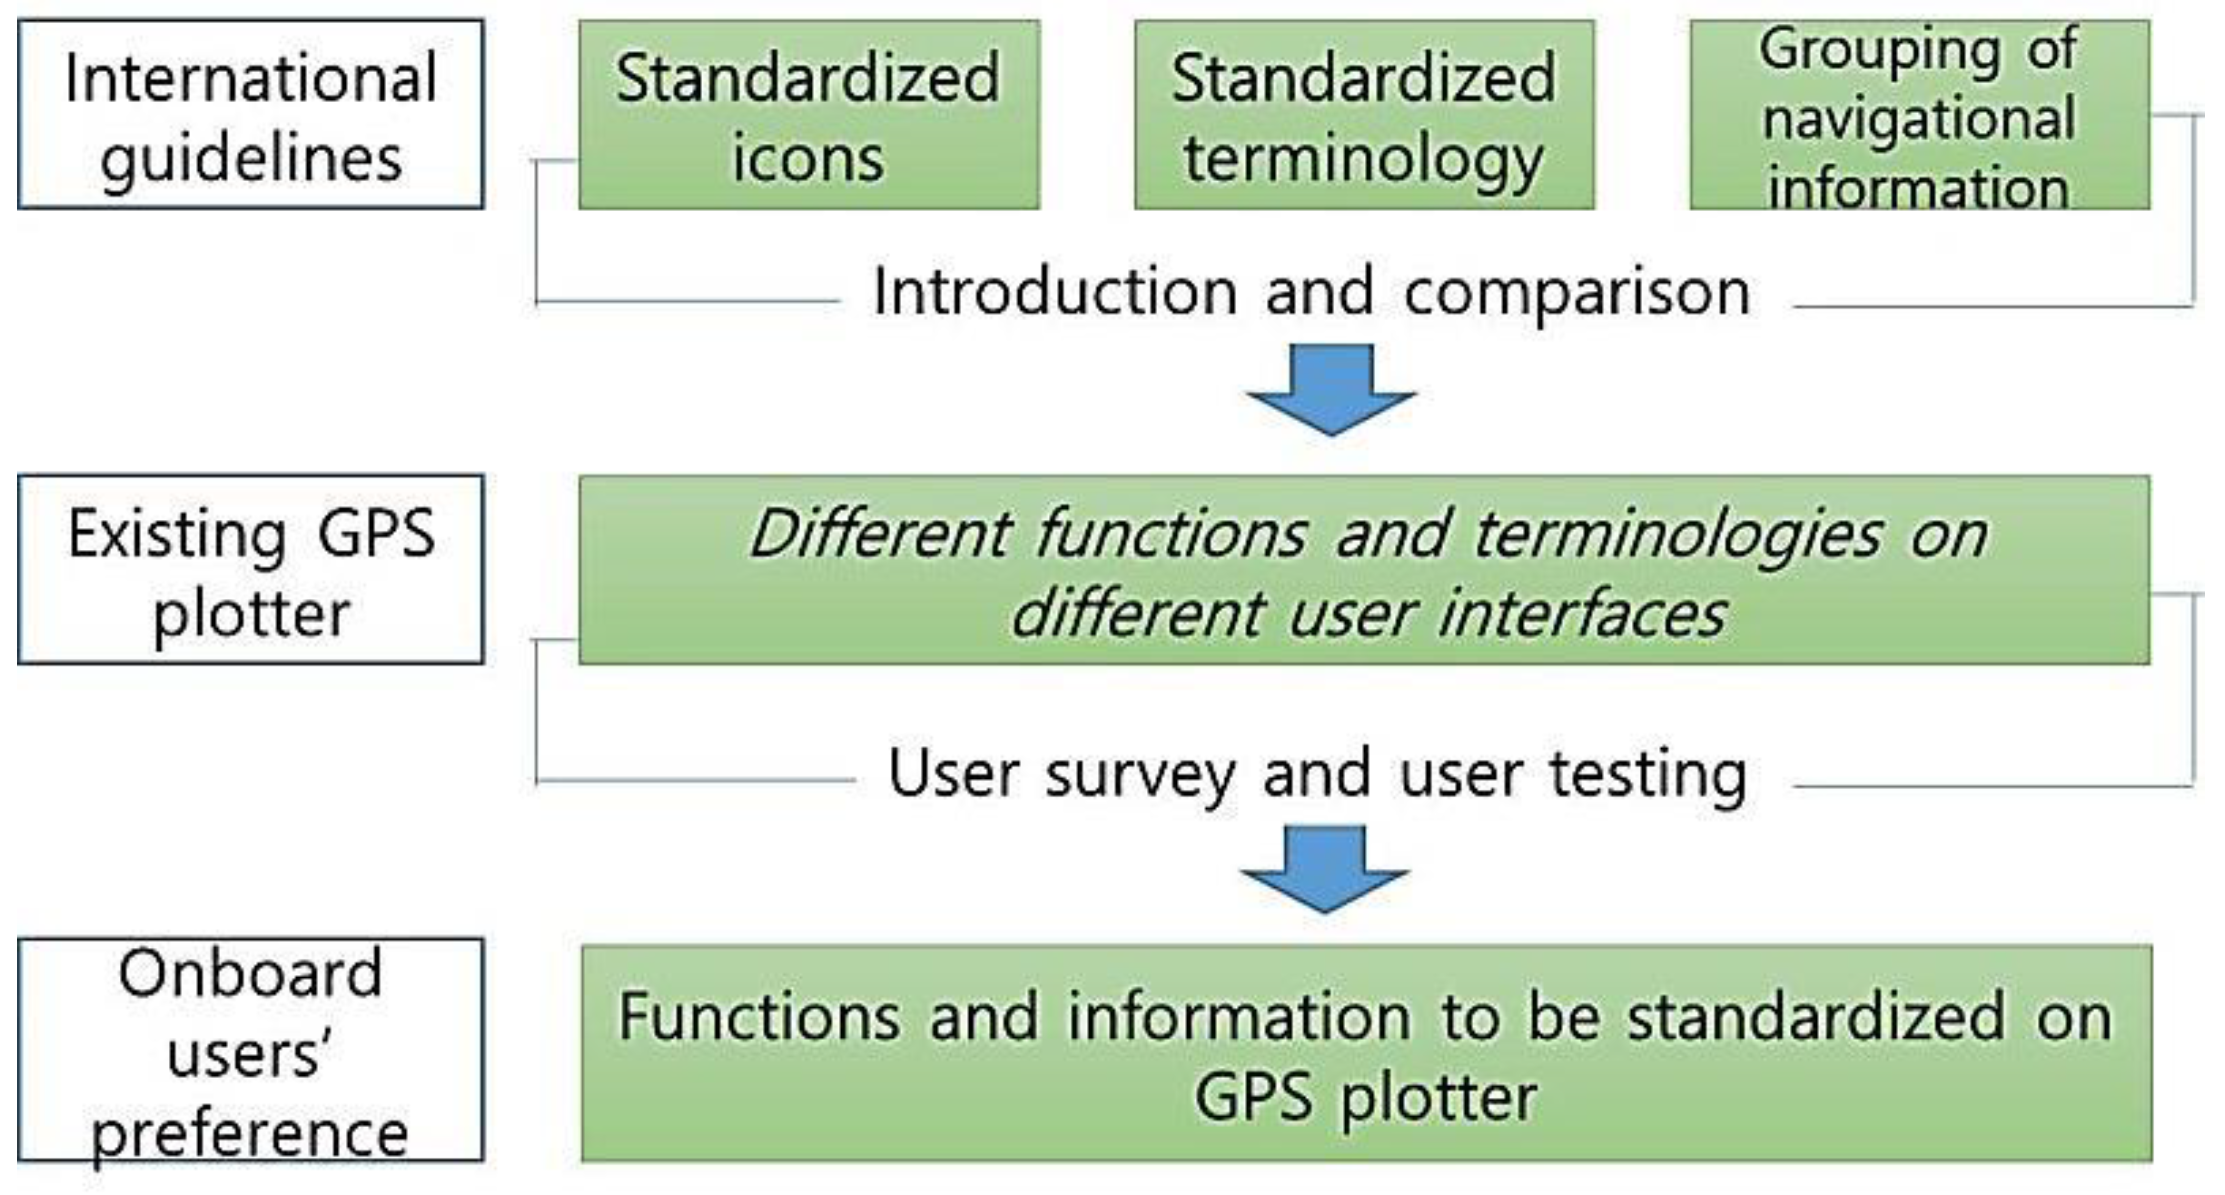
Based on user opinions, the frequently used navigational functions were identified, and a usability evaluation was performed. Using actual GPS plotter equipment, the usability of frequently used navigation functions was checked, and user requirements were identified in terms of standardization of GPS plotters through interviews with tested participants. Figure 3 presents the research methodology used to investigate the user requirements for standardization of the plotter UI based on the user-demand survey and usability evaluation.
3.2. Designing the Survey Questionnaire
To identify the user requirements for the standardization of GPS plotters and improve usability, we investigated the frequently used navigational information and functions. Therefore, seven items of navigational function terms and abbreviations in the GPS plotter interface approved by the government national standards were considered to render the screen layout and arrangement. A questionnaire was prepared based on 25 functions of the GPS plotter; the functions to be standardized and the user’s understanding of each major function and standardization requirements were identified based on the frequently used navigational functions. The main questionnaire items test the understanding of the menu name for the navigational functions of the GPS plotter, inquiring the need to standardize terms and apply the standard icons while determining the frequency of use of the navigational functions, as shown in (Table 2).
3.3. Designing the User Test
To evaluate the user familiarity of the GPS plotter and collect user needs for standardization, simulation experiments and user interviews were conducted using actual equipment. According to the method of performing usability evaluation from the user experience perspective established by the Information Communication Standardization Committee [27], it is recommended that at least five participants take part in the usability evaluation. In addition, the selected task for an experiment must be representative with the functional, error, and temporal aspects considered based on the frequency of use, existence of a problem, and time measurement [28]. Based on these criteria, 10 frequently used navigational tasks were selected based on the results of the initial survey of 132 users (Table 3) to identify the representative navigational functions.
In total, five shipboard users including deck officers and captains of incumbent fishing and domestic vessels participated in the experiment. Each participant performed 10 typical sailing tasks using a GPS plotter and confirmed the usability by measuring the time required to perform each task. In addition, based on the experience of performing the task, user opinions on the improvement requirements of terms and symbols, understanding of terms and abbreviations, and functions requiring improved usability were collected. Moreover, group interviews and discussions were conducted on the convenience of performing navigational functions, preferences for displaying information on the navigation screen, and the need for standard terms.
4. Test Results and Discussions
4.1. Results of the Questionnaire Survey
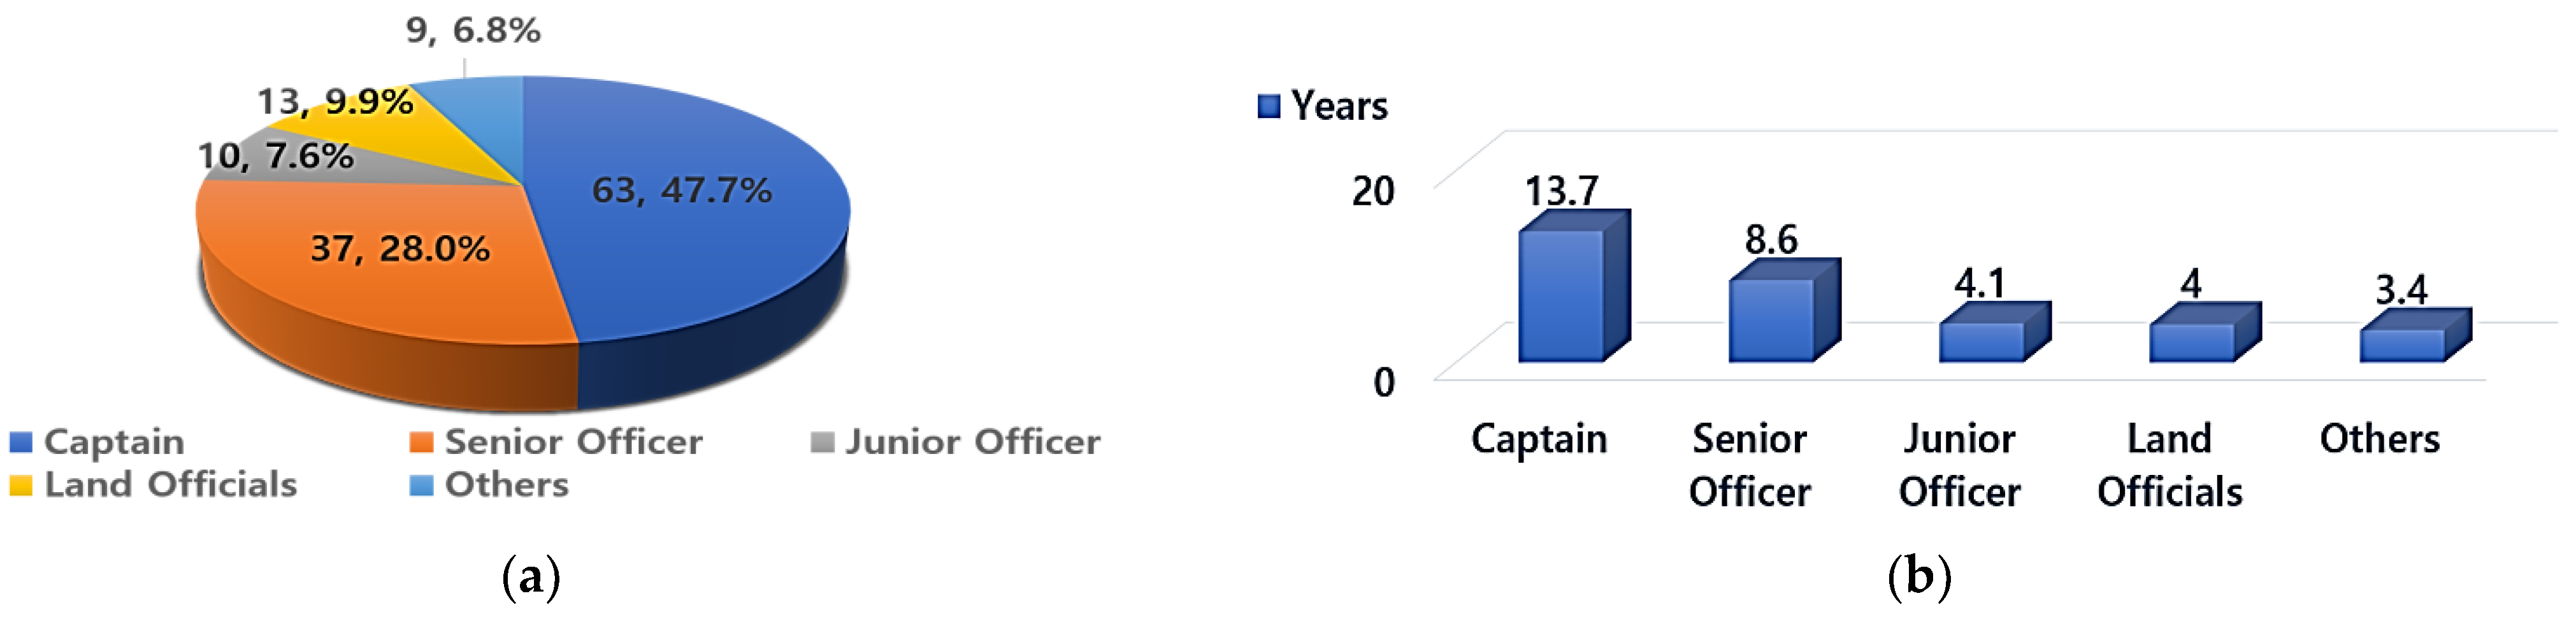
A survey of 182 users, primarily mariners experienced in using GPS plotters, was conducted in Korea Institute Maritime and Fisheries Technology (KIMFT) from June to August 2019, and 132 effective questionnaires were retrieved. The personnel composition of the respondents (Figure 4) included captains (47.7%), navigators (35.6%), land officials (9.9%), and others (6.8%). In addition, the survey showed that they were engaged in coastal fishing boats (26.5%), cargo ships (37.1%), ocean fishing boats (7.6%), passenger ships (6.8%), and others (22.0%). The experience of respondents onboard averaged 16.4 years, wherein and they have sufficiently used GPS plotters (Figure 4). The survey of 132 questionnaires determined that 77% (43 of the 56 that responded) participants used the GPS plotters manufactured by company A. In addition, other manufacturers were identified; five, four, and four respondents used products from companies B, C, and others, respectively (Table 4).
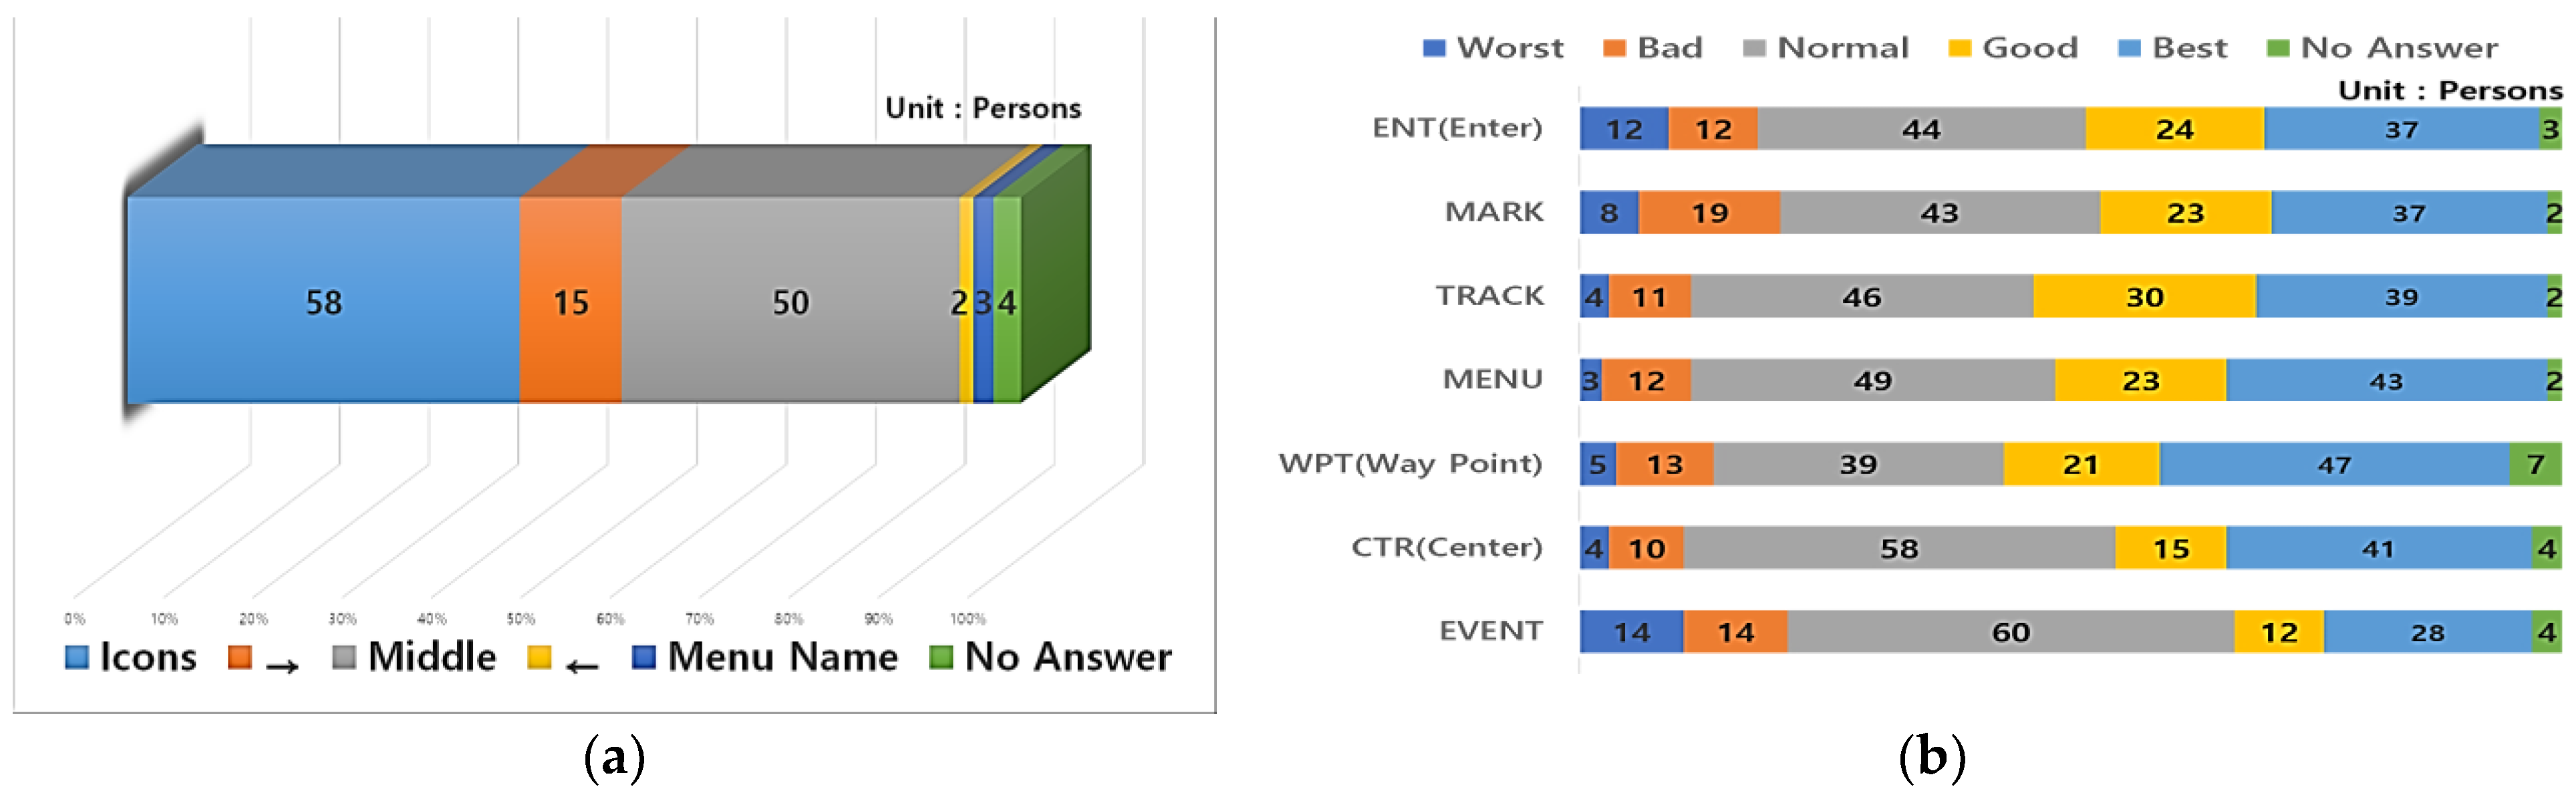
In terms of the need for the application of standard icons, 73 respondents (55.3%) reported a “high need” and 50 people (37.9%) answered a “moderate need” (Table 5). A subjective opinion was established that the unification of the operation method through the introduction of standard icons was necessary when using different models of GPS plotters. In addition, we analyzed the degree of understanding of the seven terms and abbreviations used in the GPS plotter, and the survey was rated from 1 to 5 in the order of “worst” to “best” (Table 5). The average result of all functions confirmed that the terms were generally understood at 3.6 points, and the terms that were well and least understood were “MENU” and “EVENT”, respectively.
Further, Table 5 presents the use of GPS plotter function keys; 57 (43.2%), 31 (23.5%), and 38 (28.8%) respondents preferred the application of the menu name, icon, and the combination of “icon” and “menu name” in a neutral manner, respectively. In addition, 80 (60.6%) and 28 (21.2%) people answered that the screen size of the GPS plotter was normal and good, respectively. Owing to inadequacy, 90.9% of negative respondents stated that the screen was small. Additionally, the respondents with the opinion of “good” screen size could have considered the limited installation space available on small- and medium-sized vessels.
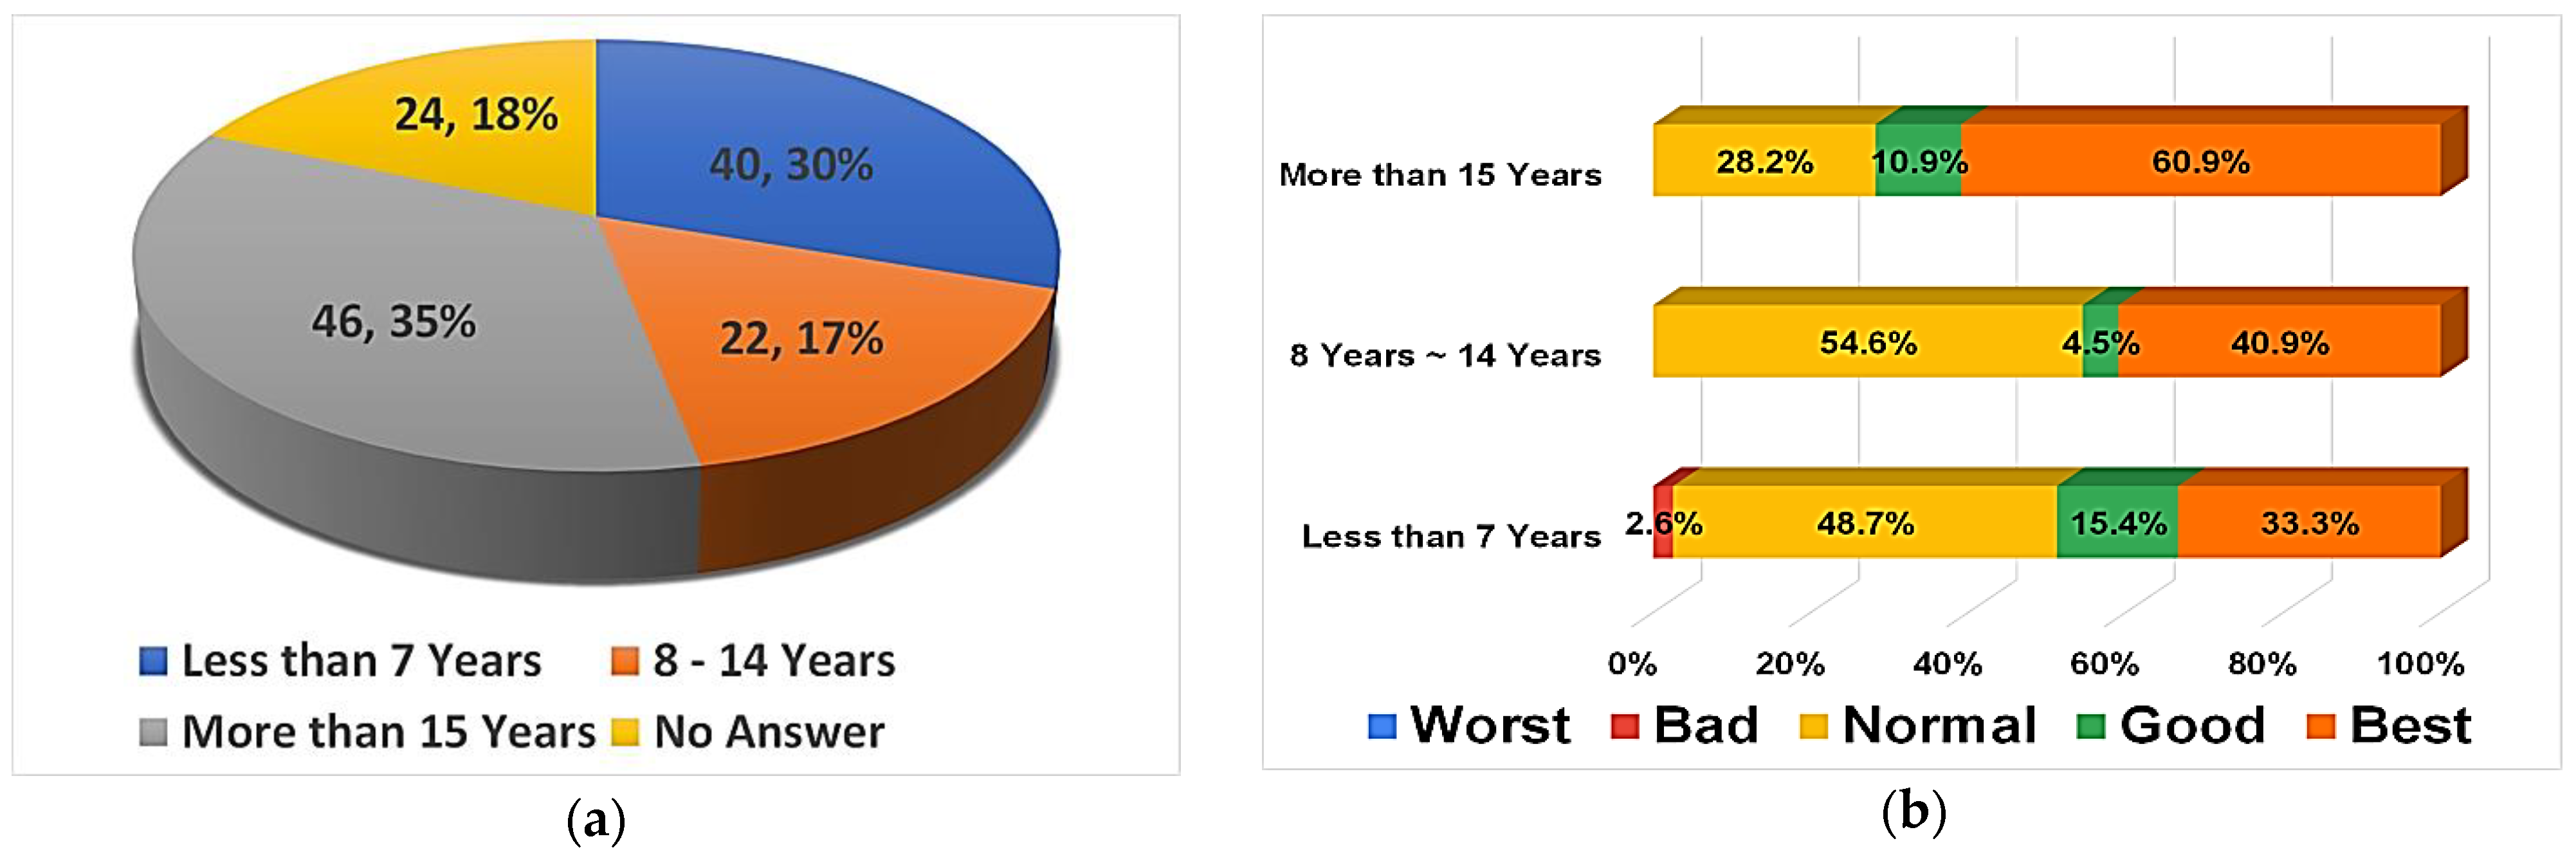
In addition to the above analysis, we explored the possibility of a difference in the users’ need for standardization and their understanding of navigational terms based on their experience using GPS plotters. As shown in Table 6, the respondents were divided into three groups (viz., ≤7 years, 8–14 years, and ≥15 years) based on their level of experience (p < 0.05).
Regarding the preference of applying standardized icons (Figure 5), there was a significant difference between the group with 7 years (or less) experience and 15 years (or more) experience. Users who were highly familiar with the operation of GPS plotters were more likely to apply standardized icons than those who were not.
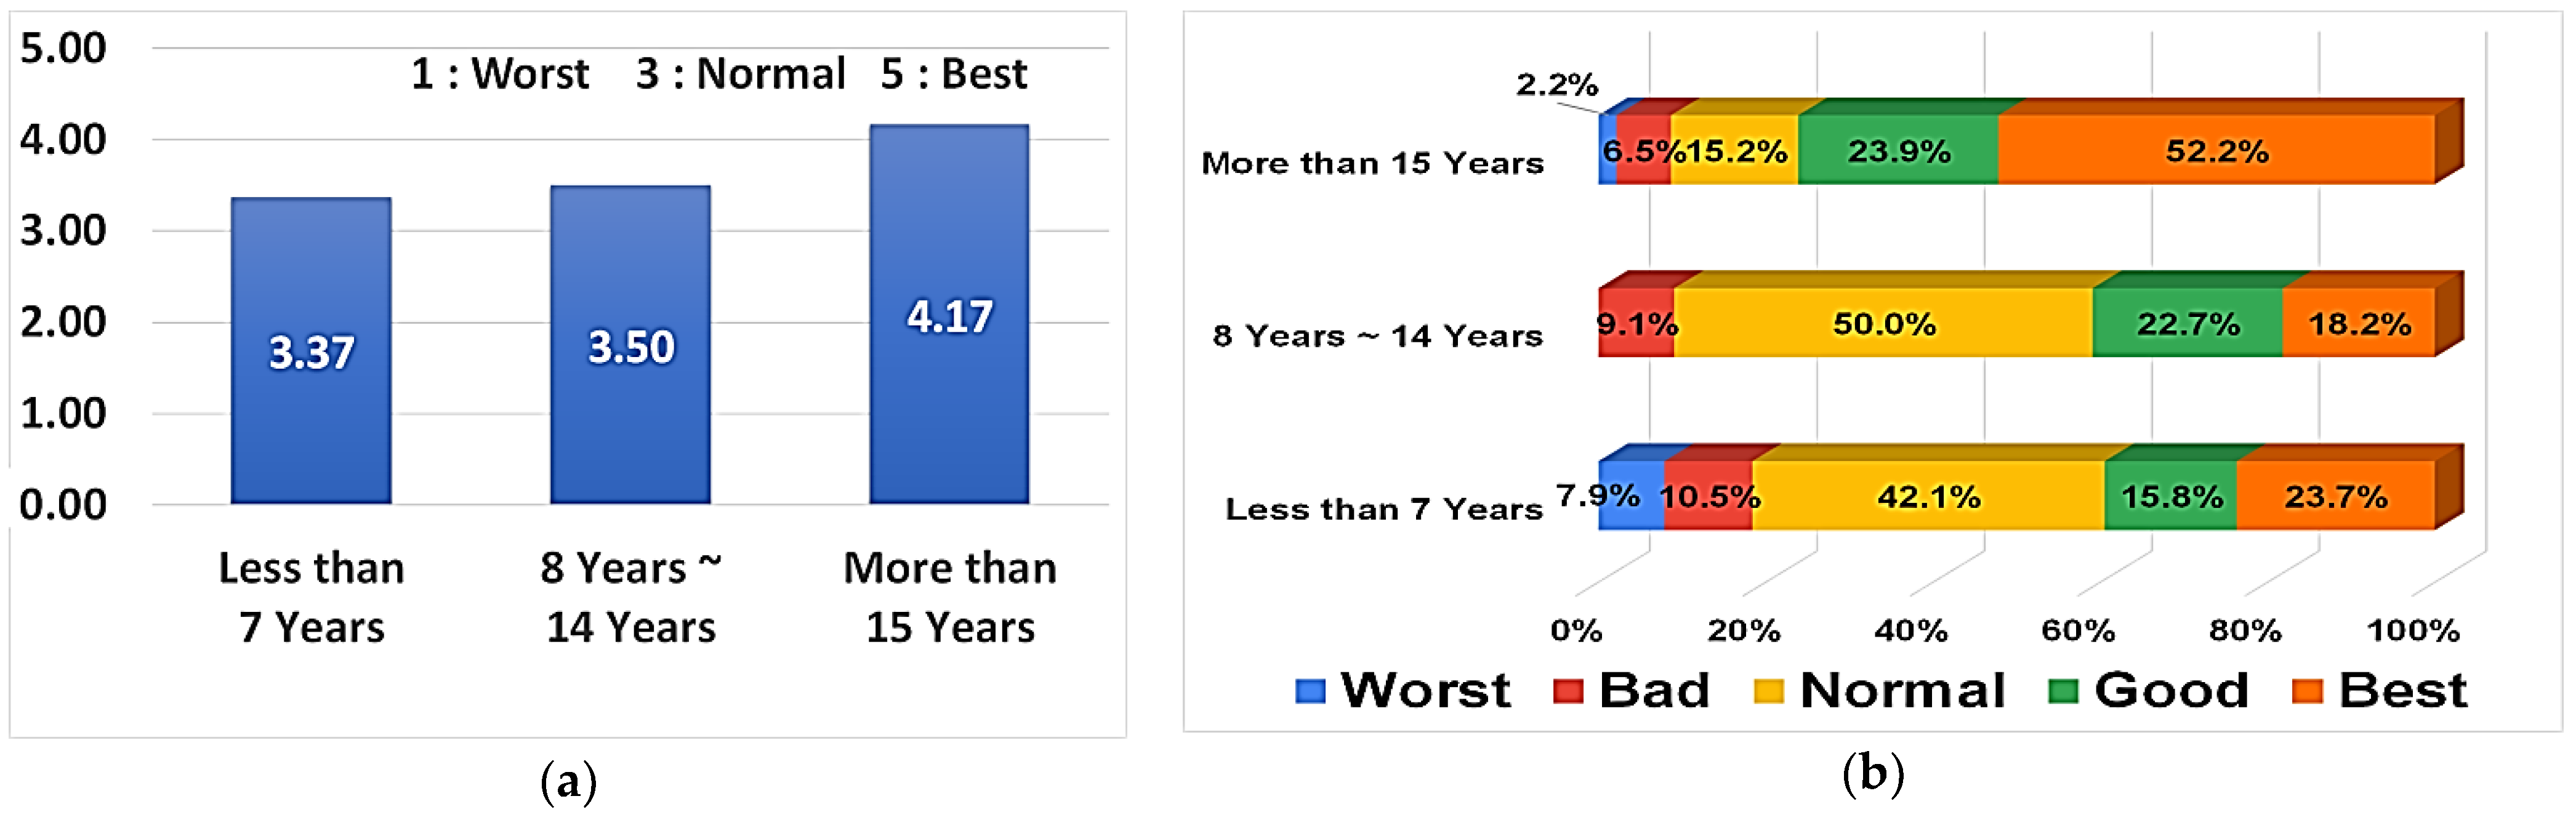
As a result of analyzing the degree of understanding of terms (Table 6), the menus showing significant differences (p < 0.05) in their perception by group were EVENT, CENTER, WPT, TRACK, MARK, and ENT, among the seven items surveyed. For the five identified items, we discovered that the degree of understanding of terms differed according to the experience of using the equipment between the groups, and further concluded that the users who operated the equipment for long periods had a better understanding than those who operated them for short periods. Further details are provided in the Appendix A.
The frequency of use of the 25 items that form the representative functions of GPS plotters, was evaluated on a five-point scale with one and five points attributed to least and most frequent use, respectively. Consequently, 18 items were detected to be used at frequencies above normal (3 points), including selection of day or night mode, route edit, and track on or off (Table 3). Therefore, these features must be designed in a user-friendly manner. Moreover, the participants suggested functions and position accuracy identical to ECDIS as requirements for improving the GPS plotter user interface. Furthermore, distance measurement and the need for additional estimated time of arrival (ETA) display functions were suggested.
4.2. Results of User Testing
A total of five incumbent captains and navigators (the testees) with sufficient experience of using GPS plotters measured the frequency of use for 10 tasks and the time required to perform the tasks. To increase familiarity with the experimental equipment, pre-familiarization training on GPS plotters was conducted for the testees. Table 7 presents the experimental results obtained using the ship handling simulator and GPS plotter installed at the KIMFT. The time required to complete the task was considered as a measure to evaluate the usability of the task. In the first task, the average task completion time for the five testees was 5.8 s, with the longest time being 87.4 s for the task of entering the destination.
A follow-up survey was conducted after the completion of all tasks. The five testees determined “entering destination,” “distance measurement to target,” and “input a symbol” as the frequently used navigation tasks. In terms of convenience of using the functions for task performance, all tasks were scored below average.
Further, we conducted a group interview with the testees, wherein they confirmed the need for applying standard Korean terms to be used intuitively, owing to the difficulty in understanding the menu names of the current interface. Moreover, the introduction of standard icons for frequently used functions can significantly improve usability. Table 8 presents the navigational information to be displayed on the GPS plotter screen, as requested by the testees. Additionally, the standard information group suggested in the guidelines was used during the interview. Therefore, the testees requested the same to be displayed on the screen of the GPS plotter as the guideline.
To improve the usability of the user interface, the participants requested diversification of input devices by introducing a mouse, trackball, and touch screen to facilitate cursor movement rather than using wired and wireless remote controls to operate the GPS plotters.
4.3. Discussions of User Survey and Testing Results
The survey facilitated the understanding of menu terms present in the current user interface, awareness of the need to apply icons, and frequency of use of navigational functions of the GPS plotter. The results of user testing can be summarized as follows.
We determined that despite users typically understanding the main menus of GPS plotters, the need for applying standard icons to the menus was high. Although GPS plotter users generally favor the application of standard icons, contradicting results were derived owing to the convenience of using terminologies in the menu, which is the current method, rather than the icon application method to operate the function keys. This is possibly the effect of intuitively recalling the names of the menu used in the GPS plotter.
Through the analysis of the respondents’ experience of using the GPS plotter, we inferred that users who used the equipment for a long time preferred the introduction of icons. Based on the shipboard user experience with GPS plotters, it can be understood that the respondents prefer the introduction of standardized icons to improve usability. In terms of understanding navigation-related terms, comparing the level of understanding by the respondents’ experience using the equipment enabled us to identify differences in the understanding level of the specific menu terms (CRT, WPT, MENU, TRACK, MARK, ENG). For users exhibiting a low understanding of items but demonstrating no significant difference in the user experience, the necessity of improving the usability of the menu EVENT is considered to be highly significant. Apart from the results of the analysis performed based on the level of expertise using the equipment, we demonstrated that if the overall average comprehension is 3.6 out of 5, the overall understanding of the term is considered normal; therefore, it can be said that there is a great need to improve understanding in the users. Further, we learned that “EVENT”, an item on which users displayed low understanding without significant differences in usage experience, is crucial to improving usability.
Through the above studies, the frequently used navigational functions in the GPS plotter and their usability were identified. In total, 10 frequently used navigational functions were prioritized and the test was done by measuring the time to achieve each task.
Frequently used functions identified by these experiments can be used in two aspects. One is to prioritize functions in GPS plotters needed to improve usability. For example, navigation features can be improved than other features to apply standard terms and icons in practice. The other aspect is these frequently used functions can be a crucial part to set up test cases for testing equipment [29,30].
Target tasks to test were discussed for this research and were advised by the navigation experts and users selected in this study. The results of questionnaire survey over navigation experts and the Bridge procedures guide [31] were contemplated and related tasks of GPS plotters are found out. The 10 tasks were decided after reducing duplication, integrating similar ones.
Times for task completion was specified for individual task and measured as a means of checking usability performance. This is to know that if it takes longer than the given time to complete any task, that means the functions involved in that task need to be improved.
Finally, the interviews of the five participants confirmed the need for intuitive Korean terms to be introduced in the menu names of the GPS-plotter UI and the standardized information (Table 8) items to be displayed on the screen were identified. The GPS plotter manufacturers can utilize the data to display necessary information on the user interface.
5. Conclusions
As the international standardization guidelines for navigation equipment will be applied from 2024, the standardized terms, icons, and navigational information groups will be introduced in the ECDIS, RADAR, and INS UIs to improve their usability. However, implementing these guidelines of IMO for the standardization of ECS such as GPS plotters is not yet considered. Although the installation of GPS plotters is not legally mandated, almost every domestic vessel utilizes this equipment. However, no application has yet been prepared to designate standard menu names or icons for major navigational services and functions for intelligent marine traffic devices, which are to be introduced in Korea in 2021. Therefore, it is essential to consider the standardization of menu names and icons focusing on user opinions to improve user familiarity and enhance safety.
In this regard, we conducted a case study targeting GPS plotters as the equipment requiring usability improvement in terms of standardization. Studies on GPS plotters used by several Korean shipboard users as auxiliary navigation equipment [32] recognized the need for improvement in terms of standardization. Therefore, the user needs for the introduction of standardization were investigated to improve the primary navigational information and function status along with their usability. To this end, a questionnaire survey was conducted for 182 coastal ship users, and a usability evaluation based on actual equipment was performed with the aid of five incumbent captains and sailors.
In this study, we determined the frequently used navigational functions in the GPS plotter and the level of users’ convenience and familiarity with them. Based on the user tests of 10 major navigation tasks in GPS plotters, the convenience for performing tasks was evaluated below normal, indicating that usability improvement is necessary. Particularly, entering destinations, editing route plans such as changing waypoints, and editing coastline drawing functions were found to have poor usability, highlighting the need for improvement. The interview that followed the user testing validated the need for standardization of the Korean terminology in the navigational functions; this is consistent with the survey results. Therefore, to improve usability, it is necessary to enhance the user interface of the current GPS plotter by applying standard Korean terminology to the menu names or introducing icons.
We believe that this study is the first to conduct a user requirement survey and a simulation test on a GPS plotter interface for incumbent ship navigators. Subsequently, comparative experiments must be conducted by introducing different types of plotters from multiple manufacturers.
Author Contributions
Conceptualization, M.J. and J.K.; methodology, S.L.; validation, M.J., J.K., and S.L.; formal analysis, J.K.; investigation, M.J.; resources, S.L.; data curation, S.L.; writing—original draft preparation, M.J.; writing—review and editing, M.J.; visualization, J.K.; supervision, S.L.; project administration, M.J. All authors have read and agreed to the published version of the manuscript.
Funding
This article is a result of a study on the “Leaders in Industry–University Cooperation (LINC) +” project supported by the Ministry of Education and National Research Foundation of Korea.
Conflicts of Interest
The authors declare no conflict of interest.
Appendix A
Appendix A.1. Survey Outline
Appendix A.1.1. Identifying Survey Respondents
The survey target was selected for masters and officers who are the practical users of GPS plotters on domestic and commercial vessels to aid them in navigating within domestic waters or on a fishing vessel. To better understand/identify the types of vessels that include GPS plotters, the gross tonnage along with ships types were surveyed.
Onboard experience and past experience on using GPS plotters were further surveyed to identify the level of GPS-plotter operational proficiency and previous usage experience. During this process, in addition, the various GPS plotter manufacturers were identified.
Appendix A.1.2. Identifying the Standardization Requirements
Questionnaires were structured to allow for the identification of the navigation functions frequently used in GPS plotters and included questions on the level of understanding of terms/acronym used in the system and the preferred size of the navigation screen. Based on this, the responses were structured as shown in Table 1.
Appendix A.1.3. Survey Result
Standardization Requirements (Application of Icons and Understanding of Term Abbreviations)
After analyzing the 132 valid responses to our questionnaires, we found that the response rate on the need for introducing standardized icons were significantly higher than that of menu names in navigational functions on the GPS plotter UI (Figure A1), and that the level of comprehension on terms/abbreviations displayed on the GPS plotter was fairly good except for the specific event.
Figure A1.
(a) Preference to apply function key for icons or menu terms; (b) Understanding of navigation-related terms and abbreviations.
Figure A1.
(a) Preference to apply function key for icons or menu terms; (b) Understanding of navigation-related terms and abbreviations.

Results of Survey Analysis Depending on Respondents’ GPS Equipment Usage Experience
The survey analysis was also focused on identifying significant differences (or correlations) between user requirements on standardization and the level of comprehension of menu terminology depending on the level of experience using GPS plotters. Excluding 24 non-respondents who did not include their experience level, the analysis was conducted for the remaining respondents on the preference of the standardized icons, understanding of menu terminologies by categorizing their usage experience (Table A1).

Table A1.
Characteristic of respondents by the experience of GPS plotter usage.
| GPS Plotter Usage Experience | Number of Respondents | Percentage |
|---|---|---|
| Less than 7 Years | 40 | 30.3% |
| More than 8 years ~ Less than 14 years | 22 | 16.7% |
| More than 15 years | 46 | 34.8% |
| Non-respondent | 24 | 18.2% |
| Total | 132 | 100.0% |
Is it necessary to apply standardized icons to functions frequently used for GPS plotters?
After analyzing the preference of applying standardized icons depending on users’ usage experience (Figure A2), a difference was observed between the groups with less than 7 years and the group with more than 15 years of experience using GPS plotters (p < 0.05).
Figure A2.
User preference for applying standards icons on frequently used functions by experience of using GPS plotters. Average (1: Worst to 5: Best).
Figure A2.
User preference for applying standards icons on frequently used functions by experience of using GPS plotters. Average (1: Worst to 5: Best).

It was found that people who used the GPS plotter for a longer period of time are more inclined to make positive judgments about the application of standardized icon than those who used the GPS plotter for a shorter period of time.
The Level of Comprehension and the Usability of GPS Plotter for Navigation Functional Terms
- (i)
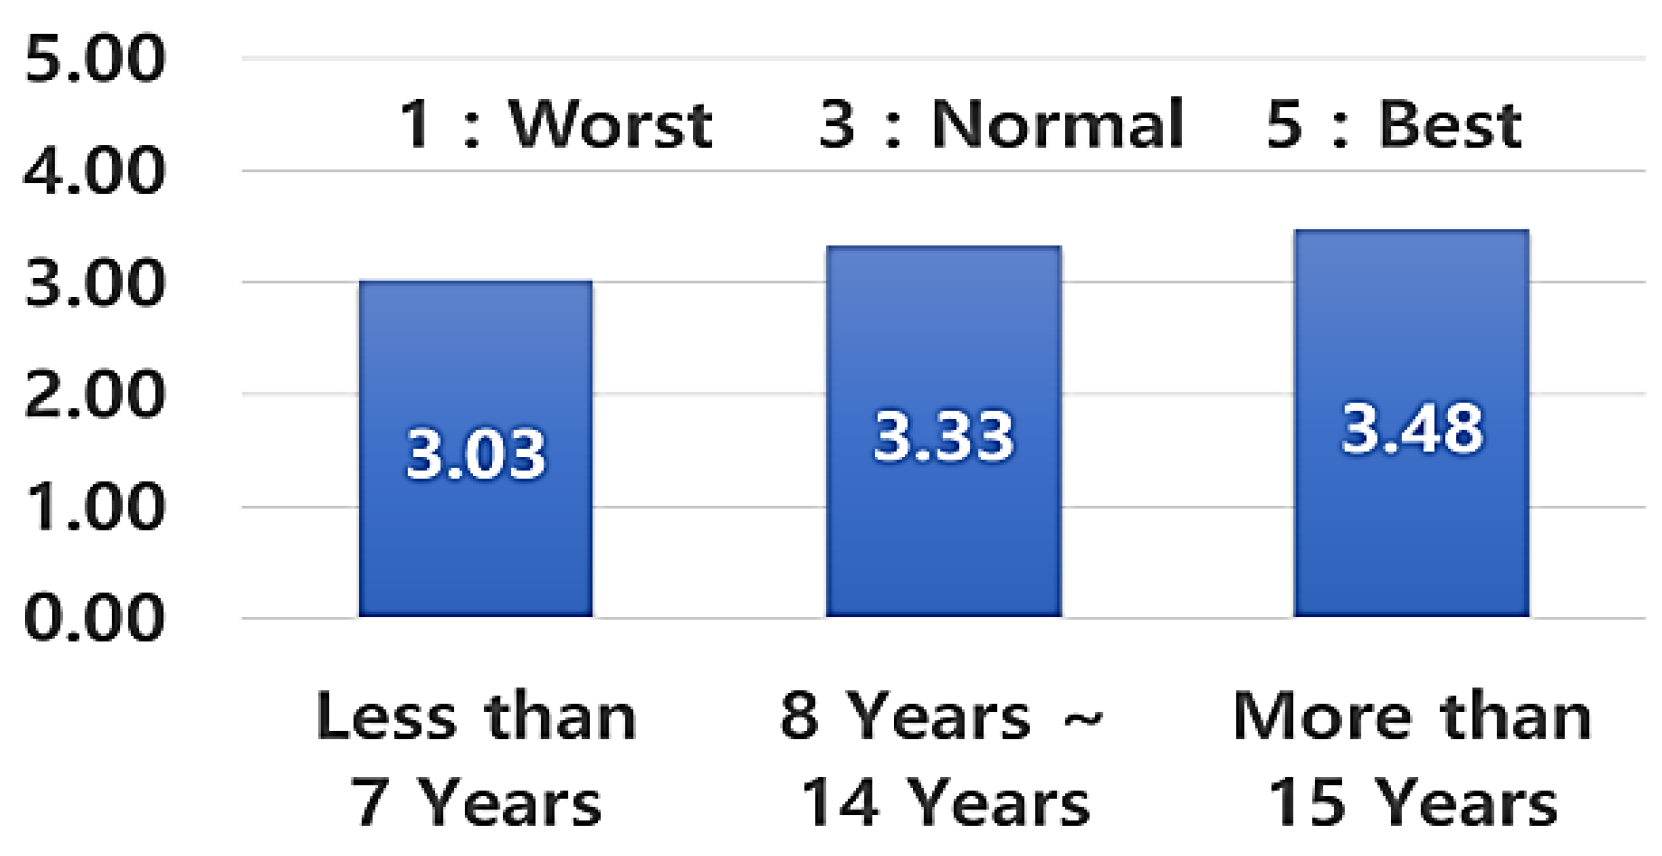
- EVENT
As a result of the analysis on understanding of terminologies in the GPS plotter’s EVENT functions based on users’ GPS usage experience (Figure A3), no significant difference was found between groups (p > 0.05).
Figure A3.
Users’ understanding on the term ‘EVENT’ based on experience of GPS plotter usage. Average (1: Worst to 5: Best).
Figure A3.
Users’ understanding on the term ‘EVENT’ based on experience of GPS plotter usage. Average (1: Worst to 5: Best).

- (ii)
- CNT–CENTER
As a result of the analysis on understanding of terminologies in the GPS plotter’s CENTER function based on users’ GPS usage experience, differences were found between the group with 8 to 14 years of experience and the group with over 15 years of experience (p < 0.5). Those with more experience show a higher level of comprehension on terminologies related to CNT (Figure A4).
Figure A4.
Users’ understanding on the term ‘CNT’ by experience of GPS plotter usage. Average (1: Worst to 5: Best).
Figure A4.
Users’ understanding on the term ‘CNT’ by experience of GPS plotter usage. Average (1: Worst to 5: Best).

- (iii)
- WPT–WAY POINT
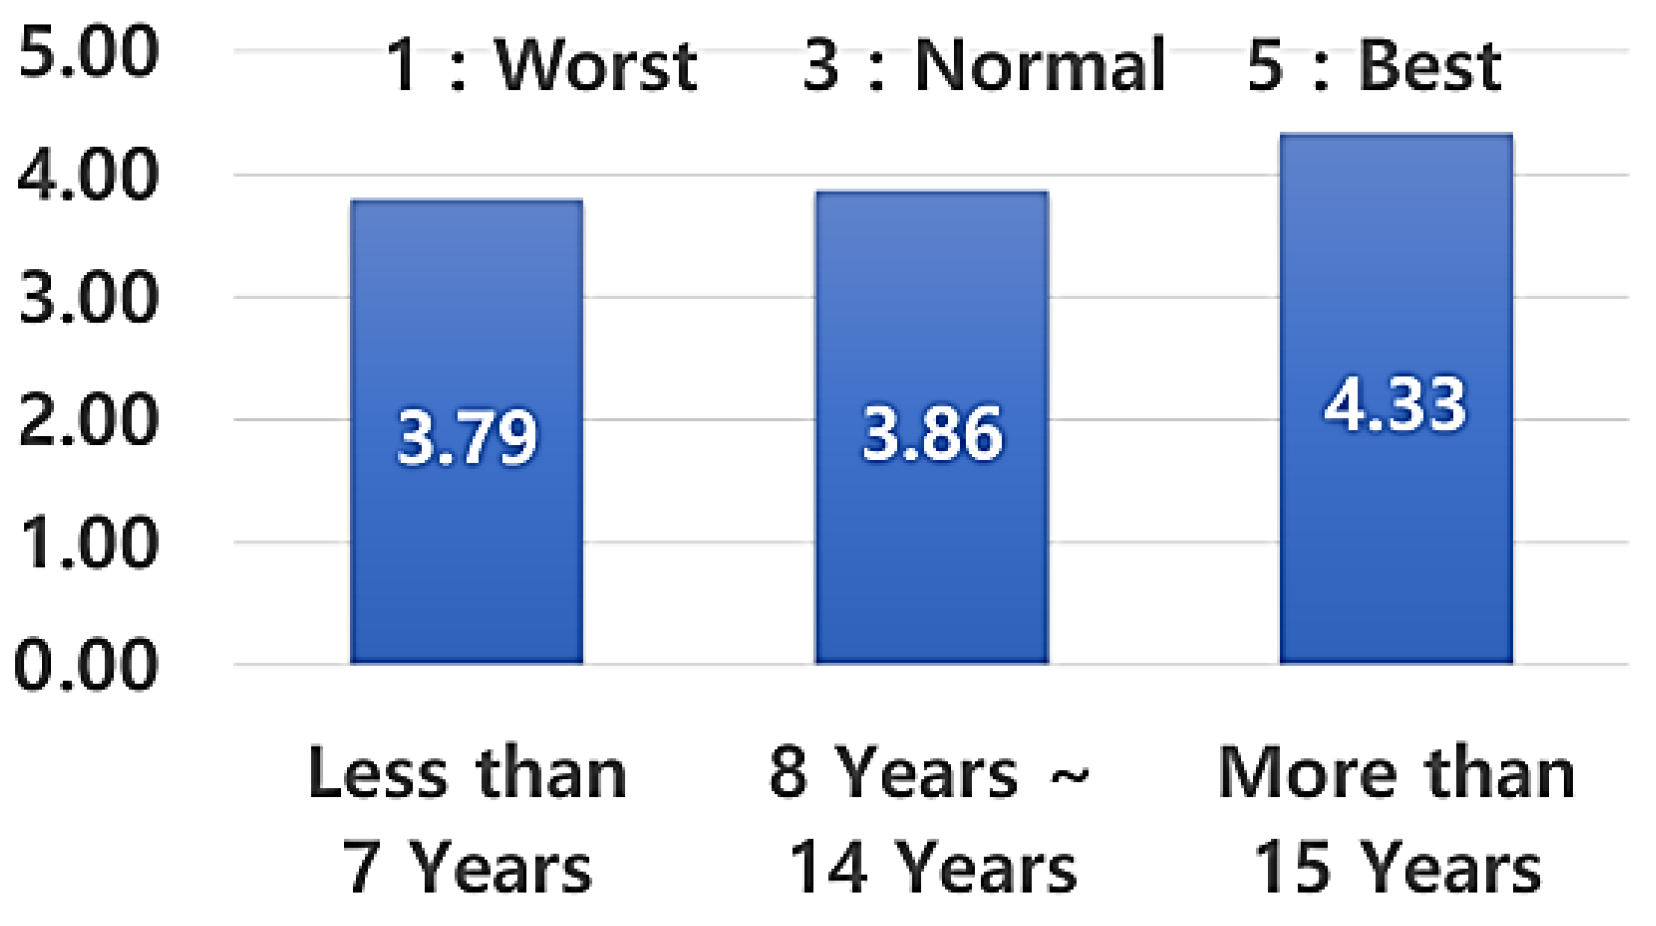
As a result of the analysis on understanding of terminologies in the GPS plotter’s WAY POINT function based on users’ GPS usage experience, differences were found between the group with less than 7 years of experience and the group with more than 15 years of experience (p < 0.05).
As for the GPS plotter WAY POINT function that is currently being used, those with more than 15 years of experience in using the GPS plotter tend to indicate that it is easy to understand; however, those with less than 7 years of experience in using the GPS plotter tend to indicate that it is difficult to understand. Their responding tendency of difficulty was relatively higher than the group with more experience (Figure A5).
Figure A5.
Users’ understanding on the term ‘WPT’ by experience of GPS plotter usage. Average (1: Worst to 5: Best).
Figure A5.
Users’ understanding on the term ‘WPT’ by experience of GPS plotter usage. Average (1: Worst to 5: Best).

- (iv)
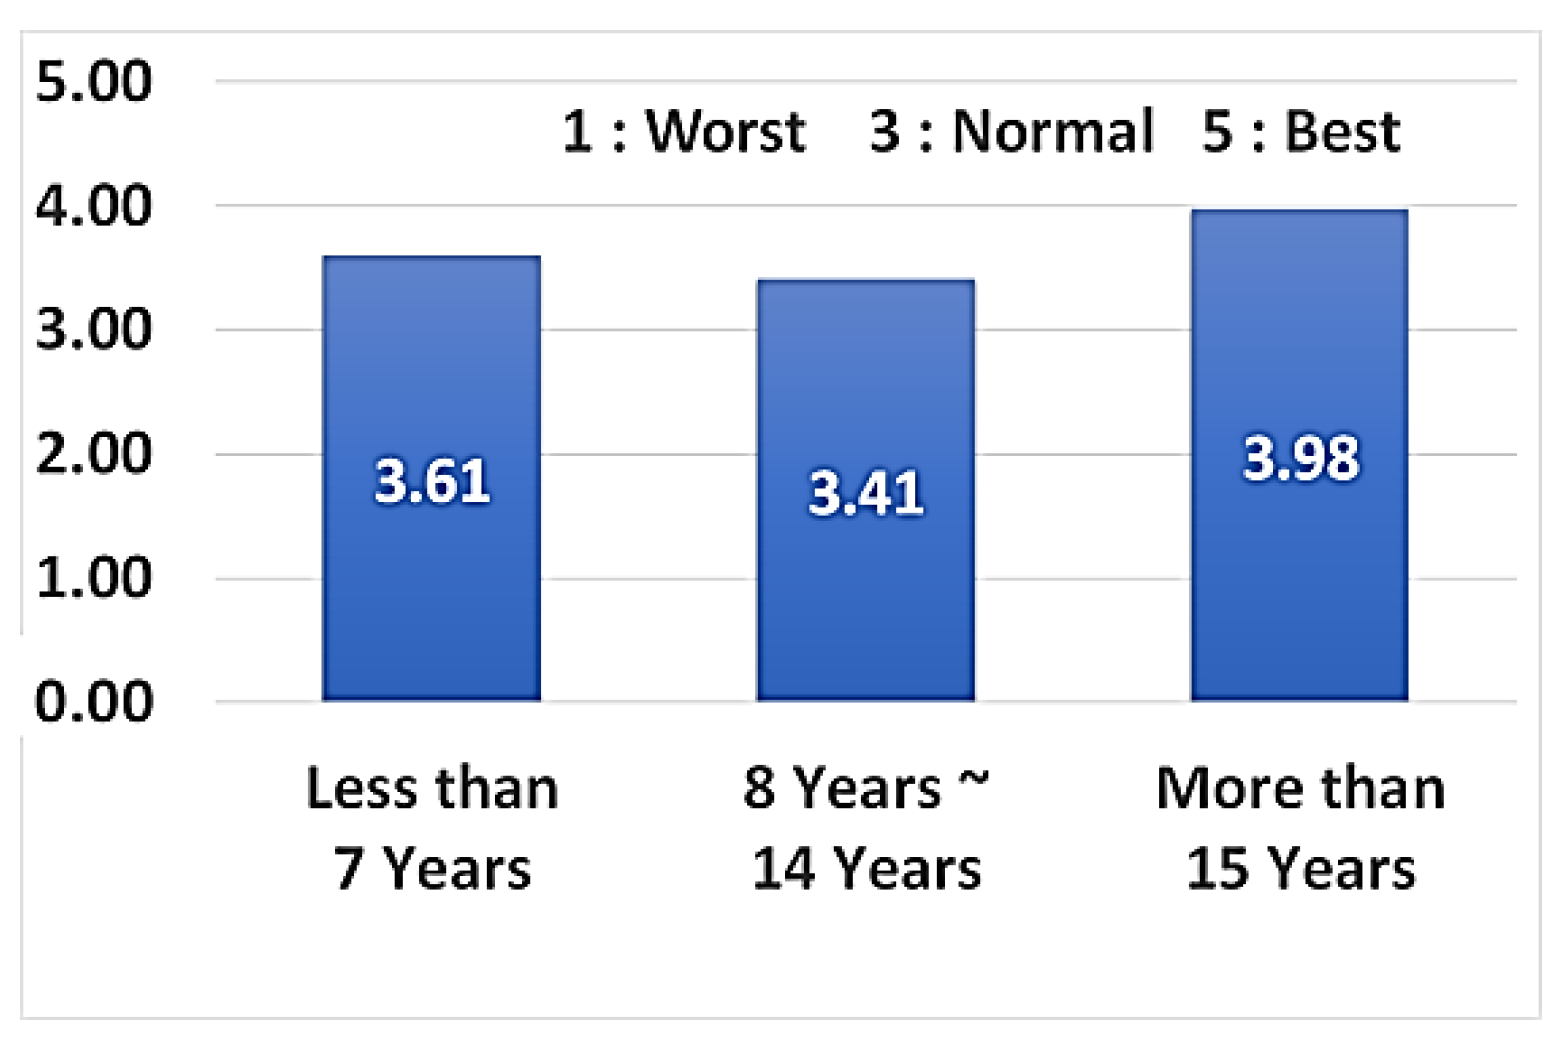
- MENU
As a result of the analysis on the understanding of terminologies in the GPS plotter’s MENU function based on users’ GPS usage experience (Figure A6), no difference was found between the groups (p > 0.05).
Figure A6.
Users’ understanding of the term ‘MENU’ by experience of GPS plotter usage. Average (1: Worst to 5: Best).
Figure A6.
Users’ understanding of the term ‘MENU’ by experience of GPS plotter usage. Average (1: Worst to 5: Best).

- (v)
- TRACK
As a result of the analysis on understanding of terminologies in the GPS plotter’s TRACK function based on users’ GPS usage experience, differences were found between the group with less than 7 years of experience and the group with more than 15 years of experience (p < 0.05).
As for the GPS plotter TRACK function that is currently being used, those with more than 15 years of experience in using the GPS plotter tend to indicate that it is easy to understand; however, those with less than 7 years of experience in using the GPS plotter tend to indicate that it is difficult to understand (Figure A7).
Figure A7.
(a) Users’ understanding of the term ‘MENU’ by experience of GPS plotter usage. Average (1: Worst to 5: Best); (b) distribution of respondents (percentage).
Figure A7.
(a) Users’ understanding of the term ‘MENU’ by experience of GPS plotter usage. Average (1: Worst to 5: Best); (b) distribution of respondents (percentage).

- (vi)
- MARK
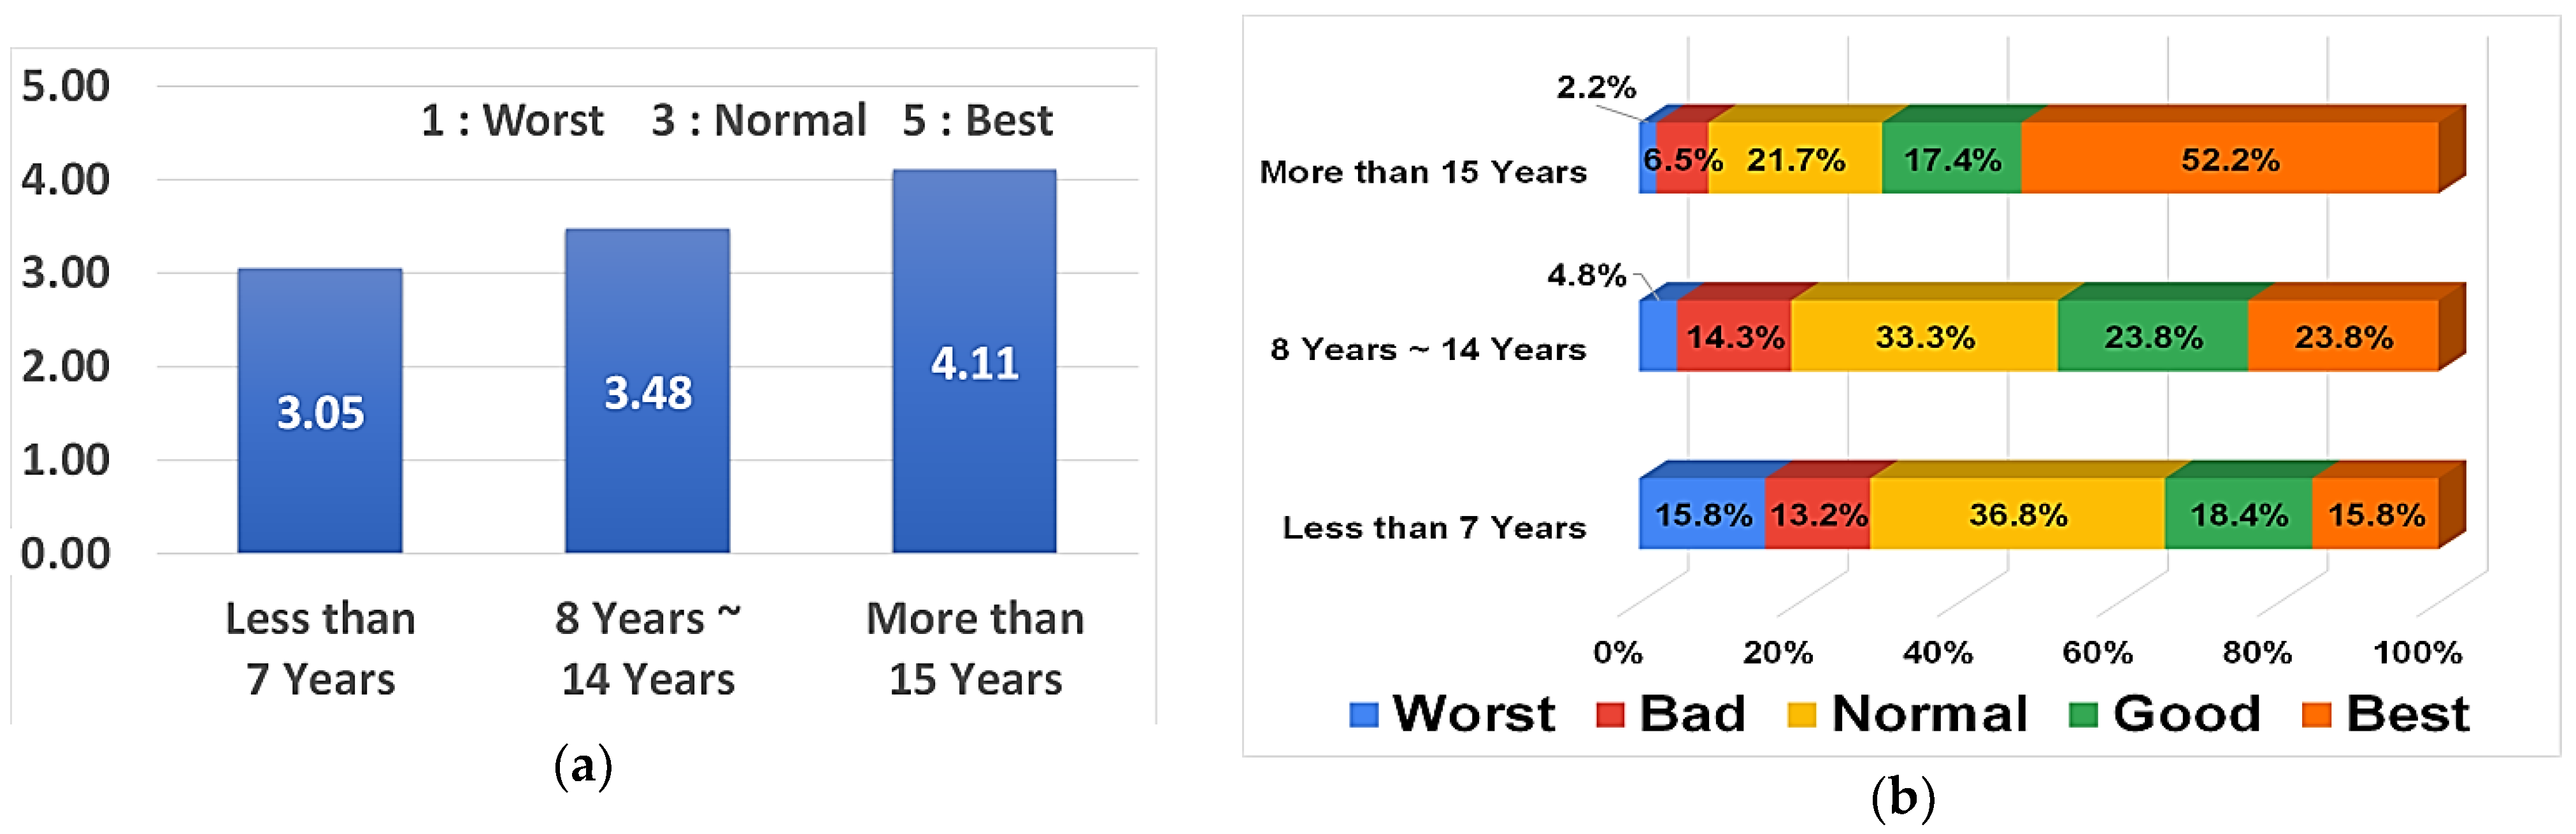
As a result of the analysis on the understanding of terminologies in the GPS plotter’s MARK function based on users’ GPS usage experience, differences were found between the group with less than 7 years of experience, the group with 8 to 14 years of experience, and the group with more than 15 years of experience (p > 0.05).
As for the MARK functions, those with more than 15 years of experience in using the GPS plotter were of the opinion that it is easy to understand it in general; however, for those with 8 to 14 years of experience and those with less than 7 years of experience, a higher rate of respondents indicated that it is difficult to understand (Figure A8).
Figure A8.
(a) Users’ understanding of the term ‘MARK’ by experience of GPS plotter usage. Average (1: Worst to 5: Best); (b) distribution of respondents (percentage).
Figure A8.
(a) Users’ understanding of the term ‘MARK’ by experience of GPS plotter usage. Average (1: Worst to 5: Best); (b) distribution of respondents (percentage).

- (vii)
- ENT–ENTER
As a result of the analysis on understanding the terminologies in the GPS plotter’s ENTER function, differences were found between the group with less than 7 years of experience and the group with more than 15 years of experience (p < 0.05). As for the ENTER functions, those with more than 15 years of experience in using the GPS plotter expressed that it is easy to understand in general; however, for those with less than 7 years of experience, a higher rate of respondents expressed that it is difficult to understand (Figure A9).
Figure A9.
(a) Users’ understanding of the term ‘ENT’ by experience of GPS plotter usage. Average (1: Worst to 5: Best); (b) distribution of respondents (percentage).
Figure A9.
(a) Users’ understanding of the term ‘ENT’ by experience of GPS plotter usage. Average (1: Worst to 5: Best); (b) distribution of respondents (percentage).

Frequently Used Functions
Users were asked five-point scale questions regarding the functions frequently used when using GPS plotters. They were asked to assign 5 points for a function that was frequently used and 1 point for a function that was rarely used (Figure A10). The results indicated that the day/night mode changes and the route indication settings were the most frequently used functions.
Figure A10.
Frequency of use of GPS plotters functions. Average (1: Worst to 5: Best).

User Requirements for Improving the GPS Plotter Interface
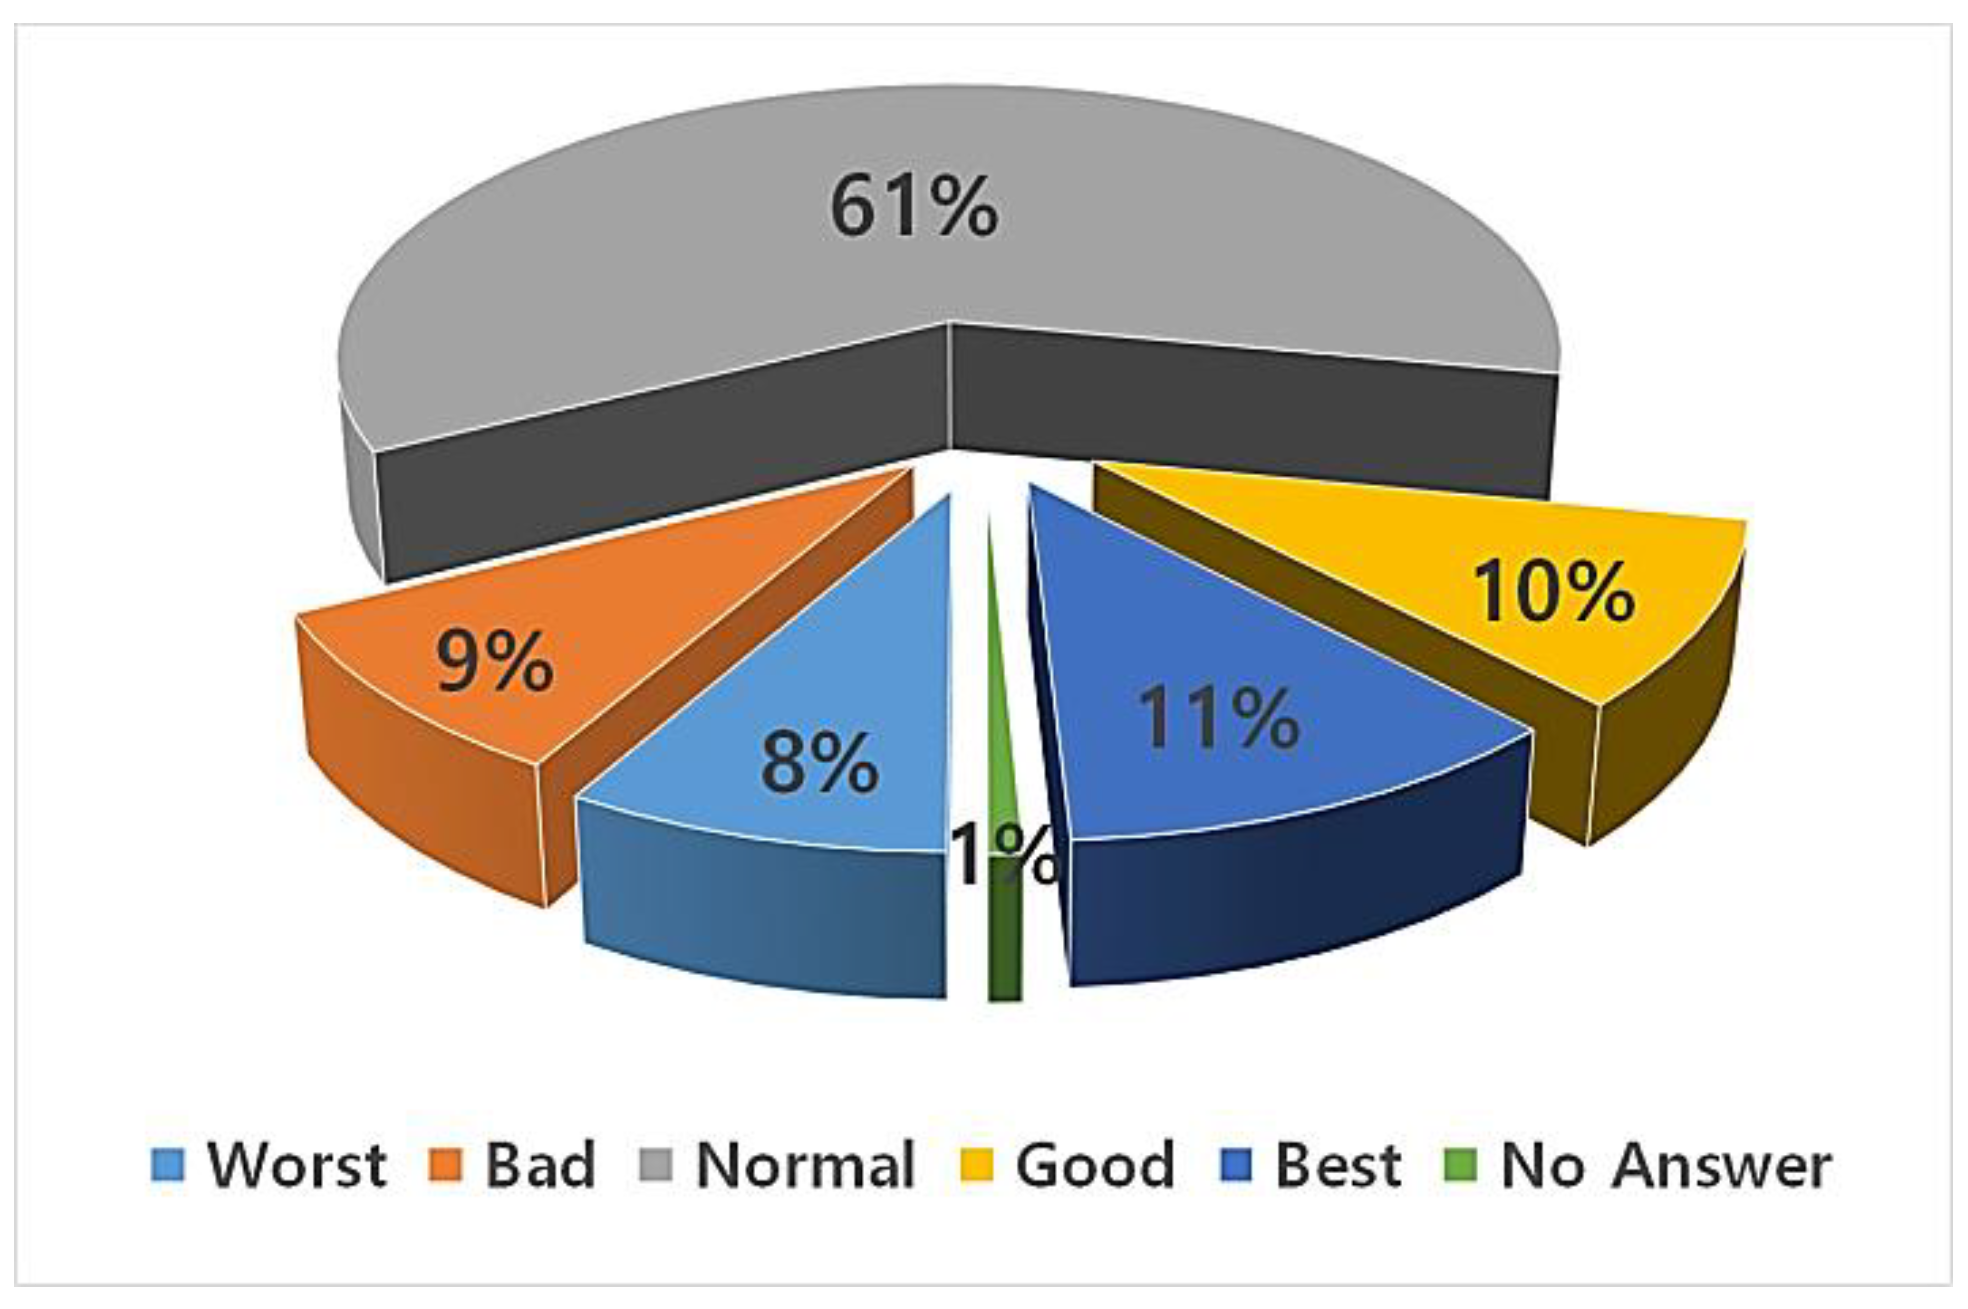
More than 82% of respondents answered that the screen size is either normal or better than normal, which indicates that the screen size is appropriate (Figure A11).
Figure A11.
User preference for GPS plotter display size.

In addition, with regard to subjective responses to various functions of the GPS plotter, it was found that some users were not fully aware of all the functions provided. Some respondents requested that specific functions should be added such as anchor watch functions when the vessel is at anchor, a distance measuring function that can measure the distance from their vessel to the object, and a navigational function that displays the estimated time of arrival.
Appendix B
Appendix B.1. Brief of User Test
Appendix B.1.1. Introduction of User Test
- (1)
- Test participants: three captains and two first officers, a total of five individuals, all with more than 10 years of experience in using a GPS plotter participated in the experiment.
- (2)
- Test scenario: vessel’s navigation from Busan Port to Ulsan Port.
- (3)
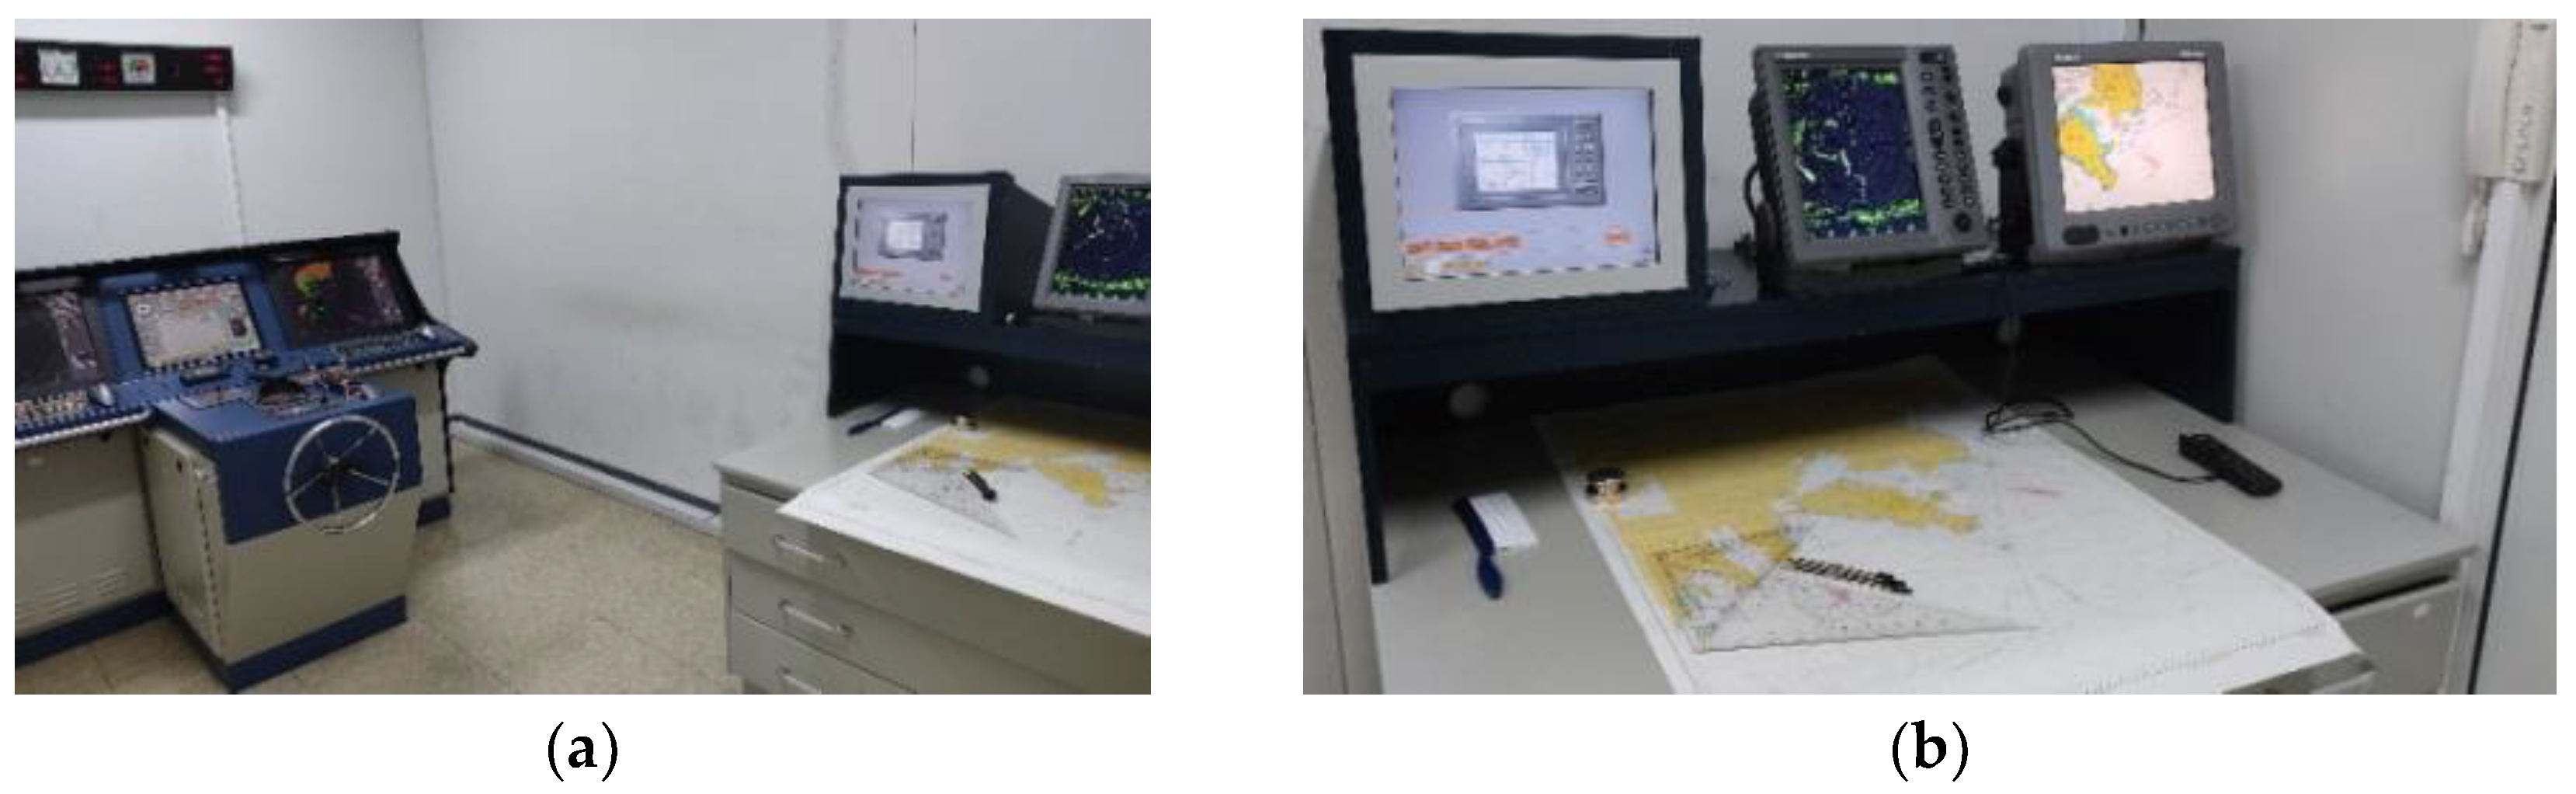
- Tested Equipment: The GPS plotter installed in the ship-handling simulator was used (Figure A12). This GPS plotter type was a model approved by the Ministry of Oceans and Fisheries and was the same model that the previous user survey was based on. The equipment was operated by remote control.
- (4)
- A preliminary simulation was conducted to familiarize users to the equipment.
- (5)
- Navigational tasks for the test: 10 frequently used navigational functions.
- (6)
- A fill-out questionnaire was provided, and an interview session was conducted for all participants (Figure A13).
Appendix B.1.2. Experimental Method
- (1)
- To measure the usability of a function, the time spent on performing a task by a user was measured (Figure A14).
- (2)
- The number of key strokes/clicks was measured to evaluate task performance.
- (3)
- An interview was conducted with regard to standardization requirements of the terms of the information displayed on the GPS plotter screen and the navigational functions.
Figure A12.
(a) Ship-handling simulator; (b) a chart table equipped with GPS plotter.

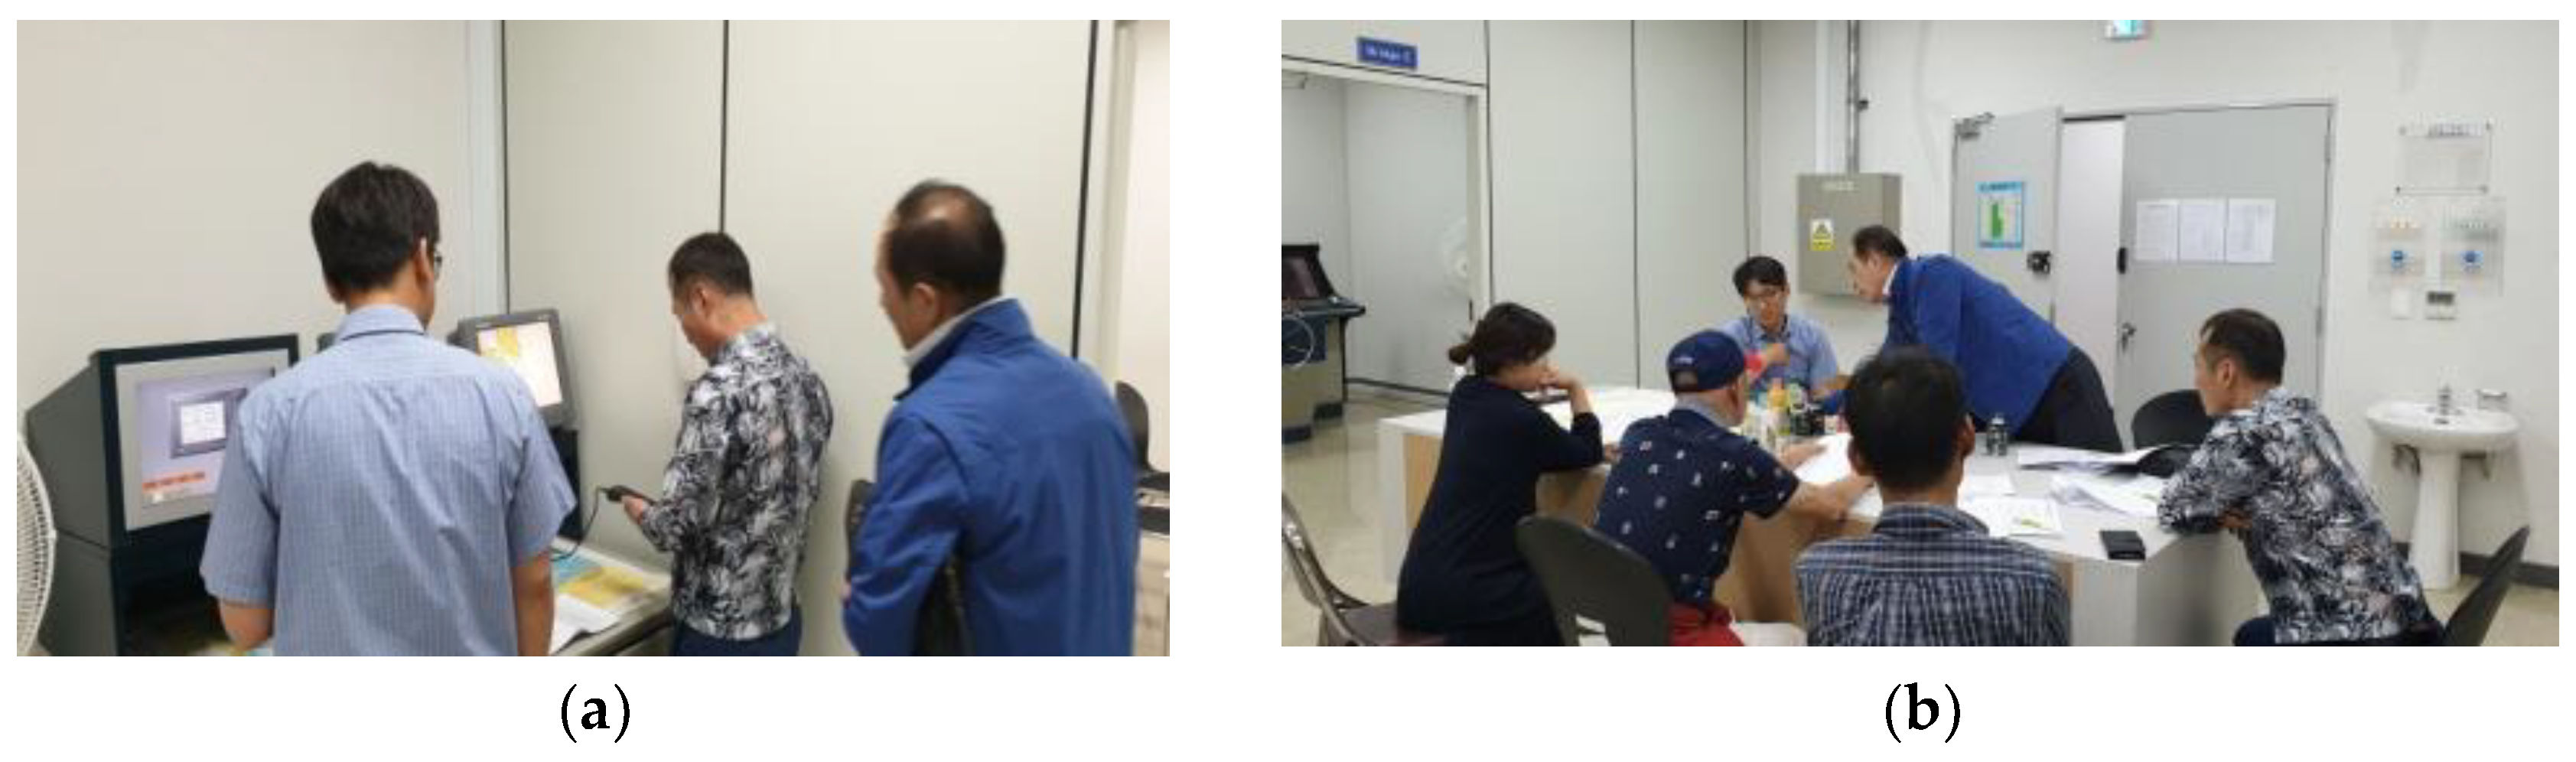
Figure A13.
(a) User test; (b) discussion after the test.

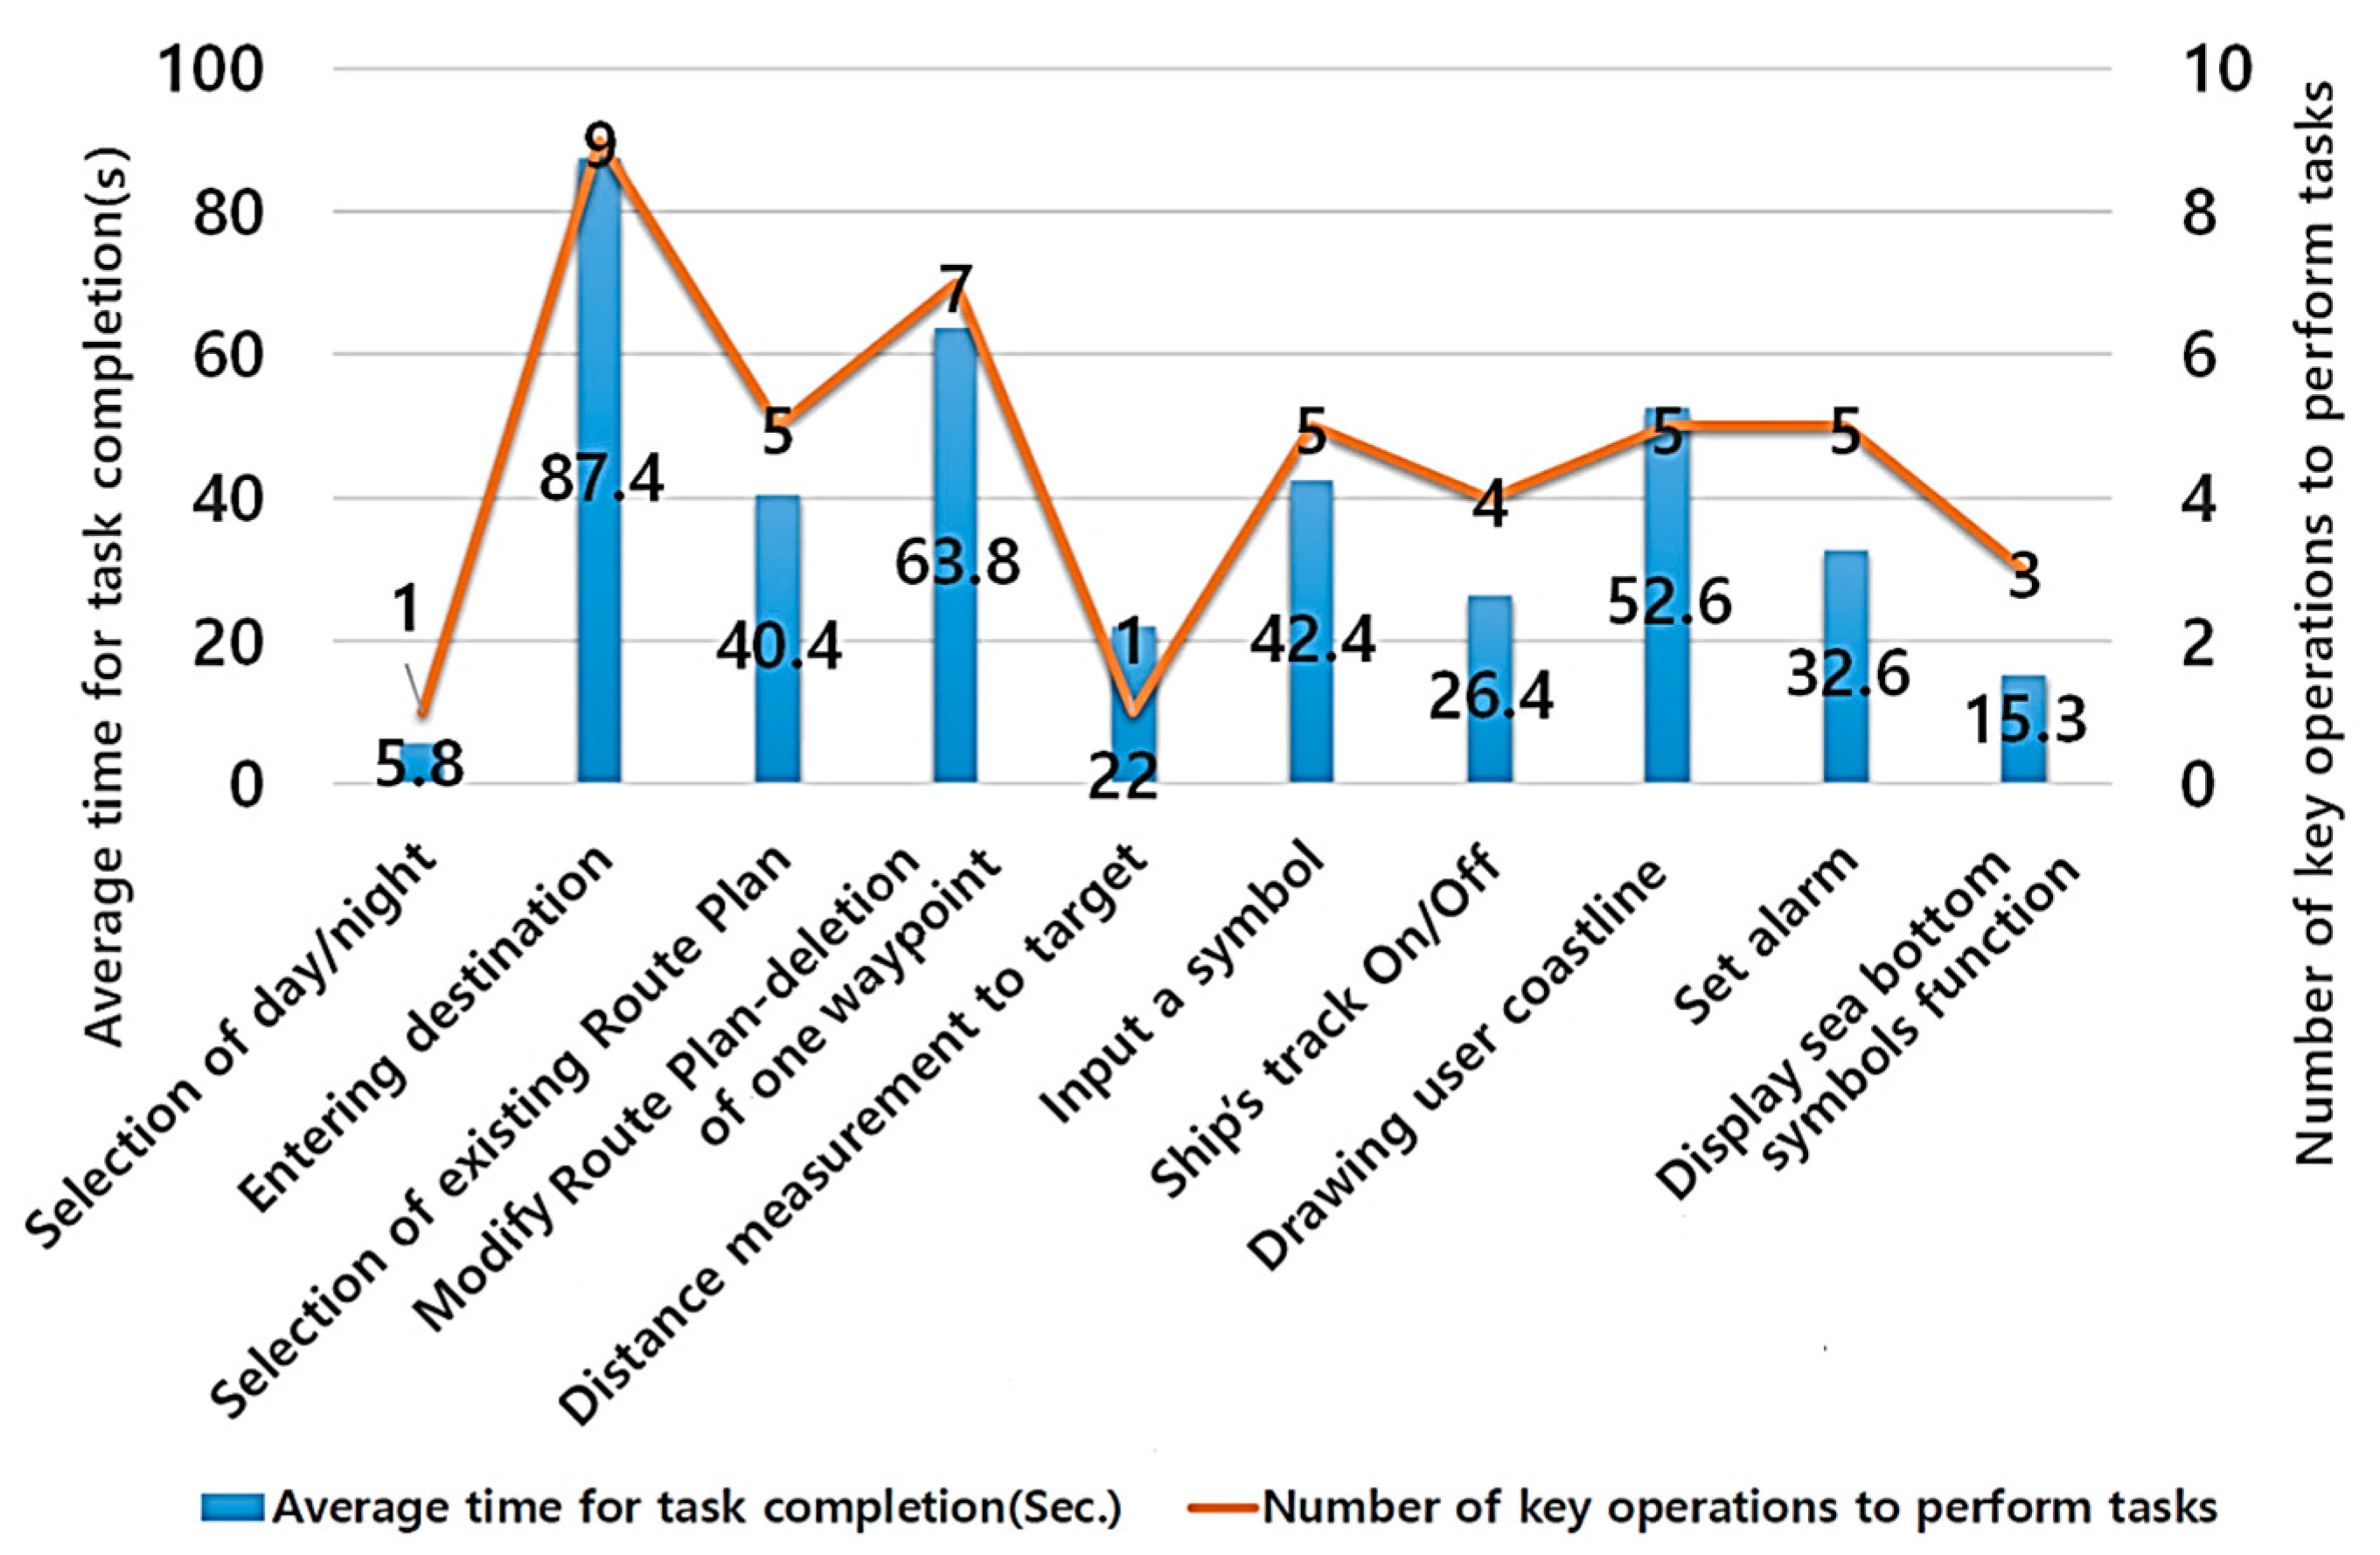
Figure A14.
Result of user testing on performance of each task.

Appendix B.2. Key Outcomes
Through a simulation test with five participants, the time required to perform 10 tasks and the number of function key strokes/clicks were measured and recorded (Figure A14).
After the scenario was complete, interviews were conducted with the participants. Participants said that they felt difficulties when modifying the route, drawing user shore lines that involved the handling of a variety of functional keys, or finding the menu for specific tasks, which takes a certain time. In addition, items that must be displayed on the GPS plotter screen were identified, as shown in Table 5.
The participants discussed the menu name of the GPS plotter interface and gave particular attention to frequently used functions, which they hoped they could apply standard icons or standard terminology in their own language to, so that navigators could intuitively recognize them, thereby improving usability.
References
- Zalewski, P. A Critical Analysis of IMO S-Mode Guidelines. Trans. Nav. Int. J. Mar. Navig. Saf. Sea Transp. 2019, 13, 841–846. [Google Scholar] [CrossRef]
- International Maritime Organization. MSC.466 (101), Amendments to the Performance Standards for the Presentation of Navigation-related Information on Shipborne Navigational Displays; IMO: London, UK, 2000. [Google Scholar]
- Jung, M.; Lee, S.J. UI standard for navigation system. Sea Technol. 2020, 50–55. Available online: https://lsc-pagepro.mydigitalpublication.com/publication/?m=60787&i=686620&p=24 (accessed on 15 December 2020).
- Patriko, D.; Doherty, R.; Lemon, N.; Vu, V.D.; Lee, S.; Lutzhoft, M. Getting to S-Mode. Seaw. Int. J. Naut. Inst. 2019, 6–12. [Google Scholar]
- International Maritime Organization. MSC.1/Circ.1609 Guidelines for the Standardization of User Interface Design for Navigation Equipment; IMO: London, UK, 2019. [Google Scholar]
- Liu, Q.; Zhang, Y.L. Development and Application of Electronic Chart System in Ocean Navigation. Adv. Mater. Res. 2014, 875, 1972–1975. [Google Scholar] [CrossRef]
- Jung, M.; Park, Y.S.; Kang, S.Y. Analysis of User Requirement for the Improvement of ECDIS to Enhance Navigational Safety and Work Efficiency. J. Navig. Port Res. 2015, 39, 141–147. [Google Scholar] [CrossRef]
- Jung, M.; Chae, B.G.; Ahn, Y.J. User Requirement Analysis of ECDIS for the Development on S-Mode Guideline. J. Navig. Port Res. 2016, 40, 89–95. [Google Scholar] [CrossRef]
- Car, M.; Brčić, B.; Žuškin, S.; Svilicic, B. The Navigator’s Aspect of PNC before and after ECDIS Implementation: Facts and Potential Implications towards Navigation Safety Improvement. J. Mar. Sci. Eng. 2020, 8, 842. [Google Scholar] [CrossRef]
- Bakalar, G.; Baggini, M.B. Bridge Officers’ Operational Experiences with Electronic Chart Display and Information Systems on Ships. J. Marit. Trans. Sci. 2016, 52, 49–61. [Google Scholar] [CrossRef]
- Lee, B.K. Usability Test and Investigation of Improvements of the ECDIS. J. Korean Soc. Mar. Environ. 2018, 24, 146–156. [Google Scholar] [CrossRef]
- Arslan, O.; Atik, O.; Kahraman, S. Eye tracking in usability of electronic chart display and information system. J. Navig. 2020, 1–11. [Google Scholar] [CrossRef]
- Hareide, O.S.; Ostnes, R. Maritime usability study by analysing eye tracking data. J. Navig. 2017, 70, 927–943. [Google Scholar] [CrossRef] [Green Version]
- Bjørneseth, F.B.; Clarke, L.; Dunlop, M.; Komandur, S. Towards an Understanding of Operator Focus Using Eye-Tracking in Safety-Criticalmaritime Settings. Proc. Int. Conf. Hum. Factors Ship Des. Oper. 2014. Available online: http://citeseerx.ist.psu.edu/viewdoc/download?doi=10.1.1.639.8311&rep=rep1&type=pdf (accessed on 12 November 2020).
- Žagar, D.; Svetina, M.; Košir, A.; Dimc, F. Human Factor in Navigation: Overview of Cognitive Load Measurement during Simulated Navigational Tasks. J. Mar. Sci. Eng. 2020, 8, 775. [Google Scholar] [CrossRef]
- Jung, J.E.; Jung, M.; Jeon, J.H.; Jeon, G.J.; Lee, S.J. Development and User Test of Standard Navigational Tasks to Improve User Interface of Navigational Equipment. J. Digit. Contents Soc. 2018, 19, 1981–1988. [Google Scholar] [CrossRef]
- Jung, J.E.; Jung, M.; Lee, S.J. Eye Gaze Analysis of Ferry Navigators for Improving Usability of Navigational Equipment. J. Digit. Contents Soc. 2018, 19, 2211–2217. [Google Scholar] [CrossRef]
- Gisela, M.; Jung, D.; Martin, M. Research-Based Design and Usability Guidelines for Electronic Charting Systems (ECS) in Yachting and Boating. Int. J. Navig. Marit. Econ. 2018, 10. Available online: https://www.researchgate.net/profile/Gisela_Mueller-Plath/publication/331559553_Research-Based_Design_and_Usability_Guidelines_for_Electronic_Charting_Systems_ECS_in_Yachting_and_Boating/links/5c804ab292851c69505c69c9/Research-Based-Design-and-Usability-Guidelines-for-Electronic-Charting-Systems-ECS-in-Yachting-and-Boating.pdf (accessed on 17 November 2020).
- Kim, D.H. Speed Limit Violation Warning Function in Trade Ports and Fairways—GPS Plotter and ECDIS Enhancements. J. Korean Soc. Mar. Environ. 2019, 25, 841–850. [Google Scholar] [CrossRef]
- Kim, H.Y.; Yoo, Y.H. A Study on the Problems and Improvement of GPS Plotter Usage for Coastal Ships through the Analysis of Marine Accident. J. Korean Soc. Mar. Environ. 2014, 4, 21–42. [Google Scholar]
- An, K. E-navigation Services for Non-SOLAS Ships. Int. J. Navig. Marit. Econ. 2016, 4, 13–22. [Google Scholar] [CrossRef] [Green Version]
- Saitoh, Y.; Wada, M. A development of GIS plotter for small fishing vessels running on common Linux. In Proceedings of the 3rd International Conference on Computer Research and Development, Shanghai, China, 11–13 March 2011; pp. 107–111. [Google Scholar] [CrossRef]
- Ministry of Oceans and Fisheries. Legislative Notice (2020–1085). 2020. Available online: https://www.mof.go.kr/iframe/article/view.do?articleKey=34914&boardKey=36&menuKey=333¤tPageNo=1 (accessed on 17 November 2020).
- IMO. SN.1/Circ.243/Rev.2 Guidelines for the Presentation of Navigation-Related Symbols, Terms and Abbreviations. 2019, pp. 1–33. Available online: https://iho.int/uploads/user/About%20IHO/International_Organisations/ECDIS-ENC/English/SN_Circ243-Rev.2%20-%20Guidelines%20For%20The%20Presentation%20Of%20Navigation-Related%20Symbols%20Terms%20And%20Abbreviations.pdf (accessed on 17 November 2020).
- Ministry of Oceans and Fisheries. Standards for Type Approval Tests and Inspections for Marine Products, Legal Information Center. 2019. Available online: http://www.law.go.kr/admRulSc.do?tabMenuId=tab107&query=%EC%84%A0%EB%B0%95%EC%9A%A9#liBgcolor1 (accessed on 17 November 2020).
- Samyung ENC. GPS plotter_manual_NAVIS 3800. 2019. Available online: http://www.samyungenc.com (accessed on 17 November 2020).
- ICT Standardization Committee. The Usability Evaluation Performing Method based on User Experience; Technical Report TTAR-10.0099; 2018; pp. 18–22. Available online: https://committee.tta.or.kr/data/standard_view.jsp?order=t.standard_no&by=asc&nowPage=10&pk_num=TTAR-10.0099&commit_code=PG415 (accessed on 10 November 2020).
- IMO. MSC.1/Circular.1512 Guideline on Software Quality Assurance and Human Centred Design for E-navigation. 2015. Available online: https://www.imorules.com/MSCCIRC_1512.html (accessed on 10 November 2020).
- Lützhöft, M.H.; Dekker, S.W.A. On your watch: Automation on the bridge. J. Navig. 2002, 55, 83–96. [Google Scholar] [CrossRef] [Green Version]
- Mallam, S.C.; Lundh, M.; MacKinnon, S.N. Evaluating a digital ship design tool prototype: Designers’ perceptions of novel ergonomics software. Appl. Ergon. 2017, 59, 19–26. [Google Scholar] [CrossRef]
- International Chamber of Shipping. Bridge Procedures Guide, 5th ed.; Marisec: London, UK, 2016; pp. 58–119. [Google Scholar]
- Kim, M.S.; Shin, H.O.; Lee, J.H.; Hwang, B.K. Characteristics of bridge task in Korean coastal large trawler. J. Korean Soc. Fish Technol. 2013, 49, 301–310. [Google Scholar] [CrossRef] [Green Version]
Figure 1.
Standard display of model B.

Figure 2.
(a) An icon for hot keys (zoomed in); (b) an icon for shortcut (Route plan) [5].
Figure 2.
(a) An icon for hot keys (zoomed in); (b) an icon for shortcut (Route plan) [5].

Figure 3.
Concept of the methodology.

Figure 4.
(a) Rank of the respondents; (b) average years of GPS plotters use.

Figure 5.
(a) Respondents composition based on their experience of GPS plotters; (b) their preference on applying standard icons on the menu.
Figure 5.
(a) Respondents composition based on their experience of GPS plotters; (b) their preference on applying standard icons on the menu.

Table 1.
Items of the user survey on the global positioning system (GPS) plotter.
| Contents of the IMO Guidelines | Items on the Guideline | GPS Plotter Items | |||
|---|---|---|---|---|---|
| Matching | Ratio (%) | ||||
| Icons and Terminology for Functions | Hot Key | General Navigation Functions | 40 | 11 | 27.5 |
| Control of Chart Display Functions | 42 | 7 | 16.6 | ||
| Control of Chart Functionality | 4 | 1 | 25 | ||
| Database Functions | 7 | 1 | 14.3 | ||
| Route Plan and Monitoring Functions | 3 | 2 | 66.7 | ||
| Shortcuts | Groups of Functions | 10 | 3 | 30 | |
| Total | 106 | 25 | 23.6 | ||
Table 2.
Items of user survey on GPS plotter.
| No. | Contents |
|---|---|
| 1 | The need to apply standardized icons; if not, why? |
| 2 | Understanding of navigation-related terms and abbreviations (7 items) |
| 3 | Users’ preference for applying icons to navigational functions |
| 4 | Preference for GPS plotter display size |
| 5 | Frequency of use of navigational functions (25 items) |
| 6 | Additional usage of functions except the aforementioned list |
Table 3.
User survey results on the frequency of use for GPS-plotter functions.
| Functions | Frequency of Use | Functions | Frequency of Use | ||
|---|---|---|---|---|---|
| Point | Ratio (%) | Point | Ratio (%) | ||
| Selection of Day/Night Mode | 4.00 | 80.0 | System Set | 3.16 | 63.2 |
| Route Display On/Off | 4.00 | 80.0 | Mark Clear | 3.14 | 62.8 |
| Track On/Off | 3.58 | 71.6 | Chart Set | 3.14 | 62.8 |
| Distance Measure | 3.48 | 69.6 | Mark Color Select | 3.12 | 62.4 |
| Mark Input | 3.46 | 69.2 | Mark Save/Load/Erase | 3.07 | 61.4 |
| Waypoint List Save/Load/Erase | 3.41 | 68.2 | Route Edit | 2.87 | 57.4 |
| Track Save/Load/Erase | 3.38 | 67.6 | Mark Number Display | 2.79 | 55.8 |
| Other Ship’s Position Measure | 3.33 | 66.6 | Coastal Line Save/Load/Erase | 2.78 | 55.6 |
| Track Clear | 3.27 | 65.4 | Route On, Save | 2.78 | 55.6 |
| Mark Select | 3.24 | 64.8 | Track Line Shape | 2.72 | 54.4 |
| User Coast Line On/Off | 3.24 | 64.8 | Chart Information | 2.69 | 53.8 |
| Track Line Color | 3.20 | 64.0 | Coastal Line Drawing | 2.66 | 53.2 |
| Alarm Set | 3.16 | 63.2 | - | - | - |
Table 4.
Characteristics of the respondents.
| Navigational Rank | Captain | Officers | Land Official | Others | Total | |
|---|---|---|---|---|---|---|
| Senior | Junior | |||||
| 63/47.7% | 37/28.0% | 10/7.6% | 13/9.8% | 9/6.8% | 132/100% | |
| Type of Vessel | Coastal Fishing Boats | Ocean Fishing Boats | Cargo Ships | Passenger Ships | Others | Total |
| 35/26.5% | 10/7.6% | 49/37.1% | 9/6.8% | 29/22.0% | 132/100% | |
| Size of Vessel Gross Tonnage (GT) | Less than 25 GT | 25~200 GT | 200~1600 GT | 1600 GT~3000 GT | No Answer | Total |
| 35/26.5% | 46/34.8% | 1/0.8% | 40/30.3% | 10/7.6% | 132/100% | |
| Sea experience (in years) | Less than 5 Years | 6~10 Years | 11~14 Years | Over than 15 Years | No Answer | Total |
| 24/18.2% | 22/16.7% | 15/11.4% | 58/43.9% | 13/9.8% | 132/100% | |
| Years of GPS-Plotter Use | Less than 7 years | 8–14 year | More than 15 years | No Answer | Total | |
| 40/30.3% | 22/16.7% | 46/34.8% | 24/18.2% | 132/100% | ||
| Manufacturer GPS Plotter Used (Only 56 people answered) | Company A | Company B | Company C | ETC | Total | |
| 43/76.8% | 5/8.9% | 4/7.1% | 4/7.2% | 56/100% | ||
Table 5.
Overall results of the user survey on the preference of icon application and understanding of navigational terms on the GPS plotter.
Table 5.
Overall results of the user survey on the preference of icon application and understanding of navigational terms on the GPS plotter.
| Contents | Answer | ||||||
| Worst Number/ Ratio | Bad Number/ Ratio | Normal Number/ Ratio | Good Number/ Ratio | Best Number/ Ratio | No Answer Number/ Ratio | ||
| Need to apply standard icons on functions | 3/2.3% | 2/1.5% | 50/37.9% | 15/11.4% | 58/43.9% | 4/3.0% | |
| Understanding of navigation-related terms and abbreviations | EVENT | 14/10.6% | 14/10.6% | 60/45.5% | 12/9.1% | 28/21.2% | 4/3.0% |
| CTR (Center) | 4/3.0% | 10/7.6% | 58/43.9% | 15/11.4% | 41/31.1% | 4/3.0% | |
| WPT (Way Point) | 5/3.8% | 13/9.8% | 39/29.5% | 21/15.9% | 47/35.6% | 7/5.3% | |
| MENU | 3/2.3% | 12/9.1% | 49/37.1% | 23/17.4% | 43/32.6% | 2/1.5% | |
| TRACK | 4/3.0% | 11/8.3% | 46/34.8% | 30/22.7% | 39/29.5% | 2/1.5% | |
| MARK | 8/6.1% | 19/14.4% | 43/32.6% | 23/17.4% | 37/28.0% | 2/1.5% | |
| ENT (Enter) | 12/9.1% | 12/9.1% | 44/33.3% | 24/18.2% | 37/28.0% | 3/2.3% | |
| Preference for GPS plotter display size | 11/8.3% | 12/9.1% | 80/60.6% | 13/9.8% | 15/11.4% | 1/0.8% | |
| Preference for using icon or menu | Answer | ||||||
| Icons Number/ Ratio | Number/ Ratio | Middle Number/ Ratio | Number/ Ratio | Menu Name Number/ Ratio | No Answer Number/ Ratio | ||
| Preference to apply function key for icons (  ) or menu names ) or menu names(  ) ) | 31/23.5% | 6/4.5% | 26/19.7% | 6/4.5% | 57/43.2% | 6/4.5% | |
Table 6.
Analysis of understanding of navigational terms according to user experience with GPS plotters.
Table 6.
Analysis of understanding of navigational terms according to user experience with GPS plotters.
| Average (1: Low to 5: High) | Classification of Respondent Groups by Experience with GPS Plotters | Significance Probability | |||
|---|---|---|---|---|---|
| Less than 7 Years | 8–14 Years | More than 15 Years | |||
| Understanding of navigation-related terms and abbreviations | EVENT | 3.03 | 3.33 | 3.48 | 0.460 |
| CTR(Center) | 3.62 | 3.42 | 4.09 | 0.006 | |
| WPT(Way Point) | 3.31 | 3.68 | 4.22 | 0.006 | |
| MENU | 3.61 | 3.41 | 3.98 | 0.202 | |
| TRACK | 3.37 | 3.50 | 4.17 | 0.008 | |
| MARK | 3.05 | 3.32 | 4.13 | 0.000 | |
| ENT(Enter) | 3.05 | 3.48 | 4.11 | 0.002 | |
Table 7.
User-survey results on the frequency of use of GPS plotting functions.
| No. | Task | Average Time for Task Completion (s) | Number of Key Operations to Perform Tasks | Average (1: Low to 3: High) | |
|---|---|---|---|---|---|
| Usage Frequency | Convenience of Usage | ||||
| 1 | Selection of day/night | 5.8 | 1 | 2.0 | 2.0 |
| 2 | Entering destination | 87.4 | 9 | 2.4 | 2.0 |
| 3 | Selection of existing Route Plan | 40.4 | 5 | 1.8 | 1.2 |
| 4 | Modify Route Plan- deletion of one waypoint | 63.8 | 7 | 1.4 | 1.2 |
| 5 | Distance measurement to target | 22.0 | 1 | 2.4 | 2.0 |
| 6 | Input a symbol | 42.4 | 5 | 2.4 | 2.0 |
| 7 | Ship’s track On/Off | 26.4 | 4 | 2.0 | 2.0 |
| 8 | Drawing user coastline | 52.6 | 5 | 1.8 | 0.6 |
| 9 | Set alarm | 32.6 | 5 | 1.6 | 1.8 |
| 10 | Display sea bottom symbols function | 15.3 | 3 | 1.8 | 2.0 |
Table 8.
Standardized information on GPS-plotter display based on the results of the user testing.
| Item | Information | Item | Information |
|---|---|---|---|
| Own ship | Heading Speed | Target Info. AIS | Target Identifier |
| Target Name | |||
| Course | |||
| Speed | |||
| Position | Latitude Longitude | Measurement Information | Electronic Bearing Line Variable Range Marker |
| Date and time | Date Time | Route | Route Name Next Waypoint (WPT) Number/name Distance to WPT Bearing to WPT ETA Next Course |
Publisher’s Note: MDPI stays neutral with regard to jurisdictional claims in published maps and institutional affiliations. |
© 2021 by the authors. Licensee MDPI, Basel, Switzerland. This article is an open access article distributed under the terms and conditions of the Creative Commons Attribution (CC BY) license (http://creativecommons.org/licenses/by/4.0/).
Share and Cite
MDPI and ACS Style
Kim, J.; Lee, S.; Jung, M. Case Study on the User Interface of GPS Plotters to Enhance Their Usability. J. Mar. Sci. Eng. 2021, 9, 57. https://doi.org/10.3390/jmse9010057
AMA Style
Kim J, Lee S, Jung M. Case Study on the User Interface of GPS Plotters to Enhance Their Usability. Journal of Marine Science and Engineering. 2021; 9(1):57. https://doi.org/10.3390/jmse9010057
Chicago/Turabian StyleKim, Jaewon, Seojeong Lee, and Min Jung. 2021. "Case Study on the User Interface of GPS Plotters to Enhance Their Usability" Journal of Marine Science and Engineering 9, no. 1: 57. https://doi.org/10.3390/jmse9010057
Note that from the first issue of 2016, this journal uses article numbers instead of page numbers. See further details here.