
. Introduction
The high tolerance to summer drought and a wide range of sites which European yew is able to occupy (Brzeziecki and Kienast, 1994; Thomas and Polwart, 2003; and Leuschner and Ellenberg, 2017) place it among tree species with high adaptation potential to climate change. Previously common tree species, present in Europe since the Early Pleistocene, disappeared from many areas (Uzquiano et al., 2015). Primarily due to human disturbances (overexploitation of yew timber), habitat fragmentation (large-scale forest clear-cuts) and increasing damage by herbivory, the yew has become threatened tree species protected legally in many European countries (Korpeľ, 1995; García et al., 2000; Kruszelnicki, 2001; and Thomas and Polwart, 2003).
Stress-tolerant life strategy (as proposed by Brzeziecki and Kienast, 1994)—high ability to withstand shade, slow growth, resistant hardwood and high longevity—makes this species also very suitable for dendrochronological purposes. Within its wide range of occurrence in Europe, different plant associations can be distinguished, which in most cases correspond to the Taxo-Fagetum (Paule et al., 1993). In Western Carpathians, the sociological position of yew is mostly in the lower forest layer. While considerable knowledge on growth response, gap dynamics and health status of species dominating associations with yew European beech exists, little is known on admixed tree species such as sycamore maple, common ash or scattered understorey European yew. Such knowledge is essential, especially, in the context of managing forests for high biodiversity aiming to promote forest ecosystem services.
The radial growth response of understorey yew is a result of the interplay among several factors. Climatically, yew grows best in the humid mild oceanic climates, and on the contrary, its distribution is strictly restricted by continental climate (Thomas and Polwart, 2003). In understorey, the yew has stable ecological conditions and is protected from severe climatic fluctuations such as frosts and low humidity (Saniga, 2000). Yew has the ability to persist in unfavourable light conditions for a long time and to survive severe stem and crown damage. The high shade tolerance (Krol, 1978) and vegetative regeneration capacity (Suszka, 1978) promote its growth. It can be assumed that understorey yew would respond with a greater magnitude to canopy disturbances than over-storey trees (Nowacki and Abrams, 1997).
Among the factors, which negatively influence the growth performance of yew, the slow growth and susceptibility to browsing and bark stripping by ungulates have been identified as the most important (Dhar et al., 2008). Because of slow growth, the yew has reduced ability to compete for resources, which reduces its growth under the higher stand density accompanied by greater intra-species competition. Increasing shade was among others negatively associated with height and stem diameter of yew trees (Perrin and Mitchell, 2013). In deer-populated areas, stem damage by ungulates causes vitality loss of adult yew trees and inability to regenerate and develop, which negatively affects long-term growth across the wide geographical ranges (Watt, 1926). Increasing stem damage and reduction in height growth could express the apparent competition of other tree species in relation to yew (Ammer, 1996). Actually, in most of deer-populated areas of Carpathians, it is difficult to find healthy-looking undamaged trees for possible dendroecological studies. The increasing probability of decline and the worsening of yew health status may substantially distort its potential for the time series analyses and the detection of various environmental signals. Moreover, cross-sections of yew often showing double pith and poor circuit uniformity are difficult to date absolutely (Galvin et al., 2014).
Following the beginning of canopy cuttings, significant sex-related differences in growth variability of yew were recorded (Sedmáková et al., 2017). Higher growth performance of the male trees could be attributed to the reproductive process (Obeso et al., 1998), where the male trees in limiting environmental conditions invest less in carbon resources than female ones (Iszkulo et al., 2011). The sex-specific response of yew radial growth to variation in environmental factors can subsequently be expected (Cedro and Iszkuło, 2011), most likely due to growth divergence between male and female individuals. However, numerous other features and their interaction may modulate growth response such as age (Rozas et al., 2009), crown transparency (Bošel’a et al., 2014), sociological position of trees (Martín-Benito et al., 2008) or genetics (Sáenz-Romero et al., 2019). Although the above-mentioned factors almost never act individually, they are frequently studied separately. It is clear that the combined effect determines the growth performance and vitality of the tree and its response to variation in environmental factors. Divergent trends in the growth of neighbouring trees have impacts on different analyses; thus, extending our knowledge on growth variability among individual trees is essential to the field of dendrochronology (Buras et al., 2018).
The main aim of the presented work is to explore the interactions between shading and crown vitality, stem damage and radial growth of understorey male/female yew trees growing in beech forest formations (mid-mountain conditions) to improve the effectiveness of forest management and restoration activities in European temperate forests, where yew represent an important biodiversity component. In our investigation, we hypothesise the following:
Growth differences should be expected between the sex-specific subpopulations of dioecious tree species possibly because of the higher cost of reproduction for female trees.
The magnitude of sex-related growth differences is increasing with increasing age (life stage).
The pronounced growth divergence will be manifested between categories of damaged and healthy-looking trees.
Within the damage categories, male trees will over-perform female ones.
The focus of our study is to extend knowledge and improve the conservation of yew in regularly managed forest stands providing mainly regulating and provisioning services with close-to-natural tree species composition, established by natural regeneration.
. Materials and methods
Study area
In Slovakia, until the 19th century, yew was commonly distributed, and its timber was exported to the entire Habsburg monarchy (Korpeľ, 1981). Since its occurrence gradually decreased in the half of the 20th century, the most valuable populations were conserved in established nature reserves. For the purpose of this study, we selected four localities in the Western Carpathians, Slovakia (Fig. 1, Table A1), with scattered occurrence of adult yew trees, composing up to 15% of the stand basal area. The localities are part of the limestone beech forests (Fagetum dealpinum), a rare habitat of species-rich plant associations included in the EU Habitat Directive and Natura 2000. These forests constitute approx. 3.7% (35 000 ha) of the total forest cover (National Forest Centre 2015) and represent natural distribution area with the top growth performance and abundance of European yew in Slovakia. Yew occurs in the understory of stands with a diverse vertical structure, where dominant European beech (Fagus sylvatica) is often admixed with sycamore maple (Acer pseudoplatanus), common ash (Fraxinus excelsior), Norway spruce (Picea abies), European larch (Larix decidua) and other tree species. Climatically, localities Lackov Grun (LAG), Pavelcovo (PAV), Strazov (STR) and Velka Fatra (VFA) are affected by moderately warm–moderately cold climate with the mean annual temperature/annual precipitation sum: 7.6°C/951 mm (LAG, PAV); 7.6°C/776 mm (STR) or 6.2°C/911 mm (VFA), (period, 1950–2015; Cornes et al., 2018). Limestones and dolomites form the bedrock overlaid by rendzina with medium depth.
Fig 1
a) Location of the study sites STR (Strazov Mts.), PAV, LAG (Stare Hory Mts.) and VFA (Great Fatra) in Slovakia; b) climate diagrams showing mean monthly courses of temperature and precipitation sums; climate data were derived from KNMI monthly E-OBS 0.25° gridded observations (E-OBS 19.0e); c) number of trees in crown and stem damage classes according to localities.
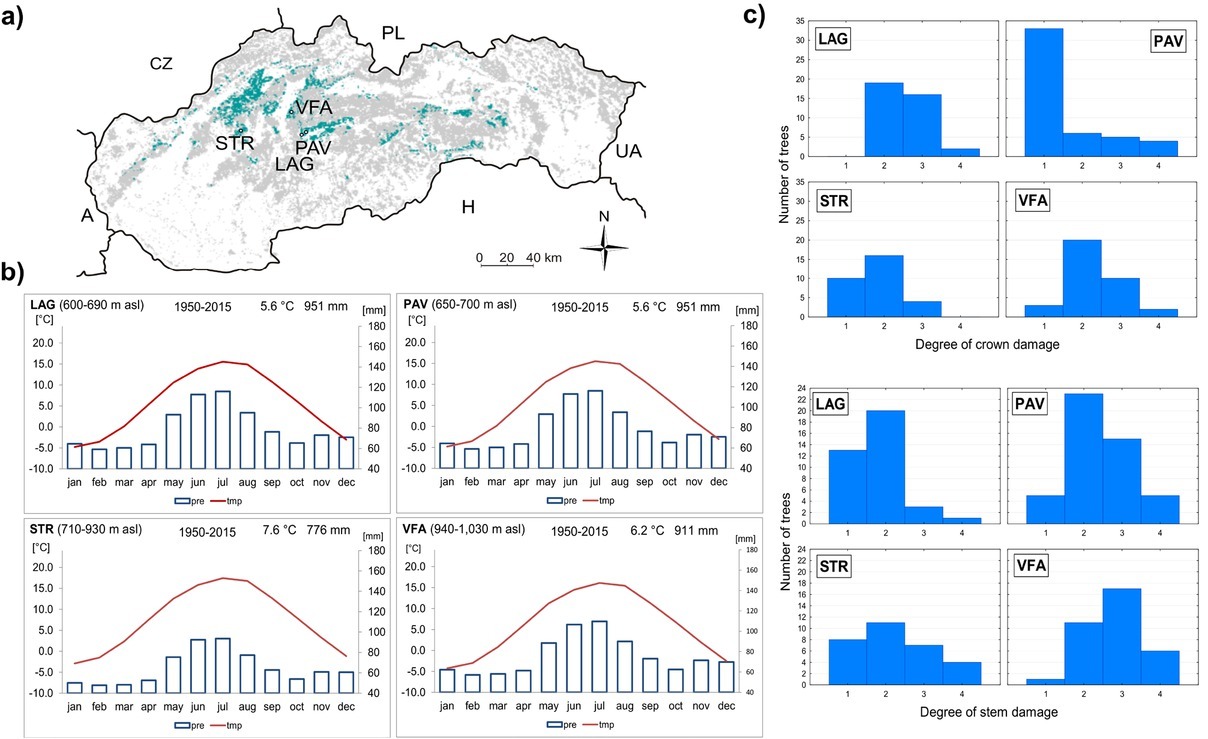
Table A1
Description of the study sites
Field sampling
We surveyed four localities in 2015–2017. Starting near the upper border of the stand, we walked along the contour line (isohypse) and marked a point every 40 m. If a mature yew with the diameter at breast height (DBH) ≥15 cm was present in a distance less than 3 m, a circular sampling plot of 500 m2 with the yew in the centre—hereafter called the ‘central yew’—was established. After reaching the stand border, we moved 40 m down the slope and walked again following the isohypse. Using this pattern, we covered the entire stand area and established 114 research plots in total. On the plots, the positions of all living trees with DBH above 8 cm, standing dead trees, snags and stumps were recorded by FieldMap (IFER—Monitoring and Mapping Solutions, Ltd., http://www.fieldmap.cz). For every standing tree, several basic characteristics were recorded: tree species, DBH, height and height of the crown base (for living trees only). In the case of yew trees, moreover, we recorded four perpendicular crown radii (x1–x4), sex, growth form as well as degree and type of stem and crown damage. The degree of crown damage (relative percentage of needle loss) was visually assessed and classified into four classes: 1—undamaged crown with transparency < 10%; 2—weakly damaged crown with transparency up to 25%; 3—damaged crown with transparency from 25% to 50%; and 4—heavily damaged crown with transparency > 50%. Similarly, damage to stems by herbivores was categorised into four classes. Class one corresponds healthy undamaged stem, class two with the weakly damaged stem up to 25% of stem circumference, class three with damaged stem from 25% to 50% of stem circumference and class four with the heavily damaged stem when more than 50% of stem circumference is bark stripped. For central yew, crown length and width were calculated. In the case of stumps and standing dead trees, we recorded tree species, diameter (at the top in case of stumps) and height.
For the dendrochronological analysis, we collected increment cores from all 114 central yews and 36 additional mature yews located on sampling plots at four localities, for a total of 150 cored yew stems. Two increment cores in perpendicular directions were extracted from each tree at 1.3 m above ground (294 utilisable cores), with the aim of avoiding reaction wood. Cores were mounted on wooden bars, dried and sanded. Samples were scanned using Epson Expression 10,000 XL scanner, and ring-widths were measured to the nearest 0.001 mm using WinDENDRO™ software (Regent Instruments Inc., Québec, Canada). Individual ring-width series were carefully cross-dated (Yamaguchi, 1991) and checked for missing rings and other cross-dating errors with the COFECHA software (Holmes, 1986). Following the cross-dating, pith age of yew trees at coring height was recorded from individual tree-ring series. In the case of partial cores (without pith) with inner arcs presented on the core, the age was estimated using the graphical method (Duncan, 1989). The age estimation was omitted for yew trees with partial cores without pith and inner arcs (5.4% of yew trees).
Data analysis
Exploratory investigation
Stand basal area per hectare G (m2ha−1) of all tree species (including yew) was calculated for living trees Gtrees, standing dead trees and stumps Gnekro and for living beech trees Gbeech. Proportion of beech Pbeech determined as a ratio of Gbeech/Gtrees and expressed in percentage was also calculated at each sampling plot.
Moreover, for each sampling plot, we calculated a quantitative index of canopy closure (shading) based on the three-dimensional stereogeometry as proposed by Lieberman et al. (1989). Our calculations were slightly modified, as they accounted for the height difference between considered pair of trees, including the terrain elevation difference between their forest floor positions. The index of canopy closure, Gt, is based on: (1) the horizontal distance between the focal tree and each taller neighbour within the given radius of 12.62 m, (2) the height difference between the two trees and (3) the distance from the top of the focal tree to the top of its neighbour, calculated from the height difference and the horizontal distance between the focal tree and the neighbour. The ratio of (2) to (3) is the sine of the included angle. The Gt is defined as the sum of these ratios for all i taller neighbours within the specified radius.
Two-way ANOVA was employed to test the differences among localities and sex categories of the trees according to Gtrees, Gnekro, Gt, Gbeech and Pbeech (dependent variables). Additionally, mean values, their standard deviations and Pearson’s correlations among stand characteristics were calculated in the exploratory phase to reveal potential dependencies that can affect the final interpretations. For the same reasons, the relationship between stem and crown damage of European yew trees was tested using Pearson’s chi-square statistic.
To confirm that the crown damage is related to shading, the relationship between crown damage (categorical dependent variable) and stand characteristics (Gtrees, Gnekro, Gt, Gbeech and Pbeech—continuous predictor variables) was described by the generalised multiple regression model with ordinal multinomial distribution of response variable and logit (f(z) = log(z/(1-z)) link function. The model assumptions were checked by scatterplots showing relationships between observed values, predicted values and residuals. The overall quality of the model was assessed by several standard goodness-of-fit statistics (sum of deviations, Pearson’s chi2, scaled Pearson’s chi2).
Tree-ring analysis
The basic dendrochronological characteristics were computed for each TRW series. The established standardised site chronologies were compared based on the mean correlations between trees (RBT) and expressed population signal (EPS). To explore sex-specific growth performance of yew trees, raw TRW chronologies were built for male and female trees within each site separately. In addition, cumulative growth curves were calculated based on the alignment of TRW series according to the pith age. For each age, we calculated the cumulative growth as a sum of previous TRWs, and for each subgroup, mean yield curves were obtained. Resulting mean chronologies were graphically compared and assessed. Similarly, mean raw TRW chronologies according to the crown and stem damaged and undamaged groups of trees were constructed and graphically compared within each site.
To test the second and third hypotheses, we used the general linear model. The model served for statistical detection of whether tree-ring widths (TRWs, dependent variable) of yews are influenced by the health status of the crown and by the stem damage caused. To remove age-dimensional differences among individual tree-ring series, diameter (DBH) entered the model as an independent continuous variable. Sex (male/female), crown status (damaged/undamaged) and stem status (damaged/undamaged) entered the model as categorical predictor variables. The three model versions were established using the TRW data from three different time periods covering last available calendar years on time series: one short-term period (2010–2015) covering last 5 most recent TRWs and two mid-term periods (2010–2015, 2000–2015) composed by the 10 or 15 most recent TRWs. Three periods were explored, and modelling results were combined because the information about the exact year of crown or stem damage in category damaged trees was not known. Therefore, a robust modelling approach was adopted.
Competition and canopy closure analysis and formulation of tree cutting rules
To quantify the competition between a central yew tree j and its neighbour i, we calculated the competition index using the A-value from Johann (1982), which allows regulation of the release and so promoting of central trees individually (Pretzsch, 2009):
where hj is the height of the central yew tree j; dj—the diameter at breast height of the central yew tree j; di—the diameter of the neighbouring tree i; and Eij—the horizontal distance between the central tree j and neighbour i within the given radius of 12.62 m.
Another different and useful measure of competition that was used for the determination of release cutting rules was angle sineθ (component of canopy closure Gt):
,
where hi—is the height of the neighbouring tree i; hj—the height of the central yew j; z—vertical coordinate value of a tree i or j ; sineθ—the sine of the angle calculated as ratio of the positive height difference between neighbouring tree i and central yew tree j (nominator of ratio); Dist_topij— distance from the top of the central yew tree to the top of its neighbour (ratio denominator).
Plotting the A-values against angle sineθ for all taller neighbours at each locality allowed to select the threshold A and sineθ value, allowing to formulate release cutting rules for individual yew tree. Threshold values were determined to remove the competitors having exponentially larger pressure on central tree indicated by both competition measures simultaneously.
In this approach, a neighbouring tree i is removed if its distance to the central yew tree j is below a threshold distance Tdist and at the same time the value of the sine of the respective angle between the central yew tree and its neighbour is above a selected threshold value.
Threshold A-value (Johann, 1982) is defined for each locality and determines the degree of release; other variables in formula 3 are described above. Tdist refers to the threshold distance for a given A-value below which a neighbouring tree is removed.
. Results
Basic descriptions
Yew trees differ among localities by age and the basic dendrometric characteristics of sampled trees (Table 1). Within localities on average, female yew trees possess smaller crowns and have lower heights, DBH and basal areas compared to male trees. In the localities PAV and STR, yew trees have mostly undamaged or weakly damaged crowns, while in LAG and VFA, undamaged crowns are lacking (Figs. 1 and A1). The largest degree of stem damage was recorded in the locality VFA. The degree of stem damage was related to the mean height of yew trees (Fig. A2). Results of testing the differences among localities and sex of the yew trees in the characteristics of surrounding stand Gtrees, Gnekro, Gt, Gbeech and Pbeech are summarised in Table A2 and Fig. 2. The interaction between locality and sex was not significant; therefore, results of the main effects of two-way analysis of variance are presented. Significant differences were found between female and male trees in stand characteristics Gtrees, Gbeech and Gt. Stands surrounding male trees showed significantly lower values than those surrounding female trees. No differences between male and female trees were found in Pbeech and Gnekro. Among localities, significant differences were found for all variables, and localities STR and PAV showed lower mean values of Gtrees and Gt and higher values of Gnekro compared to LAG and VFA. Locality PAV showed the lowest Gbeech compared to other localities. Based on the mean values and Pearson’s correlations among stand characteristics (Table 2), we can state that the surveyed stands show quite high proportion of beech. Positive relationship between stand basal area of trees (Gtrees) and stand basal area of beech trees (Gbeech) means that beech mostly participates in denser stand parts. At the same time, as it was expected, index of canopy closure (Gt) is positively related to Gtrees and negatively to Gnekro.
Fig A1
a) Healthy-looking yew with undamaged stem and crown; b) multiple stem, more than 50% of the stem circumference is stripped by deer, crown with transparency of more than 50%.
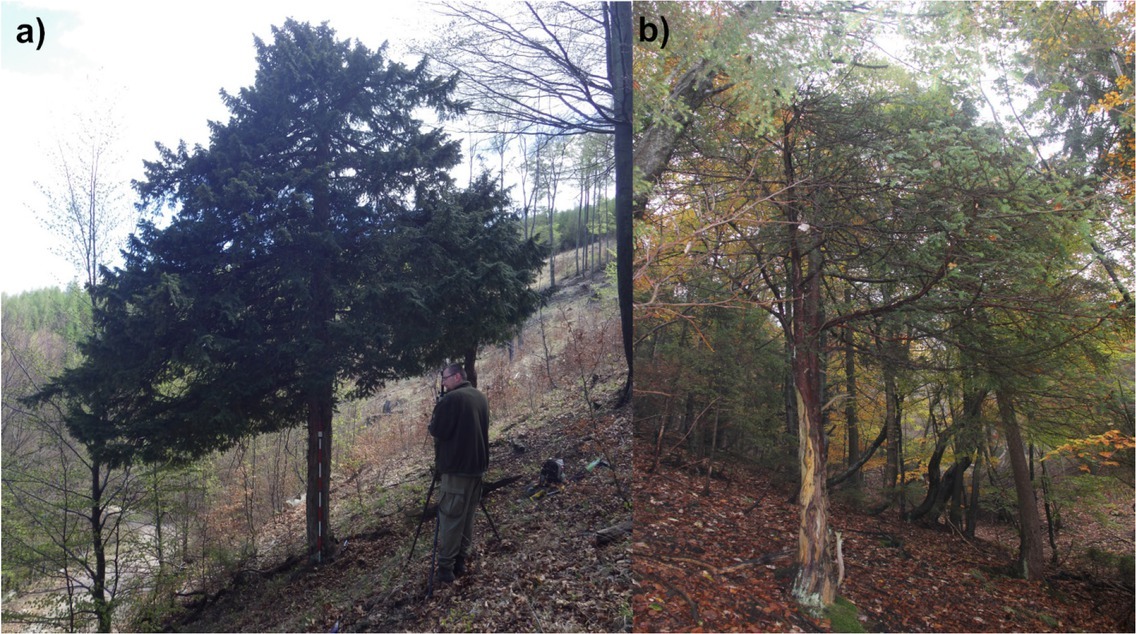
Fig A2
Degree of bark stripping damage related to mean height of yew trees in Slovakia. SE—standard error.
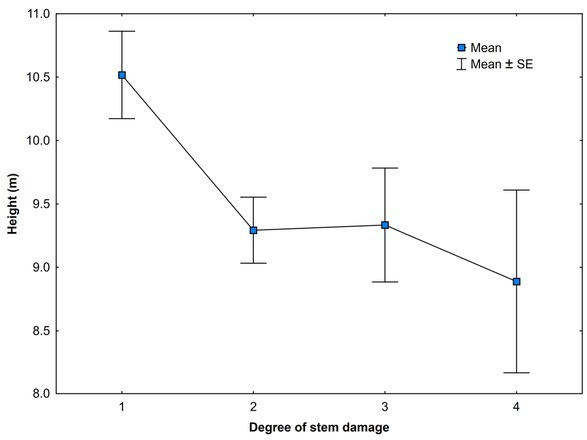
Fig 2
Summarisation of mean values and their differences among a) sex categories (non-significant differences in Gnekro and Pbeech between male and female trees are not displayed) and b) localities of the yew trees in surrounding stand characteristics Gtrees, Gnekro, Gt, Gbeech and Pbeech; Gtrees—basal area of living trees, Gnekro—basal area of standing dead trees and stumps, Gbeech—basal area of living beech trees, Pbeech—proportion of beech, LAG (Lackov Grun), PAV (Pavelcovo), STR (Strazov), VFA (Velka Fatra), L and R—left and right y-axis.
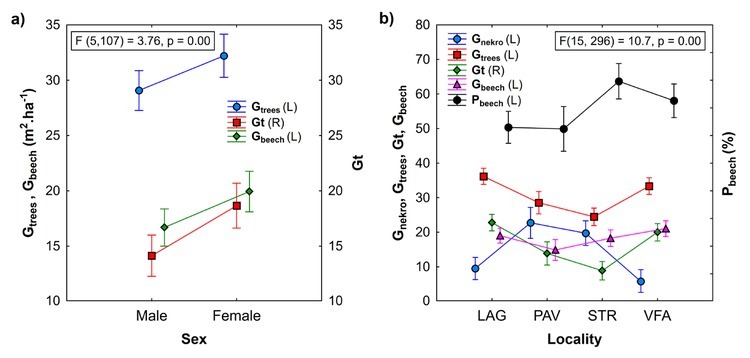
Table 1
Basic description of sampled male and female trees of European yew at four localities in Slovakia
Table A2
Results of ANOVA showing summary of all effects (locality and sex) of trees in stand characteristics Gtrees, Gnekro, Gt, Gbeech and Pbeech surrounding focal yew trees
Table 2
Stand characteristics Gtrees, Gnekro, Gt, Gbeech and Pbeech surrounding central yew trees, their mean values and inter-correlations
Crown and stem damage and growth performance of yew
Crown damage was not related to stem damage based on the Pearson’s chi-square statistic equal to 15.69 (p < 0.07; Table A3). Using the generalised linear regression model, we revealed that the crown damage of the yew adults is positively correlated with the canopy closure index (Gt) of the stand (Table 3). Increasing canopy closure significantly increased transparency of yew crowns. Inclusion of stand variables such as Gtrees, Gnekro, Gbeech and Pbeech did not significantly contribute to the explanation of the variability. The established model fits the data well. All fitting statistics are close to 1.0; there is no evidence of model overdispersion.
Table A3
Two-way table showing no relationship between stem and crown damage of European yew trees expressed in relative frequencies (Pearson’s chi-square = 15.69; Df = 9; p < 0.07)
| Degree | Stem damage | ||||
|---|---|---|---|---|---|
| Crown transparency | 1 | 2 | 3 | 4 | All |
| 1 | 3.33 | 17.33 | 8.00 | 2.00 | 30.67 |
| 2 | 12.00 | 13.33 | 10.67 | 4.67 | 40.67 |
| 3 | 2.00 | 10.67 | 6.67 | 4.00 | 23.33 |
| 4 | 0.67 | 2.00 | 2.67 | 0.00 | 5.33 |
| All | 18.00 | 43.33 | 28.00 | 10.67 | 100.00 |
Table 3
Parameter estimates and goodness-of-fit statistics of the generalised linear regression model applied to test the relationship of stand canopy closure (shading) and crown damage (transparency) of yew adult trees.
In general, established chronologies expressed very dissimilar recent growth trends among localities and differed in basic dendrochronological statistics. The mean chronology at the locality LAG showed the highest RBT and the strongest population signal. On the contrary, the lowest RBT and the highest variation in TRW values were within the locality STR (Table 4). Based on the graphical comparison of male and female mean growth curves within localities, significant differences in growth occurred in certain periods, during which female trees showed contrasting growth trends compared to those of male trees (Fig. 3). Such periods lasted approximately 10 years, during which time sequences of sex-specific mean chronologies and corresponding bands of standard error (SE curves) did not overlap under sufficient sample depth. The exception is locality LAG, where mean sex subchronologies show similar time course of growth.
Fig 3
Sex-specific mean raw tree-ring width (TRW) chronologies of yew according to four localities. Dashed (male) and dotted (female) lines on left (L) y-axis denote standard error (SE) of the mean TRW chronology value. Dashed (male) and dotted (female) lines on the right (R) y-axis refer to the number of sampled trees, from which the mean chronology was constructed. LAG (Lackov Grun), PAV (Pavelcovo), STR (Strazov) and VFA (Velka Fatra); black arrows point to significant within-site differences in growth between male and female chronologies (sequences of sex-specific mean chronologies, in which curves of SE do not overlap), white arrows show release as a response to known cutting treatment.
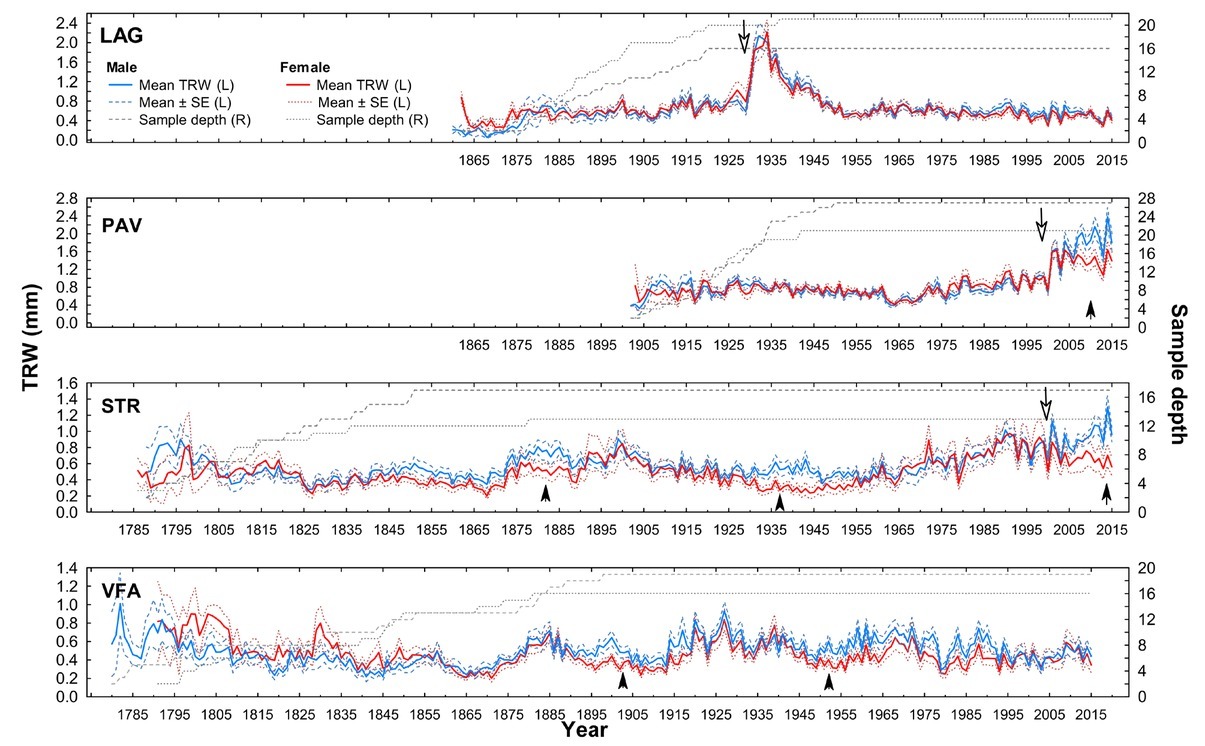
Table 4
Basic statistics of European yew tree-ring series and standardised chronologies for the common periods in four localities of Slovakia
[i] Nt—number of sampled trees, MSL—mean series length, TRW—mean tree-ring width (mm), SD—standard deviation, MSs—mean sensitivity of individual series, AC1— first-order autocorrelation coefficient, RBT—mean correlations between trees, EPS—expressed population signal calculated for the common interval, PAV—Pavelcovo; LAG—Lackov Grun; STR—Strazov; and VFA—Velka Fatra.
In recent mid-term period (2000–2015), the difference in growth between male and female trees became very apparent after regeneration cut on localities PAV and STR. The sex-related growth divergence becomes even more evident, when plotting subchronologies according to their cambial age (Fig. 4). Cumulative mean growth curves of STR and VFA express higher divergence compared to those of LAG and PAV. In localities STR and VFA, sampled yew
Fig 4
Cumulative radial growth of female (blue line) and male (red line) yew trees according to four localities (L-left y-axis): LAG (Lackov Grun), PAV (Pavelcovo), STR (Strazov) and VFA (Velka Fatra). Number of corresponding averaged male (dashed line) and female (dotted line) trees displayed on the right (R) y-axis.
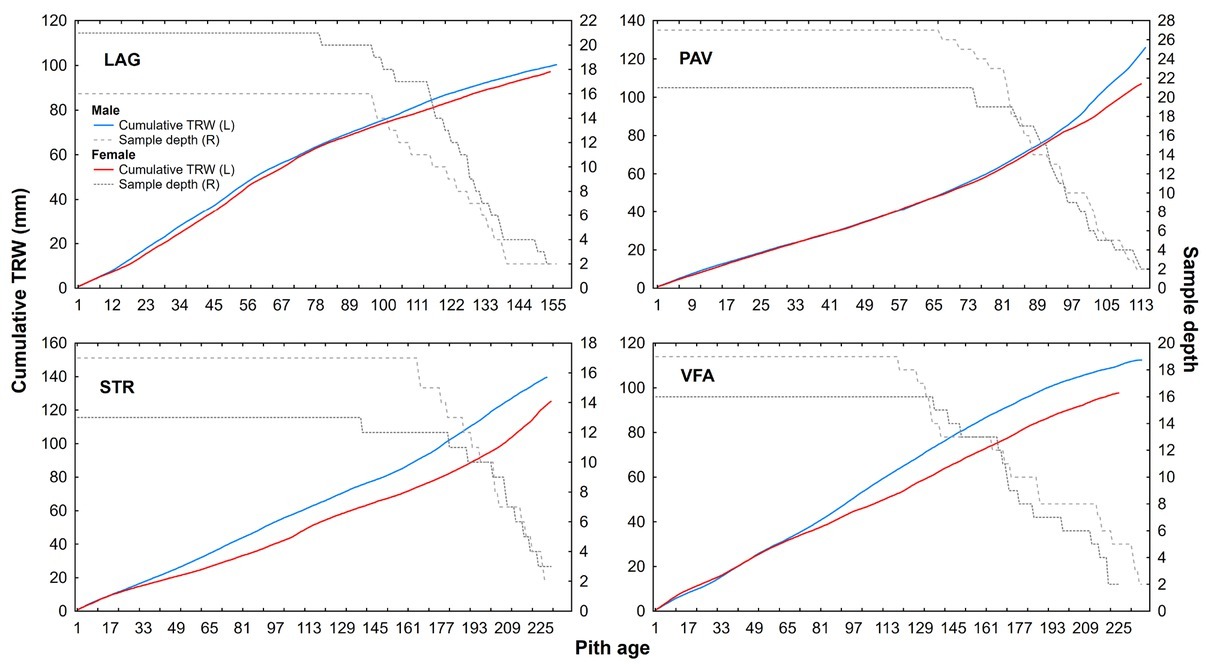
trees are on average twice as old as those in LAG and PAV (Table 1). Additionally, STR and VFA show higher within-site difference between male and female diameters (Table 1). Within-site significant differences in growth are apparent also for stem and crown damage-specific subchronologies (Figs. 5 and 6). However, growth divergence is not so pronounced. The subchronologies do not express opposite growth trends.
Fig 5
Raw tree-ring width chronologies of damaged/undamaged yew trees according to crown transparency status in four localities: LAG (Lackov Grun), PAV (Pavelcovo), STR (Strazov) and VFA (Velka Fatra). Values of mean TRW (solid lines) and corresponding standard error (dashed line for undamaged and dotted line for damaged trees) are displayed on left (L) y-axis. Right (R) y-axis displays respective values of sampling depth.
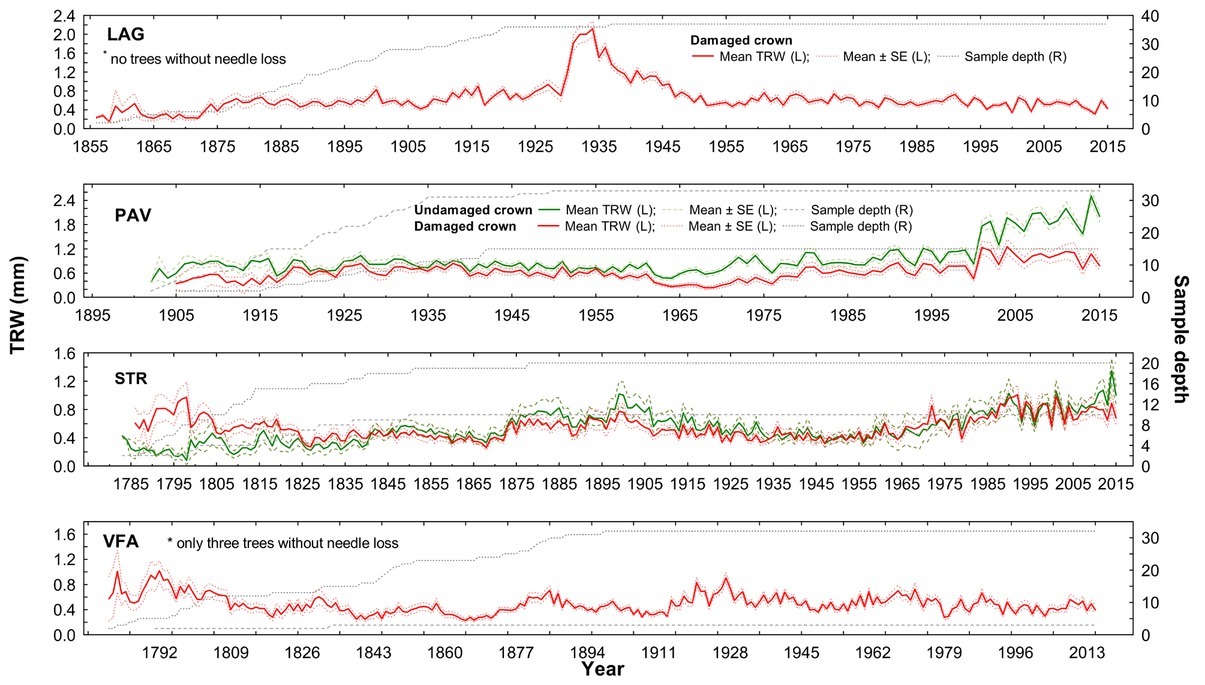
Fig 6
Raw tree-ring width chronologies of damaged/undamaged yew trees according to stem status in four localities: LAG (Lackov Grun), PAV (Pavelcovo), STR (Strazov) and VFA (Velka Fatra). Values of mean TRWs (solid lines) and corresponding standard error (dashed line for undamaged and dotted line for damaged trees) are displayed on left (L) y-axis. Right (R) y-axis displays respective values of sampling depth.
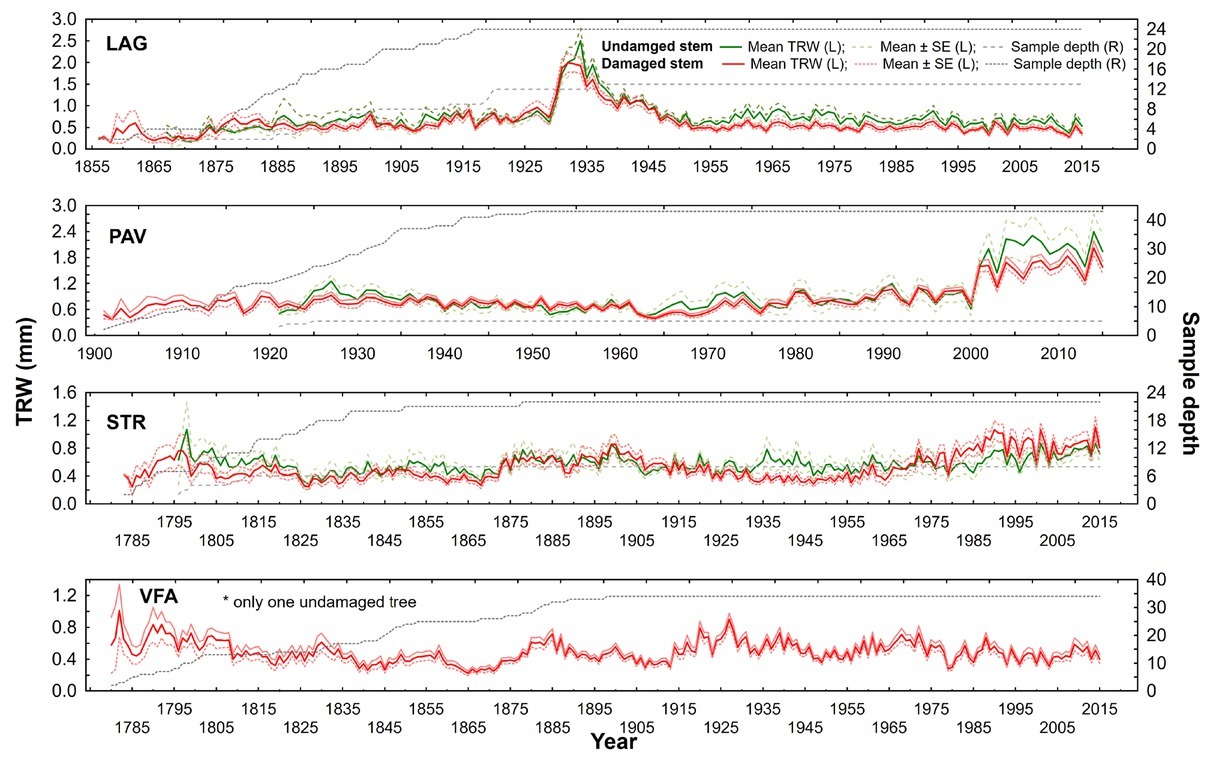
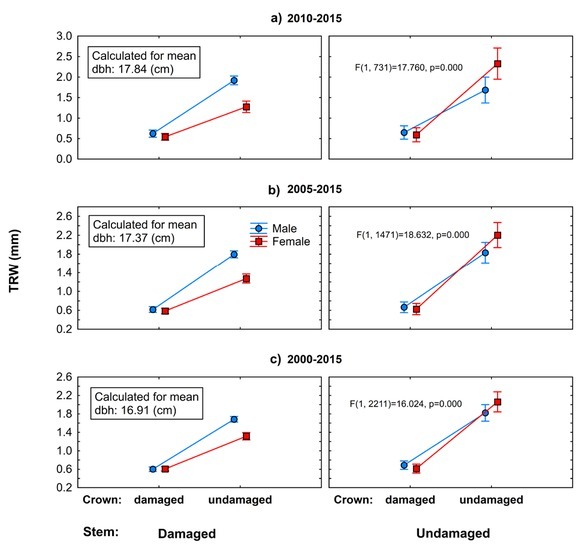
Using the general linear model, we revealed significant negative effects of crown defoliation and stem damage caused by bark stripping on growth performance of European yew (Fig. 7). Defoliation of tree crowns has led to recent short-term (2010–2015) and mid-term (2005–2015, 2000–2015) growth decline, regardless of the stem damage and sex. Unlike male trees, female trees with healthy crowns responded to stem damage with pronounced growth decrease. Surprisingly, within the category of damaged crowns and stems, there was no difference in radial growth between female and male trees.
Fig 7
Results of the general linear model, which evaluates interactions of stem and crown damage in relation to yew female and male radial growth in selected periods: a) 2010–2015, b) 2005–2015, c) 2000–2015. Main effect (F) calculated for means of independent continuous variables (DBH). Vertical lines denote 0.95 confidence interval.
Competition, canopy closure and release cutting
Increased stand canopy closure (Gt or shading) relates to reduced dimensions of yew trees (DBH, height, crown width, crown length). Negative relationship between Gt and tree height and crown width was not significant in the locality STR, most likely because of narrow range of mainly low Gt values. Increased competition (A-value) reduces DBH of yew trees significantly. The correspondence between competition and canopy closure is shown in two localities with contrasting values of stand characteristics. Unlike the locality STR, locality LAG has among all studied localities the highest average value of stand basal area, canopy closure index and the lowest stand basal area of death trees (Fig. 2).
Based on the range of A-values, the competition pressure on yew is higher in locality LAG compared to that in locality STR (Fig. 8). The majority of trees, surrounding the central yew in the centre of sampling plot, show A-value of competition index in the range of 0–2 in both localities. For A-value above 2.0, the sine value of the respective angle reaches Gt mainly of more than 0.8. Thus, selection of the trees with the threshold value (Tdist) below 0 (at the A-value equal to 2.5) and Gt value equal to or above 0.8 would reduce the competition pressure and release crowns of yew from shad ing. Rules for determination of threshold values applied in cutting scheme on a particular locality are illustrated in Fig. 9 (illustrated for three selected sampling plots).
Fig 8
Plotted A-values against the sines of the included angle for all taller neighbours of central yew at localities a) LAG (Lackov Grun) and b) STR (Strazov). For A-value above 2.0, the sine value of the respective angle reaches Gt mainly of more than 0.8, which allows to select the threshold for selective release cutting of trees i in surrounding of the central yew trees j. In the cutting scheme, trees in the right upper corner are marked to be removed.
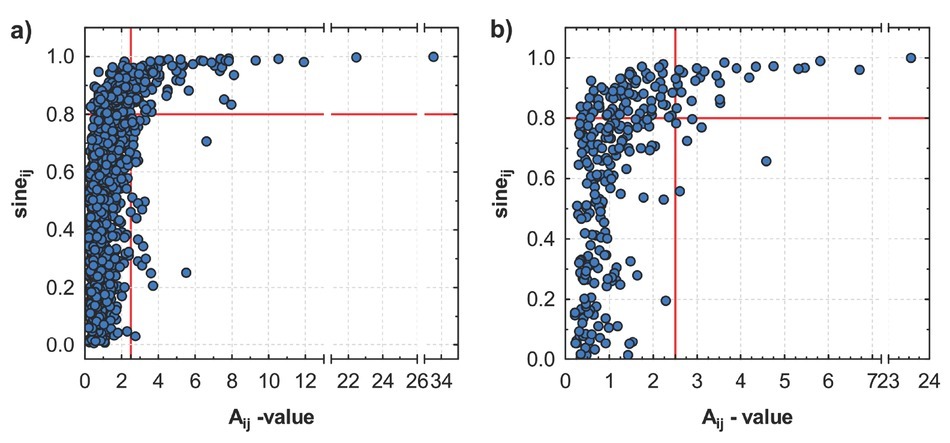
Fig 9
Example of cutting scheme (with cross-marked central yew tree in the middle of the three sampling plots) at localities a, b) LAG (Lackov Grun) and c) STR (Strazov). The set criteria of release cut are A-value = 2.5, Tdist < 0 and sineϑ ≥ 0.8. On two sampling plots at locality Lackov Grun with comparable stand basal area (density) a) G = 37.0 m2ha-1 b) G = 38.8 m2ha-1, the intensity of release cut is higher (24.35% from basal area) on the plot a) with unfavourable canopy closure (Gt = 20.15), and on the plot b) with more favourable canopy closure (Gt = 11.91), removal of one neighbouring tree is planned. c) In low stand density (G = 17.2 m2ha-1) and low canopy closure (Gt = 4.78), cutting intervention is not indicated. In the figure, circles refer to position of trees on the sampling plot and their size corresponds to DBH of trees; red colour marks trees to be removed by the release cutting, green colour marks living trees, and grey colour marks of standing dead trees and stumps.
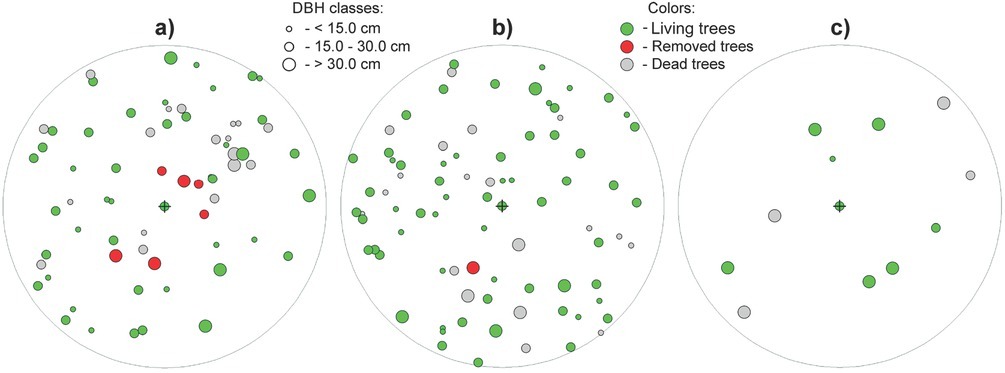
In the locality LAG, such selection represents an average reduction in Gt by 2.75 (maximum 5.81), intensity of cut calculated from basal area would be on average 11.3% (maximum 30.9%), and intensity of cut calculated from volume would be on average 14.9% (maximum 57%). In the locality STR, the respective threshold values for Gt represent 1.0 (max. 3.6), cutting intensity calculated for basal area 3.5% (max. 12.4%) and from stand volume 16.8% (max. 53%). While in the locality STR in 50% of sampling plots, the cut is not indicated; in LAG, only one sample plot is left without the cutting prescription.
. Discussion
This study demonstrates divergent growth between male and female trees (expressed in absolute terms) and the negative effects of crown defoliation and stem damage on growth performance of European yew.
Our results suggest that the differentiation in diameter growth between male and female trees likely began when the yew trees reached the life stage of sexual maturity, probably because of the assumed greater reproductive effort of female than male trees. This is in accordance with the findings of Cedro and Iszkuło (2011). In our study, the within-locality-detected differences between male and female trees in mean diameter are greater in older populations (STR, VFA) compared to those in younger ones (PAV, LAG, Table 1). On mean TRW chronologies, older populations showed more often the time sequences with contrasting growth divergence and lower between-tree correlations. Therefore, there are differences in the cumulative diameter growth as well (Fig. 4). This is in agreement with our first and second hypotheses. For reproducing trees, the long-term diameter growth trend related to age and size of trees is sex specific. Dioecy—an evolutionary reproductive strategy—likely aimed at attracting many seed dispersers, though the production of extraordinarily heavy crops of fleshy seeds, arils or cones is costly (Givinish, 1980). Thus, with progressing age of trees within the population and to this related time length of production of reproductive organs, the magnitude of differences in growth performance between female and male trees would increase. Scientific findings are relatively consistent in that male trees outperform female trees, have higher growth rates and are larger (Obeso, 2002; Mitchell et al., 2004; Iszkuło et al., 2009; and Cedro and Iszkuło, 2011). For example, unlike in young secondary forests, in the old-growth forests, diameters of the male trees of the dioecious tree species Fraxinus mandshurica were greater than those of the female ones (Zhang et al., 2010).
In our case, rapid increases in radial growth are likely responses of yew trees to canopy disturbances (either artificial cutting operations or natural disturbances) based on the known releases identified in later life stages (Fig. 3). In the locality PAV, regeneration cut (in 2000) triggered production of reproductive organs and hence growth divergence. Before the beginning of the regeneration cuttings, female and male yew individuals displayed similar growth rates (Sedmáková, et al. 2017). In the locality LAG, stand-replacing disturbance did not triggered the growth difference as at that time majority of female yew trees where in the juvenile life stage (age at coring height around 15–20 years). On the other hand, in less dense or even solitary growth conditions at the locality STR, yew trees probably started to produce ‘fruits’ (seed partly covered by a fleshy red aril) at lower ages, compared to localities with dense canopy of beech forests. We assume that after yew trees reach the maturity and at the same time environmental conditions are optimal to regeneration, significant sex-related differences in growth variability appear. The survey of natural regeneration conducted at the time of sampling revealed higher densities of naturally regenerated yew seedlings at the localities STR and PAV compared to those at the localities LAG and VFA (Kýpeťová, 2018).
In the temperate forests of northern Europe, the yew is under threat mostly because of low light availability and high herbivory pressure (Dhar et al., 2008; Linares, 2013; and Dobrowolska et al., 2017). Yet, little is known on the recent response of radial growth to these most important factors negatively affecting growth performance and health status of yew trees. Decreases in light availability (in terms of increases in canopy closure index) significantly increased transparency of yew crowns in our study (Table 3). Visual assessment of tree crowns and classification into transparency or defoliation classes could be indicative of stress at the stand scale (Zarnoch et al., 2004) and has become a standard procedure in the monitoring of forest health. Tree-ring-based growth patterns were also used as an indicator of current and past health status (Bigler et al., 2004; Bigler and Bugmann, 2004; Dobbertin, 2005; and Dobbertin et al., 2007). Hence, many studies using crown assessments and retrospective tree-ring analysis showed decreased growth with higher crown transparency (e.g. Sikström et al., 2011; Seidling et al., 2012; and Eil-mann et al., 2013). In yew, an attempt has been made by Ruprecht et al. (2010) to illustrate how the vitality of individual yew trees is affected by the inter-species competition of the neighbours.
Concerning the stem damage, interesting results on yew reports study from the Himalayas in India. Depending on the depth of the bark removed, it shows that bark removal up to 25% and even up to 50% around the stem circumference does not affect the survival of yew trees largely. The high mortality rates (over 50% decline) were recorded when bark was removed at the depth greater than 4 mm or around more than 75% of the stem circumference, which could be considered as critical limit for yew tree survival (Purohit et al., 2001). In our study, the highest number of heavily damaged (more than 50% bark removed) yew trees is at the locality VFA (Fig. 1, Sedmáková et al., 2018). The degree of bark stripping damage decreased with increasing mean height of yew trees (Fig. A2), which is in agreement, for example, with the study showing the relationship between the size of tree species and bark stripping by red deer causing considerable damage to Austrian forests (Vospernik, 2006). It can be expected that the same deer stripping the tree of smaller and larger size would cause higher stem damage to the smaller one. It is very likely that at the same population density of ungulates, damage frequency of this very susceptible tree species to bark stripping would relate to other stand characteristics. We suppose that it would increase with the increase in stand density. The bark on suppressed trees is thinner (thicker bark restricts stripping) and in dense stands remains susceptible for longer time (Gill, 1992). However, this assumption was not evaluated in our study.
The size dependence would apply also to radial growth. We expect that the same degree of stem damage and the same degree of crown transparency would cause in absolute terms higher decrease in radial growth for larger- and faster-growing trees. Accordingly, differences in radial growth detected on raw mean chronologies in our work could simply be assigned to differences in sizes of trees between the categories of damaged and undamaged trees. To evaluate the effect of crown and stem damage on radial growth separately for female and male trees, differences in growth related to the size of trees need to be removed.
Based on the applied general linear models (Fig. 7), we register considerable recent growth decline in damaged European yew trees compared to undamaged ones in the limestone beech forests of the selected geographical region (in relative terms). Our results stress the importance of light being the most limiting factor as the highest growth divergence was found between trees with healthy-looking crowns (undamaged crowns) and trees showing certain degree of transparency (damaged crowns). The high shade tolerance did not compensate for recent growth decline, and there is no difference in growth performance between the sexes, although in the case of healthy looking trees, female trees even slightly overperform male ones. However, this difference is not statistically significant. Crown transparency is a more important factor causing the growth decline than bark stripping. On the other hand, vegetative regeneration capacity of yew showed to be sex related. Male trees compensated for recent growth decline caused by herbivory (combination of damaged stem and undamaged crown), and their growth was similar to the growth of healthy male trees (combination of undamaged stem and undamaged crown). Unlike male trees, the growth of female trees with damaged stems and undamaged crowns decreased substantially in comparison with healthy-looking female trees. Detected growth divergence may relate to higher cost of reproductive effort of female trees. At the time of sampling, all female trees showing no signs of crown transparency (with or without damage of stems caused by herbivory) were producing ‘fruits’. Overall, these findings are in agreement with the third hypothesis and disagreement with the fourth hypothesis. However, in one combination, in case of male trees, there was no pronounced difference between damaged and healthy-looking trees, and in this combination, male trees significantly overperformed female ones.
We expect the most pronounced sex-related differences in growth for strongly limited environmental conditions (low light availability in understorey). Under distribution limiting conditions, the percentage of female trees are found to positively relate with precipitation regardless of population age, which suggest their higher mortality rate on drier sites (Iszkuło et al., 2009). At the same time, female trees are more susceptible to water stress and low soil fertility (Iszkuło et al., 2009; Rozas et al., 2009; and Garbarino et al., 2015). We would suppose female trees to allocate proportionally more resources to reproduction, leaving less resources available for other functions such as growth or defence (Mitchell et al., 2004). Very likely the depletion of resources due to crown transparency and subsequent lack of assimilates from needles has exacerbated growth regardless of the sex. It seems that clear conclusion about the consequences of the differential cost of reproduction between sexes cannot be simply drawn, especially if the interaction of more factors is taken into account. Several findings suggest that growth responses might depend much on resources that plants are able to acquire. Females grow and store more carbon resources than male plants under optimal environmental conditions (DeSoto et al., 2016), and various physiological mechanisms may enable the compensation of the reproductive costs (Obeso, 2002). Yew female trees are found to occupy spatially segregated wetter sites and then may outperform male trees in radial growth (Garbarino et al., 2015). Negative relationships between fruit production and radial growth suggesting trade-offs could be determined by correlated environmental factors rather than being causal, confirming the growth and reproduction could be independent of each other (Knops et al., 2007 and Mund et al., 2010). Positive correlations between cone production and vegetative growth, found for monoecious clonal shrub Taxus canadensis on constant plant sizes, also suggests lack of trade-off between reproduction and vegetative growth (Wilson et al. , 1996).
In our study, canopy closure is positively associated with the degree of crown transparency and the growth decline in yew. The number of healthy-looking yew trees in Slovakia is low, and the overall health status of yew is unfavourable. In forests of East–Central Europe, decreased growth and high rates of adults’ auto-reduction and extensive absence of regeneration threaten maintenance of yew populations (Linares, 2013). On the other hand, canopy openness positively relates to growth of European yew, and the size and growth rate of mother trees positively affect the amount of newly regenerated seedlings (Sedmáková et al., 2017). Continuous thinning and cutting operations seem to be an effective conservation management approach to ensure the persistence of European yew (Saniga, 2000; Saniga and Jaloviar, 2005; Dhar et al., 2008; and Ruprecht et al., 2010). Protection of yew stems by PVC mesh guards is recommended in deer-populated areas to eliminate browsing and bark stripping. Even after five years from exclusion of deer browsing, yew shows lower growth rates, smaller needles and polycormic stems as the consequence of herbivory pressure (Kýpeťová et al., 2018).
Based on the above-described reasons, although the hypothesis about worsened radial growth of damaged female trees is not confirmed, to enhance regeneration and improve growth of individual trees, importance of making silvicultural treatments for female trees as a priority is advisable. Releasing trees from competition after cutting will except for improved individual tree growth (Saniga, 2000) also reduce their mortality and ameliorate possible drought stress, what are facts important namely for female trees (Calev et al., 2016). Such silvicultural measures could counteract the ongoing decrease in the growth performance and increase the viability of populations, so as to preserve the unique biodiversity of calcareous beech-dominated forests.
To direct silvicultural prescription to be more specific with focus on individual yew trees, we propose a release cutting based on the combination of two competition criteria (Johan’s A-value and canopy closure index, Gt). Our aim is to provide a human-independent, quantitatively and spatially explicit, release cutting prescription (Pretzsch, 2009). The proposed selective cutting (thinning) gives the opportunity to promote individual yew trees and at the same time remains the rest of the stand without intervention or to incorporate proposed cutting within already defined forest management plan.
Intensity of cutting is defined by the selection of threshold values (Fig. 8). In case of the high canopy closure based on the selection of threshold values and higher intensity of cutting indicated (up to 20–25%, Fig. 9a), we suggest to separate the intervention into two consecutive cuttings with minimum time interval of 5–7 years. Sex-differing cutting intensity, interval and frequency can differentiate between higher susceptibility of female trees to stress by photoinhibition (Robakowski et al., 2018) or their longer time under suppression in comparison with male trees. For example, the higher number of repeated cuttings of lower intensity in female tree surrounding would allow attaining the higher degree of their release from competition and their lower sudden exposition to light. Competition index represented by A-value (Johann, 1982) is partly based on the fact that dimensionally larger trees require more growing space. Therefore, with increase in height of central yew tree j, the A-value would also increase. In that context, at the fixed stand conditions, we would have expected the vitality of yew to decrease with an increase in yew tree height, while the interspecific competition too increased. The validity of proposed cutting is supported by the findings of Ruprecht et al., (2010), who reported that vitality of European yew is increasing with the increasing tree–tree distance and decreases with negative tree height differentiation.
The proposed cutting prescription in our study, however, neglects sex-related dimensional differences in yew trees, especially that female yew trees naturally have wider and shorter crowns than male trees. What needs to be mentioned is that selecting criteria are not species specific. The same cutting threshold value may indeed mean different levels of competition in case of different tree species. Species composition might be important to take into account because of different light transmissions. Canopies vary in composition and location above the forest floor, and in many cases, species-specific canopy transmission coefficients are not known. A more detailed estimation of competition may include additionally light transmission of neighbouring trees (Pretzsch, 2001). On the other hand, the study of Canham et al., (1999) indicates that the spatial configuration and sizes of canopy trees (and canopy openings among trees), rather than inter-specific differences in light transmission, are the major drivers of light conditions in understory.
. Conclusions
Study of interactions between the stem and crown status, sex and growth performance of rare European yew growing in limestone beech formations in Central–East Europe provides several new findings:
Divergent absolute growth trends between male and female trees and the pronounced negative effects of crown defoliation and stem damage on the short- and mid-term radial growth performance of European yew.
The long-term radial growth trend related to age and size of trees is sex specific. After yew trees reach the physiological maturity and environmental conditions that are optimal to regeneration, significant sex-related differences in growth variability appear.
The considerable recent growth decline in damaged European yew trees compared to undamaged ones is revealed also in relative terms, after the exclusion of size-related effects from analysis. Crown transparency status is a more important factor causing the relative growth decline than stem damage.
Basically, no sex-related differences in growth of trees showing crown transparency were found, possibly due to exhaustion of resources
Regarding the need of specific management of female trees, female trees in most cases grow slower and are of smaller size than male ones in absolute terms. Under less optimal environmental conditions, female trees are expected to be more susceptible to stress. Female trees revealed worsened radial growth in comparison with male ones in case of stem damage caused by herbivory. Thus, to enhance regeneration and growth of yew populations, making silvicultural treatments for female trees a priority is recommendable. The release cutting rules to release the focused trees from canopy shading are formulated by innovative way.
Our findings can improve the effectiveness of forest management and restoration activities in European temperate forests, where yew adults are threatened by higher degree of shading and herbivory pressure. Many local population of yew are fragmented and isolated by distance, which further stress the need to improve their ecological conditions. Because of fragmentation and declining numbers of healthy individuals that reached maturity, the capability to safeguard population genetic variability may weaken. Data on growth rates along with survivor-ship of different-sized individuals in relation to canopy closure would likely provide further insights regarding the light dependency of adult yew trees. Damage to yew adults and regeneration caused by wild ungulates represents an important ecological and silvicultural issue along its entire natural range. The slow growth imposes yew trees to bark stripping for very long time, but this period can be shortened by cutting treatments aimed to improve growth and size of yew trees (as bark stripping damage seems to be tree size related).
In this study, we provide clear conservation message on the possibility to improve status of yew adults in managed forests with scattered occurrence of yew and so to maintain high species diversity of species-rich rare habitat—limestone beech forests. In the future, research could be directed to study in more detail intra- and inter-species competition of yew and how the competition may affect the vitality of individual yew trees in response to current climate change.