Relative Sea Level Changes and Morphotectonic Implications Triggered by the Samos Earthquake of 30th October 2020


1
Faculty of Geology and Geoenvironment National and Kapodistrian University of Athens, Panepistimiopolis, 15774 Athens, Greece
2
Department of Geological Sciences, School of Mining Metallurgical Engineering, National Technical University of Athens, 15773 Athens, Greece
*
Author to whom correspondence should be addressed.
J. Mar. Sci. Eng. 2021, 9(1), 40; https://doi.org/10.3390/jmse9010040
Submission received: 26 November 2020
/
Revised: 26 December 2020
/
Accepted: 28 December 2020
/
Published: 3 January 2021
(This article belongs to the Special Issue Tectonics and Sea-Level Fluctuations)
Abstract
:On 30th October 2020, the eastern Aegean Sea was shaken by a Mw = 7.0 earthquake. The epicenter was located near the northern coasts of Samos island. This tectonic event produced an uplift of the whole island as well as several cases of infrastructure damage, while a small tsunami followed the mainshock. Underwater and coastal geological, geomorphological, biological observations and measurements were performed at the entire coast revealing a complex character for the uplift. At the northwestern part of the island, maximum vertical displacements of +35 ± 5 cm were recorded at the northwestern tip, at Agios Isidoros. Conversely, the southeastern part was known for its subsidence through submerged archaeological remains and former sea level standstills. The 2020 underwater survey unveiled uplifted but still drowned sea level indicators. The vertical displacement at the south and southeastern part ranges between +23 ± 5 and +8 ± 5 cm suggesting a gradual fading of the uplift towards the east. The crucial value of tidal notches, as markers of co-seismic events, was validated from the outcome of this study. The co-seismic response of Samos coastal zone to the 30th October earthquake provides a basis for understanding the complex tectonics of this area.
1. Introduction
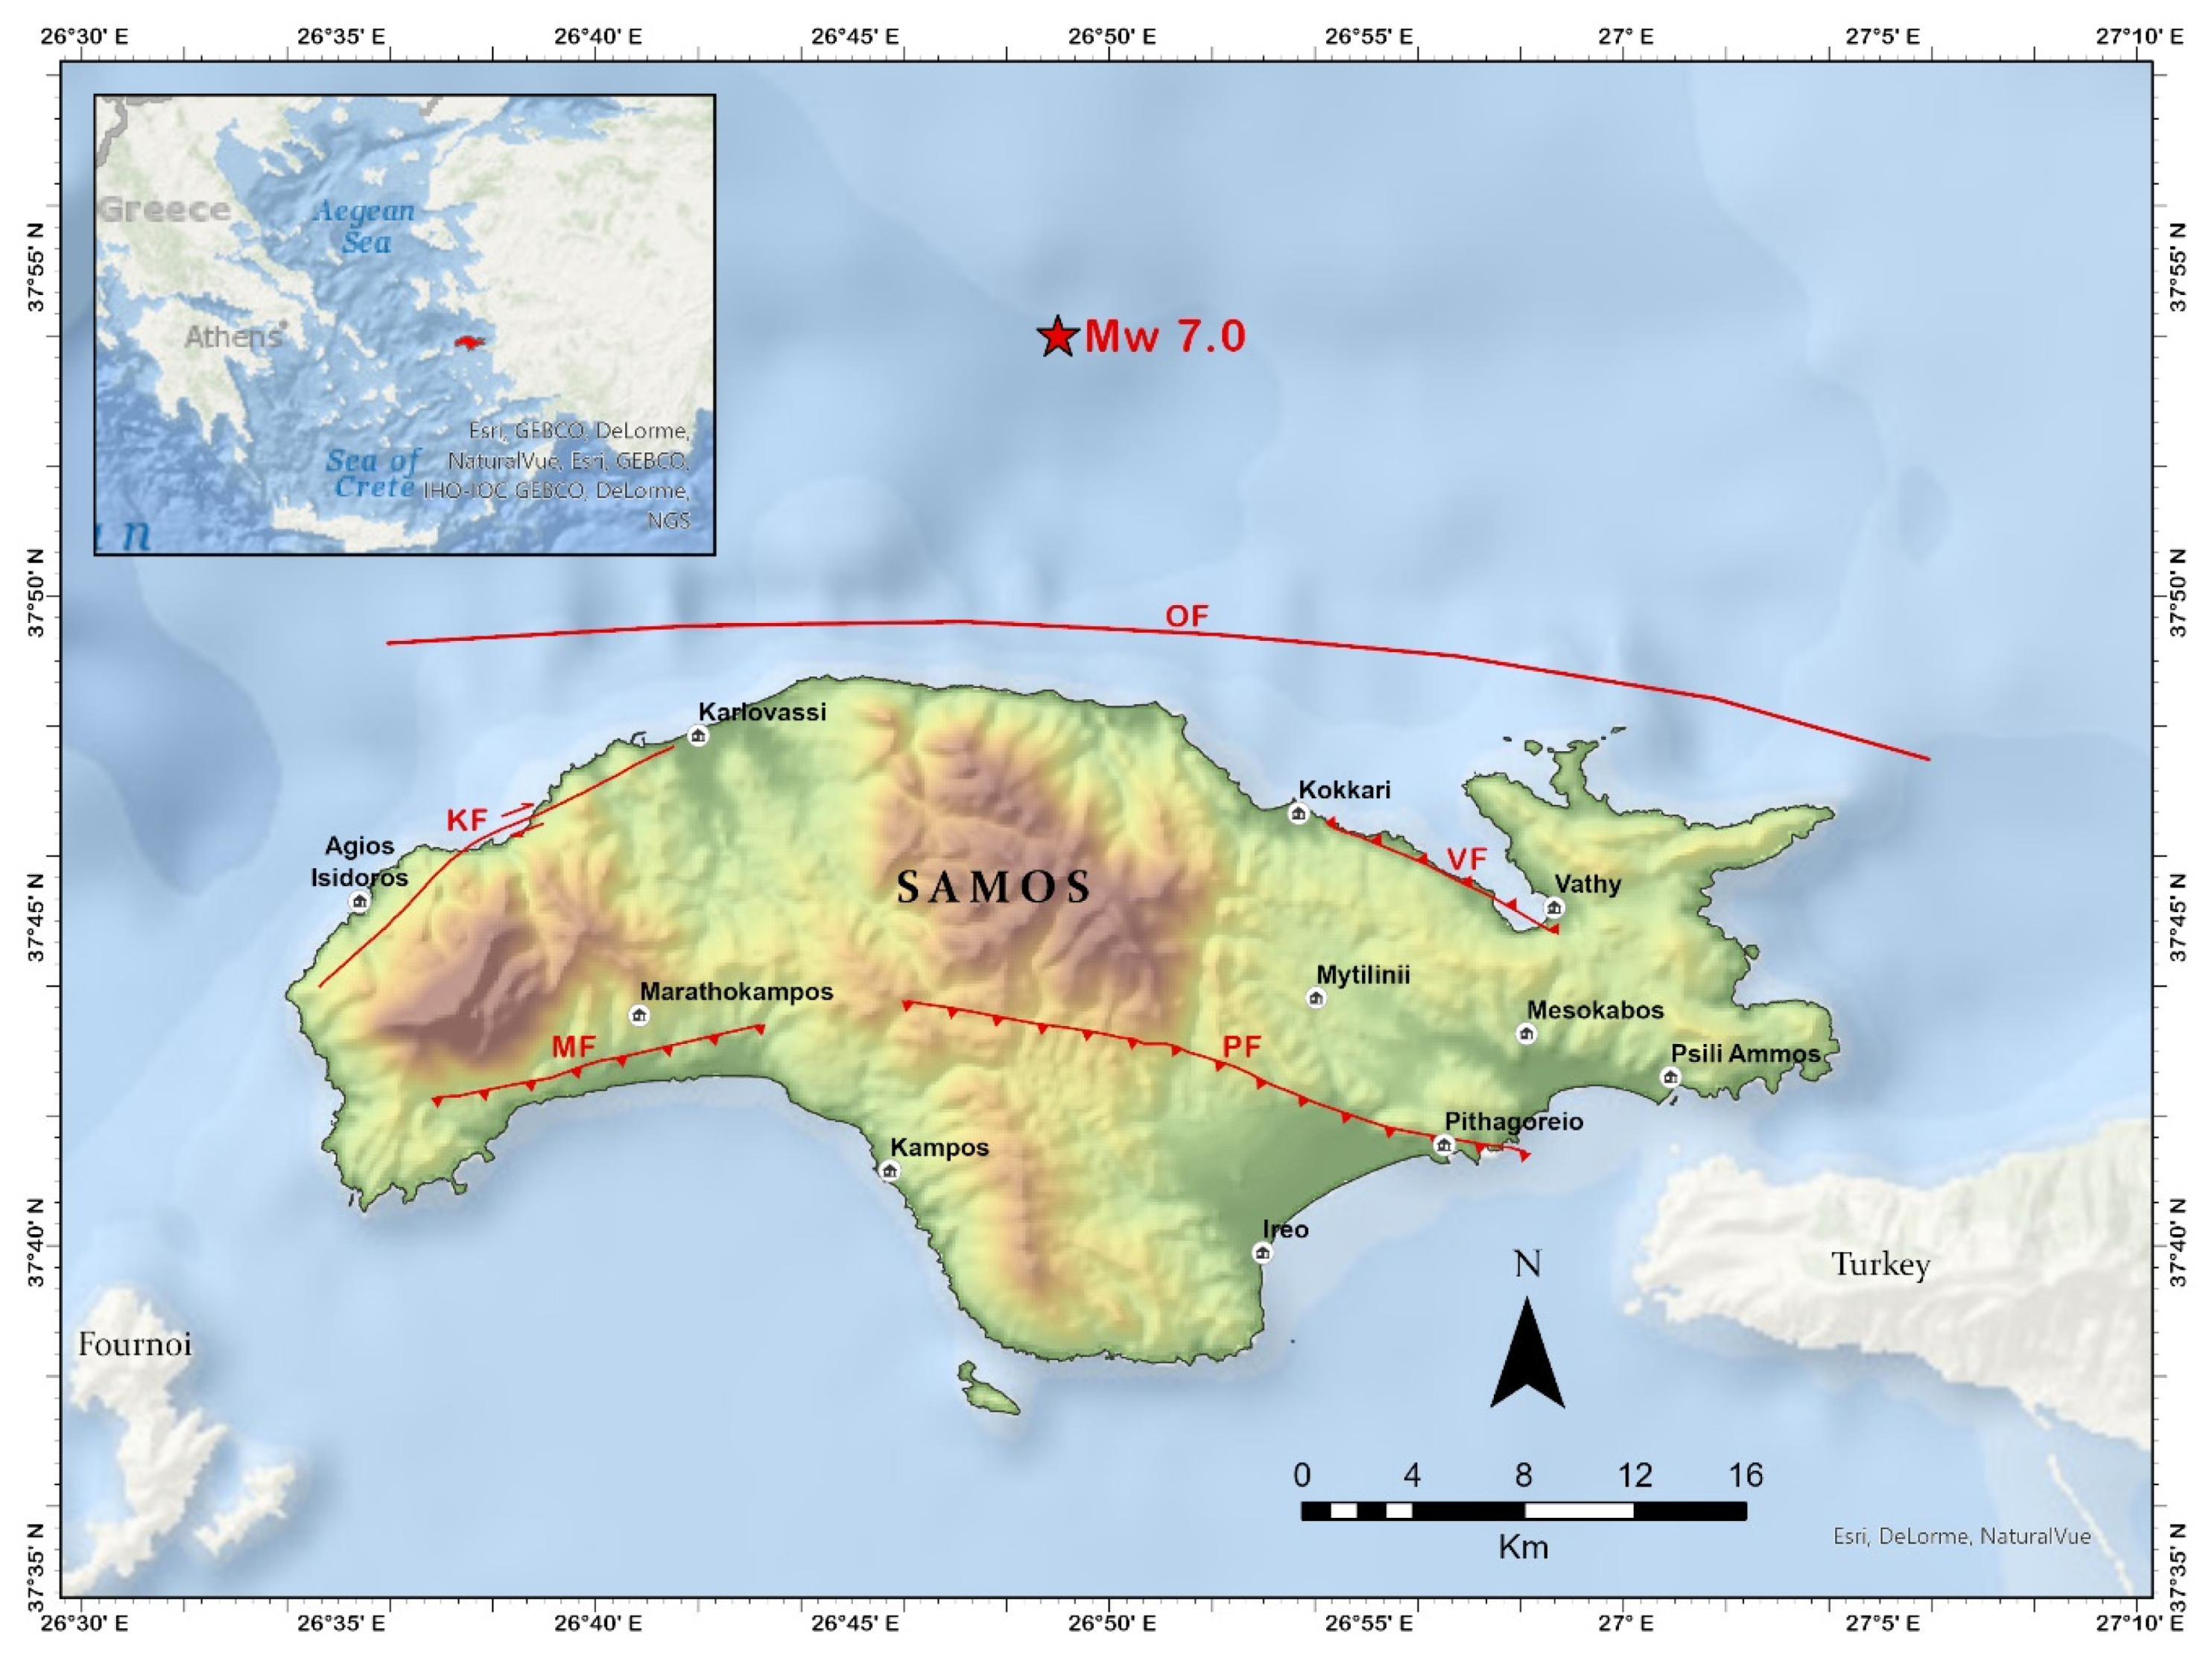
Samos Island is located in the mid-eastern Aegean Sea (Figure 1), less than 1.5 km from the west Anatolian coast. The Aegean Sea is considered one of the most active areas in the SE Mediterranean from a seismological perspective. It is delimited by the North Anatolian Fault to the north and the Hellenic subduction zone to the south [1,2]. The broader Samos region is situated in an interaction area between the Aegean microplate, the subducting African plate and the Anatolian microplate. The latter bears a westward extrusion into the Aegean Sea due to its collision with the Arabian Plate at a fast rate along the North Anatolian Fault since 5 Ma [3,4,5,6,7,8]. This regime affecting Samos is characterized by a N-S to NNE-SSW trending extension producing normal faults [9,10] and earthquakes. These faults exhibit an E-W trending close to Samos, whereas an oblique-normal motion is revealed at the opposite Turkish shores. The current extension began in Pliocene-Quaternary [11] and resulted in the reactivation of older fault structures striking NE-SW and NW-SE [11].
Samos is located on a shallow plateau that extends from Mt. Samsun Dağı peninsula, with which it was connected during the Pliocene- Pleistocene [13]. The island lies at the western edge of an area with intense earthquakes and seismic faulting, along the Greater Menderes River [14,15]. The island’s geology comprises of the metamorphic basement, an ophiolite sequence, Miocene-Pliocene sediments and volcanic rocks [11]. The metamorphic basement is composed of four tectono-metamorphic units [10]. Kerketeas marbles are the lowermost unit, which outcrop at the western part of Samos. The Ampelos unit overthrusts the latter and spans in the central part of the island. The overlain Selçuk nappe takes place in the center of the island [16] and the Vourliotes nappe lies at the eastern Samos, representing the upper metamorphic unit (mainly schists and marbles). Additionally, the Miocene-Pliocene basins of Samos cover a large area of the island [17,18].
The geomorphology of Samos island is influenced by the WNW-ESE tectonic activity as the main basin of the island, smaller valleys and the drainage network are developed parallel to this direction [12]. The coast of Samos is partly controlled by faulting (Figure 1) [12]. Rather linear coastlines are formed in the same direction of the main coastal and offshore faults. Offshore, North Samos fault (Figure 1) defines two different geomorphological regions, which are the island itself and the deep Samos depression [12]. Inland, the Pithagoreio normal fault, striking WNW–ESE and dipping south at 45°, is expressed in various outcrops where slickensides are preserved (Figure 1) and controls this area’s morphology [12].
The earliest historical earthquake in Samos dates back to 1766, while during the period 1700–1799, eight seismic events have struck the island (Hellenic Macroseismic database after [19]; http://macroseismology.geol.uoa.gr/query_eq/). Moreover, a total of 416 earthquakes affected Samos in the 19th century [19]. Nevertheless, ancient earthquakes, such as the 200 BC event, are also known [9].
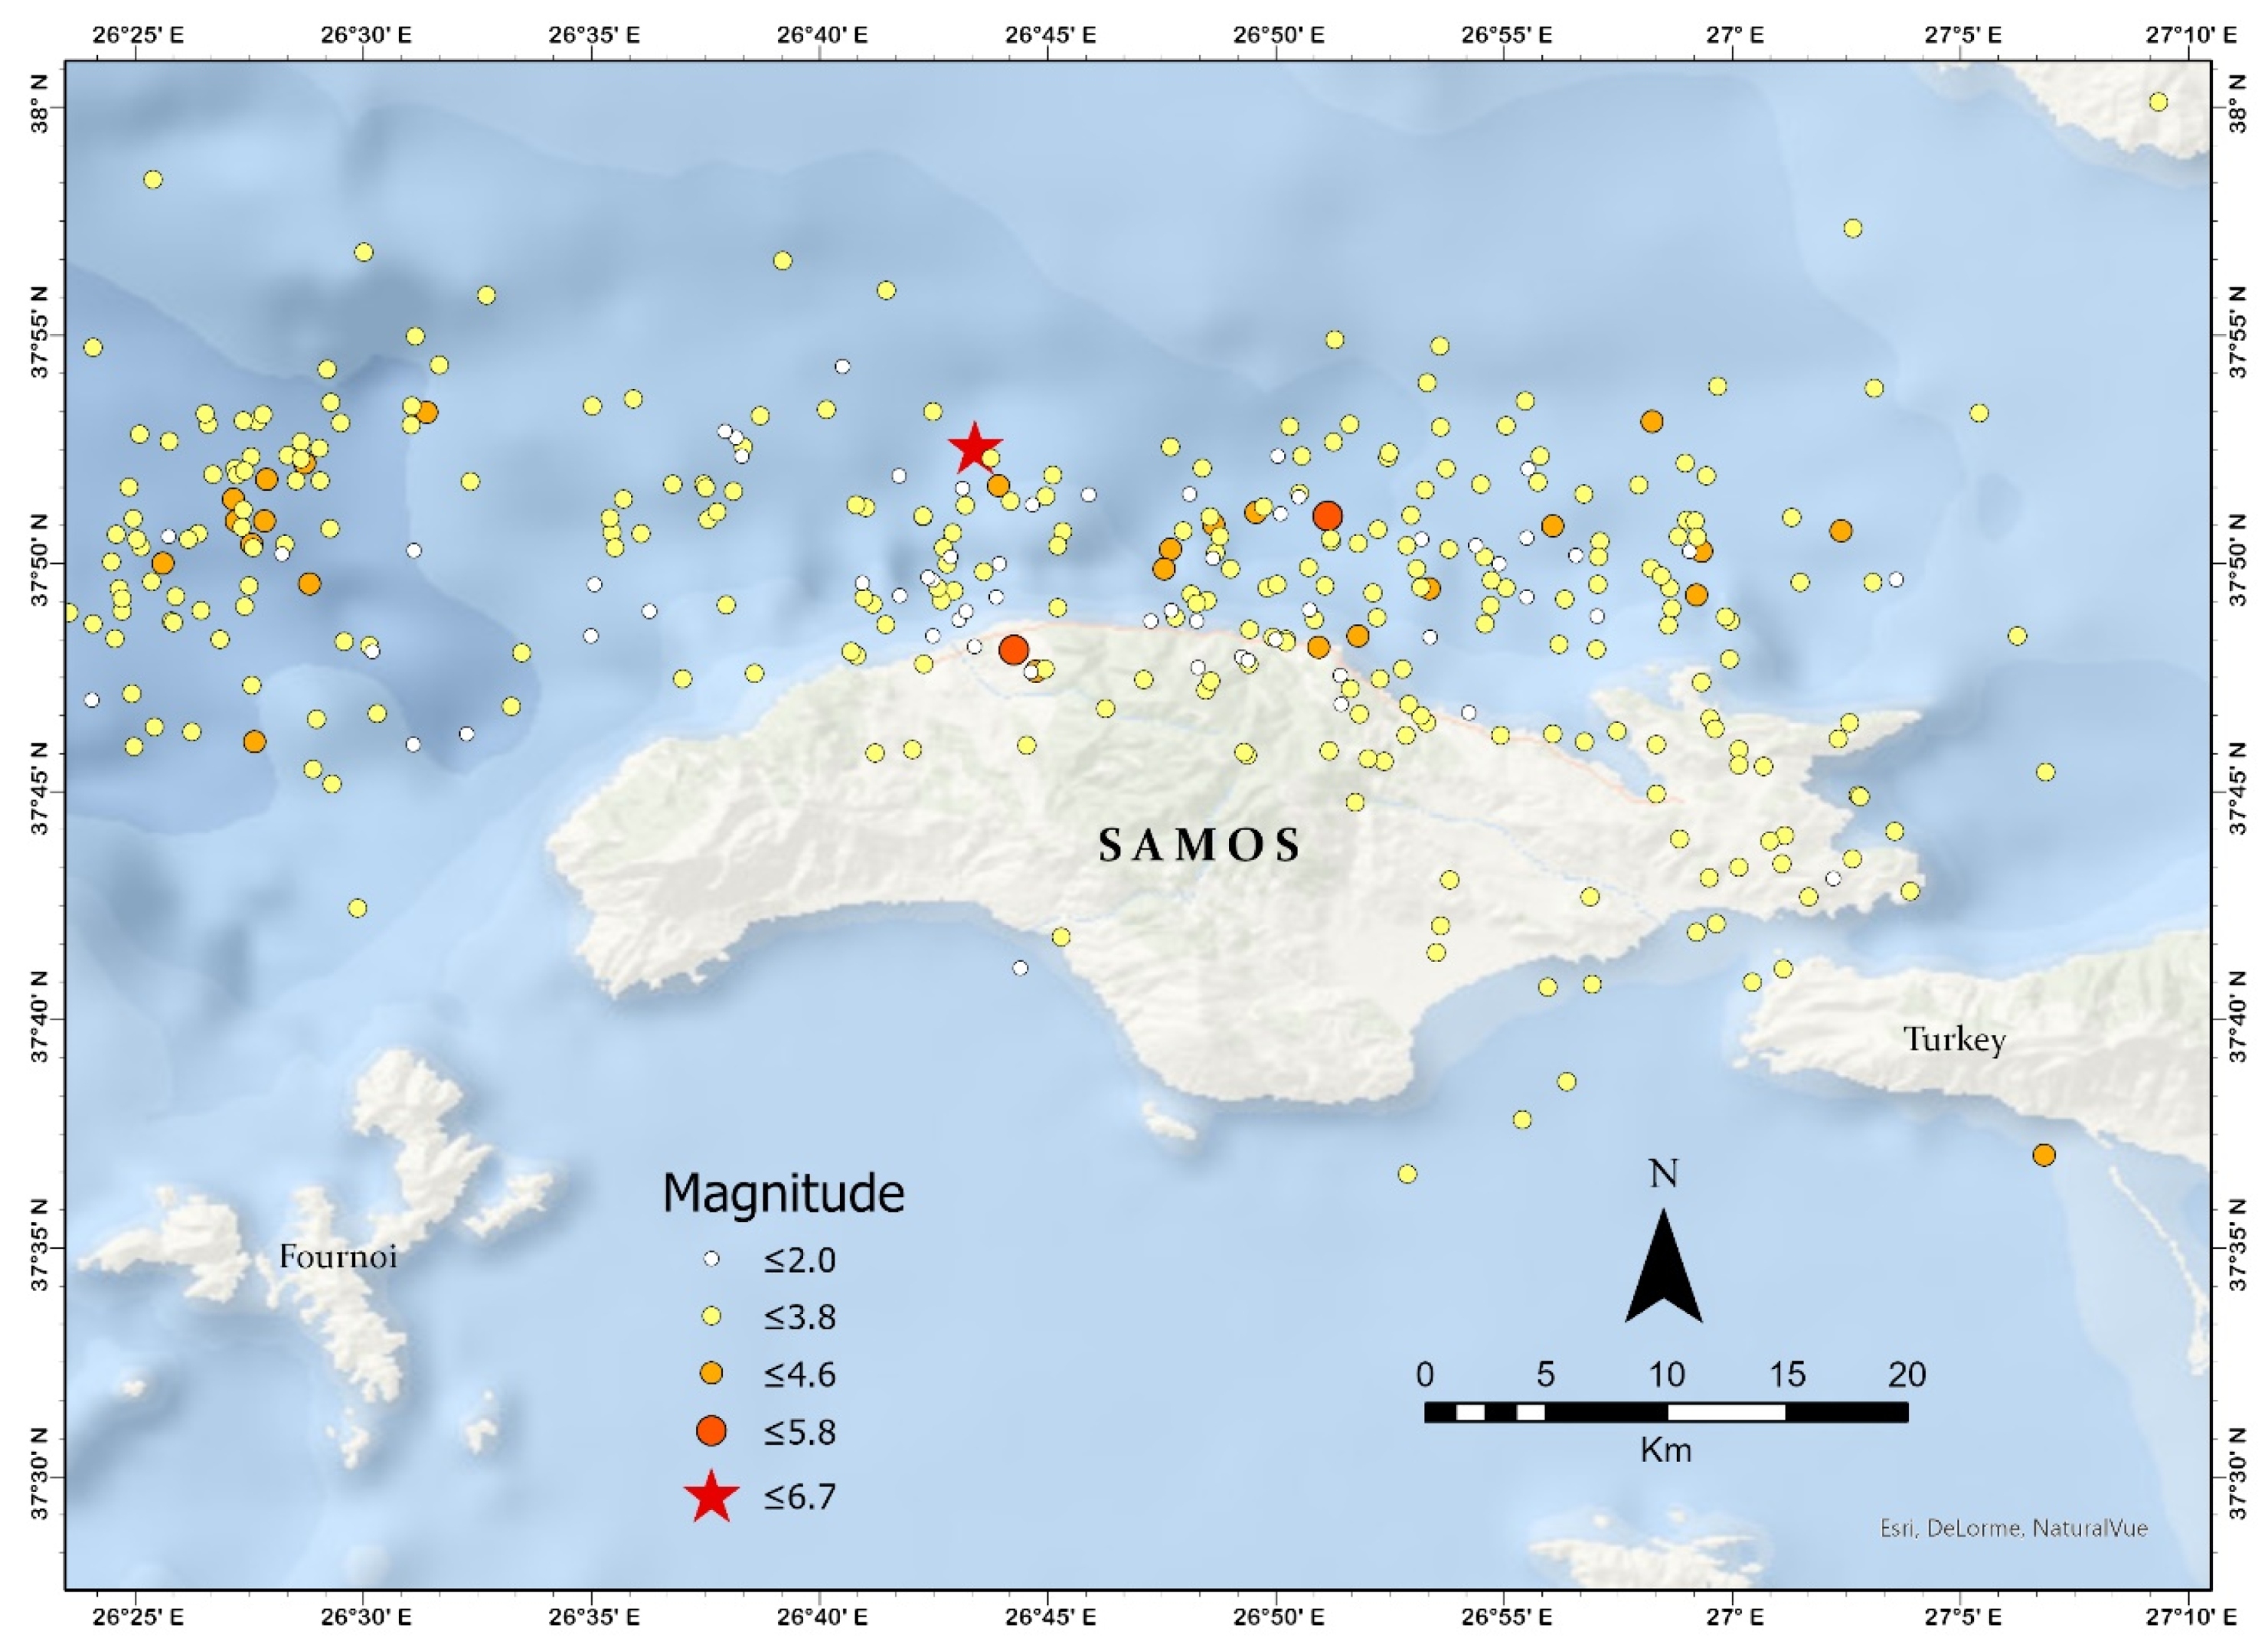
On 30th October 2020 11:51 GTM, an earthquake of Mw = 7.0 (according to EMSC-CSEM) took place north of Samos island (37.88° N, 26.71 E). According to preliminary reports, the focal mechanism of the mainshock was normal faulting of E-W strike [20,21]. The ruptured fault, 36 km long and 18 km wide, slipped for 1.8 m [22]. On Samos, two teenagers were killed while returning from school to their home, nine persons were injured, and 1100 buildings were recorded as unsuitable for use. The temblor was far more devastating for Turkey, resulting in 116 casualties, more than 1034 injured persons and 20 reported building collapses in Izmir. Soon after the mainshock, a tsunami was triggered. Its impact affected the north coast of the island with 1.7 to 2 m recorded coastal inundation at Karlovasi (NW Samos) and Vathy (NE Samos) towns [23]. The latter was hit by a tsunami with two successive waves with 20’ time difference [23,24]. Three hours after the mainshock at 15:14 UTC an aftershock of Mw = 5.2 occurred and by 20 November 2020, more than 380 aftershocks have been recorded (National Observatory of Athens; Seismological Laboratory of NKUA) (Figure 2).
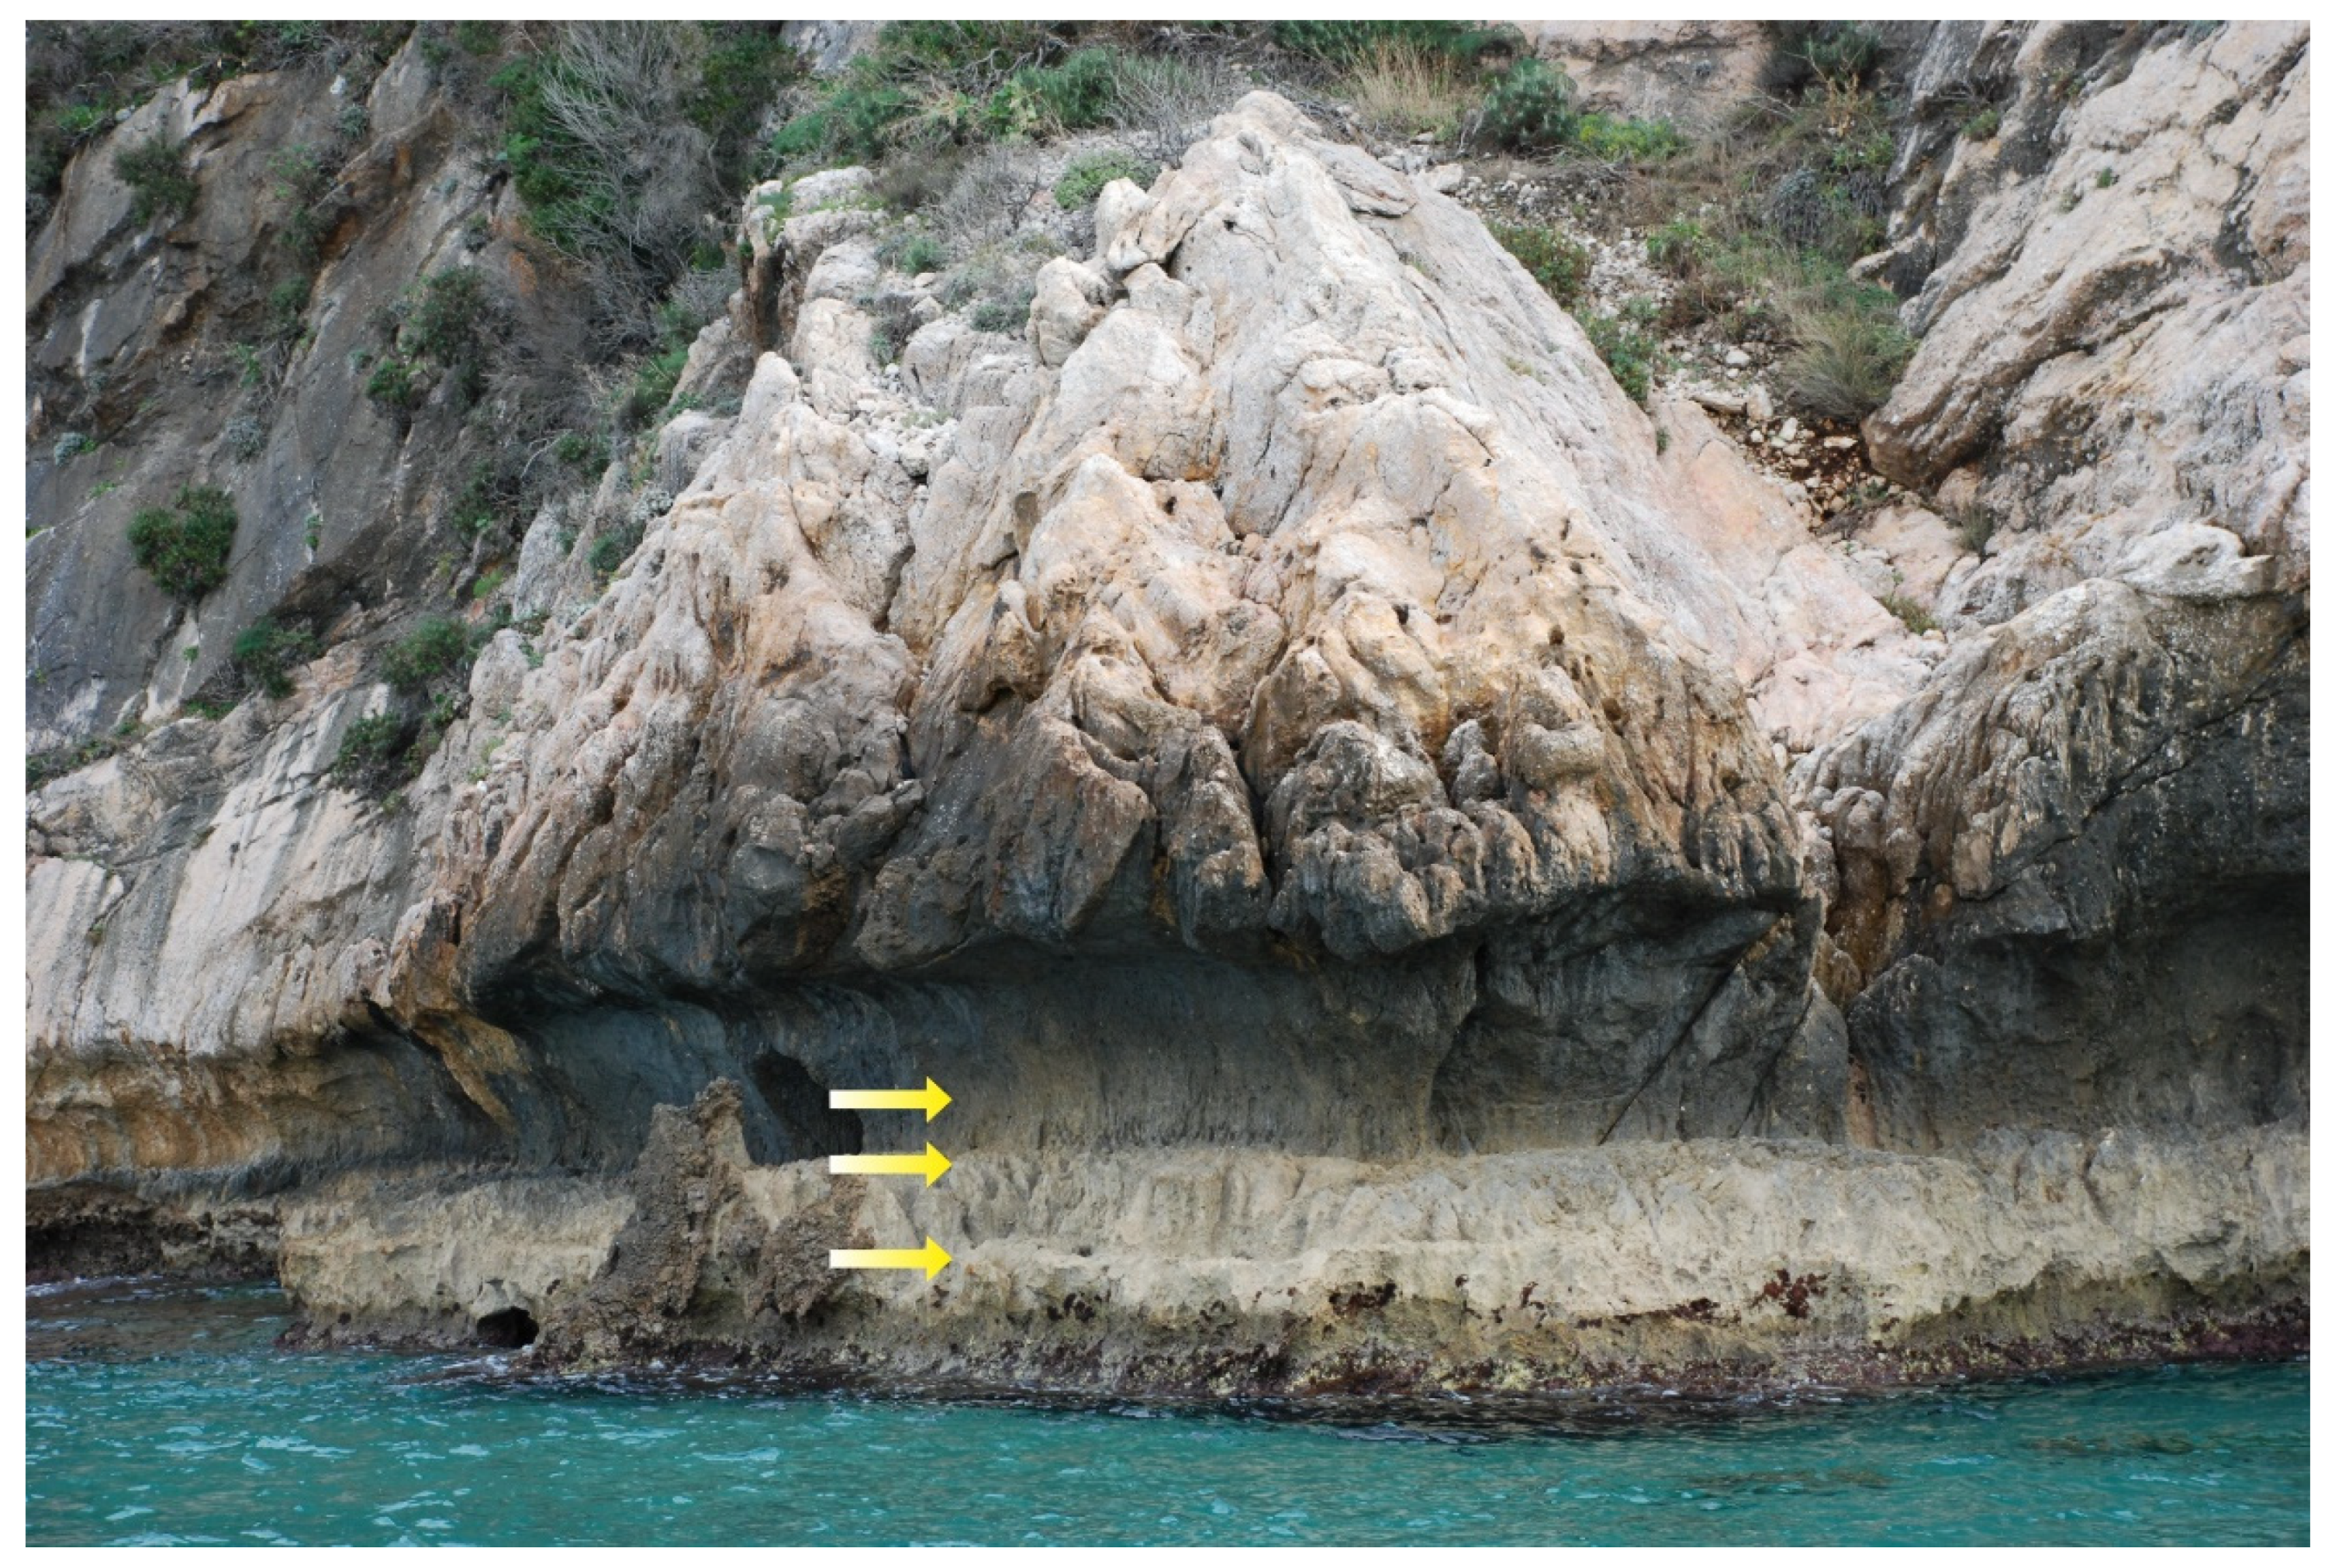
Evidence of uplift as a result of past earthquakes has been noted in the past mainly from tidal notches and benches [15,25] at the northwestern coast of the island (Figure 3). Conversely, on the southeastern coast, subsidence has been noted based on the presence of submerged geological, geomorphological and archaeological indicators [15,25,26,27,28,29].
This research aims to re-examine various sea level indicators in Samos island by comparing past with new measurements in order to understand and quantify the co-seismic movements caused by the Mw = 7.0 seismic event of 30th October 2020 and shed light to the tectonic regime of the island.
2. Materials and Methods
Extensive fieldwork took place in April 2015 and November 2020 along the coastal zone of Samos island, both on the coast and underwater. The underwater survey, in both years, was accomplished by snorkeling and free diving equipment, while a boat was used in order to facilitate access at all sites and establish their continuity. The sites examined in 2015 were re-visited and re-mapped in early November 2020, along with additional sites around the island, in order to document possible vertical changes after the earthquake of 2020. In addition, sites with evidence of former uplift reported by Stiros et al. [15], were also measured in order to better quantify the new vertical displacements.
Former sea level positions were deduced from various sea level indicators, such as tidal notches, benches and biological indicators. The profile of the notches was recorded in detail during field work and in particular their height, inward depth and vertex depth from sea level were measured according to [30] and [31]. The inward depth of notch profiles is considered to estimate the duration of sea level stability based on rates of intertidal erosion for the Mediterranean region (0.2–1 mm/yr) [32], while the notch height was used to determine whether their profile is related to gradual sea level changes or co-seismic vertical displacements [31,33]. Biological indicators included measurements on freshly exposed limpets, vermetids and dead red algae of the midlittoral zone [34] or by the characteristic color belts of microbial origin on coastal rocks [35].
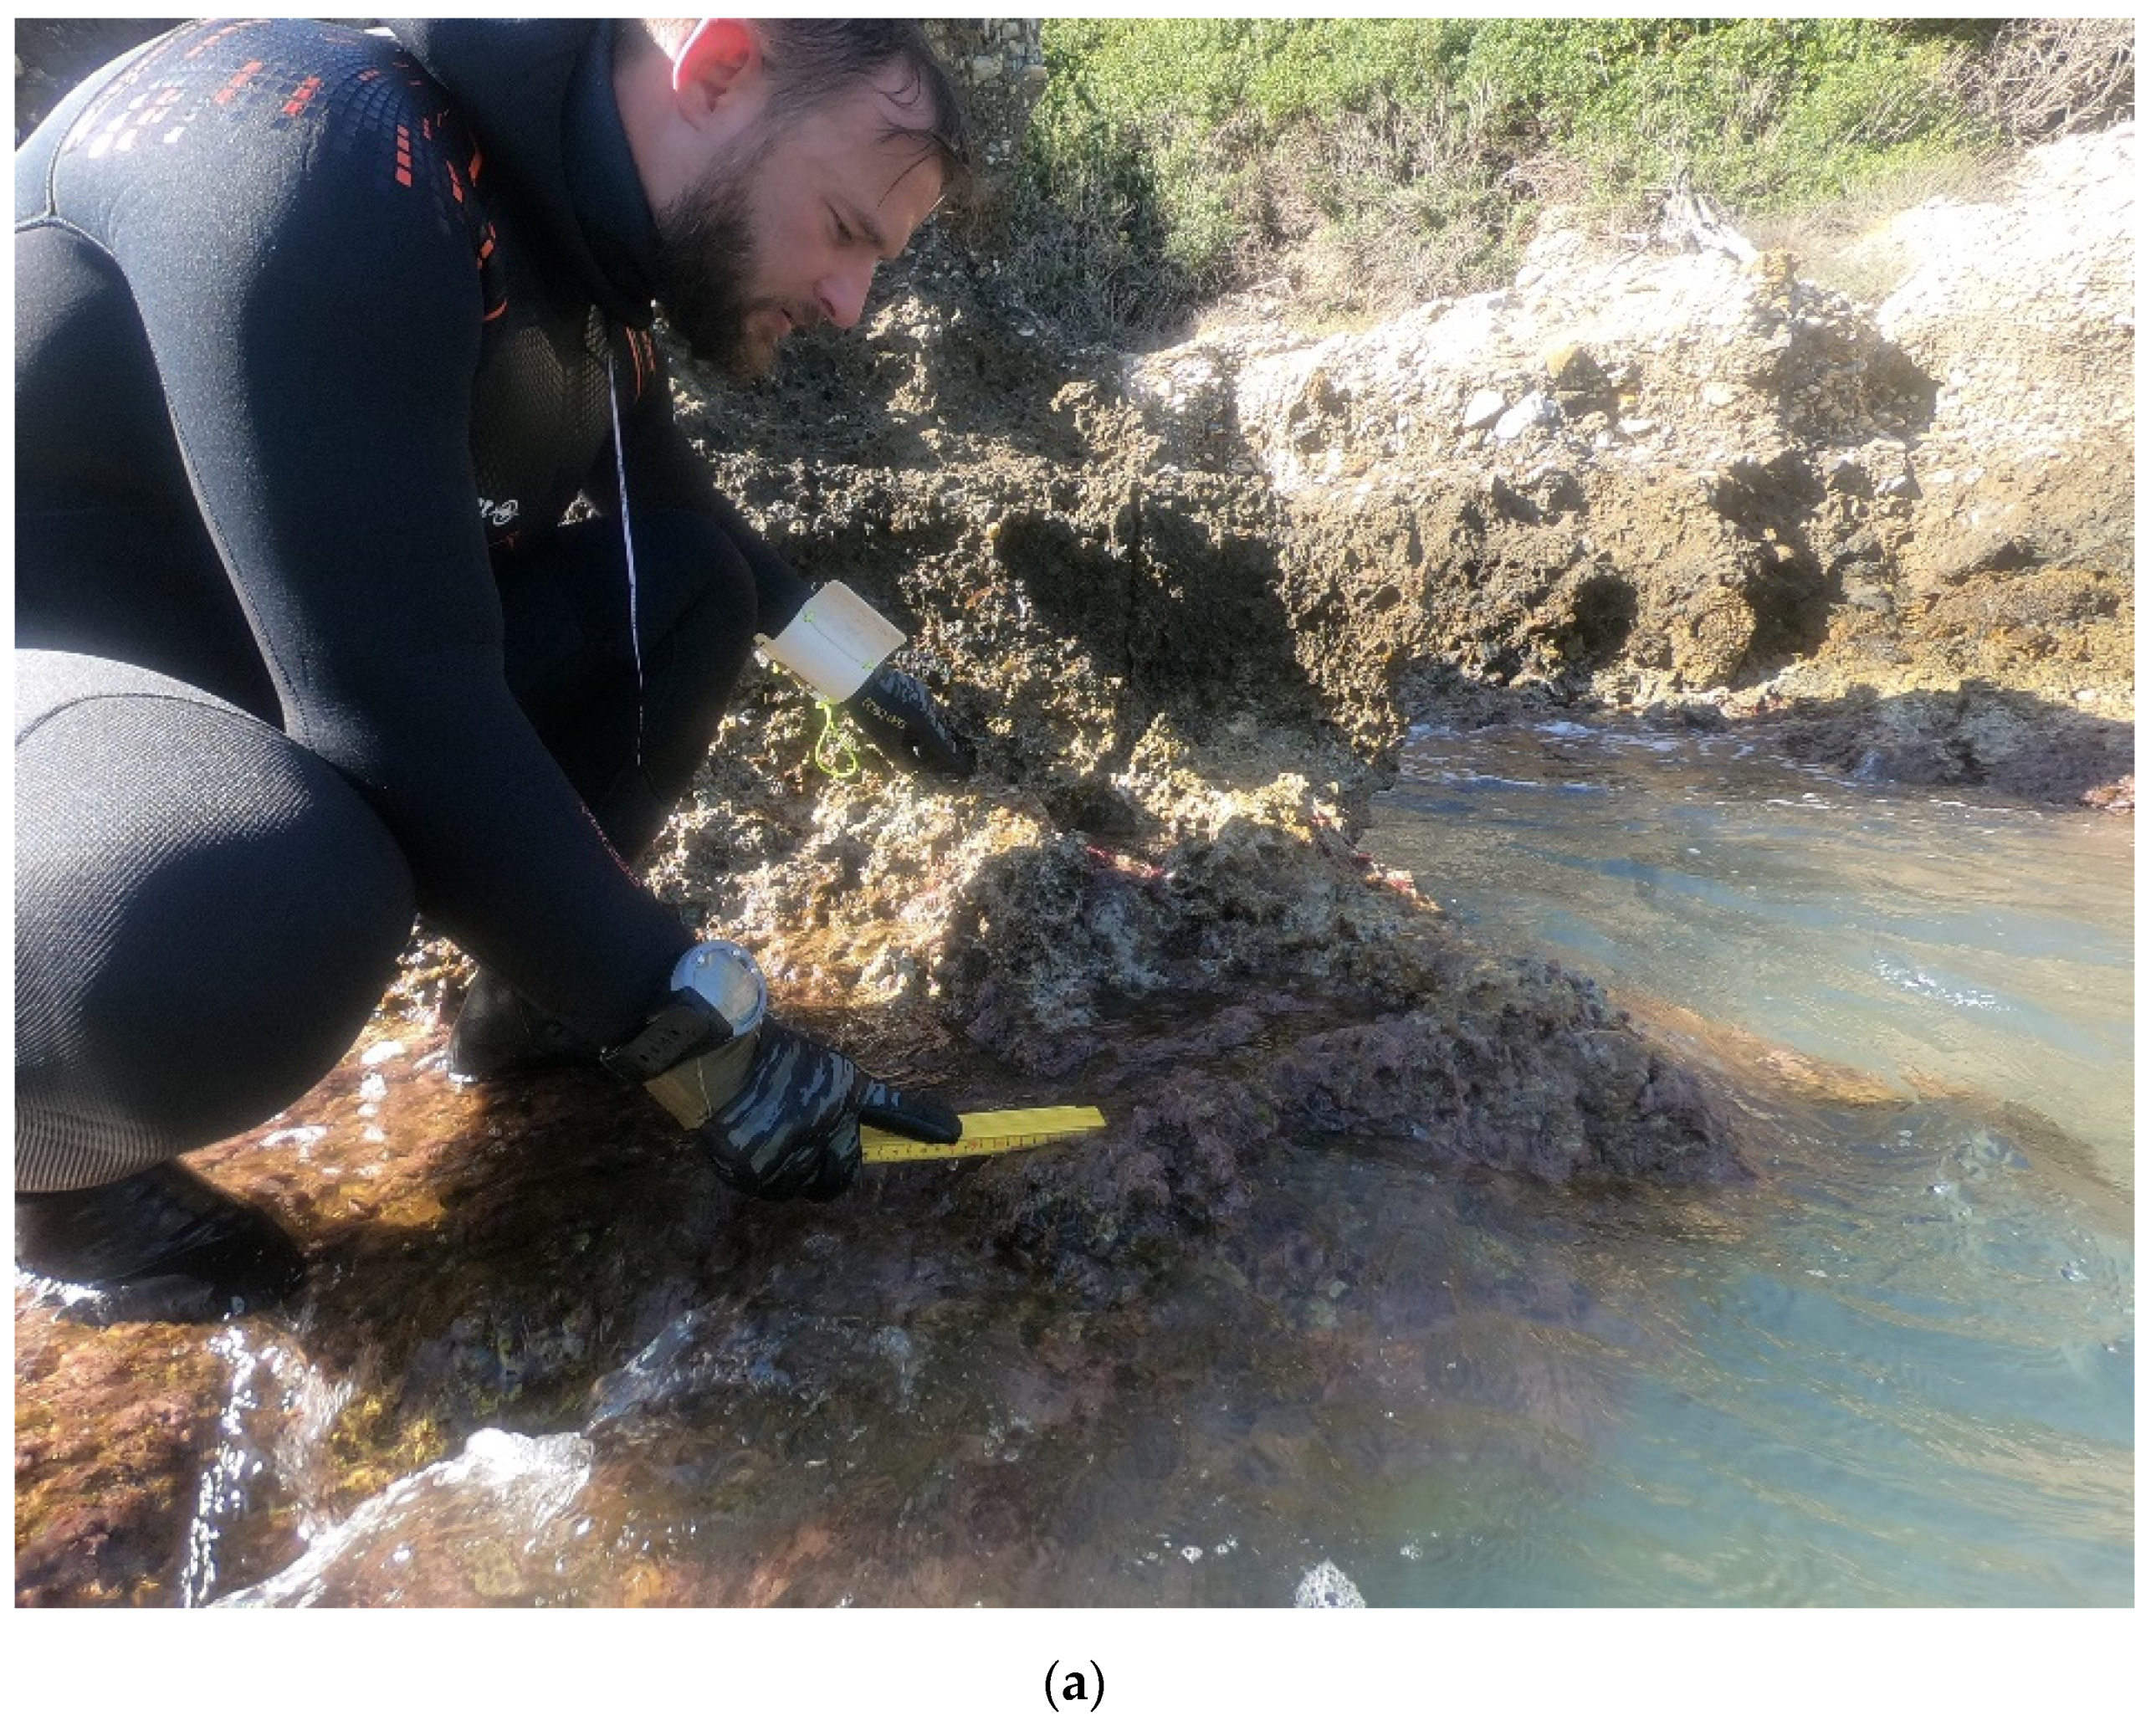
Measurements were accomplished with calm sea conditions and the accuracy was improved by multiple measurements on each location. Measurements in tidal notches accessible only through swimming were carried out with both a wrist depth gauge and a folding meter of rigid parts. Ten measurements were taken at each site and the average value was used, providing a vertical accuracy of ±5 cm. Measurements in land-reached sites were accomplished using a DGPS-GNSS, providing a vertical accuracy of ±2 cm. DGPS-GNSS measurements in the land-reached sites were compared with the average of ten measurements with a folding meter of rigid parts, to assess the accuracy reported in our measurements. The supplementary table (Table S1) presents all measurements and the method used for each measurement. As shown in Table S1, in most cases the coefficient of standard deviation is lower than 1, suggesting a distribution of low variance. For all the accomplished measurements using different tools, we consider an error range of ±5 cm. Geographic locations of measured sea level indicators are reported as Long/Lat coordinates with an average accuracy of 80 cm using GPS. Depth measurements were referred to the sea level at the time of measurement and subsequently corrected using tidal records from a nearby tidal device, provided by the Hellenic Navy Hydrographic Service (HNHS).
3. Results
Fieldwork results are summarized in Table 1, which includes the sites measured in two periods of fieldwork, i.e., April 2015 and November 2020 (Figure 4).
3.1. Sykia 1 (SA1)
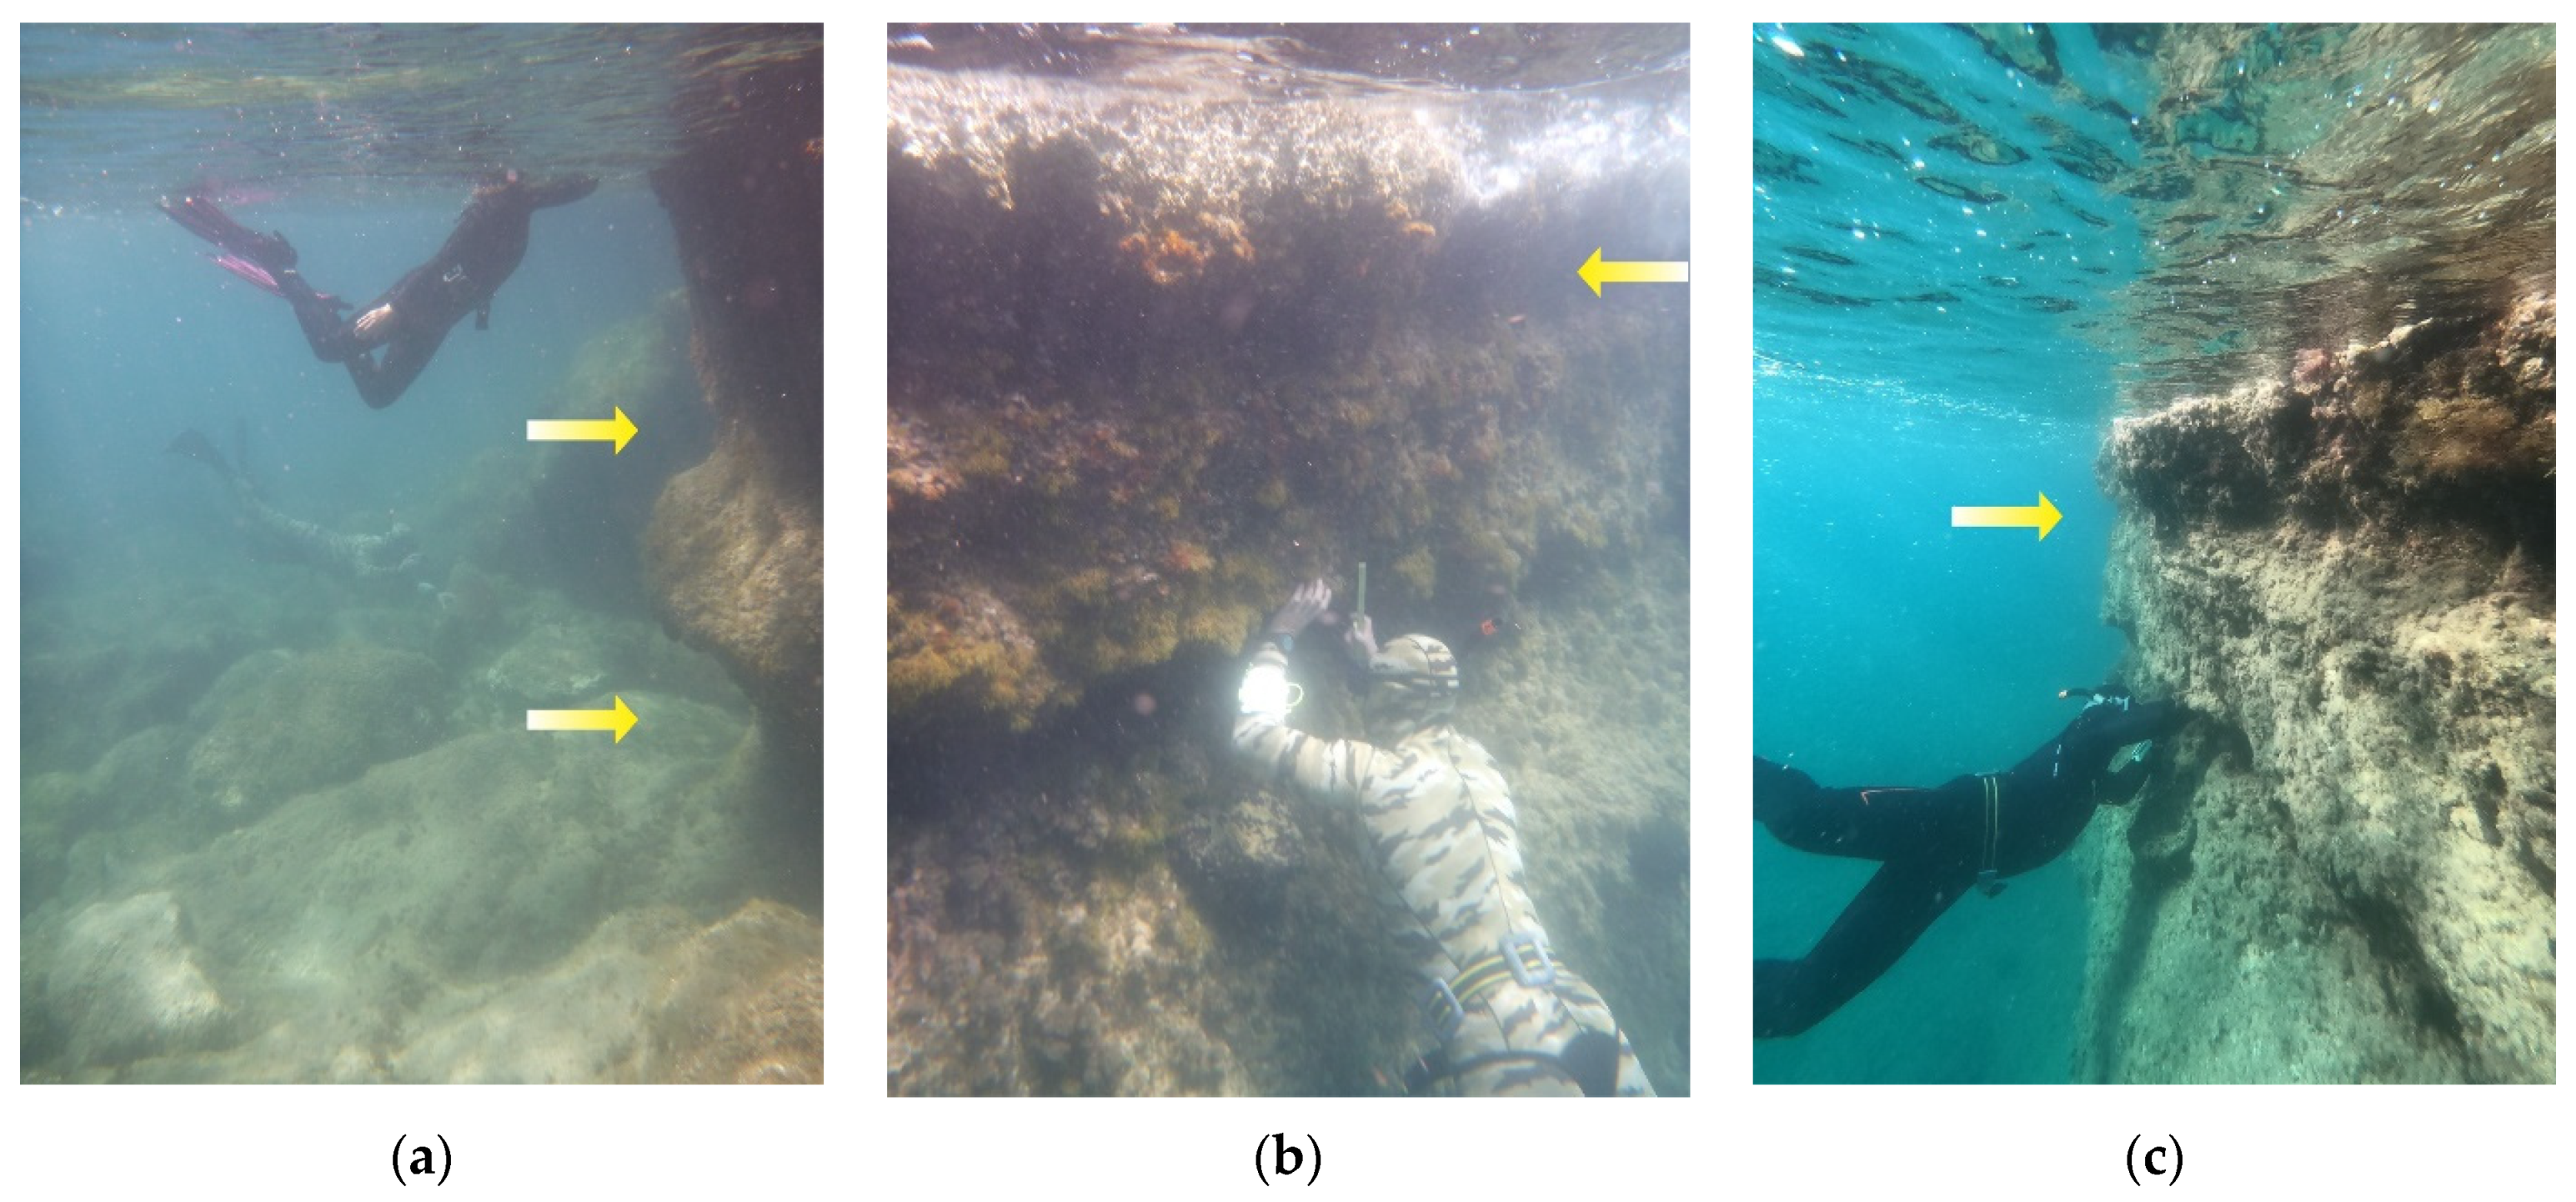
SA1 site is located 3 km east of Sykia Village, in the southernmost part of Samos Island. Marks of former sea levels were found on the carbonate cliffs. In 2015, three submerged tidal notches were found and measured at −80 ± 10 and −250 ± 10 cm (Figure 5a), respectively, along with a slightly submerged notch at −5 cm. In 2020, the latter was found raised at +18 ± 5 cm, suggesting an uplift of +23 ± 5cm.
3.2. Klima (SA9)
Approximately 1 km west of Klima Village (SE Samos), on a carbonate headland, two submerged notches were identified in 2015, an upper one at −20 ± 5 cm and a lower one at −115 ± 5 cm. During the 2020 fieldwork, the upper notch was measured at −21 ± 5 cm and a lower one at −120 ± 5 cm, suggesting no vertical displacement of this site since 2015 (Figure 5b,c). Based on intertidal erosion rates (see materials and methods), the two submerged notches suggest a stable sea level for approximately 1–2 centuries to one millennium. The lower notch has been co-seismically submerged due to a former earthquake highlighting the complex vertical displacements of the island.
3.3. Posidonio (SA10)
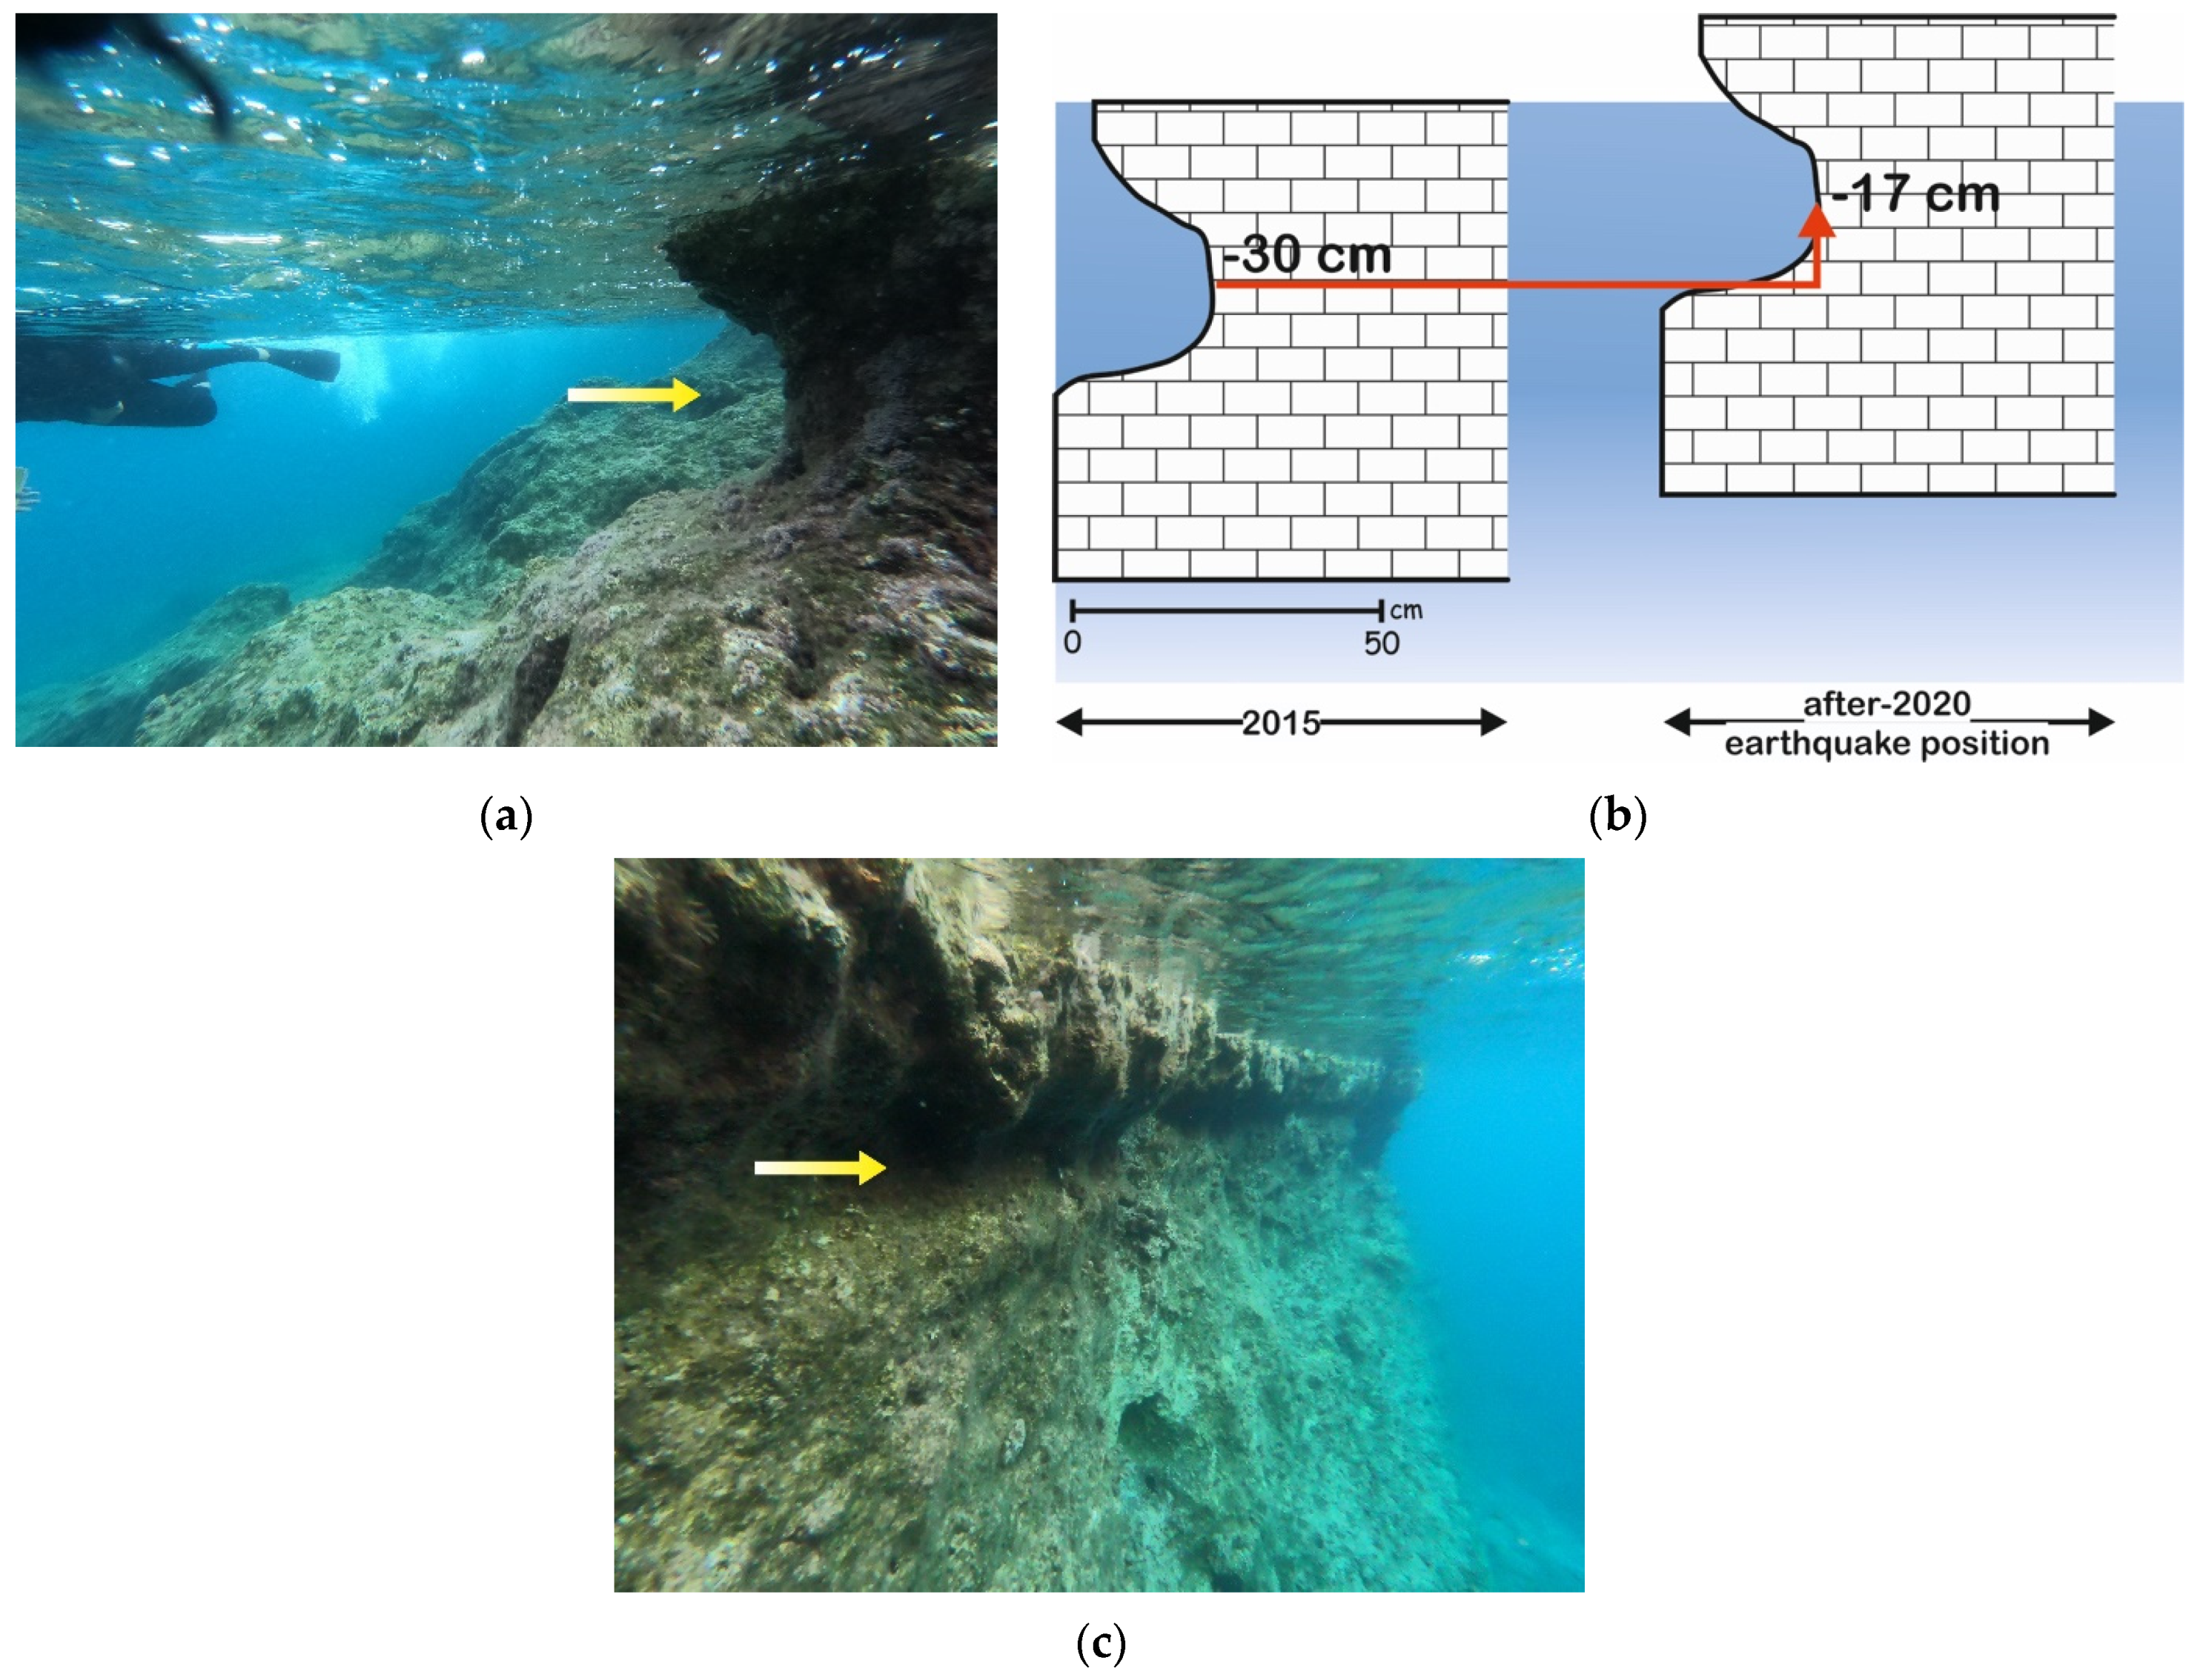
At this site, located about 1 km east of Posidonio Village (ESE Samos), in 2015 one submerged notch was measured at −30 ± 5 cm. Based on its profile characteristics, the sea level stood at the vertex level from one to eight centuries before it was drowned by a relative sea level rise. The same notch was recorded at −17 ± 5 cm in 2020, suggesting a +13 ± 5 cm uplift (Figure 6a,b).
3.4. Mourtia (SA15)
On the carbonate cliffs, about 1.2 km east of Mourtia beach (NE Samos), a submerged fossil shoreline through a tidal notch was identified and measured at −40 ± 5 cm in 2015. The same site was revisited in 2020 and the notch depth of −32 ± 5 cm was recorded implying a slight emergence of 8 ± 5 cm (Figure 6c). The notch is visible continuously for more than 1 km on the coast. Its inward depth corresponds to a sea level stability for one to nine centuries.
3.5. Kokkari (SA16)
Kokkari is located 8 km west of Vathy, at the northwestern coastal part of Mytilinii basin. At the port of the town, a +22 ± 5 cm uplift was measured based on the exposed midlittoral zone (uplifted midlittoral color belt of microbial origin [35]) at the vertical cliff of a small outcrop of Vourliotes marbles.
3.6. White (St. Nicholas) Chapel at Potami Beach (SA18 and SA19)
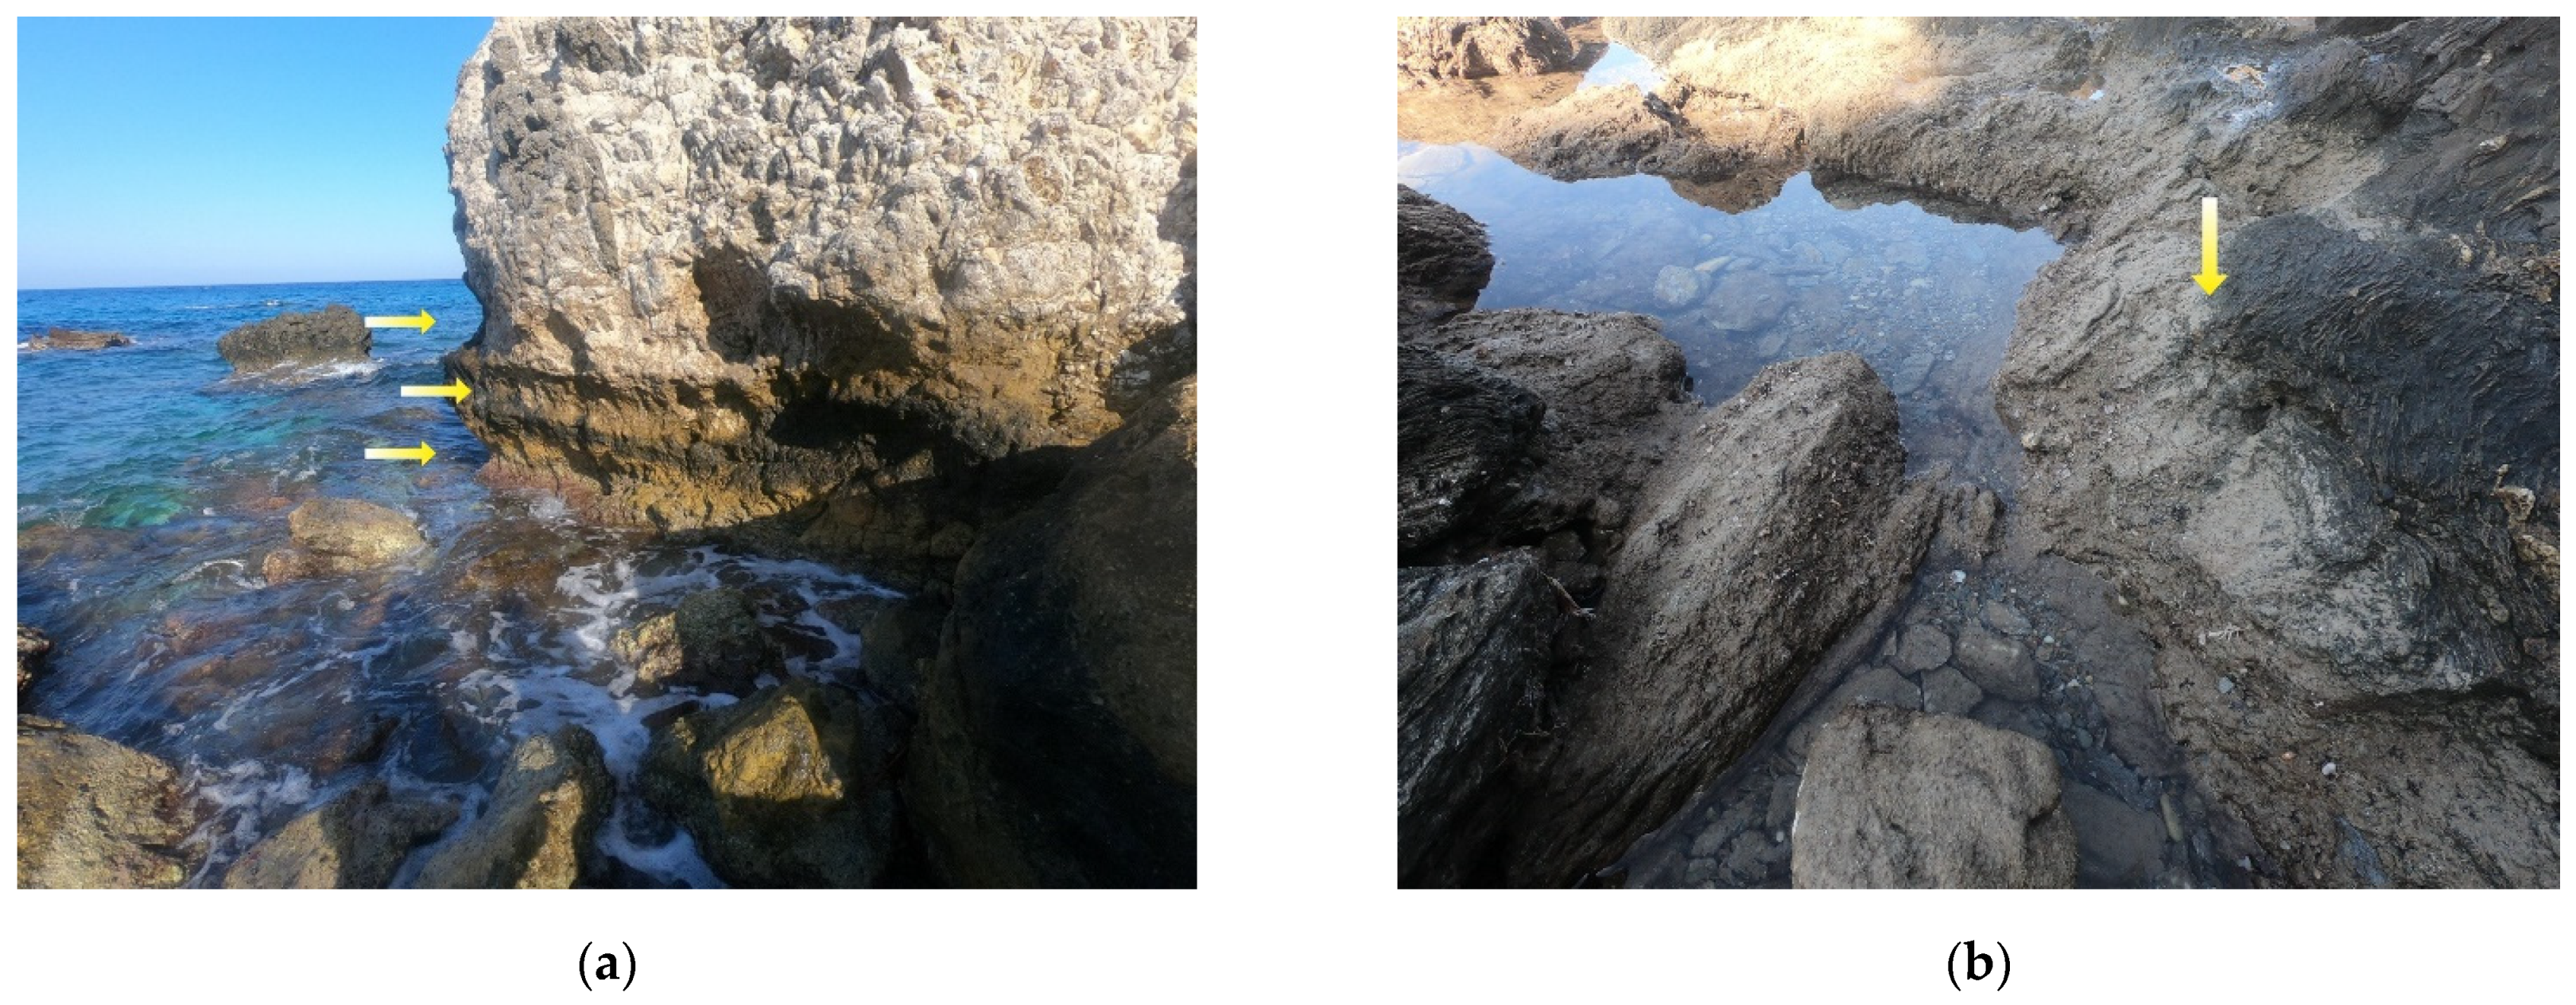
At the eastern part of the beach located east of White Chapel, there is evidence of three raised notches (SA18); however, their profiles are not well developed (Figure 7a). An uplift of +20 ± 5 cm was deduced based on the position of the lower notch and the exposed midlittoral zone.
At the western part of Potami Beach (west of White Chapel—site SA19), measurements at the exposed midlittoral zone were performed, supporting an uplift of +20 ± 5 cm (Figure 7b). The former midlittoral zone with the characteristic vegetation belt consisting of limpets and brown algae is now observed above present sea level.
3.7. Punta (SA21)
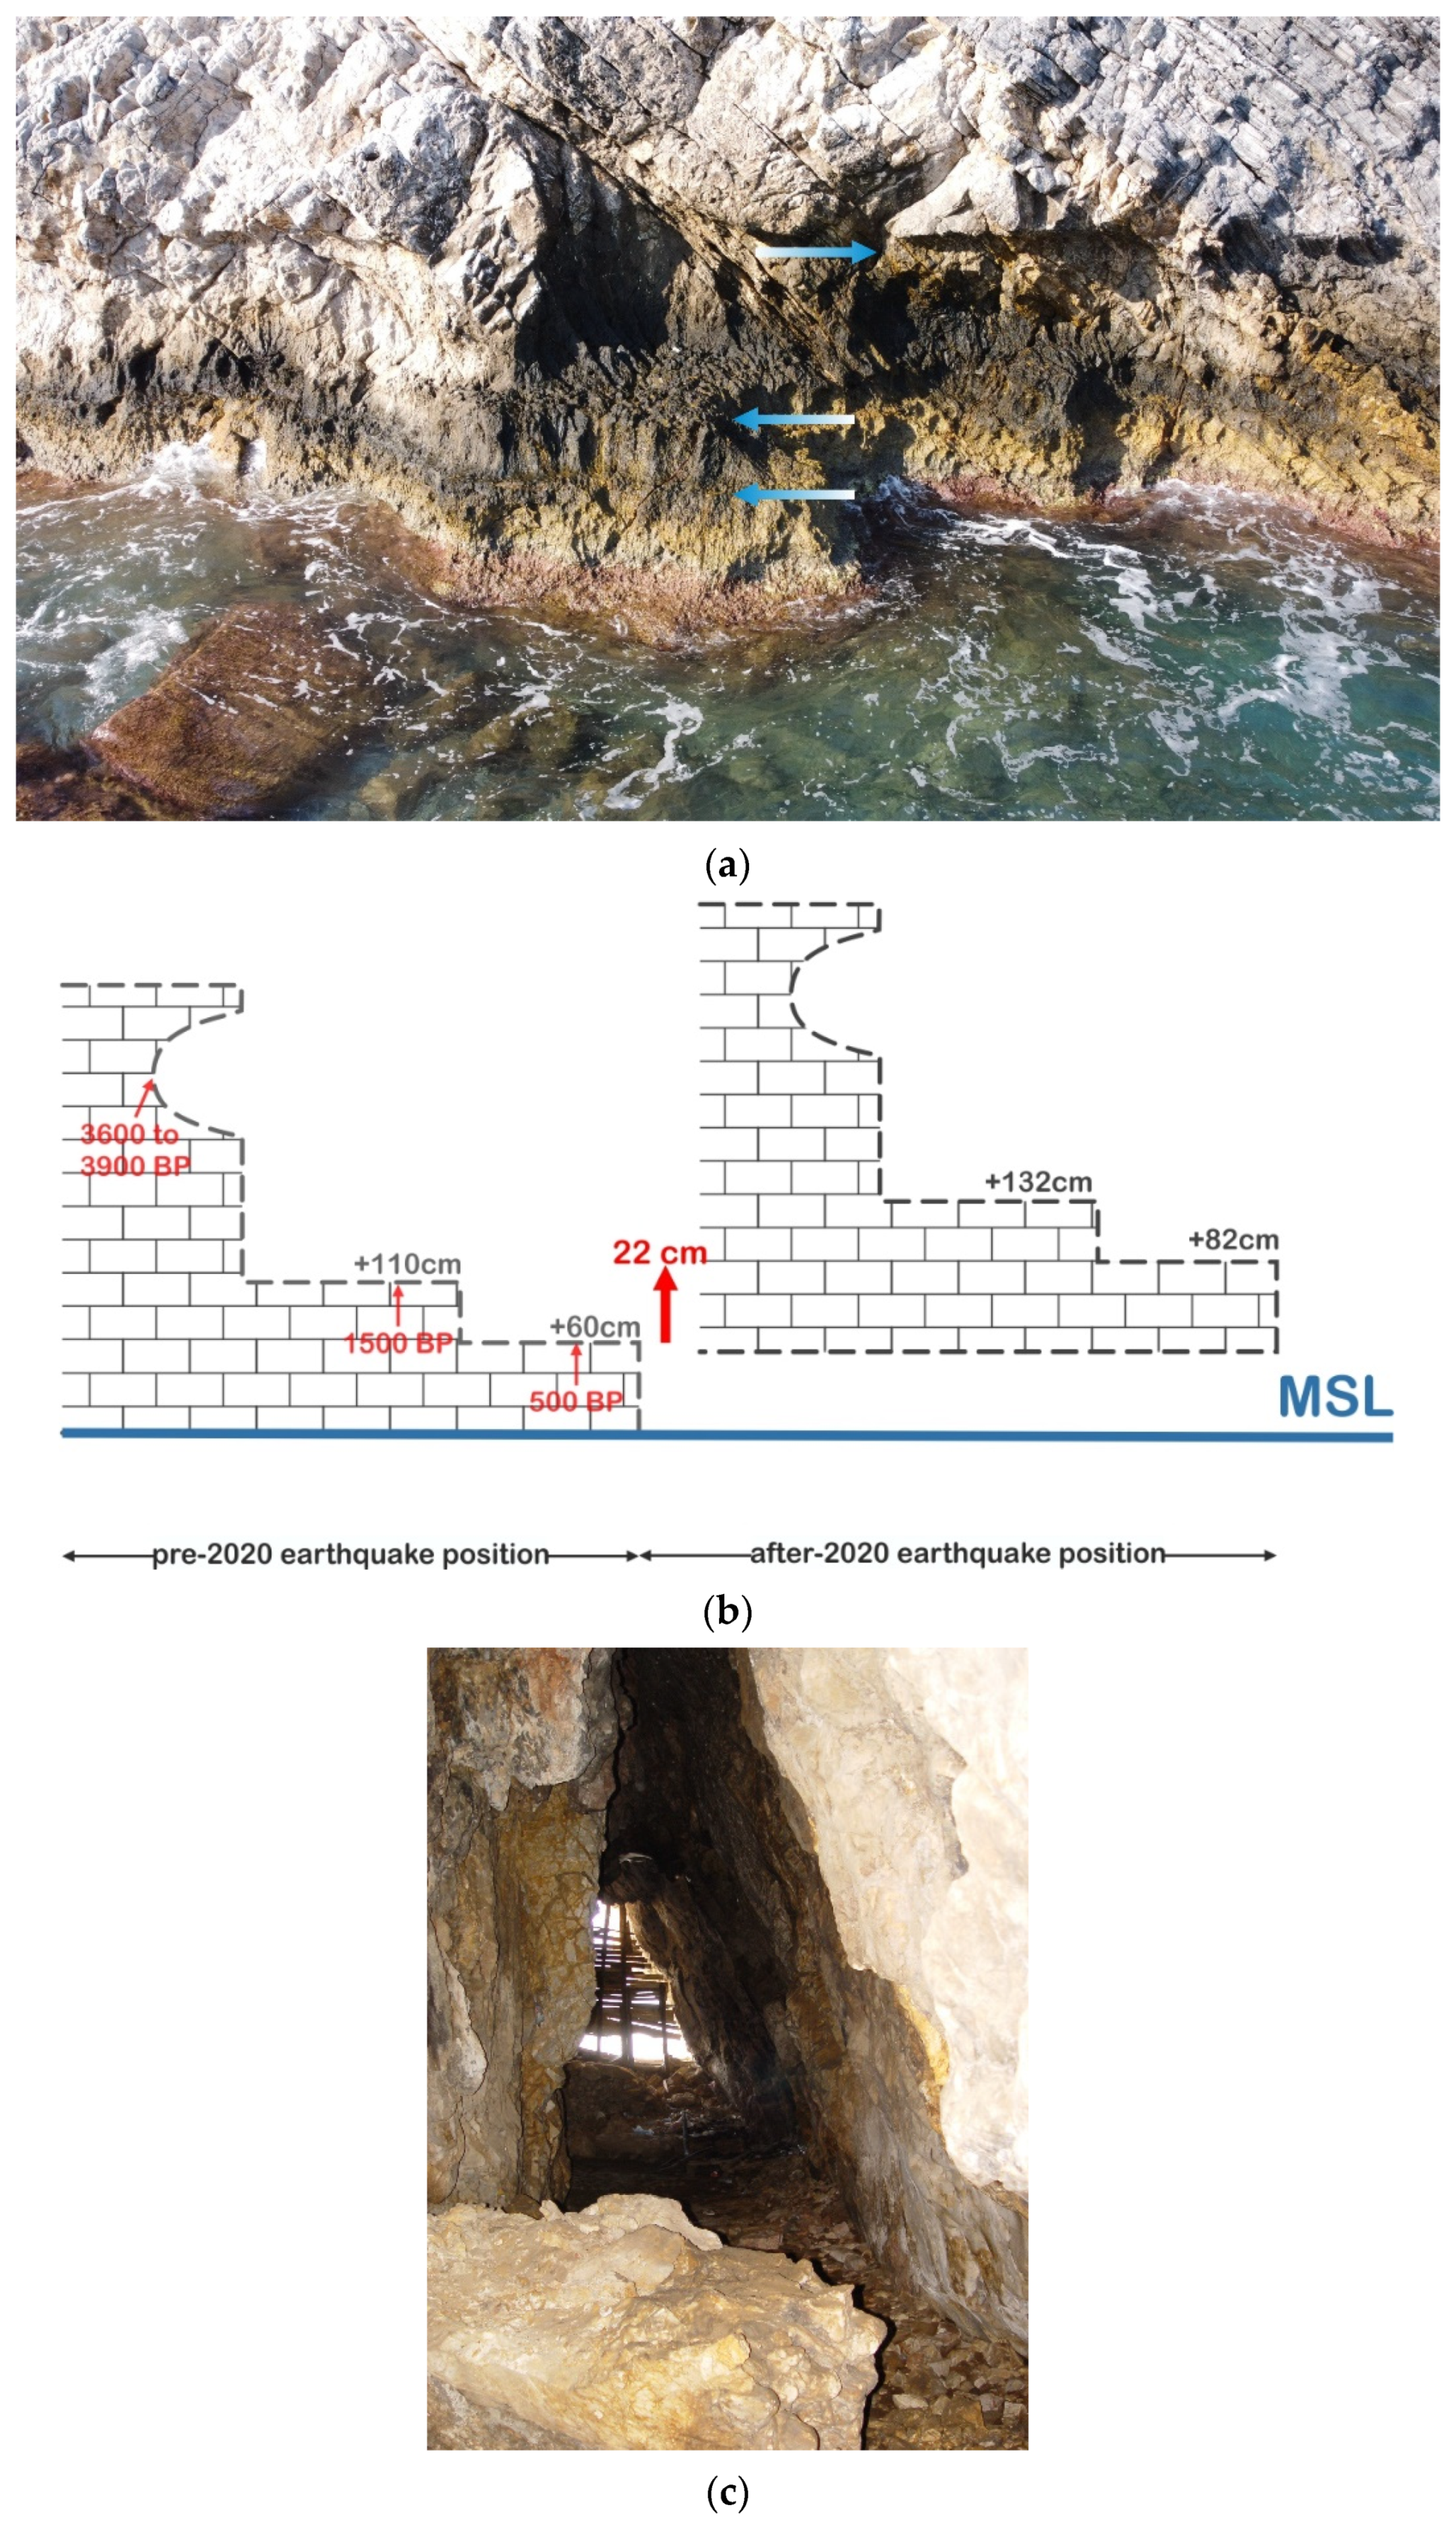
Punta Cape is located on the western side of Potami Beach and hosts three raised fossil shorelines corresponding to two benches and one tidal notch [15]. The cape is formed on Kerketeas marbles dipping seaward. The November 2020 measurements showed a clear uplift of the area after the recent earthquake. The lower and upper benches were measured at +82 ± 5 and +132 ± 5 cm above present sea level (apsl), respectively, supporting an uplift of +22 cm in comparison with Stiros et al. [15] values (Figure 8a,b). A well-developed tidal notch is also situated at +232 ± 5 cm.
At the western part of Potami Beach and close to Punta Cape, there is a wave-cut cave with no speleothems, just next to the coastal road (Figure 8c). The cave develops along tectonic discontinuities, resulting in a triangular shape of its passage. The cave length is about 100 m and it progressively narrows towards its inner part. The latter bears signs of notch profiles at the bottom of both walls. The altitude of the entrance lies conspicuously, at the same altitude of the reported notch (+232 cm) at Punta by Stiros et al. [15]. The two sites are only separated by 150 m and they share a common uplift history. The cave developed by the wave action when the sea stood at the position of the notch vertex. The maximum width value of the cave is observed at its current bottom, the altitude of which coincides with the notch vertex suggesting a stable sea level position at that level.
3.8. Megalo Seitani (SA24)
At the western coastal cliffs of Megalo Seitani beach, signs of a +22 ± 5 cm uplift were identified, where the former midlittoral zone has been left exposed above the present sea level (white strip of dead algae) (Figure 9a). The site is comprised of Kerketeas marbles overlaid by conglomerates.
3.9. Aghios Isidoros (SA25 and SA26)
At the cape consisting of Kerketeas marbles where the traditional shipyard is located, evidence of former palaeo-shorelines is visible [15]. In 2020, the team measured one bench at +88 ± 5 cm and one tidal notch at +111 ± 5 cm apsl (SA25) (Figure 9b). Additionally, at the center of Aghios Isidoros bay (SA26), a colony of Cirripedia, freshly exposed at +35 ± 5 cm at the edge of a tidal notch base with the notch vertex lying at +70 apsl, suggests an uplift of +35 ± 5 cm.
3.10. Pithagoreio (SA27)
At the southeast part of Samos, at Pithagoreio town, the contemporary breakwater appears to have recorded the uplift, which took place as a result of the 2020 earthquake. Measurements of the former midlittoral zone that is exposed above mean sea level suggest +15 ± 5 cm of uplift (Figure 10a).
3.11. Psili Ammos (SA28)
At Psili Ammos, marks of an uplifted shoreline at 10 ± 5 cm apsl lie at the eastern part of the beach, which did not exist in 2015. The rocks consist of Vourliotes marbles. The exposed limpets, vermetids and dead red algae of the former midlittoral zone [34] are characteristic of the 2020 earthquake uplift. On the other side of the beach and about 1 km to the west, a military facility is located next to the shoreline. At this site we measured marks of an uplifted shoreline at +13 ± 5 cm apsl on Zoodochos Pigi marbles (Figure 10b).
3.12. Springs at Mytilinii Village (SA29)
The village of Mytilinii is located 6.5 km NW of Vathy. One week after the main earthquake, high discharge activity at the springs of Mytilinii Village emerged.
4. Discussion
In tectonically active coastal areas, abrupt relative sea-level changes take place before, during and after earthquake events [36,37,38,39,40,41]. When the origin of vertical displacements is co-seismic, they are generally related to earthquakes with magnitude larger than 6.0, often associated with morphogenic faults, and therefore result in direct surface faulting [42].
The carbonate rocks along the coasts of Samos (Figure 4) favour the development and preservation of tidal notches. The value of tidal notches for coastal tectonics is often expressed in the literature, especially in the Eastern Mediterranean [15,30,38,43,44,45,46,47,48,49,50]. In particular, notches, mainly tidal, are often used to deduce relative sea level changes for the late Pleistocene [51] and Holocene [52] and for elucidating vertical tectonic displacements [36,53].
Uplifted tidal notches and other sea level indicators in Samos island have been studied in the past by Mourtzas and Stavropoulos [25] and Stiros et al. [15], proving that tectonic movements of co-seismic origin have uplifted the northwestern coast of Samos island during the late Holocene. Submerged sea level indicators at the southeastern part of the island were studied by the authors in 2015, but have remained unpublished until today.
In this paper, we discuss seven sites (SA16–SA26) of the NW part of Samos island (Table 1), and based on our findings it is clear that the area has been co-seismically uplifted during the 2020 event. Although we have measured additional sea level indicators in the NW part of Samos, we focus here on the best evidence, which comes from the re-visited sites and the comparative measurements. Based on our findings, the NW part of Samos island from Vathy to Agios Isidoros has been co-seismically uplifted by 20 ± 5 cm to 35 ± 5 cm, with maximum uplift of +35 ± 5 cm at Agios Isidoros (SA25, Figure 10), which fades out towards the northeast at Kokkari, with +22 ± 5 cm uplift (SA16). This part of Samos was uplifted at least three times in the late Holocene (Figure 8a) [15]. Specifically, Stiros et al. [15] identified three raised palaeo-shorelines corresponding to three earthquakes, dated approximately 500, possibly 1500, and 3600–3900 years ago.
In the southeastern part of Samos, six sites were studied (SA1–SA15) in this work, mainly through submerged tidal notches and biological indicators. Based on the submerged features four palaeo-shorelines were identified. The upper notch has only recently been drowned due to global sea-level rise of about 20–30 cm that took place during the 19th and 20th century [54]. The profile of the tidal notch at +115 ± 5 cm indicates its co-seismic subsidence in the past (SA9, Figure 5b), while the profile of the other two tidal notches at −80 ± 10 and −250 ± 10 cm probably corresponds to a period of relative sea level rise (SA1, Figure 5a). The re-examination of the same submerged tidal notches in November 2020, revealed that have been uplifted, but they remain drowned. Based on the comparisons of their depth values between 2015 and 2020, it is clear that the uplift is higher in the west (e.g., SA1) and progressively lowers towards the east (e.g., SA15).
It is interesting to note the southeastern part of the island is mostly characterized by a subsidence regime, while periods of uplift are less expressed in the north and northwest parts of the island. The results of submerged tidal notches at the southeastern part of Samos island studied in 2015 and their uplift due to the seismic event of 30th October 2020, reveal the complex tectonics of the area. This is also represented in the sedimentary records of Mesokampos and Psili Ammos discussed by Evelpidou et al. [29]. The corings are located approximately 2.5 km northeast of the footwall of Pithagoreio fault, a structure defining the morphology in this part of the island [12,29]. According to Pavlides et al. [55], the Pithagoreio fault has earthquake potential of the order of 6.6. In fact, two active normal faults, namely Pithagoreio and Vathy [12], are the most significant tectonic features in this area, striking WNW-ESE, which may define the main vertical displacement trend in the area but other local faults dipping in the opposite direction may cancel out part of this trend [29].
The measured uplift values in the field are consistent with the geophysically modelled displacements of the earthquake of October 2020. We are reporting a +35 ± 5 cm maximum vertical displacement at the northwestern part of Samos and a vertical displacement ranging between +23 ± 5 and +8 ± 5 cm at the south and southeastern part, which fit very well with the announced model approaches [22,56]. Our data imply a fading of the uplift produced by the earthquake towards the east.
The preliminary slip distribution map produced by the USGS [56] depicts the largest slip areas located at the northern offshore part of Samos and more particularly at and northwest of the epicentre. This region coincides with the northwestern onshore locations of large uplift. Although there is no modelled fault slip towards the east, a small uplift did occur according to our findings, resulting in the +8±5 cm vertical displacement of the Mourtia beach area. Most probably, the magnitude of this displacement was such that the Finite Fault model was unable to detect it. Moreover, the macroseismic intensity (MMI) predicted by the ShakeMap model [56] had the highest values (6.5–7.0) at the areas of the northern part of Samos, whereas the eastern and southeastern part of the island accommodating the smaller uplift was not included in the high MMI sector. The MMI is indicative of the fault geometry.
The GNSS observed displacements also support our findings for differential uplift during this seismic event. The GPS co-seismic deformation as well as the GPS modelled co-seismic deformation display a large difference in horizontal movement between the northwestern (almost 20–25 cm) and eastern (5 cm) parts of the island indicating a different uplift along a normal fault of a 37° dip-angle [22].
The overall differential uplift of Samos with higher values at the west and gradually lower ones at the east, indicates the complex geological setting of the island. The strong earthquake of October 2020 displaced the footwall of the ruptured fault where Samos lies but an unevenly uplifting pattern took place. This pattern distinguishes two discrete sectors at the island, the western and the eastern one (Figure 4). The border among the two is located along the NNE-SSW trending tectonic contact between the Vourliotes nappe and the Mytilini basin. On both north and south sides of this contact, the authors measured a +22 ± 5 and +23 ± 5 cm uplift of the coast, whereas the respective values decrease towards the east of this zone. Most probably, the aforementioned tectonic contact that emerges east of the Vourliotes thrust represents a back-thrust fault, outcropping partially at the contact between the southeastern part of Vourliotes nappe and Selçuk nappe (Figure 4). Its continuation to the north probably runs along the Mytilini Neogene sediments. The same case is observed for the tectonic contact between Ampelos nappe and Karlovasi basin to the west. This NNE-SSW tectonic feature can only be justified under the current NNE-SSW extension as being an older structure of compressional regime. According to Ring et al. [16], evidence of a short-lived E-W compressional phase between 9 and 8.6 Ma interrupted the NNE extension. This phase is also observed in Samos through several reverse faults affecting the Miocene basin as well as its margins and the presence of folds in the Miocene deposits [10]. Such a structure can act as a seismotectonic barrier preventing the equal uplift of western and eastern sectors of Samos island, thus resulting in lower uplift values for the eastern part.
The observed high discharge of springs at Mytilinii Village was most probably triggered by the eastward tilting of Samos eastern sector due to the M7.0 earthquake, which is also supported by the findings of our work. The Mytilinii Village lies in the Mytilinii basin consisting of fluvial-lacustrine deposits and is dissected by WNW-ESE faults that represent the main tectonic directions on the island [12]. These tectonic discontinuities were probably activated by the October 2020 earthquake, disturbing the underground water flow and directing it towards the Mytilinii springs.
5. Conclusions
The comparative study of various sea level indicators along the coastal zone of Samos island was accomplished through measurements taken by the authors in 2015 and 2020 and the published measurements by Stiros et al. [15]. Based on our findings, we concluded that the island has been co-seismically uplifted but with different magnitude. In fact, the largest uplift was noted at the northern part of the coast, with the highest value at the northwestern tip of the island. Although the southern part of Samos has experienced many submergence events in the past, during the earthquake of 30th October 2020, it has been uplifted by up to 23 ± 5 cm, while the uplift fades out towards the east-northeast. We believe that the tectonic contact between the Vourliotes nappe and the Mytilinii basin has acted as a seismotectonic barrier, preventing the south east part of the island from the high uplift rates noticed at the north.
Supplementary Materials
The following are available online at https://www.mdpi.com/2077-1312/9/1/40/s1, Table S1: Measurements performed on the different sea level indicators and the method used for each site.
Author Contributions
Conceptualization, N.E.; investigation, N.E., A.K., I.K.; writing—original draft preparation, N.E., A.K., I.K.; writing—review and editing N.E., A.K., I.K. All authors have read and agreed to the published version of the manuscript.
Funding
This research received no external funding.
Institutional Review Board Statement
“Not applicable” for studies not involving human or animals.
Informed Consent Statement
“Not applicable” for studies not involving human.
Data Availability Statement
The data presented in this study are available in Table S1.
Acknowledgments
Special thanks to East Samos municipality and specifically to mayor George Stanzos and vice mayor Despina Kaila. We would also wish to thank Manolis Karlovassitis for his support during all fieldwork activities, and Nikos Tsoumakis and Dimitris Siganos for escorting the team with their vessel in submarine field work in 2020 and Archipelagos for accompanying the team by boat in 2015. The authors would also like to thank Evangelos Kamperis for his fruitful discussion. We also thank four anonymous reviewers and the academic editor, whose comments improved an earlier version of this manuscript.
Conflicts of Interest
The authors declare no conflict of interest.
References
- McKenzie, D. Active tectonics of the Alpin—Himalayan belt: The Aegean Sea and surrounding regions. Geophys. J. Int. 1978, 55, 217–254. [Google Scholar] [CrossRef] [Green Version]
- Mercier, J.L.; Sorel, D.; Vergely, P.; Simeakis, K. Extensional tectonic regimes in the Aegean basins during the Cenozoic. Basin Res. 1989, 2, 49–71. [Google Scholar] [CrossRef]
- McKenzie, D. Active Tectonics of the Mediterranean Region. Geophys. J. Int. 1972, 30, 109–185. [Google Scholar] [CrossRef] [Green Version]
- Barka, A. The north Anatolian fault zone. Ann. Tecton. 1992, 6, 164–195. [Google Scholar]
- Le Pichon, X.; Chamot-Rooke, N.; Lallemant, S.; Noomen, R.; Veis, G. Geodetic determination of the kinematics of central Greece with respect to Europe: Implications for eastern Mediterranean tectonics. J. Geophys. Res. Solid Earth 1995, 100, 12675–12690. [Google Scholar] [CrossRef]
- McClusky, S.; Balassanian, S.; Barka, A.; Demir, C.; Ergintav, S.; Georgiev, I.; Gurkan, O.; Hamburger, M.; Hurst, K.; Kahle, H.; et al. Global Positioning System constraints on plate kinematics and dynamics in the eastern Mediterranean and Caucasus. J. Geophys. Res. Solid Earth 2000, 105, 5695–5719. [Google Scholar] [CrossRef]
- Reilinger, R.; McClusky, S.; Vernant, P.; Lawrence, S.; Ergintav, S.; Cakmak, R.; Ozener, H.; Kadirov, F.; Guliev, I.; Stepanyan, R.; et al. GPS constraints on continental deformation in the Africa-Arabia-Eurasia continental collision zone and implications for the dynamics of plate interactions. J. Geophys. Res. Solid Earth 2006, 111, B05411. [Google Scholar] [CrossRef]
- Reilinger, R.; McClusky, S.; Paradissis, D.; Ergintav, S.; Vernant, P. Geodetic constraints on the tectonic evolution of the Aegean region and strain accumulation along the Hellenic subduction zone. Tectonophysics 2010, 488, 22–30. [Google Scholar] [CrossRef]
- Tan, O.; Papadimitriou, E.E.; Pabucçu, Z.; Karakostas, V.; Yörük, A.; Leptokaropoulos, K. A detailed analysis of microseismicity in Samos and Kusadasi (Eastern Aegean Sea) areas. Acta Geophys. 2014, 62, 1283–1309. [Google Scholar] [CrossRef]
- Roche, V.; Jolivet, L.; Papanikolaou, D.; Bozkurt, E.; Menant, A.; Rimmelé, G. Slab fragmentation beneath the Aegean/Anatolia transition zone: Insights from the tectonic and metamorphic evolution of the Eastern Aegean region. Tectonophysics 2019, 754, 101–129. [Google Scholar] [CrossRef]
- Mountrakis, D.; Kilias, A.; Vavliakis, E.; Psilovikos, A.; Thomaidou, E. Neotectonic map of Samos island (Aegean Sea, Greece): Implication of geographical information systems in the geological mapping. In Proceedings of the 4th European Congress on Regional Geoscientific Cartography and Information Systems, Bologna, Italy, 17–20 June 2003; pp. 11–13. [Google Scholar]
- Chatzipetros, A.; Kiratzi, A.; Sboras, S.; Zouros, N.; Pavlides, S. Active faulting in the north-eastern Aegean Sea Islands. Tectonophysics 2013, 597–598, 106–122. [Google Scholar] [CrossRef]
- Higgins, D.M.; Higgins, R. A Geological Companion to Greece and the Aegean; Cornell University Press: Ithaca, NY, USA, 1996. [Google Scholar]
- Saroglu, F.; Emre, O.; Kuscu, I. Active Fault Map of Turkey, 1:1,000,000 Scale; General Directorate of Mineral Research and Exploration: Ankara, Turkey, 1992. [Google Scholar]
- Stiros, S.C.; Laborel, J.; Laborel-Deguen, F.; Papageorgiou, S.; Evin, J.; Pirazzoli, P.A. Seismic coastal uplift in a region of subsidence: Holocene raised shorelines of Samos Island, Aegean Sea, Greece. Mar. Geol. 2000, 170, 41–58. [Google Scholar] [CrossRef]
- Ring, U.; Laws, S.; Bernet, M. Structural analysis of a complex nappe sequence and late-orogenic basins from the Aegean Island of Samos, Greece. J. Struct. Geol. 1999, 21, 1575–1601. [Google Scholar] [CrossRef]
- Theodoropoulos, D. Geological Map of Greece, 1:50,000 Scale; Neon Karlovasi and Limin Vatheos Sheets; IGME: Athens, Greece, 1979. [Google Scholar]
- Weidmann, M.; Solounias, N.; Drake, R.E.; Curtis, G.H. Neogene stratigraphy of the Eastern basin, Samos island, Greece. Geobios 1984, 17, 477–490. [Google Scholar] [CrossRef]
- Kouskouna, V.; Sakkas, G. The University of Athens Hellenic Macroseismic Database (HMDB.UoA): Historical earthquakes. J. Seismol. 2013, 17, 1253–1280. [Google Scholar] [CrossRef]
- ITSAK. Earthquake Νorth of Samos Island(Greece) of 30/10/2020-Preliminary Report ITSAK; ITSAK: Thessaloniki, Greece, 2020. [Google Scholar]
- Papadimitriou, P.; Kapetanidis, V.; Karakonstantis, A.; Spingos, I.; Kassaras, I.; Sakkas, V.; Kouskouna, V.; Karatzetzou, A.; Pavlou, K.; Kaviris, G.; et al. Preliminary Report on the Mw = 6.9 Samos Earthquake of 30 October 2020; Department of Geophysics and Geothermy, National and Kapodistrian University of Athens: Athens, Greece, 2020. [Google Scholar] [CrossRef]
- Ganas, A.; Elias, P.; Briole, P.; Tsironi, V.; Valkaniotis, S.; Escartin, J.; Karasante, I.; Efstathiou, E. Fault responsible for Samos earthquake identified. Temblor 2020, 10. [Google Scholar] [CrossRef]
- Triantafyllou, Ι.; Gogou, M.; Mavroulis, S.; Katerina-Navsika, K.; Lekkas, E.; Papadopoulos, G.A. The Tsunami Caused by the 30 October 2020 Samos (Greece), East Aegean Sea, Mw6. 9 Earthquake: Impact Assessment from Post—Event Field Survey and Video; Athens. 2020. Available online: https://edcm.edu.gr/images/docs/2020/Samos2020-TSUNAMI-REPORT.pdf (accessed on 3 January 2021).
- Lekkas, E.; Mavroulis, S.; Gogou, M.; Papadopoulos, G.A.; Triantafyllou, I.; Katsetsiadou, K.-N.; Kranis,, H.; Skourtsos, E.; Carydis, P.; Voulgaris, N.; et al. The October 30, 2020, Mw 6.9 Samos (Greece) earthquake. Newsl. Environ. Disaster Cris. Manag. Strateg. 2020, 92–93, 1–156. [Google Scholar]
- Mourtzas, N.; Stavropoulos, X. Recent tectonic evolution of the coasts of Samos Island (east Aegean). Bull. Geol. Soc. Greece 1989, XXIII/1, 223–241. [Google Scholar]
- Mourtzas, N.D.; Marinos, P.G. Upper Holocene sea-level changes: Paleogeographic evolution and its impact on coastal archaeological sites and monuments. Environ. Geol. 1994, 23, 1–13. [Google Scholar] [CrossRef]
- Simossi, A. Underwater excavation research in the ancient harbour of Samos: September–October 1988. Int. J. Naut. Archaeol. 1991, 20, 281–298. [Google Scholar] [CrossRef]
- Stiros, S.C. Late Quaternary coastal changes in Samos island, Greece—Morphotectonics, paleoseismology, archaeology. In Proceedings of the Guidebook for the Samos Island Fieldtrip UNESCO IGCP 367, INQUA Shorelines and Neotectonics Commissions Conference, Joint Meeting on Rapid Coastal Changes in the Late Quaternary: Processes, Causes, Modeling, Impacts on Coastal Zones, Samos, Greece, 10–19 September 1998; Municipality of Pythagorion: Samos, Greece, 1998; p. 49. [Google Scholar]
- Evelpidou, N.; Pavlopoulos, K.; Vouvalidis, K.; Syrides, G.; Triantaphyllou, M.; Karkani, A. Holocene palaeogeographical reconstruction and relative sea- level changes in the southeastern part of the island of Samos. Comptes Rendus Geosci. 2019, 351, 451–460. [Google Scholar] [CrossRef]
- Pirazzoli, P.A. Marine notches. In Sea–Level Research: A Manual for the Collection and Evaluation of Data; Van de Plassche, O., Ed.; Geo Books: Norwich, UK, 1986; pp. 361–400. [Google Scholar]
- Evelpidou, N.; Pirazzoli, P.A. Holocene relative sea-level changes from submerged tidal notches: A methodological approach. Quaternaire 2014, 25, 383–390. [Google Scholar] [CrossRef] [Green Version]
- Pirazzoli, P.A.; Evelpidou, N. Tidal notches: A sea-level indicator of uncertain archival trustworthiness. Palaeogeogr. Palaeoclimatol. Palaeoecol. 2013, 369, 377–384. [Google Scholar] [CrossRef]
- Laborel, J.; Morhange, C.; Collina-Girard, J.; Laborel-Deguen, F. Littoral bioerosion, a tool for the study of sea level variations during the Holocene. Bull. Geol. Soc. Denmark 1999, 45, 164–168. [Google Scholar]
- Laborel, J.; Laborel-Deguen, F. Sea-level indicators, biologic. In Encyclopedia of Coastal Science; Schwartz, M.L., Ed.; Springer: Cham, The Netherlands, 2005; pp. 833–834. [Google Scholar]
- Kazmér, M.; Taboroši, D. Bioerosion on the small scale—Examples from the tropical and subtropical littoral. Hantkeniana 2012, 7, 37–94. [Google Scholar]
- Nixon, F.C.; Reinhardt, E.G.; Rothaus, R. Foraminifera and tidal notches: Dating neotectonic events at Korphos, Greece. Mar. Geol. 2009, 257, 41–53. [Google Scholar] [CrossRef] [Green Version]
- Stiros, S.C.; Laborel, J.; Laborel-Deguen, F.; Morhange, C. Quaternary and Holocene coastal uplift in Ikaria Island, Aegean Sea. Geodin. Acta 2011, 24, 123–131. [Google Scholar] [CrossRef]
- Evelpidou, N.; Melini, D.; Pirazzoli, P.; Vassilopoulos, A. Evidence of repeated late Holocene rapid subsidence in the SE Cyclades (Greece) deduced from submerged notches. Int. J. Earth Sci. 2014, 103, 381–395. [Google Scholar] [CrossRef]
- Dura, T.; Engelhart, S.E.; Vacchi, M.; Horton, B.P.; Kopp, R.E.; Peltier, W.R.; Bradley, S. The Role of Holocene Relative Sea-Level Change in Preserving Records of Subduction Zone Earthquakes. Curr. Clim. Chang. Rep. 2016, 1–15. [Google Scholar] [CrossRef] [Green Version]
- Mattei, G.; Aucelli, P.P.C.; Caporizzo, C.; Rizzo, A.; Pappone, G. Morpho-Evolutive Trends and Relative Sea-Level Changes of Naples Coast in the Last 6000 Years. Water 2020, 12, 2651. [Google Scholar] [CrossRef]
- Morhange, C.; Marriner, N.; Laborel, J.; Todesco, M.; Oberlin, C. Rapid sea-level movements and noneruptive crustal deformations in the Phlegrean Fields caldera, Italy. Geology 2006, 34, 93–96. [Google Scholar] [CrossRef]
- Ambraseys, N.N.; Jackson, J.A. Seismicity and associated strain of central Greece between 1890 and 1988. Geophys. J. Int. 1990, 101, 663–708. [Google Scholar] [CrossRef] [Green Version]
- Trenhaile, A.S. Coastal notches: Their morphology, formation, and function. Earth Sci. Rev. 2015, 150, 285–304. [Google Scholar] [CrossRef]
- Pirazzoli, P.A. Marine erosion features and bioconstructions as indicators of tectonic movements, with special attention to the eastern Mediterranean area. Z. Für Geomorphol. 2005, 137, 71–77. [Google Scholar]
- Pirazzoli, P.A.; Laborel, J.; Saliège, J.F.; Erol, O.; Kayan, İ.; Person, A. Holocene raised shorelines on the Hatay coasts (Turkey): Palaeoecological and tectonic implications. Mar. Geol. 1991, 96, 295–311. [Google Scholar] [CrossRef]
- Stiros, S.C.; Pirazzoli, P.A.; Fontugne, M. New evidence of Holocene coastal uplift in the Strophades Islets (W Hellenic Arc, Greece). Mar. Geol. 2009, 267, 207–211. [Google Scholar] [CrossRef]
- Evelpidou, N.; Pirazzoli, P.A.; Saliège, J.-F.; Vassilopoulos, A. Submerged notches and doline sediments as evidence for Holocene subsidence. Cont. Shelf Res. 2011, 31, 1273–1281. [Google Scholar] [CrossRef]
- Evelpidou, N.; Koutsomichou, I.; Pirazzoli, P. Evidence of Late Holocene subsidence events in Sporades Islands: Skopelos and Alonnisos. Cont. Shelf Res. 2013, 69, 31–37. [Google Scholar] [CrossRef]
- Evelpidou, N.; Karkani, A.; Kampolis, I.; Pirazzoli, P. Late Holocene shorelines in east Attica (Greece). Quat. Int. 2017, 436, 1–7. [Google Scholar] [CrossRef]
- Faivre, S.; Butorac, V. Recently submerged tidal notches in the wider Makarska area (Central Adriatic, Croatia). Quat. Int. 2018, 494, 225–235. [Google Scholar] [CrossRef]
- Sisma-Ventura, G.; Sivan, D.; Shtienberg, G.; Bialik, O.M.; Filin, S.; Greenbaum, N. Last interglacial sea level high-stand deduced from well-preserved abrasive notches exposed on the Galilee coast of northern Israel. Palaeogeogr. Palaeoclimatol. Palaeoecol. 2017, 470, 1–10. [Google Scholar] [CrossRef]
- Goodman-Tchernov, B.; Katz, O. Holocene-era submerged notches along the southern Levantine coastline: Punctuated sea level rise? Quat. Int. 2016, 401, 17–27. [Google Scholar] [CrossRef]
- Boulton, S.J.; Stewart, I.S. Holocene coastal notches in the Mediterranean region: Indicators of palaeoseismic clustering? Geomorphology 2015, 237, 29–37. [Google Scholar] [CrossRef]
- Evelpidou, N.; Kampolis, I.; Pirazzoli, P.A.; Vassilopoulos, A. Global sea-level rise and the disappearance of tidal notches. Glob. Planet. Chang. 2012, 92–93, 248–256. [Google Scholar] [CrossRef]
- Pavlides, S.; Tsapanos, T.; Zouros, N.; Sboras, S.; Koravos, G.; Chatzipetros, A. Using Active Fault Data for Assessing Seismic Hazard: A Case Study From Ne Aegean Sea, Greece. In Proceedings of the XVII International Conference on Soil Mechanics Geotechnical Engineering, Earthquake Geotechnical Engineering Satellite Conference, Alexandria, Egypt, 2–3 October 2009; pp. 1–14. [Google Scholar]
- USGS M 7.0–14 km NNE of Néon Karlovásion, Greece. Available online: https://earthquake.usgs.gov/earthquakes/eventpage/us7000c7y0/executive (accessed on 14 December 2020).
Figure 1.
Samos island and the main tectonic structures in and around the island of Samos, where ΚF: Karlovassi fault is a dextral strike-slip fault, and PF: Pithagoreio fault zone, VF: Vathy fault, MF: Marathokambos fault, OF: Offshore Samos fault are normal faults (after [12]). The location of the earthquake of 30th October 2020 is shown with a red star.

Figure 2.
The main earthquake at 30/10/20 and the aftershocks until 20/11/20, from the National Observatory of Athens and the Seismological Laboratory of NKUA.
Figure 2.
The main earthquake at 30/10/20 and the aftershocks until 20/11/20, from the National Observatory of Athens and the Seismological Laboratory of NKUA.

Figure 3.
Evidence of former uplifts in the form of raised benches and a tidal notch at Mikro Seitani, at the northwestern part of Samos (near SA24).
Figure 3.
Evidence of former uplifts in the form of raised benches and a tidal notch at Mikro Seitani, at the northwestern part of Samos (near SA24).

Figure 4.
Measurement results map, which shows the magnitude of uplift along the coastal zone of Samos, from comparative measurements between 2015 and 2020, from new measurements and from a review of positions by Stiros et al. [15]. The red dots and SA1–SA29 indicate the locations discussed in the text. The red numbers correspond to the magnitude of the seismic uplift in cm. Where red numbers are absent, there was no change in elevation. The main tectonic features are modified after Roche et al. [10]. The lithology is based on the geological map of Samos [17].

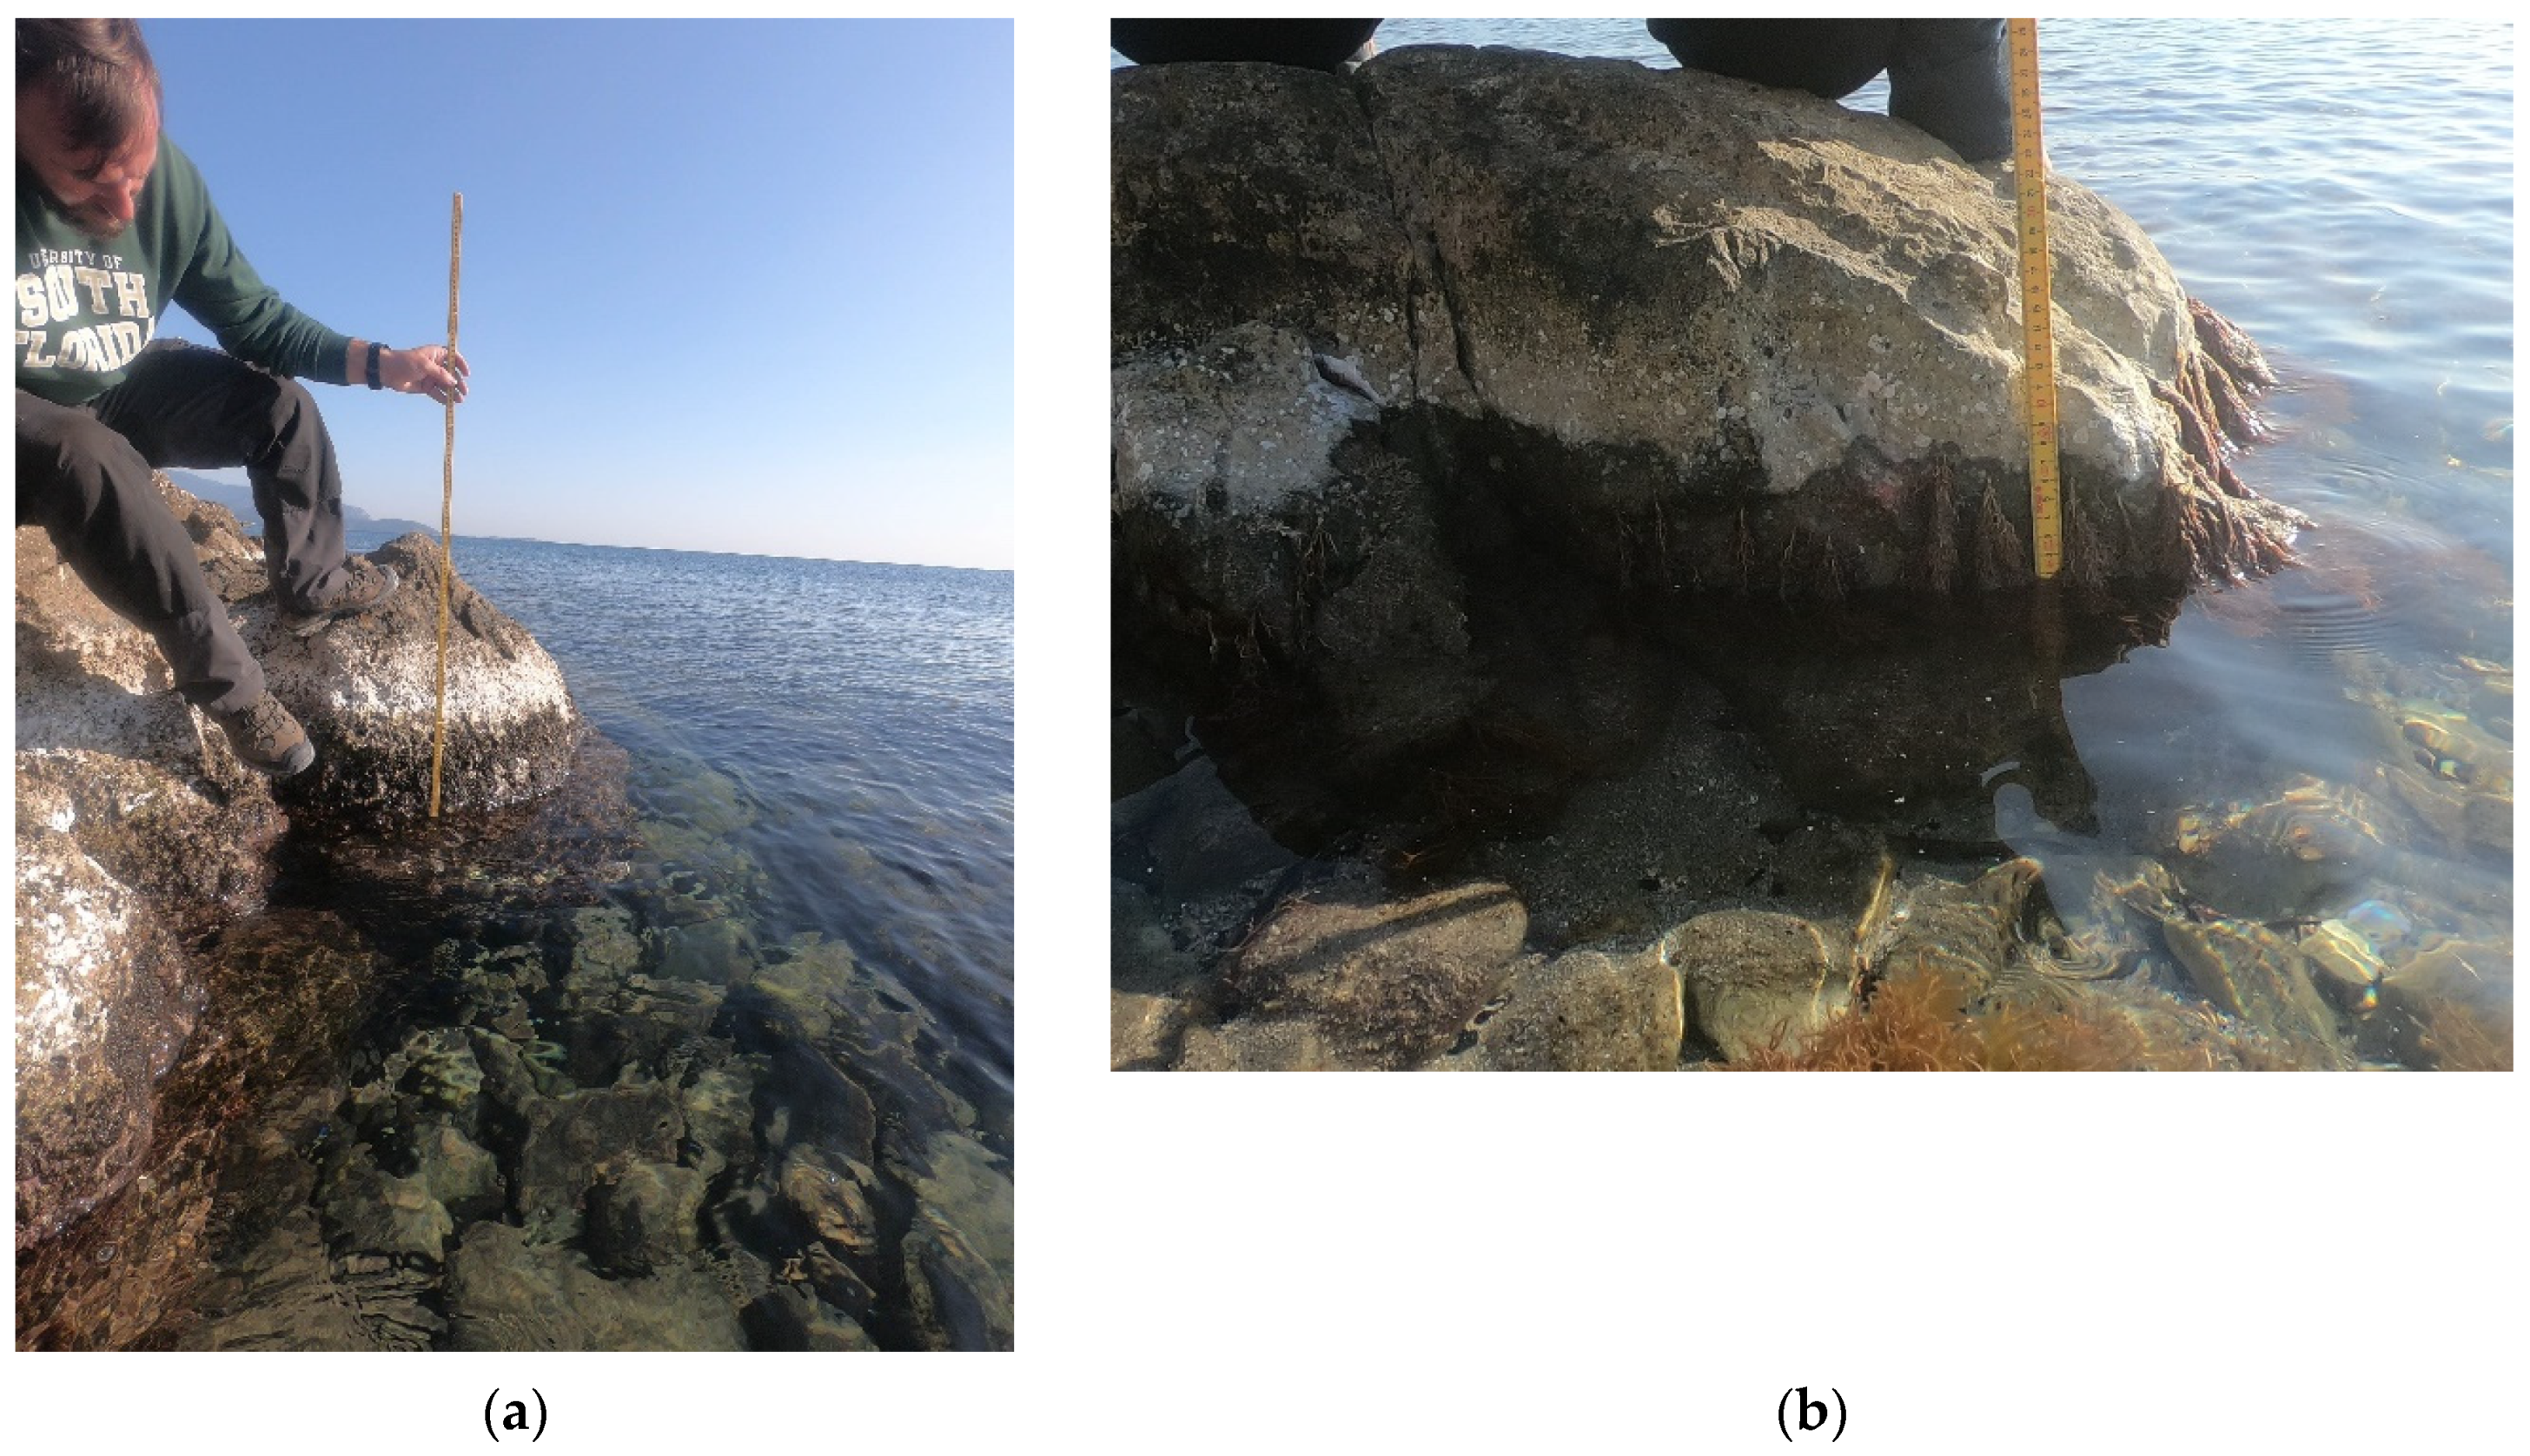
Figure 5.
(a) Two continuous submerged notches at Sykia 1 (SA1) measured in 2015 and 2020 indicate an uplift of +18 ± 5 cm. Photo taken in 2015; (b,c) Two continuous submerged notches at Klima (SA9) measured in 2015 (c) and 2020 (b), suggest no vertical displacement. The upper one is indicated by an arrow, while the lower one by the diver.

Figure 6.
(a) SA10 site in Posidonio area indicates a coastal uplift of 13 ± 5 cm. Photo taken in 2015; (b) Schematic representation of the tidal notch in Posidonio comparing its position in 2015 and 2020; (c) Underwater tidal notch NE of Mourtia beach, which was slightly raised by 8 ± 5 cm based on comparisons between 2015 and 2020. Photo taken in 2015.

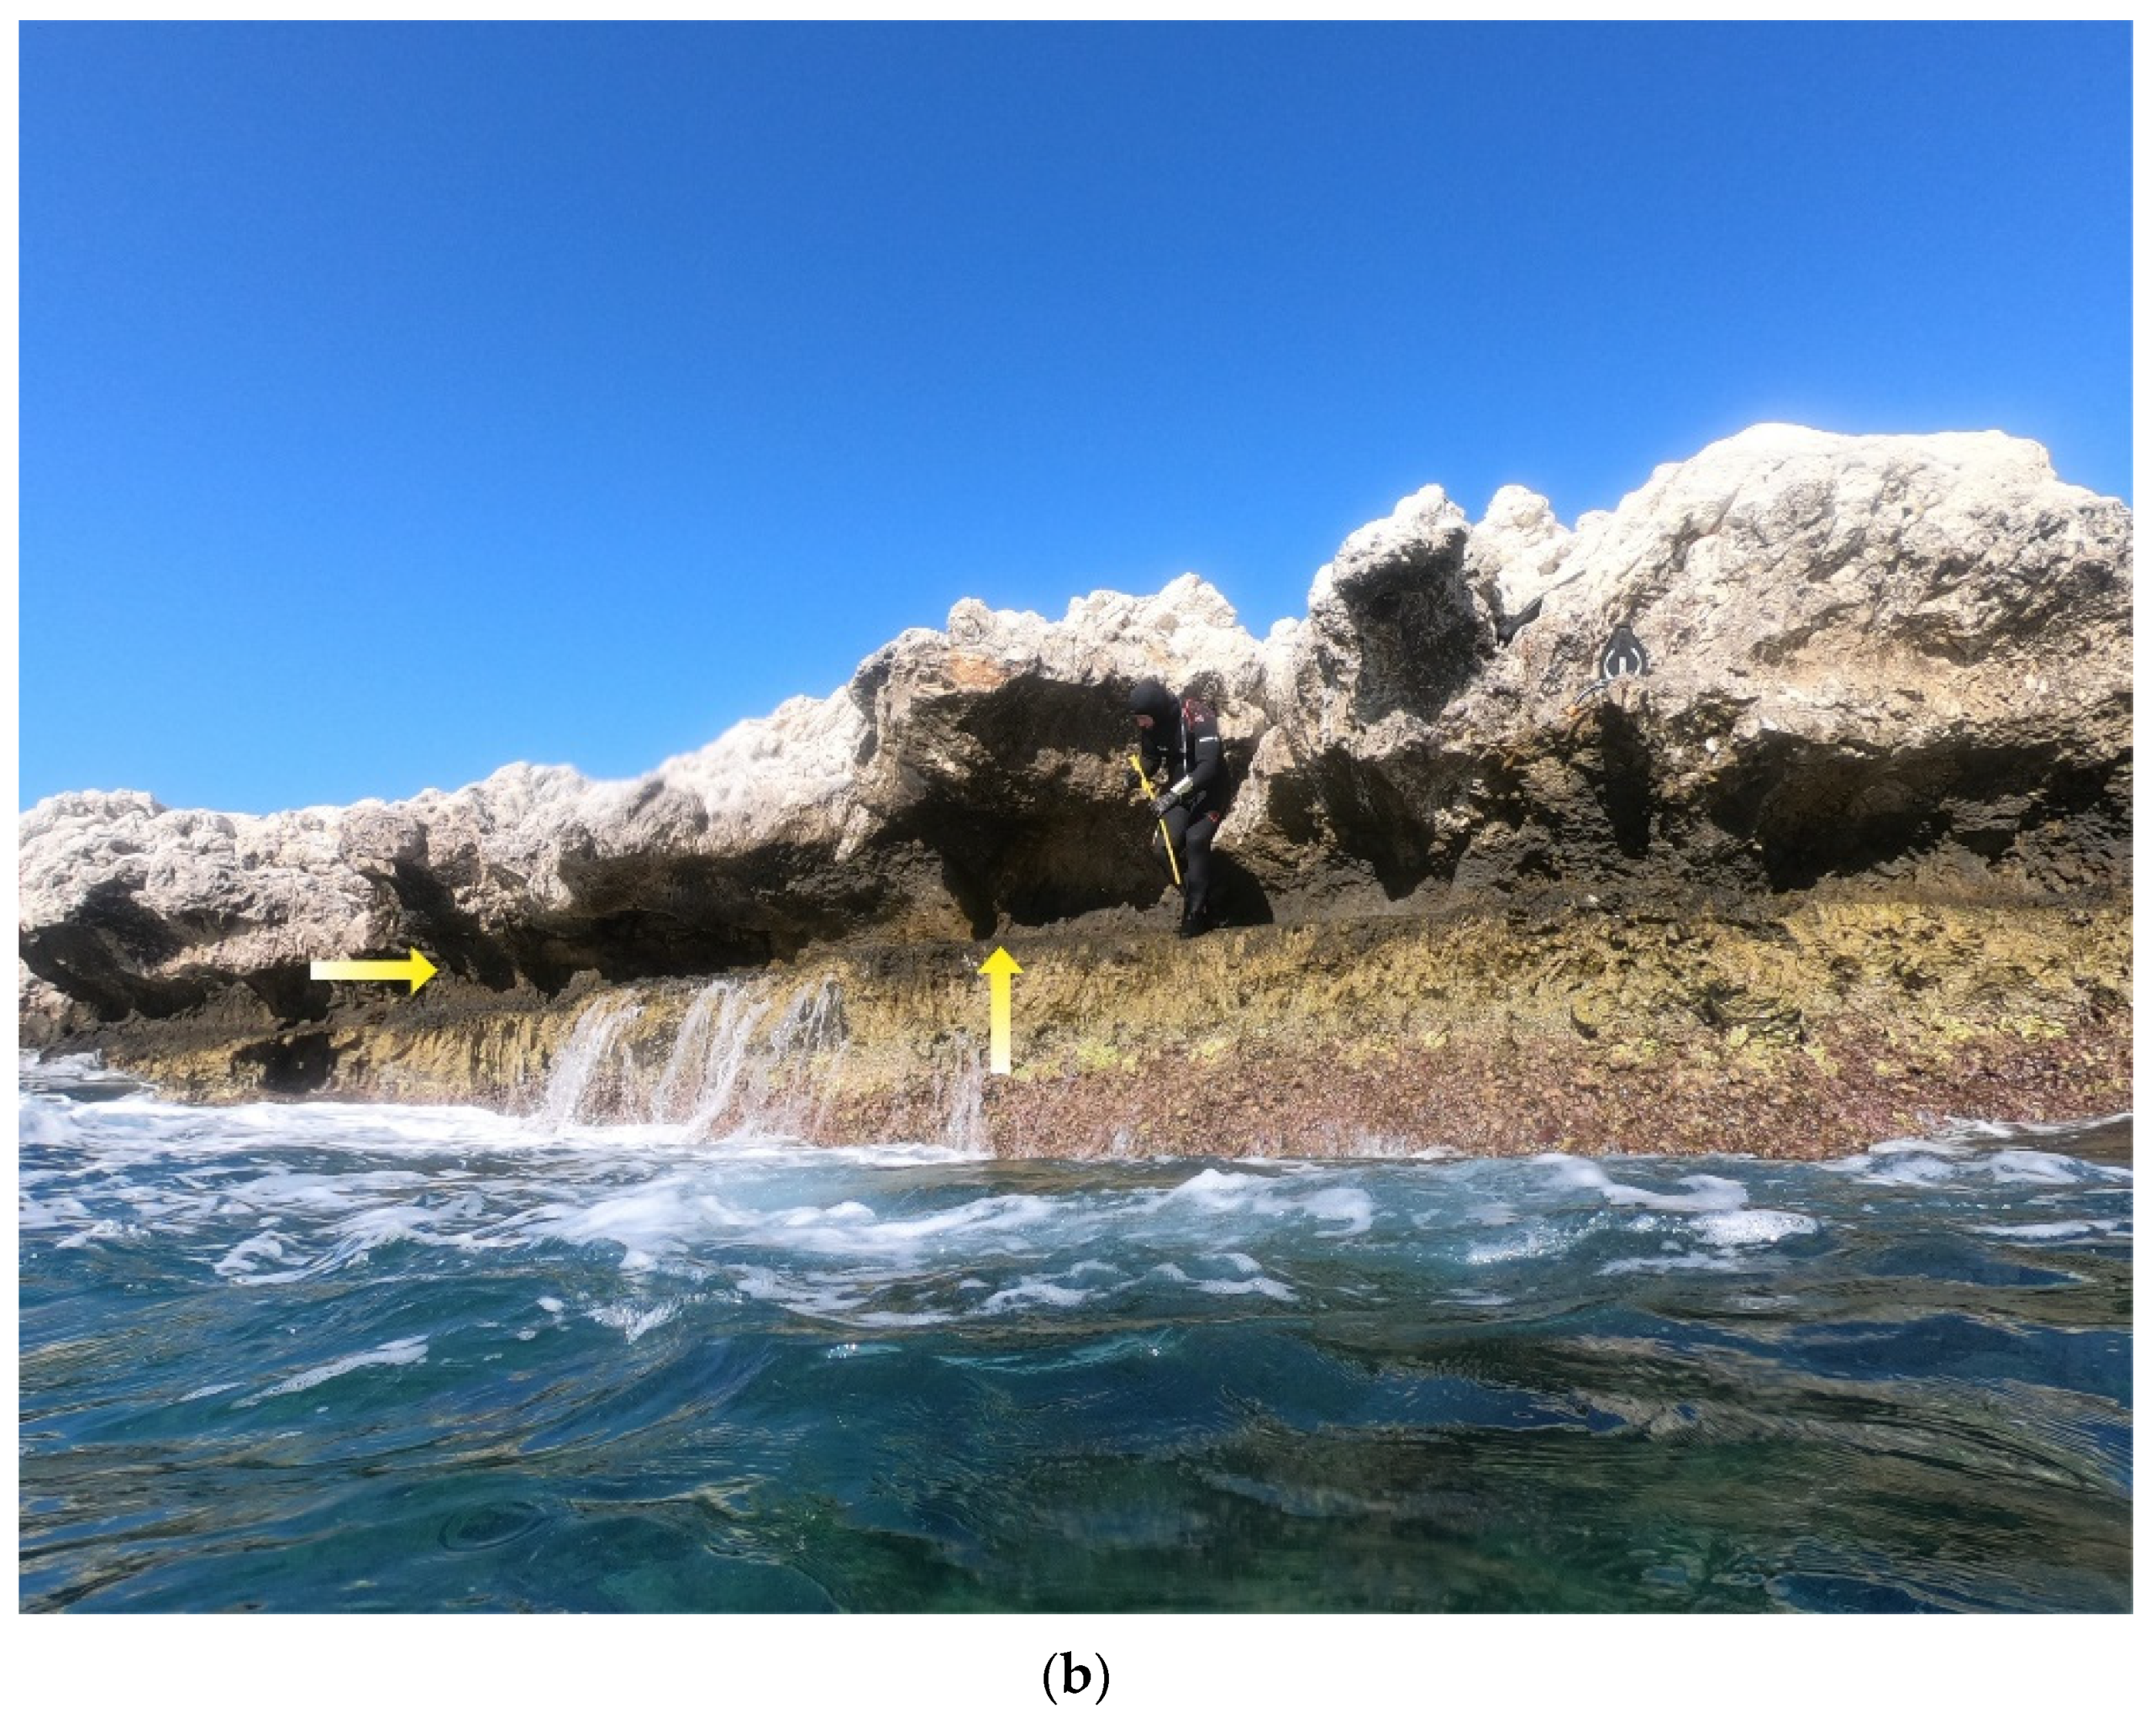
Figure 7.
(a) Evidence of three uplifted tidal notches (SA18) however their profiles are not well developed. An uplift of +20 ± 5 cm was measured based on the position of the lower notch, which was ascribed to the 30th October 2020 earthquake; (b) SA19 site at Potami beach indicates an uplift of +20 ± 5 cm based on exposed vegetation belt rich in limpets and brown algae. Photos taken in 2020.

Figure 8.
(a) Two benches and one tidal notch at Punta Cape, support an uplift of +22 ± 5 cm. Photo taken in 2020; (b) Schematic presentation of the uplift at Punta Cape. Ages in red letters correspond to the dates of uplift of former shorelines [15]; (c) Wave-cut cave, at the western part of Potami Beach, uplifted by the same event that uplifted the tidal notch +2.32 m at Punta Cape.

Figure 9.
(a) The former midlittoral zone testifies to an uplift of +22 cm at Megalo Seitani; (b) Agios Isidoros: Tidal notch and bench already uplifted in former stage and a colony of Cirripedia are indicative of a 35 ± 5 cm uplift due to the seismic event of 30th October 2020. Photos taken in 2020.


Figure 10.
(a) Exposed midlittoral zone at Pithagoreio suggests +15 ± 5 cm of uplift because of the 30th October 2020 earthquake; (b) Uplift of +10–13 ± 5 cm in the coastal zone of Psili ammos increasing from the site west of the lagoon towards the military station. Photos taken in 2020.
Figure 10.
(a) Exposed midlittoral zone at Pithagoreio suggests +15 ± 5 cm of uplift because of the 30th October 2020 earthquake; (b) Uplift of +10–13 ± 5 cm in the coastal zone of Psili ammos increasing from the site west of the lagoon towards the military station. Photos taken in 2020.


Table 1.
Different types of sea level indicators testifying the tectonic uplift of 2020.
| Site | Name | Long. E | Lat. N | Field Trip Date (Month/Year) | Sea Level Indicator | Measured Vertex Depth/Bench from SL (cm) | Measured Vertex Depth/Bench from SL in 2020 (cm) | Height (cm) | Vertex Inward Depth (cm) | 2020 Movement | Source |
|---|---|---|---|---|---|---|---|---|---|---|---|
| SA1 | Sykia 1 | 26°50.666′ | 37°38.233′ | 04/2015 | Tidal notch | −5 | +18 | 7 | 7 | +23 uplift | This paper |
| 04/2015 | Tidal notch | −80 | 61 | 20 | uplift | This paper | |||||
| 04/2015 | Tidal Notch | −250 | 117 | 53 | uplift | This paper | |||||
| SA9 | Klima | 27°02.125′ | 37°42.281′ | 04/2015 | Tidal notch | −20 | −21 | 30 | 24 | 0 uplift | This paper |
| 04/2015 | Tidal notch | −115 | −120 | 34 | 18 | 0 uplift | This paper | ||||
| SA10 | Posidonio | 27°04.192′ | 37°43.046′ | 04/2015 | Tidal notch | −30 | −17 | 34 | 16 | +13 uplift | This paper |
| SA15 | Mourtia | 27°03.212′ | 37°46.152′ | 04/2015 | Tidal notch | −40 | −32 | 24 | 18 | +8 uplift | This paper |
| SA16 | Kokkari | 26°53.606′ | 37°46.790′ | 11/2020 | exposed midlittoral zone | - | +22 | - | - | +22 uplift | This paper |
| SA18 | White (St. Nicholas) chapel at Potami beach | 26°40.196′ | 37°47.600′ | 11/2020 | Vermetids reef Beachrock slab | +50 | Notch +20 | - | - | +20 uplift | [15] |
| SA19 | White (St. Nicholas) chapel at Potami Beach | 26°40.005′ | 37°47.521′ | 11/2020 | exposed midlittoral zone | - | +20 | - | - | +20 uplift | This paper |
| SA21 | Punta Promontory | 26°39.589′ | 37°47.361′ | 11/2020 | Bench | +60 | +82 | - | - | +22 uplift | [15] |
| bench | +110 | +132 | - | - | +22 uplift | ||||||
| Tidal notch | +232 | - | - | uplift | |||||||
| SA24 | Megalo Seitani | 26°37.992′ | 37°46.214′ | 11/2020 | exposed midlittoral zone | - | +22 | - | - | +22 uplift | This paper |
| SA25 | Agios Isidoros | 26°35.594′ | 37°45.501′ | 11/2020 | Dendropoma bench | +60 | +88 | - | - | uplift | [15] |
| 11/2020 | Tidal notch | +50–70 | - | uplift | |||||||
| 11/2020 | Tidal notch | +110–130 | +111 | 61 | 33 | uplift | |||||
| SA26 | Agios Isidoros | 26°35.484′ | 37°45.113′ | 11/2020 | Notch | - | +70 | - | - | +35 uplift | This paper |
| SA27 | Pithagoreio | 26°56.639′ | 37°41.248′ | 11/2020 | Exposed Midlittoral zone | - | +15 | - | - | +15 uplift | This paper |
| SA28 | Psili Ammos | 27°0.673′ | 37°42.205′ | 11/2020 | Exposed midlittoral zone | - | +13 | - | - | +13 uplift | This paper |
Publisher’s Note: MDPI stays neutral with regard to jurisdictional claims in published maps and institutional affiliations. |
© 2021 by the authors. Licensee MDPI, Basel, Switzerland. This article is an open access article distributed under the terms and conditions of the Creative Commons Attribution (CC BY) license (http://creativecommons.org/licenses/by/4.0/).
Share and Cite
MDPI and ACS Style
Evelpidou, N.; Karkani, A.; Kampolis, I. Relative Sea Level Changes and Morphotectonic Implications Triggered by the Samos Earthquake of 30th October 2020. J. Mar. Sci. Eng. 2021, 9, 40. https://doi.org/10.3390/jmse9010040
AMA Style
Evelpidou N, Karkani A, Kampolis I. Relative Sea Level Changes and Morphotectonic Implications Triggered by the Samos Earthquake of 30th October 2020. Journal of Marine Science and Engineering. 2021; 9(1):40. https://doi.org/10.3390/jmse9010040
Chicago/Turabian StyleEvelpidou, Niki, Anna Karkani, and Isidoros Kampolis. 2021. "Relative Sea Level Changes and Morphotectonic Implications Triggered by the Samos Earthquake of 30th October 2020" Journal of Marine Science and Engineering 9, no. 1: 40. https://doi.org/10.3390/jmse9010040
Note that from the first issue of 2016, this journal uses article numbers instead of page numbers. See further details here.