
Abstract
In this research work, aluminum alloy (Al-20Fe-5Cr) matrix-based aluminum oxide (Al2O3) reinforced composites were developed through the powder metallurgy (P/M) process. Effect of compaction pressure (200, 250 & 300 MPa) and wt.% of Al2O3 (0, 10, 20 & 30 wt.) on tensile strength and percentage elongation has been analyzed through statistical and artificial neural network techniques (ANN). The mixture of Al-alloy powder particles and Al2O3 particles were synthesized in a centrifugal ball mill for 20 min. Compaction of synthesized powder was carried in the standard tensile die using a uniaxial hydraulic pressing machine. Sintering was performed at temperature 580 ± 20 °C for one hour in an argon gas environment using an electric tubular furnace. It was found that tensile strength enhanced significantly with the addition of Al2O3up to 20 wt.% and then declined sharply for the 30 wt.% of Al2O3at all compaction pressures. The highest tensile strengths were found for each wt.% of Al2O3 at compaction pressure 300 MPa compare to other compaction pressures. Tensile strength increased from 105 to 158 MPa with the addition of 20 wt.% Al2O3 and decreased to 142 MPa for 30 wt.% at 300 MPa compaction pressure. The improvement resulted from better compaction, leading to more plastic deformation, better packing, and high effective contact area. However, the percentage of elongation decreased from 23.2% to 2.2% with an increment of wt.% of Al2O3 for compaction pressure 200 MPa, while for 300 MPa, its value drops from 25.8% to 6.5%. This depreciation can be reasoned for the reduction in ductile matrix content and dilute flowability of the Al matrix, which occurred due to brittle Al2O3. The statistical analysis using ANOVA revealed that the compaction pressure is the primary control factor influencing tensile strength by 90.3%. The feed-forward network with a back-propagating gradient-descent error minimization training approach and mean squared error (MSE) as performance function was employed to model and predict tensile strength. The developed 3-layered multilayer perceptron (MLP) with 2–10–2 network architecture established a correlation between the inputs and outputs with minimum error (MSE) below 1% and maximum correlation coefficient (R) close to 1.
Export citation and abstract BibTeX RIS
1. Introduction
Aluminum alloys have been the most widely used materials in aeronautics, defense, and automotive and structural sectors[1, 2]. But the growing need to enhance the performance of critical components and meet the requirements of various strategic applications forced the researchers and scientists to develop improved performance structural materials[3, 4]. Hence, the research has been shifted from monolithic materials to composite materials. Aluminum matrix composites (AMCs) are also an era for future research that provides tailored property combinations as per requirements in various applications[5, 6]. The most common reinforcements used are ceramics based like SiC, B4C, and Al2O3, etc. [7–10]. Researchers listed the following benefits of the ceramics particles; i. Stiffer and harder reinforcement's inclusion increases the high hardness content, ii. A high thermal mismatch causes the formation of dislocations density, which also strengthens, iii. Plastic flow restriction is created due to particle dispersion, which strengthens the composites. Among all ceramics reinforced AMCs, Al2O3 reinforced AMCs have specific applications in the manufacturing of piston rings, engine parts, and blocks, etc. Further, Al2O3 possesses a density comparable to Al-alloys, good chemical affinity with Al-alloy matrix material, and doesn't form intermetallics during low-temperature processing[11, 12].In addition to the above, Al2O3 has appealing properties like good strength, good wear resistance, good chemical resistance at elevated temperature, good hardness, and high thermal conductivity[13]. Ahmadi et al [14] fabricated pure aluminum matrix hybrid composite reinforced with Al2O3 and SiC particles and revealed that tensile strength increased whereas percentage elongation decreased with alumina's addition. Sajjadi et al [15] have investigated the effect of Al2O3 particles on the mechanical behavior of A356 alloy-based composites and found an improvement in hardness, compressive strength, and proper distribution of reinforcement particles in the matrix. Chou et al [16] have developed A356/Al2O3, Al6061/Al2O3, and Al1050/Al2O3 composites with a varying weight percentages of Al2O3. Fabricated composites were undergone microstructural and mechanical testing and found an improvement in hardness, bending strength, and fracture toughness with the addition of Al2O3. Rahimian et al [17] developed Al-Al2O3 composites through powder metallurgy and observed the effect of reinforcement on yield strength and elongation. Yield strength and elongation improved more with fine alumina particles than to the coarse particles.
Among the different AMC's development processes, powder metallurgy (P/M) possess some specific features like uniform distribution of reinforcement, low processing temperature, minimum material loss, good dimensional accuracy, and easily controlled processing. The other advantage of this technique is that the matrix and reinforcement are mixed in the solid-state, which overcomes non-wetting between the reinforcements and liquid metal and prevents the formation of any undesirable phases. Further, particles and whiskers form of reinforcement particles can easily be used through the powder metallurgy process[18, 19].
Artificial neural networks (ANN) based modeling has also been used to model and predict physical, mechanical, and tribological responses of different materials developed by manufacturing processes [20, 21]. ANN has a very fast problem-solving ability. It can learn, train, and predict irrespective of the database size and the need for detailed experimental evidence or basic sciences behind the processes. It possesses the excellent capability to modify the loss function to identify minute differences and better represent the data [22, 23]. Hence it can also be used for developing relations between process parameters and their outcomes with the limited number of experimental trials.
Argatov et al [24] employed the ANN technique to analyze sliding wear of zirconia reinforced Al–SiC hybrid composites and Inconel 600 alloy. The differential ANN-based models successfully imitated the sliding wear behavior under the constant testing conditions. Alam et al [25] optimized A356/SiCn nanocomposites' tribological behavior using the feed-forward back propagation method and compared the predicted performance with experimental results. It was found that the developed ANN model possesses prediction capability much more compare to regression and the Taguchi method. Canakci et al [26] developed an ANN-based model to predict green density, sintered density, and hardness of Al-Al2O3 metal matrix composites (MMCs). A maximum 5.53% mean absolute percentage error was found for the predicted values compared to the experimental ones.
The literature review reveals very little work is available for where transition metals like Fe, Cr, and Mn, etc., are incorporated in the Al matrix. The addition of these metal particles with Al matrix greatly improves the composites' thermal stability, which plays an important role during frictional loading or thermally loaded components like pistons, engine parts, etc. [27–29]. Hence, the Al-20Fe-5Cr powder mixture has been taken as matrix material, and Al2O3 particles are incorporated as reinforcement. Composites were prepared for varying wt.% (0-30) of Al2O3 and at different compaction pressures (200, 250 & 300 MPa). Furthermore, statistical analysis and ANN-based modeling have been performed for tensile behavior in terms of tensile strength and elongation percentage.
Therefore, the present work was carried out with the following objectives: (a) to investigate the effect of Al2O3 addition and compaction pressure on tensile strength and elongation percentage; (b) to analyze the effect of compaction pressure and Al2O3wt.% using statistical analysis; (c) to develop ANN models to predict tensile strength and elongation percentage.
2. Experimentation and testing
2.1. Material selection and powder synthesis
This study used aluminum, chromium, iron, and aluminum oxide powder particles, purchased from Otto Chemie Ltd Mumbai, India, and MEPCO (Metal Powder Company) Limited, India. The specification of the powders purchased was as follows:
- Pure aluminum (Al) powder: purity 99.7% and average particle size 48 μm.
- Iron (Fe) powder: purity 99.5% and average particle size 150 μm.
- Chromium (Cr) powder: purity 99.9% and average particle size 100 μm.
- Aluminum oxide (Al2O3) powder: purity 99% and average particle size of 100 μm.
The size distribution of different powder particles (Al, Fe, Cr, and Al2O3) was examined using a particle size analyzer and is presented in the author's previous published paper [30].
The calculated powders were weighed by a precision weighing balance (Digital weighing balance, readability 0.01 mg, Make Precisa, Model No ES225SM-DRSCS) and mixed to prepare composition Al-20Fe-5Cr - X wt.% Al2O3 (X = 0, 10, 20, 30% by weight). For it, a ball mill (Fritsch Pulverisette MM-1522) was used and run at a constant speed of 115 rpm for 20 min. During the mechanical mixing process, 0.5 wt.% of stearic acid (C18H36O2) was also added into the blend that prevented excessive cold welding of Al metal particles among themselves and onto the surface of vial and balls.
2.2. Die set preparation and powder filling
Test specimens of aluminum alloy (Al-20Fe-5Cr) matrix composites were fabricated using die set as per Metal Powder Industries Federation (MPIF) standard No. 10 [31]. A standard test specimen drawing and fabricated die set up used for compaction of synthesized powder are shown in figures 1 and 2.

Figure 1. MPIF standard tensile specimen. Reproduced with permission from [18] [© 2019 Kandala et al., published by De Gruyter].
Download figure:
Standard image High-resolution image
Figure 2. Fabricated MPIF standard dies set up.
Download figure:
Standard image High-resolution imageAfter a thorough cleaning of the die walls using ethanol and lubricated by zinc stearate powder, the die cavity was filled by the powder for further compaction cycle. The process of cleaning and lubricating was repeated before each compaction cycle. The pre-calculated eight-gram powder was weighed on a digital scale and then filled in the die cavity manually.
2.3. Compaction cycle and test specimens fabrication
The powder-filled die set up was placed on the hydraulic press's circular base plate and screwed down the upper plate to touch the upper punch's top face. Once the system gets ready for compaction, the press was switched ON, and the upper punch was forced into the die to compress the powder. The specimens were prepared at three compaction pressures viz. 200, 250, and 300 MPa. Uni-axial compaction is considered in our work due to its cost-effectiveness, suitability for mass production, and simple geometry. Further, it facilitates the minimal effect of loading rate and time [32]. Powder mixtures undergo rearrangement, elastic and plastic deformation, bulk compression, and cold welding during the compaction process, with or without fragmentation. The more cold welding and mechanical interlocking at inter-particles contact result in higher green strength of compact because of higher contact area and reduced porosity. For each run, the sample was kept in a die under pressure for half a minute to reduce the effects of backpressure produced.
Figure 3 shows the fabricated compacts for varying weight percentages of alumina at different compaction pressure.
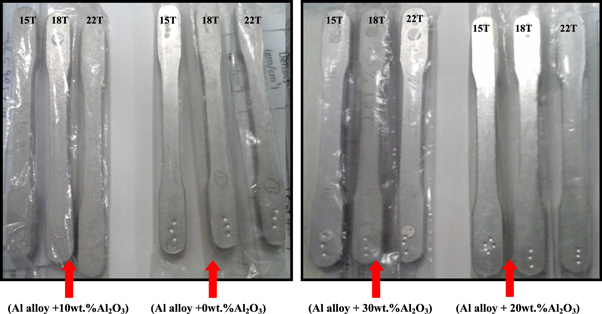
Figure 3. Fabricated Al-20Fe-5Cr-Al2O3 tensile test specimens.
Download figure:
Standard image High-resolution image2.4 Sintering and testing of specimens fabricated
Fabricated specimens were sintered in an electric tubular furnace (Indigenous, Temp. ranges: 0 °C–1800 °C) at temperature 580 °C as per three-stage heating profile shown in figure 4 under controlled environment argon throughout the process. The heating and cooling rate were 10 °C and 15 °C per minute. Pre-sintering burns off additives, moisture, etc., and improves compacts' integrity for the sintering process. The sintered tensile specimens were then tested for tensile strength and percentage elongation on universal Tensile Tester (UTM-G-4108). Moreover, three samples with the same specifications (compaction pressure and weight percentage) were tested separately for tensile strength and percentage elongation, and the average value was considered for further analysis.
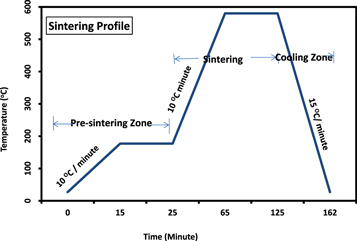
Figure 4. Heat treatment cycle for the sintering process.
Download figure:
Standard image High-resolution image3. Statistical analysis and ANN modeling
3.1. Statistical analysis
Statistical analysis of experimental data for tensile strength and percentage elongation has been performed using MINITAB-19. The study includes; developing a regression model, identifying optimal value, and using variance analysis (ANOVA) to assess the parameters significantly affecting tensile strength and percentage elongation. The experimental findings are converted into a new parameter, known as signal-to-noise (S/N) ratio. It merges the repetition of data and results in noise levels at one data point. The calculated S/Nvalues were processed to key out the statistically significant parameters for tensile strength and elongation percentage. The S/N values for tensile strength were calculated under the larger-the-better characteristic, while for percentage elongation, S/N values were calculated as smaller-the-better characteristics. ANOVA determines the significance of parameters under investigation at the desired significance level. It also determines the percentage contribution of the parameters under study. The percentage contribution of significant control parameters is calculated by dividing the sum of squares of a parameter by the total sum of squares.
3.2. ANN modeling
ANNs work on the human brain's blueprint and are made up of neurons (figure 5). Each neuron has three basic elements, i.e., weights, bias, and the transfer function. The network has three portions; the input layer, which receives data from the user, the output layer that disposes the processed outcomes, and the hidden layer that processes, transmits, and learns the relation between them. Firstly, the network trains itself according to the given data, i.e., continuous modification of weights and biases at each neuron to obtain the output using proper network architecture. The training step taught the model about the relation between the inputs and outputs. The architecture of network denotes the number of hidden layers and the neurons in each hidden layer.

Figure 5. A typical neuron with its constituents.
Download figure:
Standard image High-resolution imageFurther, the transfer function is also be needed to fix before functioning. The selection of the transfer function and learning algorithm is based on iterative analysis for optimum performance. In our case, Levenberg-Marquardt (L/M) algorithm, also known as the damped least-squares method, was used as a learning algorithm for the data under which the 'weight' and 'bias' of the neurons are adjusted according to predicted results to achieve close results. Furthermore, tan-sig and pure-lin transfer functions were used at hidden and output nodes, respectively.
In the adopted ANN model for this work, feed-forward backpropagation (FFBP) has been fixed due to its simplicity, storing ability, fast training, and structured parallel computing. Furthermore, a three-layer design (2-10-2) is selected: an input layer having two nodes, a hidden layer with ten nodes, and an output layer with two nodes shown in figure 6. The limitation to just one hidden layer is justified because one hidden layer is enough to approximate any continuous linear as well non-linear function [33].

Figure 6. Three-layer ANN structure.
Download figure:
Standard image High-resolution image4. Result and discussion
4.1. Tensile strength and percentage elongation
The variation of tensile strength with respect to alumina reinforcement and compaction pressure is shown in figure 7. It is evident from this figure that as the concentration of alumina have been increased up to 20 wt.% in aluminum alloy matrix its tensile strength have been enhanced sharply. This remarkable enhancement in the mechanical property could be attributed to the following reasons:(a) due to load-bearing capacity of hard ceramic reinforcement (b) due to the difference in coefficient of thermal expansion of reinforcement (10−6/°C) and matrix (25 × 10−6/°C) particles [34–36]. (c) hard alumina particles act as a barrier to the dislocation movement [37] (d) strong interfacial bond between alumina and matrix material [38].

Figure 7. Effect of both compaction pressure and varying weight percentage of Al2O3 on tensile strength.
Download figure:
Standard image High-resolution imageFurther, the increment of alumina reinforcement deteriorated the tensile strength from 150 to 130 MPa for the composites synthesized at 200 MPa. The property declined significantly by 13%. This decrease in tensile strength has been mainly due to agglomeration and clustering of alumina microparticles at high concentrations. Moreover, a high concentration of hard ceramic reinforcement also hinders the compaction process, which leads to the formation of micro porosities in aluminum alloy composite. These available porous locations provide the failure cite during tensile loading as the porosity is considered as zero mechanical strength. However, the tensile strength again showed a slightly increasing trend with respect to an increase in compaction pressure. This enhancement could be due to the reduction in porosity at high compaction pressures. Figure 8 shows the elongation curve of composite with alumina reinforcement addition. This plot is showing the different trends in comparison to the tensile strength graph. Figure 8 showed that as the concentration of alumina increases in the composite, the elongation had been reduced. The addition of alumina increases the stress concentration in the composites, which could be the possible reason for the deterioration of elongation [39]. Similar observations were made by Rezayat et al [40] and Ahamad et al [41] for Al–Al2O3 composites and Al–Al2O3–C hybrid metal matrix composites, respectively.

Figure 8. Variation of percentage elongation with the addition of alumina at different compaction pressures.
Download figure:
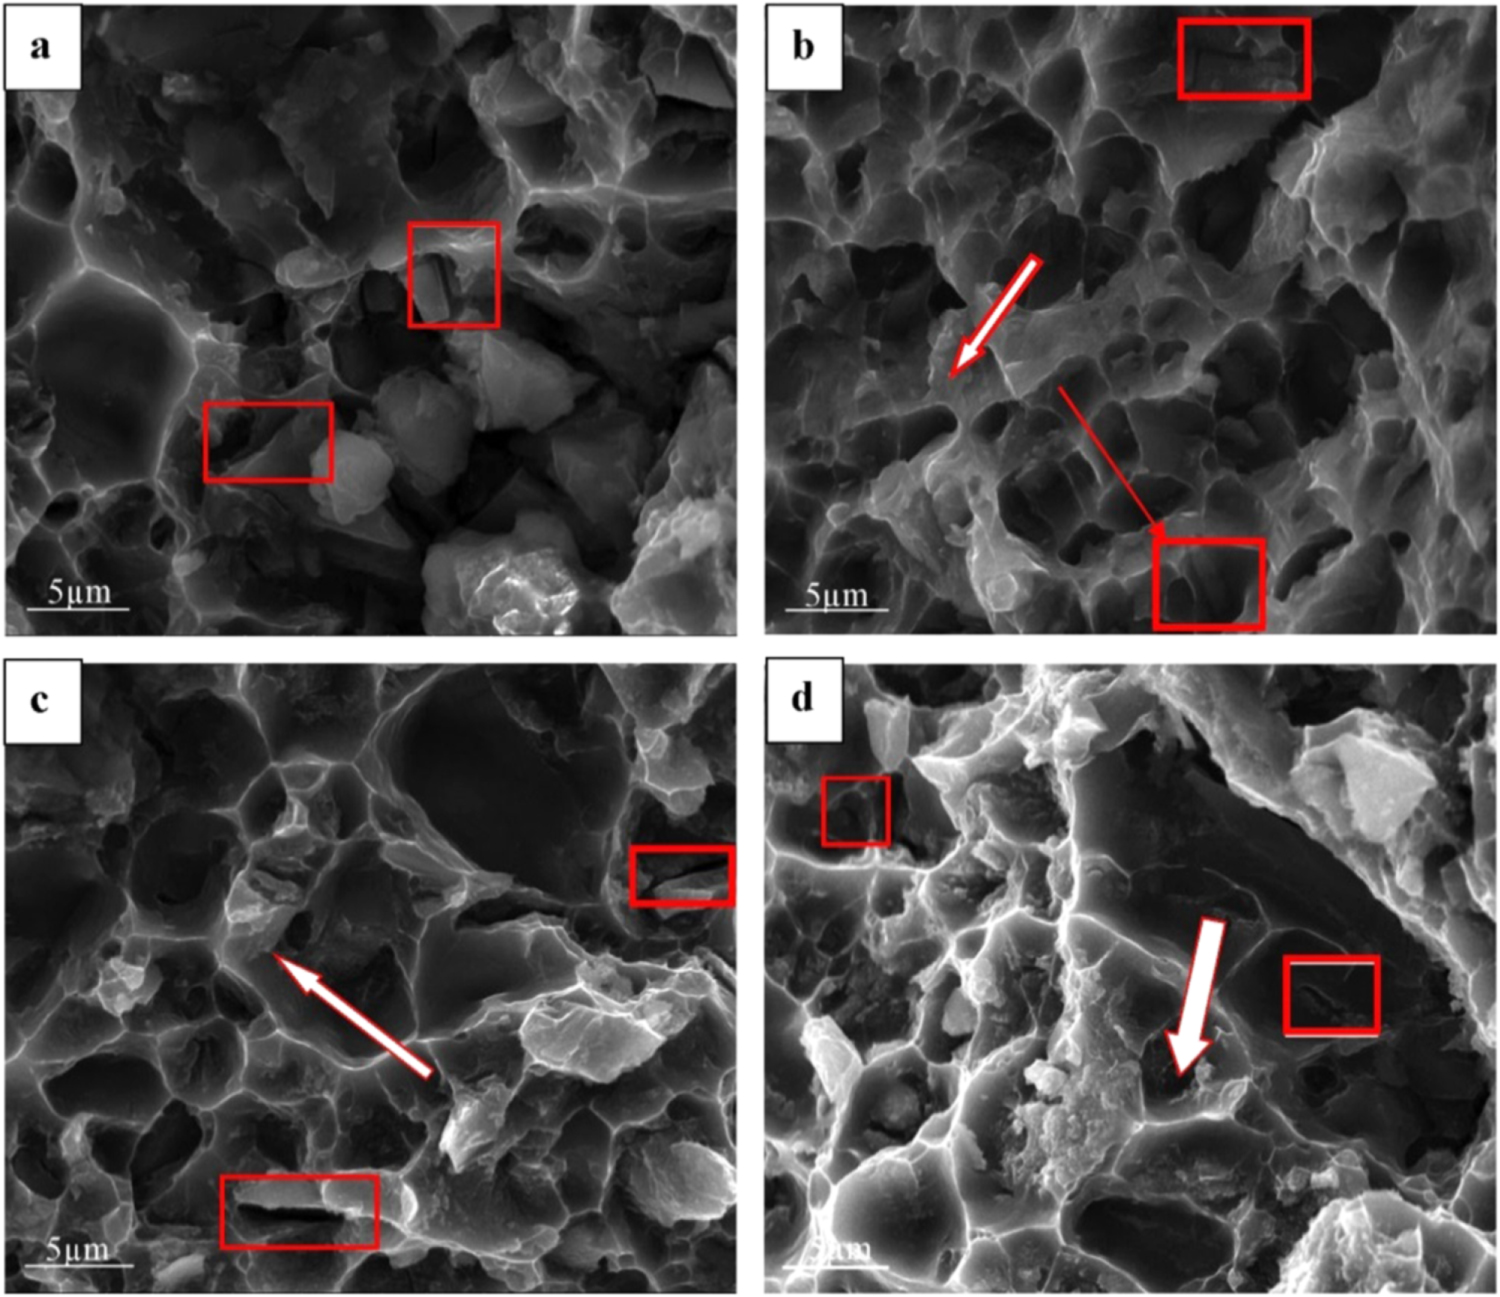
Standard image High-resolution imageThe fractographs of all specimens with alumina wt % (0, 10, 20 & 30 wt.) at 250 MPa have been shown in figure 9. The general appearance of all SEM images shows similar characteristics. The fractured surface of composites showed cleavage facets and cracks, as shown in the same figure with the rectangle's help. Additionally, de-bonding and particle pullout are also evident at the reinforcement and matrix interface, confirming the failure mode is a brittle fracture. The uniform distribution of reinforcement of alumina at low concentration is validated from fractographs, which is why enhancement in mechanical property. Further, the micro alumina particles get agglomerated at a high concentration, as shown in the same figure with rectangle help. This phenomenon reduced the tensile strength and elongation at 30 wt.% of alumina addition [41, 42].

Figure 9. The SEM fractographs of the fractured specimens with alumina (a) 0 wt.%, (b) 10 wt.%, (c) 20 wt.% and (d) 30 wt.% at 250 MPa.
Download figure:
Standard image High-resolution image4.2. Regression modeling and ANOVA implementation
4.2.1. Tensile strength
Tensile strength has been analyzed by considering it (tensile strength) as a response variable, both compaction pressure and reinforcement content as input parameters. A mathematical model was developed by expressing a relation between control factors and response variable using the regression technique [43]. The following equation was developed with an R2 of 90.5% for tensile strength.

The tensile strength model's adequacy represented by equation (1) is verified by a normal probability plot of residuals, as shown in figure 10. It can be seen in the plots that the points are close to the normal probability line, which is evidence of model adequacy. The plot of residuals versus also ascertains the adequacy fitted values, which is shown in figure 11. It is seen that the points in this plot are randomly scattered, and no specific pattern has been shown. Thus the mathematical model developed by formulating the equation (1) for tensile strength is adequate. The predicted values for tensile strength can be obtained by substituting the compaction pressure (MPa) and alumina content in equation (1).
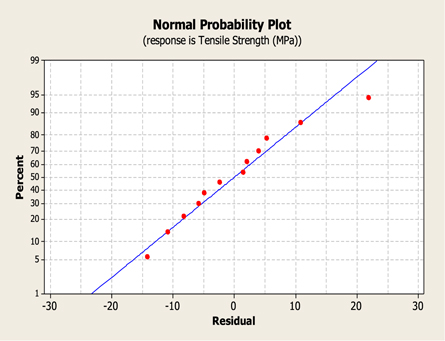
Figure 10. Normal probability plot for tensile strength.
Download figure:
Standard image High-resolution image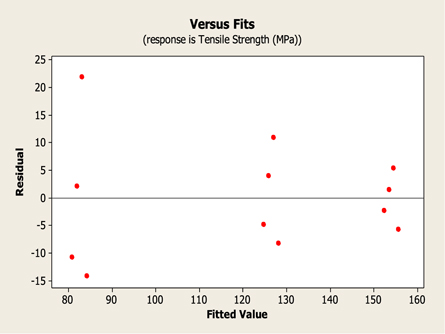
Figure 11. Residual versus fitted values plot for tensile strength.
Download figure:
Standard image High-resolution imageSNR table of the test process for tensile strength is given as table 1. The table shows the SNR at each level of input parameters. For each control factor, delta represents the difference between the maximum and minimum SNR value. Based on the delta value, the order of influence control factors is determined. The control factor with the maximum value of delta is the most significant one. In the case of tensile strength, as shown in table 1, the highest influential control factor is compaction pressure, followed by alumina weight percentage. Figure 12 shows the main effects plot for tensile strength of AMCs for SNR mean values. It is clear from figure 12 that in this case, compaction pressure is the most significant control parameter amongst both (compaction pressure and alumina %) since its plot represents more inclination than compaction pressure.
Table 1. Signal to Noise Ratios for tensile strength of AMCs (Larger is better).
| Level | Comp. Pr. (MPa) | wt.% alumina |
|---|---|---|
| 1 | 38.18 | 40.67 |
| 2 | 42.06 | 41.52 |
| 3 | 43.73 | 42.43 |
| 4 | 40.67 | |
| Delta | 5.11 | 1.77 |
| Rank | 1 | 2 |
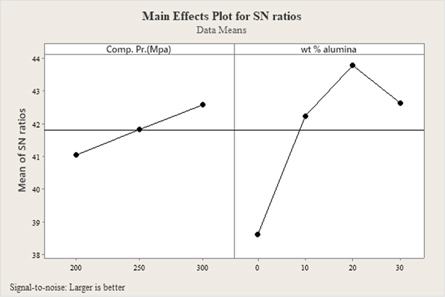
Figure 12. Main effects plot for SNR means for tensile strength.
Download figure:
Standard image High-resolution imageOptimal testing conditions of control factors for tensile strength can be ascertained from main plots, which correspond to 20 wt.% alumina and 300 MPa compaction pressure. The plot indicates that after 20 wt.% of alumina, there is a sharp reduction in tensile strength.
Analysis of variance (ANOVA) was performed to see the effect of process parameters on tensile strength shown in table 2. The analysis was carried out for a 95% confidence level. The factors with a level of significance, i.e., a p-value less than 0.05, are considered statistically significant. In ANOVA analysis, it is presumed that sampled populations are normally distributed and have equal variances. The normality of the population is checked by the normal probability plot of residuals, which resembles a straight line. The plot of residuals versus checks the constant variance fitted values, which shows no pattern.
Table 2. ANOVA result for tensile strength of AMCs.
| Source | Degree of freedom | Sum of squares | Means of squares | F-ratio | P-value | Percentage of contribution |
|---|---|---|---|---|---|---|
| CP(MPa) | 2 | 10440.5 | 5220.2 | 142.69 | 0.000 | 90.3 |
| Alumina % | 3 | 898.0 | 299.3 | 8.18 | 0.015 | 7.8 |
| Error | 6 | 219.5 | 36.6 | 1.9 | ||
| Total | 11 | 11558.0 |
S = 6.04842 R-Sq. = 98.10% R-Sq. (adj.) = 96.52%.
Figure 10, the normal probability plot is a straight line plot indicating that the population is normally distributed. Moreover, the constant variance assumption is also satisfied as the residuals versus fitted plot shows no pattern (figure 11).
The result of ANOVA for tensile strength is depicted in table 2. The last column of the table represents each control factor's percentage contribution on the total variation, thus indicating the influence on the properties tested. The contribution of compaction pressure is highest, which is 90.3%, whereas the contribution of alumina percentage is 7.8% on the tensile strength of AMCs.Compaction pressure plays a vital role in strengthening the sintering process's effectiveness as follows: a. increases the particles rotate and reposition themselves, increasing the extent of their deformation b. causes more plastic deformation, which leads to better packing and an increase in the effective contact area & c. a higher number of contact sites contributes to more mass diffusion mechanism or eliminates space/gapping between particles [44–46]. On the other side, alumina particles concentration-effect also dependent on the compressibility of powder mixture due to which the contribution of wt.% is very less as compare to compaction pressure [47–49].
4.2.2. Percentage elongation
Similarly, percentage elongation has been analyzed by considering it as the response variable and both compaction pressure and reinforcement content as input parameters. A mathematical model with the model summary as (S-2.58774, R2−90.56%, R2 (adj)−88.46%, R2 (pred)−82.86%) was developed using regression technique as shown by equation 2.

Similar to tensile strength adequacy of percentage elongation model represented by equation (2) is verified by the normal probability plot of residuals, as shown in figures 13 and 14. The predicted values for percentage elongation may be obtained by substituting the compaction pressure (MPa) and alumina content in equation (2).
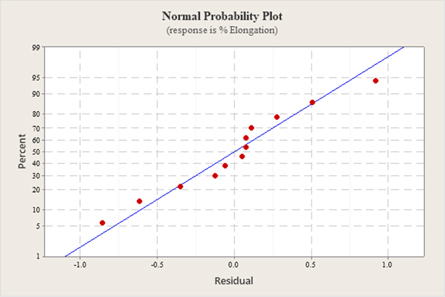
Figure 13. Normal probability plot for % elongation.
Download figure:
Standard image High-resolution image
Figure 14. Residual versus fitted values plot for % elongation.
Download figure:
Standard image High-resolution imageSNR table of the test process for percentage elongation is given as table 3. The table shows the SNR at each level of input parameters. Based on the delta value, the influence level of control factors is determined. For percentage elongation, the most significant control factor (with a maximum value of delta) is wt.% alumina, followed by compaction pressure. Figure 15 shows the main effects plot for percentage elongation for SNR mean values. It is clear from the figure that wt.% alumina is the most significant control parameter since its plot represents more inclination than compaction pressure.
Table 3. Signal to Noise Ratios for percentage elongation (smaller is better).
| Level | Comp. Pr. (Mpa) | wt % alumina |
|---|---|---|
| 1 | −18.08 | −27.57 |
| 2 | −20.43 | −21.50 |
| 3 | −22.16 | −19.65 |
| 4 | −12.18 | |
| Delta | 4.07 | 15.38 |
| Rank | 2 | 1 |
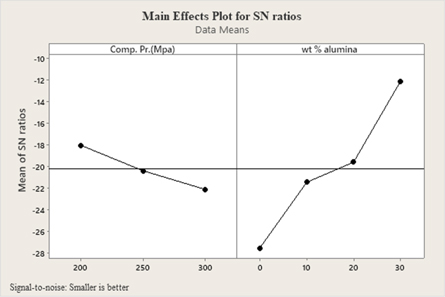
Figure 15. Main effects plot for SNR means for percentage elongation.
Download figure:
Standard image High-resolution imageAnalysis of variance (ANOVA) was carried out for a 95% confidence level and p-value < 0.05. In ANOVA analysis, it is presumed that sampled populations are normally distributed and have equal variances. The normality of population and constant variance is checked by the normal probability plot of residuals and residuals versus fitted values. Both satisfy the conditions explained in the case of tensile strength.
It is evident from the result of ANOVA for percentage elongation, as shown in table 4, that contribution of wt.% alumina is highest, i.e., 93.98%, whereas the contribution of compaction pressure is 6.01%. It is due to the initiation of fine micro-cracks by brittle reinforcement content [43], which plays a significant role in the elongation during tensile testing. On the other hand, compaction pressure doesn't impact much during dynamic loading conditions [50].
Table 4. ANOVA result for percentage elongation.
| Source | DF | Adj SS | Adj MS | F-Value | P-Value | Percentage of contribution |
|---|---|---|---|---|---|---|
| Comp. Pr.(MPa) | 2 | 26.015 | 13.008 | 31.75 | 0.001 | 6.01 |
| Wt % alumina | 3 | 610.029 | 203.343 | 496.29 | 0.000 | 93.98 |
| Error | 6 | 2.458 | 0.410 | 0.01 | ||
| Total | 11 | 638.503 | 6.01 |
4.3. ANN implementation and predicted results
70% of the data sets were utilized for the developed model's training purposes from the total experimental data. The rest of the data sets are used for testing the proposed ANN model. The mean square error (MSE) was used for the ANN model's performance conformance, i.e., model will continue it functioning until it reaches the MSE, as shown in figure 16. Figure 16 shows that even with a very small number of epochs (437), the network attains accuracy.

Figure 16. Neural Networks training tool.
Download figure:
Standard image High-resolution imageFigures 17 and 18 shows the comparison drawn among the experimental and predicted data set of training, validation, testing, and combined set. The entire above performance curve showed a remarkable coincidence between experimental and predicted results due to the model's good training. Hence, the trained model gave the prediction with minimal error, and it can also be used to predict the unknown value for the future. Regression coefficient (R), which stands for the correlation between the output and target, had value 1 as it concludes that the quality is better.

Figure 17. ANNs training, validation, and testing performance curve for the developed model.
Download figure:
Standard image High-resolution image
Figure 18. Performance curves for the developed model.
Download figure:
Standard image High-resolution imageFurthermore, the validation and accuracy of the designed ANN model were performed for the validation data sets (Readings 3, 6, 9, and 12), not used for training purposes. The comparative results are shown in figures 19 and 20. The experimental values and ANN predicted values for tensile strength and percent elongation are too close to each other, indicating a low error difference. Similar studies [51–53] also support the effectiveness of our developed ANN models.

Figure 19. Experimental and Predicted Tensile Strength.
Download figure:
Standard image High-resolution image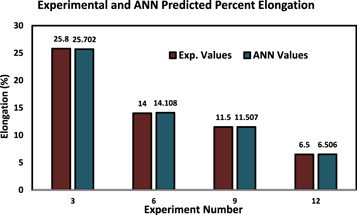
Figure 20. Experimental and Predicted % Elongation.
Download figure:
Standard image High-resolution image
5. Conclusions
In this work, the Aluminum alloy (Al-20Fe-5Cr) matrix reinforced with 0-30 wt.% alumina (Al2O3) composite has been developed at three compaction pressures (200, 250 & 300 MPa) through the powder metallurgy technique. The specimens were tested for tensile strength and percentage elongation. Moreover, statistical and artificial neural network (ANN) modeling of experimental data has been performed. Based on the experimental, statistical, and modeling studies, the key findings are summarized as follows:
- i.Tensile strength of the composite increases with an increment in Al2O3 wt.% for 0%–20%. However, the same dropped for 30 wt.% of Al2O3. The same trend has been observed at all compaction pressure.
- ii.Percentage elongation decreases with the addition of Al2O3 (0–30 wt.%) for all compaction
- iii.pressures (200, 250 & 300 MPa).
- iv.Statistical analysis of tensile behavior showed that compaction pressure has a significance of about 90 and 6% for tensile strength and elongation, respectively, on the contrary, reinforcement wt.% has a signification of 8 and 93%, respectively, on the tensile strength and elongation percent.
- v.The ANN model with 2-10-2 architecture has been trained and tested successfully. The obtained predicted values of both tensile strength and percent elongation were in fairly good agreement with experimental values, i.e., regression coefficient value approx. 1.
- vi.Therefore, the designed model can be effectively used for prediction of tensile behavior of
- vii.AMCs.