


Abstract
The proposals for realizing exotic particles through coupling of quantum Hall effect to superconductivity involve spatially non-uniform magnetic fields. As a step toward that goal, we study, both theoretically and experimentally, a system of Dirac electrons exposed to an Abrikosov flux lattice. We theoretically find that the non-uniform magnetic field causes a carrier-density–dependent reduction of the Hall conductivity. Our studies show that this reduction originates from a rather subtle effect: a levitation of the Berry curvature within Landau levels broadened by the non-uniform magnetic field. Experimentally, we measure the magneto-transport in a monolayer graphene-hexagonal boron nitride-niobium diselenide (NbSe2) heterostructure, and find a density-dependent reduction of the Hall resistivity of graphene as the temperature is lowered from above the superconducting critical temperature of NbSe2, when the magnetic field is uniform, to below, where the magnetic field bunches into an Abrikosov flux lattice.
Export citation and abstract BibTeX RIS
Introduction
A promising strategy for creating particles obeying non-Abelian braiding statistics, which may be useful for quantum computation [1], is to integrate superconductivity into the integer quantum Hall (QH) effect, which can produce topological superconductivity (TS) supporting Majorana particles [2–13]. One of the (many) practical challenges toward achieving this goal is that the strong magnetic field required for the QH effect usually kills superconductivity. Even if systems can be found wherein superconductivity survives to sufficiently high magnetic fields, a fundamental difficulty is that a gapped QH state does not couple to a superconductor in a meaningful manner. One can overcome this impediment by considering non-uniform magnetic fields, which produce "dispersive" Landau levels and thus allow, when partially filled, proximity coupling to superconductivity [12,13]. This motivates, as a first step, the need to gain an understanding of the QH effect in the presence of non-uniform magnetic fields. In practice, such non-uniform fields are naturally produced by the nearby superconductor itself, in the form of an Abrikosov flux lattice.
We study, both theoretically and experimentally, a system of Dirac electrons exposed to an Abrikosov flux lattice. Theoretically, we find that non-uniformity of the magnetic field causes a carrier-density–dependent reduction of the Hall conductivity. We explain this reduction qualitatively and semi-quantitatively as a consequence of a rather subtle effect, namely levitation of the Berry curvature in broadened Landau levels. Experimentally, we explore magnetotransport in a monolayer graphene-hBN-NbSe2 heterostructure, in which the electron and hole gases in graphene are exposed to an Abrikosov flux lattice threading through the NbSe2 layer for temperatures below  . We contrast our results with an earlier work [14] below.
Theory
We consider the model of non-interacting electrons hopping on a lattice subject to an applied magnetic field. Because the Abrikosov vortices themselves form a triangular lattice, it is most natural to consider electrons hopping in a hexagonal lattice, for which we have chosen the honeycomb lattice, which produces Dirac electrons. The Hamiltonian for this model is

where  and cm
are creation and annihilation operators for electrons at site m,
and cm
are creation and annihilation operators for electrons at site m,  is the hopping matrix element from site n to m, the phases
  are determined by the local magnetic field up to a gauge transformation, and the sum
  is over nearest neighbor sites. We denote the distance between neighboring sites by a and quote all lengths in units of a. We choose the magnetic unit cell (MUC) so that the net flux through it is
  . Our choice of periodic gauge is discussed in the Supplementary Material Supplementarymaterial.pdf (SM)
1
. The energy spectrum of the honeycomb lattice near E = 0 in the uniform magnetic field consists of flat Landau bands which come in degenerate pairs. This degeneracy is due to the presence of two Dirac cones in the B = 0 spectrum which occur at inequivalent momenta. The spectrum is discussed in more detail in the SM.
. Our choice of periodic gauge is discussed in the Supplementary Material Supplementarymaterial.pdf (SM)
1
. The energy spectrum of the honeycomb lattice near E = 0 in the uniform magnetic field consists of flat Landau bands which come in degenerate pairs. This degeneracy is due to the presence of two Dirac cones in the B = 0 spectrum which occur at inequivalent momenta. The spectrum is discussed in more detail in the SM.
Our neglect of interaction between electrons is justified for the following reasons. To begin with, we are concerned with high filling factors where correlation effects are not dominant. Further, the main effect of interaction is to renormalize the Fermi velocity of Dirac electrons, to which our results below are not sensitive. Finally, we focus here on the changes that arise when the temperature is reduced from above  to below, and do not expect the effect of interaction to change substantially during this process.
We model the magnetic field of an Abrikosov vortex as

Here d characterizes the size of the vortex, r is the distance from the center, and the constant C is chosen so that the total flux through each vortex (integrated over the MUC) is the superconducting flux quantum  . The separation between two neighboring vortices will be denoted by l, which is also proportional to the lattice constants of the MUC, as shown in fig. 1. We shall present our results in terms of the dimensionless parameter d/l, and will be interested in the continuum limit, where both d and l tend to infinity, with the ratio d/l held constant.
To calculate the Hall conductivity using the method first described by Thouless et al. [15], one defines the non-Abelian Berry connection, determined by the eigenstates  , as
, as

where  is the shorthand notation for
  . The Berry curvature F is then defined as

The only non-zero compnents of F are  . The Hall conductivity is then given, in units of
  , by the Berry curvature integrated over the Brillouin zone:

where the trace is over occupied states. If the Fermi level  lies in a gap,
  is given by a topological index called the first Chern number C, which takes integer values. If the Fermi level lies in a band, the Hall conductivity is no longer an integer. We compute eq. (5) numerically [16]; see SM for details.
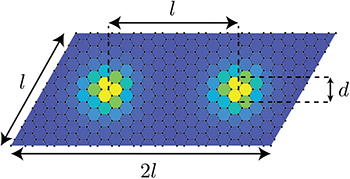
Fig. 1: The magnetic flux profile within a magnetic unit cell. The lattice constant of the triangular Abrikosov flux lattice is l. Each flux of size d is centered on a site and is modeled with the Lorentzian profile of eq. (2).
Download figure:
Standard imageFor values of d/l corresponding to the experiment, we find that the computed values of  for non-uniform magnetic fields are less than those for uniform magnetic fields, as shown in fig. 2(a). To quantify the reduction of Hall conductivity, we introduce the quantity

The ratio  is more natural than α from the theoretical perspective. As indicated in fig. 2(a),
  varies linearly with ν for uniform B, as expected, and approximately linearly with ν also for non-uniform B over the ν range considered in our calculation
  . The reduction increases with decreasing d/l. An earlier calculation [17] of
  did not evaluate the continuum limit, which, as we see below, significantly alters the results. We also use a more realistic profile for the flux, placing the center of the vortex at a lattice site, as opposed to at the center of a plaquette, which gives a much better convergence to the continuum limit for small d/l. Additionally, we work with Dirac electrons as appropriate for graphene.
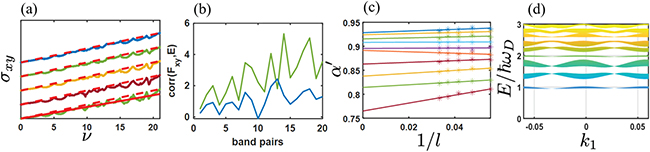
Fig. 2: (a) The colored curves show the Hall conductivity  (in units of
  ) plotted against filling factor ν for (from the bottom to top)
  , 0.08, 0.12, 0.16, 0.2. All curves begin at
  but are vertically offset for ease of comparison. The dashed red lines above each colored curve show the Hall conductivity in uniform field. The solid red line is the best linear fit (shown only for
  to avoid clutter), the slope of which gives
  . (b) The correlation between the Berry curvature and energy (eq. (7)) for pairs of degenerate bands up to pair 20. The green curve is for
  and the blue curve is form
  . The correlation is generally positive for each pair and increases as d/l is made smaller. (c) Continuum limit extrapolations of
  for (from bottom to top)
  . The lines are linear fits. (d) The LL bands for
  as a function of k1 as viewed along the k2-direction (where
  ,
,  are magnetic reciprocal lattice unit vectors.) The bands at E = 0 are flat and not visible in this figure. Whenever the chemical potential lies in a gap between two successive bands,
  touches its classical values, as seen in panel (a).
Download figure:
Standard imageAn important question is: What is the physical mechanism for the reduction of Hall conductivity in the presence of non-uniform magnetic fields? An obvious possibility is that some of the bands (see fig. 2(d)) become trivial, i.e., they have C = 0, and thus do not contribute to the Hall conductivity. However, we find in our calculations that all physically relevant degenerate pairs of Landau bands carry shared Chern number C = 2 even for the most non-uniform magnetic field that we have considered  . Certain bands have large and negative C (to ensure that the total Chern number is zero), but these bands occur at relatively high fillings (see SM for further details); we include only bands that are sufficiently far from these bands.
The bands are broadened due to non-uniform B, but that also would not cause a correction to  so long as the Berry curvature is uniformly distributed in energy. This implies a subtle origin for the reduction of
  , namely a levitation of the Berry curvature within each broadened Landau band. This is corroborated by computation (for degenerate pairs of bands) of the correlation between the Berry curvature
  and energy
  , given by

where Γ is the bandwidth and  is the average energy of the band. We find that this quantity is generally positive (fig. 2(b)), implying that the Berry curvature tends to move away from the low-energy states and concentrate near the high-energy states. When the Fermi energy enter into a band, the low-energy states are occupied first and thus contribute less Berry curvature for non-uniform magnetic B.
Because both the magnetic length and size of the Abrikosov fluxes are large compared to the lattice constant for the experimental parameters, we focus on the continuum limit where  with d/l constant. The extrapolation of
  to the continuum limit is shown in fig. 2(c), where we have chosen to fit within the filling factor region
  . The resulting continuum values of
  as a function of d/l are shown by diamonds in fig. 3. We have used the value of
  [18]. The filling factor range
  accessible to our theory corresponds to carrier concentration up to
  .
.
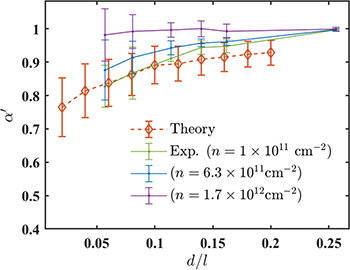
Fig. 3: Comparison between experiment and theory for the d/l dependence of  . The theoretical curve is obtained by averaging up to
  , which corresponds to a density of
  (
( ) for
) for 
 .
.
Download figure:
Standard imageFigure 4 shows the reduction factor  for
for  when fitted up to
  ; the value
  is larger than
  obtained by fitting up to
  (fig. 2(a)). The quantity
  thus depends on the filling factor range available, and, in fact, increases as the filling factor increases, as shown in the inset of fig. 4. We stress that the results shown in the inset are for l = 30, and do not represent the continuum limit. The increase in
  can be understood from the observation that the reduction is roughly proportional to the fraction of Landau bands that cross the Fermi energy; this fraction vanishes in the limit of very high fillings. This feature of theory is also consistent with the experimental density dependence of
  . We are not able to obtain continuum limit values of
  for large values of
  , but cannot rule out the possibility that
  in the limit of very large
  or large densities (see SM for further details).
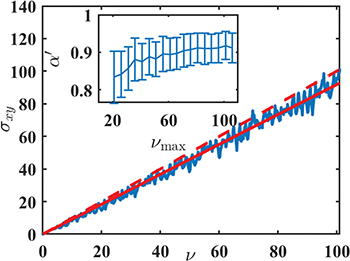
Fig. 4: The Hall conductivity, along with the best linear fit up to  , for a calculation with l = 30 and
  . The inset shows the dependence of
  on
on  . The shown range of
  corresponds to densities
  to
to  .
.
Download figure:
Standard imageExperiment
In this section, we will present our experimental results. Device schematic and measurement setup for the experiment are shown in fig. 5(a). The device consists of graphene/hBN heterostructure on a SiO2/Si substrate. The heterostructure was achieved by the standard hot pick-up technique [19]. Contacts were made on graphene in Hall bar geometry using E-beam lithography, and followed by thermal deposition of Cr(5 nm)/Pd (13 nm)/Au (70 nm). A top hBN then covered the device and followed by transfer of a thin NbSe2 flake ( ) as highlighted in our previous work [20]. The top hBN has a thickness of
  , which acts as an insulating layer between the graphene channel and the NbSe2 superconductor. As discussed in the SM, this thickness prevents any proximity induced superconductivity in graphene layer; we have also ruled out shorting between graphene and NbSe2 from a lack of current between them at room temperature. Standard four-probe measurements are performed using Lock-In amplifier by current biasing the graphene channel and measuring
  (longitudinal voltage) and
  (transverse voltage) simultaneously. The mobility of the graphene was
  /V/s. The measurements were done in a He3 cryostat in the temperature (T) range of 250 mK to 15 K. The measured longitudinal
  and Hall resistance
  as a function of the back gate voltage
  at magnetic field
  and temperature
  are shown in fig. 5(b). The
  and
and  were measured at several applied magnetic fields in the range from 10 mT to 200 mT. We have measured
  for +B and −B, then taken averaged
  in order to eliminate the finite contribution coming from the
  component (see SM for details). Similarly, we have measured the
  and
and  at several magnetic fields above
  (see SM). Figure 5(c) shows the ratio
  as a function of the carrier concentration (n) for 20 mT and 80 mT. In fig. 5(c), the solid lines are the raw data and the dashed linear lines are the linear fittings to obtain the mean value. It can be seen from fig. 5(c) that α fluctuates around unity at higher n and gradually decreases with lowering n. The fluctuations in α, which decrease with increasing magnetic field, are a mesoscopic phenomenon. In fig. 5(c) we show the data for the hole side as the fluctuations for hole carriers are of smaller magnitude, as can be seen in the
  plot in fig. 5(b). The carrier concentration is determined by
  , where
  is the geometrical capacitance of SiO2 dielectric. In fig. 5(d), we summarize the mean value of α as a function of magnetic fields for several values of n. Its value decreases monotonically with n, and increases with magnetic field, reaching unity around
  . In order to compare with the theoretical results, one needs to convert the Hall resistivity to Hall conductivity. As can be seen from the SM that for our experiment, Rxx > Rxy, implying
  . As a result,
  . Thus,
  will be very similar to
  , as shown by the green line in fig. 3. One can find a qualitative agreement between theoretical and esperimental results.

Fig. 5: (a) Device schematic: Abrikosov vortices (red color) are formed in the  thick NbSe2 flake and threaded into graphene layer residing at
  (hBN thickness) below the NbSe2. A constant current is injected in the graphene channel using the left-most and right-most contacts. The longitudinal and transverse Hall voltages are measured using the inner four contacts. (b) Measured longitudinal and Hall resistance as a function of the back gate voltage at
  and
and  . (c)
. (c)  for
for  (solid red line) and
  (solid black line) as a function of hole carrier concentration. The dashed lines are the linear fittings to obtain the mean value. (d) Mean value of the α as a function of magnetic field for several values of n. The error bar indicates the standard deviation of the fluctuations of α in fig. 1(c).
Download figure:
Standard imageDiscussions
One may wonder if other physics might contribute to the reduction of the Hall conductivity, such as hydrodynamic [21] or ballistic effects [22]. As discussed in detail in the SM, these effects are not relevant under the present experimental conditions: the hydrodynamic effects are seen only in extremely clean samples in the intermediate temperature regime (50–150 K) and ballistic effects are seen only in narrow channels [22]. How these effects are modified for non-uniform magnetic fields is an interesting question for future studies. We note that a previous work [14] investigated similar physics but in a different regime. They studied electrons with parabolic dispersion (GaAs-based two-dimensional electron gas), and the locations of the fluxoids in that work were determined mainly by the presence of random disorder in the superconductor. While they also observed a reduction of the Hall resistance, they found that α saturates for very small d/l. The origin of this difference is not clear at the moment.
Conclusions
In conclusion, our principal finding is that a non-uniformity in magnetic field causes a levitation of the Berry curvature in broadened Landau levels, which, in turn, results in a reduction of the Hall conductivity, as seen qualitatively by our experiment. Another aspect of our calculations is worth stressing, that the low-lying Landau levels remain surprisingly well defined even for highly non-uniform magnetic fields (see fig. 2(d)), implying that QH effect ought to be observable even when the size of the Abrikosov fluxes is much smaller than their separation. This provides an optimistic outlook for the realization of topological superconductivity by coupling QH effect and superconductivity.
Acknowledgments
The work at Penn State was supported in part by the U. S. Department of Energy, Office of Basic Energy Sciences, under Grant No. DE-SC0005042 (JKJ); by Kaufman New Initiative research grant KA2018-98553 of the Pittsburgh Foundation (JS and C-XL); and by the Office of Naval Research (Grant No. N00014-18-1-2793) and the U.S. Department of Energy (Grant No. DESC0019064) (C-XL). The numerical calculations were performed using Advanced CyberInfrastructure computational resources provided by The Institute for CyberScience at The Pennsylvania State University. AD thanks Ministry of human resource development (MHRD), India for the financial support under Scheme for Promotion of Academic and Research Collaboration (SPARC/2018-2019/P1178/SL).
Footnotes
- 1
The SM presents device characterization, measurement methods, relevance of other possible effects and the role of mesoscopic conductance fluctuations. It also discusses the energy spectrum of the theoretical model, the method by which the phases in the MUC are determined, how the Hall conductivity is computed, the Chern numbers of the Landau bands, and more details about the density dependence of
 .
.
