Novel Molecular Markers Linked to Pseudomonas aeruginosa Epidemic High-Risk Clones


1
Medical Microbiology and Immunology Department, Faculty of Medicine, Suez Canal University, Ismailia 41111, Egypt
2
Microbiology Department, Faculty of Science, Ain Shams University, Cairo 11566, Egypt
3
Department of Medical Laboratory Technology, Faculty of Applied Medical Sciences, University of Tabuk, Tabuk 71491, Saudi Arabia
4
Botany and Microbiology Department, Faculty of Science, Suez Canal University, Ismailia 41522, Egypt
5
Biology Department, Faculty of Science and Arts, Khulais, University of Jeddah, Jeddah 21959, Saudi Arabia
*
Author to whom correspondence should be addressed.
Antibiotics 2021, 10(1), 35; https://doi.org/10.3390/antibiotics10010035
Submission received: 12 November 2020
/
Revised: 21 December 2020
/
Accepted: 28 December 2020
/
Published: 1 January 2021
Abstract
:The population structure of Pseudomonas aeruginosa is panmictic-epidemic in nature, with the prevalence of some high-risk clones. These clones are often linked to virulence, antibiotic resistance, and more morbidity. The clonal success of these lineages has been linked to acquisition and spread of mobile genetic elements. The main aim of the study was to explore other molecular markers that explain their global success. A comprehensive set of 528 completely sequenced P. aeruginosa genomes was analyzed. The population structure was examined using Multilocus Sequence Typing (MLST). Strain relationships analysis and diversity analysis were performed using the geoBURST Full Minimum Spanning Tree (MST) algorithm and hierarchical clustering. A phylogenetic tree was constructed using the Unweighted Pair Group Method with Arithmetic mean (UPGMA) algorithm. A panel of previously investigated resistance markers were examined for their link to high-risk clones. A novel panel of molecular markers has been identified in relation to risky clones including armR, ampR, nalC, nalD, mexZ, mexS, gyrAT83I, gyrAD87N, nalCE153Q, nalCS46A, parCS87W, parCS87L, ampRG283E, ampRM288R, pmrALeu71Arg, pmrBGly423Cys, nuoGA890T, pstBE89Q, phoQY85F, arnAA170T, arnDG206C, and gidBE186A. In addition to mobile genetic elements, chromosomal variants in membrane proteins and efflux pump regulators can play an important role in the success of high-risk clones. Finding risk-associated markers during molecular surveillance necessitates applying more infection-control precautions.
1. Introduction
Pseudomonas aeruginosa has been declared as one of the “six top priority dangerous microbes” by the infectious disease society of America since 2006 and is still among the list of the most worrying pathogens. According to the European Centre for Disease Control (ECDC) in 2013 and the recent Centers of Disease Control (CDC) antibiotic resistance report in 2019, P. aeruginosa was classified as a serious public health threat. It is estimated that 51,000 cases of infection exist each year. It is not considered among the urgent threats but it may worsen and become urgent without ongoing monitoring and prevention activities [1,2]. P. aeruginosa is one of the Gram-negative bacteria currently causing serious hospital-acquired infections with very few treatment options [3]. The organism has been classified as one of the six ESKAPE organisms (Enterococcus faecium, Staphylococcus aureus, Klebsiella pneumoniae, Acinetobacter baumannii, Pseudomonas aeruginosa, and Enterobacter species) with emerging clinical importance. This group of organisms has long been known as responsible for the majority of nosocomial infections and they are capable of escaping the action of antimicrobial agents [4]. It is also classified as one of the critical pathogens with an urgent need for new antibiotic development by the World Health Organization (WHO) [5,6].
Sound knowledge of the population structure of a bacterial organism and the molecular markers linked to its high-risk behavior are essential to make meaningful clinical conclusions. This knowledge is important when molecular typing is used in surveillance, epidemic and outbreak investigation, and in the identification of epidemic high-risk clones [7]. The population structure of Pseudomonas aeruginosa is consensually believed to be of panmictic-epidemic nature [8], which means that it exhibits a high degree of recombination with random association between loci. Panmixia means random mating and panmictic bacterial populations exhibit the characteristics of linkage equilibrium with high genetic variations at neutral loci [9]. For this type of population structure, better prognostic markers are vital to make better evidence-based patient care decisions [10].
Prognostic markers should have the potential to predict high-risk behavior and should show clear links to disease and patient outcomes. Using such molecular markers will enable directed intervention and will also help in molecular epidemiologic surveillance.
High-risk clones are specific sequence types that have been frequently observed and linked to specific types of behavior including virulence, antibiotic resistance, site specific pathogenicity (e.g., cystic fibrosis, keratitis), or infection outcome. It has been suggested that a limited number of frequently observed widespread clones are responsible for human infections [11], with other clones showing links to higher morbidity and mortality rates in cystic fibrosis patients [12,13,14,15]. Specific dominant multi-drug-resistant (MDR) and extensively drug-resistant (XDR) clones appear to be disseminated in hospitals worldwide. Marked as high-risk clones, they are thought to play a major role in the spread of resistance worldwide [16]. In many studies, these clones accounted for the majority of XDR isolates [17]. P. aeruginosa is also considered an important pathogen that determines the biggest morbidity and mortality in cystic fibrosis patients with MDR/XDR strains, being highly linked to disease exacerbations [18].
Some recent reports have identified contaminated bronchoscopes’ rinsing water and connecting tubes as reservoirs for spreading the organism [19]. In addition, previous reports have also identified wastewater networks as trafficking sources between hospital wash basins for pathogenic bacteria including P. aeruginosa [20]. This situation makes it important to understand whether the clonal success of epidemic high-risk clones is essentially related to mutational resistance or to horizontally acquired resistance elements, i.e., antibiotic inactivating enzymes or integrons carrying specific gene cassettes. Such an understanding can greatly impact the choice of the best approach required to tackle these high-risk clones and to control their dissemination in hospital environments. High-risk behavior may be encountered as an acquired trait, consequently indicating the higher probability of inter-hospital dissemination of XDR/MDR high-risk clones. The other probability is a conserved lineage-related characteristic which is consistently detected in different hospitals where originally susceptible clones may undergo independent parallel evolution into high-risk clones in different settings by acquiring these markers.
It is proposed that P. aeruginosa “high-risk clones” represent distinct lineages highly capable of acquiring and maintaining resistance genes and/or the mobile genetic elements containing these genes when compared with the general P. aeruginosa population [21]. However, clonal success in susceptible P. aeruginosa high-risk clones tends to be under investigated in most studies, which consequently necessitates the assessment of the genetic markers underlying clonal success in a range of both resistant and susceptible high-risk clones, the point that the current study set has tried to cover.
The primary aim of this study was to conduct an additional investigation of the molecular basis of success of high-risk clones. To achieve that, a set of previously investigated resistance markers including those in quinolone resistance-determining region (QRDR), in efflux pumps operons, in cell membrane-related proteins, and others have been specifically examined. To ensure the diversity and comprehensive representation of the studied set of sequences, phylogenetic analysis and hierarchical clustering of the studied sequences were performed in relation to all known Sequence Types (STs) for P. aeruginosa. The analysis performed in this work aims at identifying molecular markers or signatures linked to high-risk clones in P. aeruginosa. When such markers are detected, they can be used to efficiently direct infection-control efforts which would consequently reduce the spread of these epidemic clones. For example, a marker linked to high-risk behavior can indicate that the patient or the setting carries high-risk potential and consequently necessitates additional precautionary measures or isolation practices to avoid its transmission.
2. Results
The population structure of P. aeruginosa was analyzed in a large comprehensive dataset. A large set of public P. aeruginosa genomes from the Patric database [22] was studied. The analyzed set included the whole spectrum of resistance profiles for ciprofloxacin, levofloxacin, gentamycin, and amikacin antibiotics. Multilocus sequence typing (MLST) was performed for all sequences according to the previously described typing scheme by Curran [23]. Phylogenetic analysis and hierarchical clustering were performed to evaluate the distribution of the studied set of sequences among all known P. aeruginosa genomes. Strain relationships were analyzed using the geoBURST Full Minimum Spanning Tree (MST) algorithm [24], as implemented in the software PHYLOVIZ [25] to construct a minimum spanning tree (MST) of the total set of P. aeruginosa strains based on MLST data.
2.1. Description of Population Structure and Diversity in the Studied Set of Sequences
Applying geoBURST algorithm at a double locus variant level (DLV) showed 186 clonal complexes with 157 singletons. The most frequent clonal complexes observed were CC 233 consisting of 13 STs (30 sequences), CC17 consisting of 4 STs (13 sequences), CC 395 consisting of 2 STs (14 sequences), CC 316 consisting of 3 STs (10 sequences), and CC 319 consisting of 4 STs (12 sequences). Other examples include CC 446 consisting of 2 STs (10 sequences) and CC 111 consisting of 1 ST (30 sequences). This indicates that the sequences under study probably represent a wide range of diversity based on ST classification. The index of association (I A) was calculated to estimate the degree of association and recombination between alleles at different loci based on MLST allelic profile data [26]. When all 528 sequences were analyzed, the standardized index of association (ISA) = 0.1302 (p < 0.001). This indicates linkage equilibrium and low evidence of association among the alleles analyzed. Pairwise variance (VD = 1.4063) was greater than the critical value (L = 0.8007) with the mean genetic diversity of (H) as 0.8648 ± 0.0261. These results support that recombination plays a key role in allele distribution and support the non-clonal structure of the P. aeruginosa population based on MLST classification of the studied set of sequences.
The degree of concordance between the two typing schemes used was evaluated using Simpson’s index of diversity (SID: with 95% confidence intervals) and showed that MLST (Simpson’s ID = 0.987 with 95% CI (0.984–0.990)) was more discriminatory than serotyping (Simpson’s ID = 0.856 with 95% CI (0.843–0.869)). Inter-method concordance was also evaluated using the adjusted Wallace coefficient [27]. The adjusted Wallace coefficient shows the probability that two strains classified as the same type by one method will also be classified as the same one when using another method. Adjusted Wallace between ST and serotypes = 0.840 with 95% CI (0.792–0.889), while that between serotypes and STs was significantly low = 0.064 with 95% CI (0.048–0.080), which means that ST can predict serotype with high confidence while the opposite is not true.
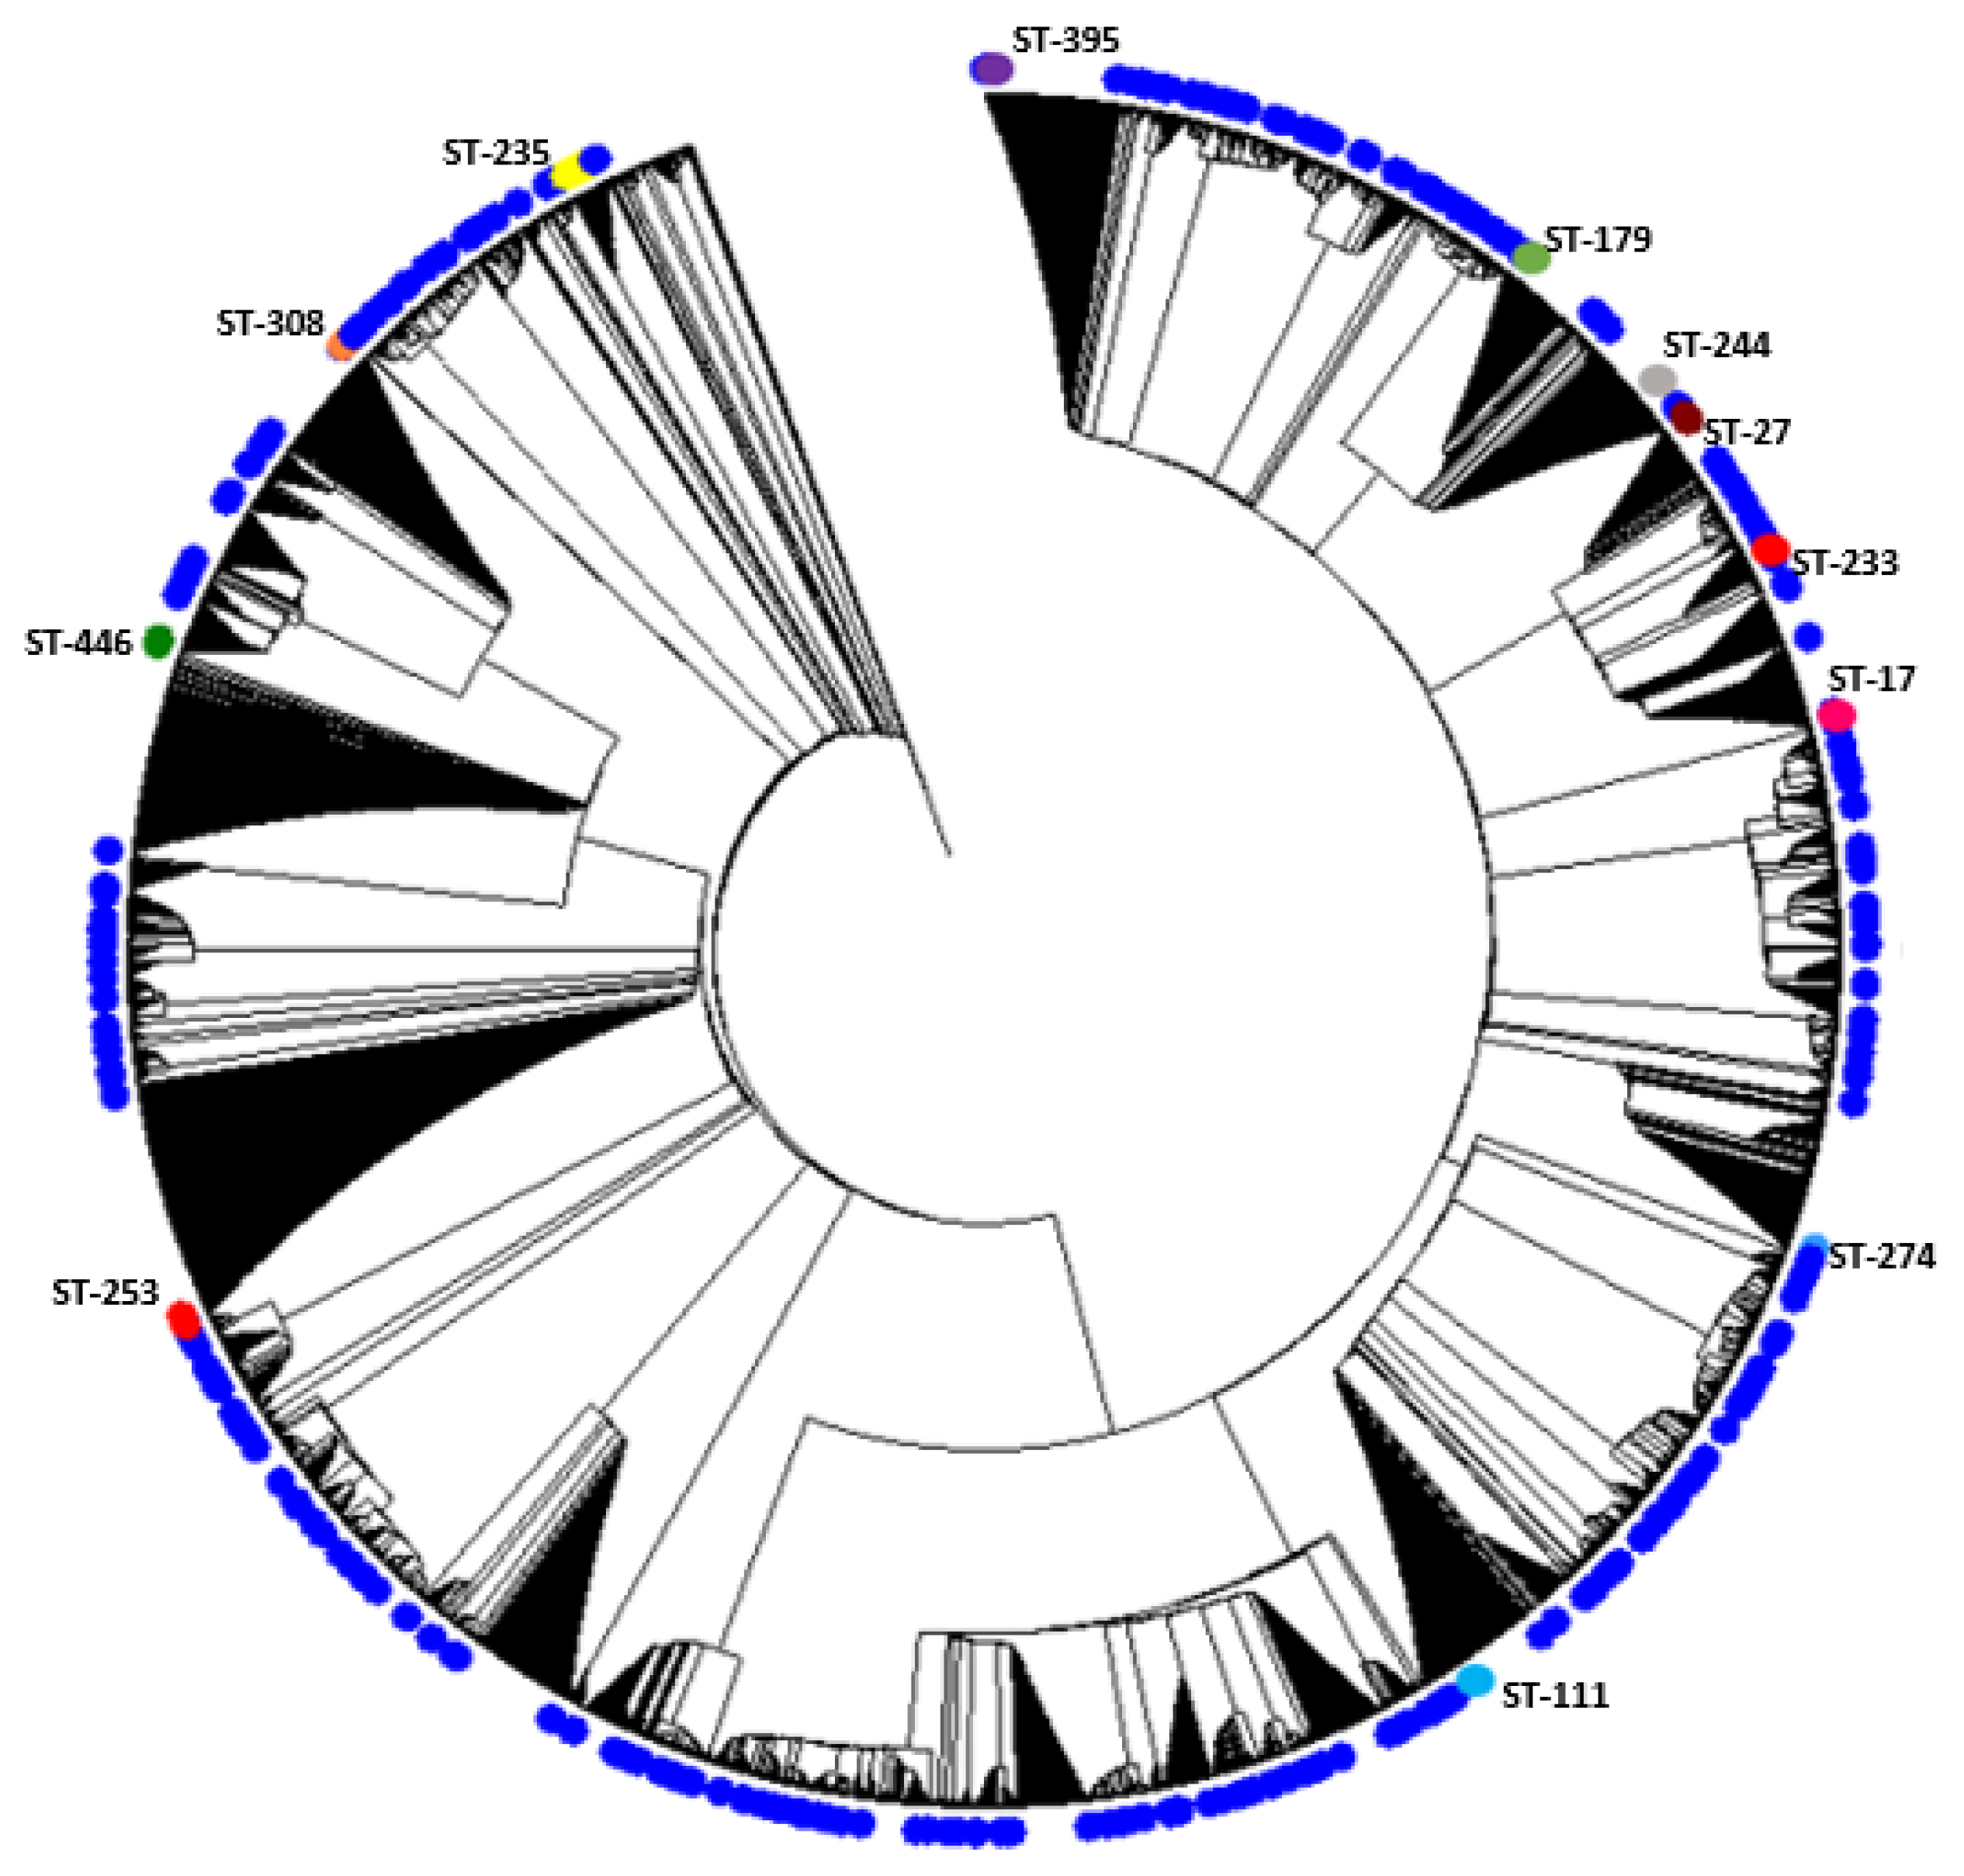
A phylogenetic analysis of the concatenated sequences of the MLST alleles was performed including the study sequences and the entire MLST database. The results of the phylogenetic analysis indicate that the sequences exhibit diversity and show non-clustered distribution among all known STs for the organism. The results are shown in Figure 1. The figure illustrates the position of high-risk clones among all other sets of sequences included in the analysis, which are shown in blue.
2.2. Analysis of Different Multilocus Sequence Typing (MLST) Profiles
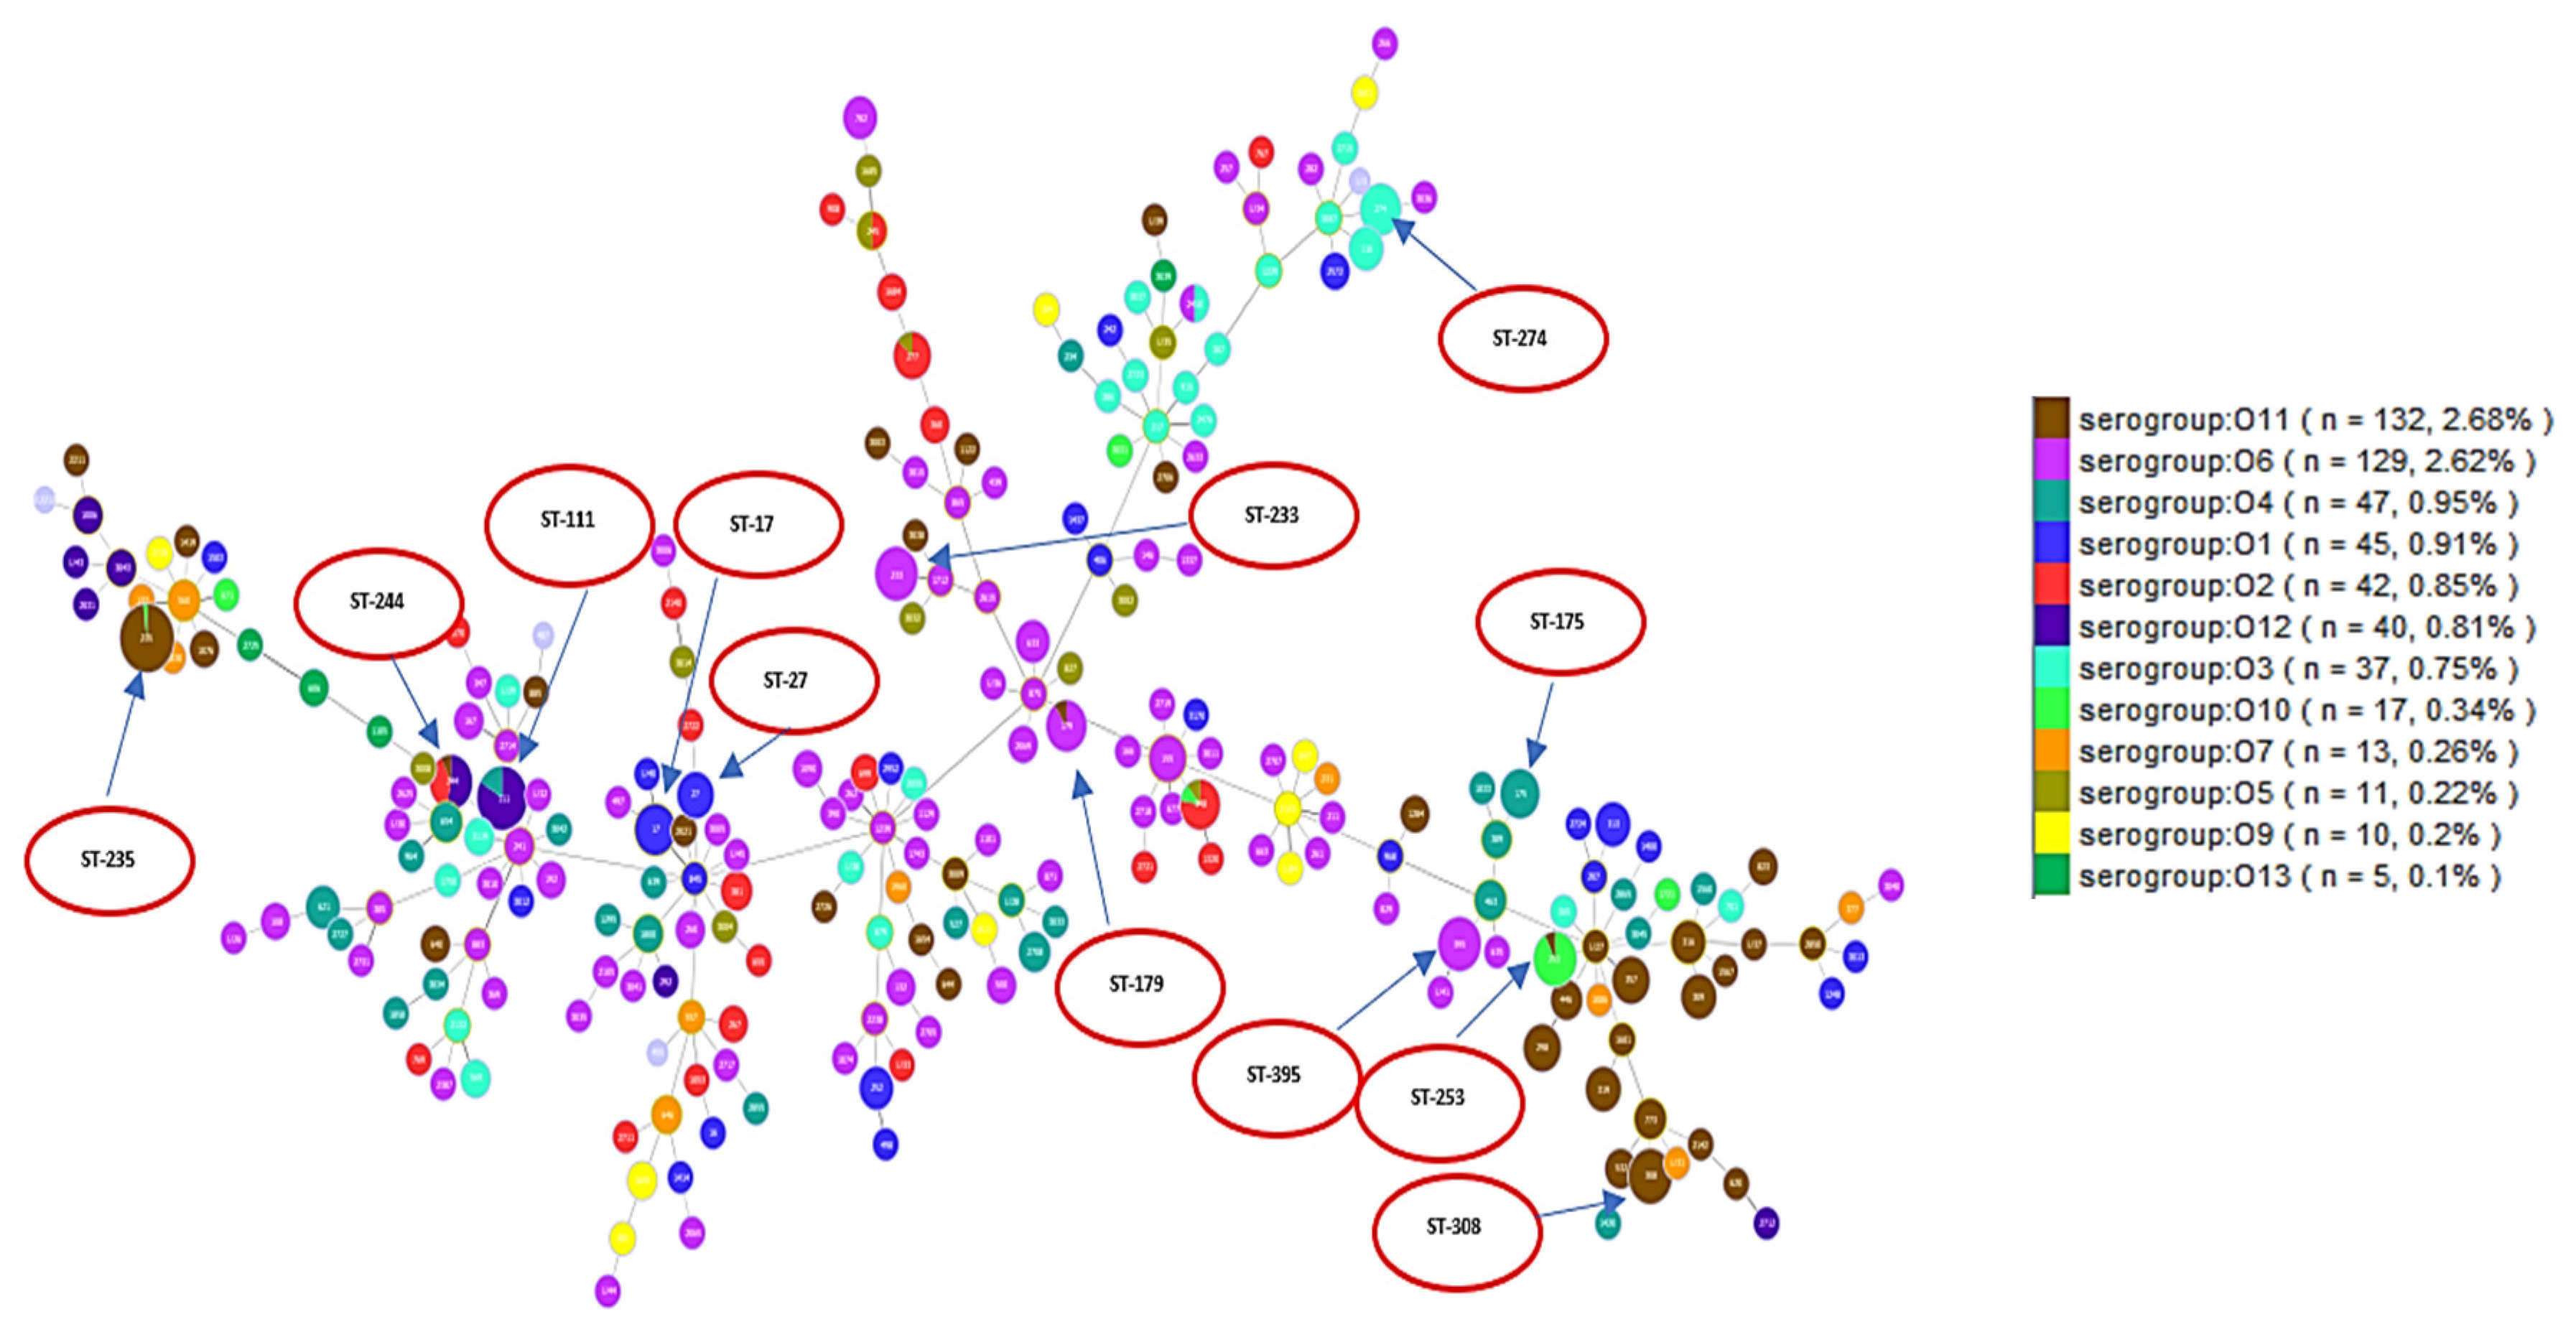
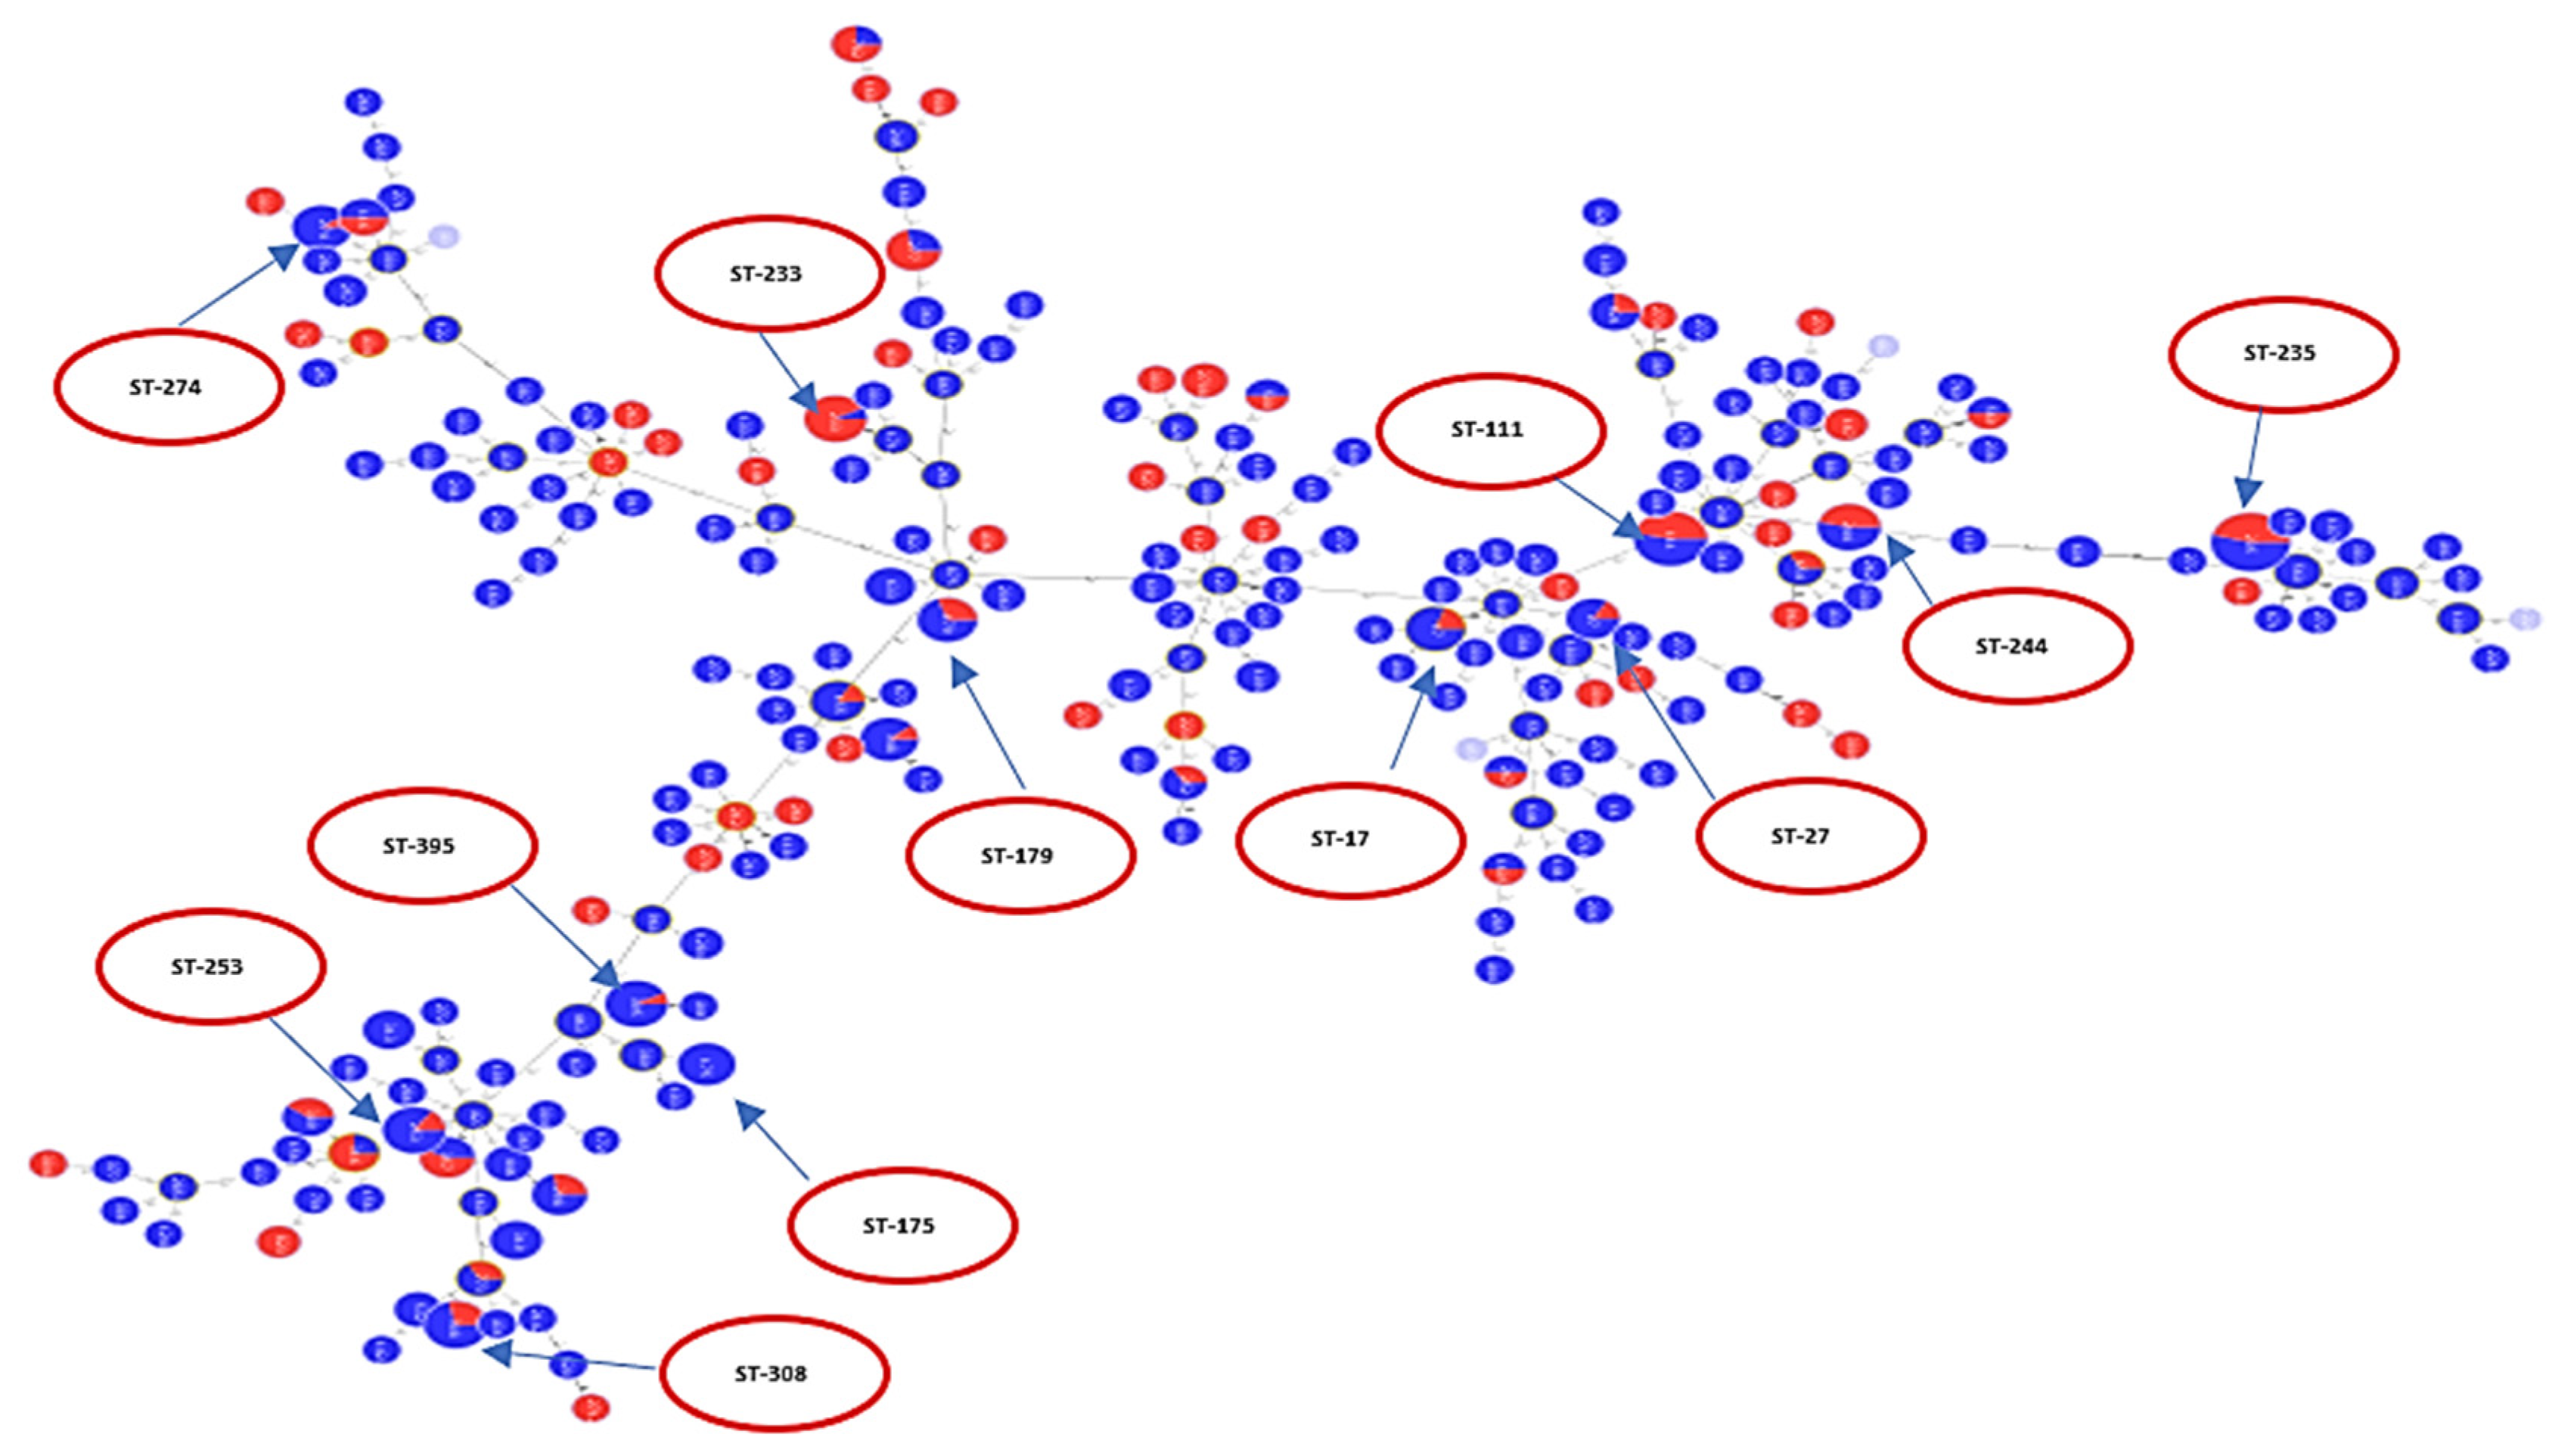
A population analysis of 528 P. aeruginosa sequences was performed and considerable genetic diversity was observed among the MLST results. MLST analysis identified 249 STs among all sequences, including 229 known and 20 novel STs. The international clones ST235 (serotype O11 (98%)) was the most frequently identified in a total of 50 sequences, followed by ST111 (serotype O12 (83.3%) and serotype O4 (16.7%)) which was identified in a total of 30 sequences. ST244 (serotype O12 (53.9%) and serotype O2 (58.5%)) was identified in 13 sequences, while ST308 (serotype O11 (100%)) was identified in 14 sequences. Each of the sequence types of ST395 (serotype O6 (100%)) and ST253 (serotype O10 (92.3%)) were identified in 13 sequences. ST348 (serotype O2 (88.9%)) was identified in nine sequences. ST274 (serotype O3 (100%)) was identified in 10 sequences. ST179 (serotype O6 (90%)) was identified in 10 sequences and ST233 (serotype O6 (100%)) was identified in 13 sequences. ST17 (serotype O1 (100%)) was identified in 10 sequences, while ST27 (serotype O1 (100%)) was identified in six sequences and ST175 (serotype O4 (100%)) in eight sequences. These data are visualized in Figure 2 which shows serotypes overlaid on corresponding STs. Figure 2 shows the minimum spanning tree (MST) analysis of the studied set of P. aeruginosa sequences based on MLST data at SLV level. Each circle corresponds to an ST identified in the studied collection of sequences. The area of each circle corresponds to the number of sequences showing a certain ST. The positions of high-risk groups are shown on the graph. In Figure 2, different ST groups are colored based on the corresponding serotype. This gives an idea about the degree of concordance/correlation between the two typing methods.
2.3. Resistance Profile of P. aeruginosa Epidemic High-Risk Clones
Among the studied sequences, the international high-risk clone ST235 was the most frequently identified among all STs in the study set (50 sequences). Among its 50 sequences, 13 are ciprofloxacin-resistant, 46 are levofloxacin-resistant, and only 4 sequences are levofloxacin-susceptible. ST111 was the next most frequently observed ST in a total of 30 sequences, with 28 levofloxacin-resistant sequences, 2 levofloxacin-susceptible sequences, 3 ciprofloxacin-resistant sequences, and 1 ciprofloxacin-susceptible sequence. ST244 was identified in 13 sequences; 3 are levofloxacin-susceptible, 10 are levofloxacin-resistant, and 2 are ciprofloxacin-resistant. ST395 was identified in 13 sequences; 8 are levofloxacin-susceptible, 5 are levofloxacin-resistant, and 3 are ciprofloxacin-resistant. ST175 was identified in eight sequences; all are levofloxacin resistant. The cystic fibrosis (CF) clone ST17 was identified in 10 sequences; 4 are levofloxacin-susceptible, 6 are levofloxacin-resistant, and 1 is ciprofloxacin-resistant. Another CF clone, ST274, was identified in 10 sequences; 5 are levofloxacin-susceptible, 5 are levofloxacin-resistant, 1 is ciprofloxacin-resistant, and 1 is ciprofloxacin-susceptible. These results are summarized in Table 1.
For aminoglycosides, 23 sequences with ST235 are amikacin-resistant, 27 are amikacin-susceptible, 3 are gentamycin-resistant, and 10 are gentamycin-susceptible. ST111 included a total of 14 amikacin-resistant sequences, 16 amikacin-susceptible sequences, 3 gentamycin-resistant sequences, and 1 gentamycin-susceptible sequence. Sequences belonging to ST244 included 6 amikacin-resistant sequences, 7 amikacin-susceptible sequences, and 2 gentamycin-resistant sequences. ST395 included 1 amikacin-resistant sequence, 12 amikacin-susceptible sequences, 2 gentamycin-resistant sequences, and 1 gentamycin-susceptible sequence. All sequences with ST175 were amikacin susceptible. Sequences with ST17 included 8 amikacin-susceptible sequences, 2-amikacin resistant sequences, and 1 gentamycin-susceptible sequence. Sequences with ST274 included 9 amikacin-susceptible sequences, 1 amikacin-resistant sequence, 1 gentamycin-resistant sequence, and 1 gentamycin-susceptible sequence (Table 1).
Quinolone and aminoglycoside Minimum Inhibitory Concentration (MIC) values for the high-risk clones observed in the studied collection with their corresponding serotypes are shown in Supplementary Tables S1 and S2. Figures 3, 5, 6, and 8 show the susceptibility of the different studied antibiotic agents in relation to different STs.
2.4. Analysis of Molecular Markers in Relation to High-Risk Clones
2.4.1. Levofloxacin-Related Molecular Markers
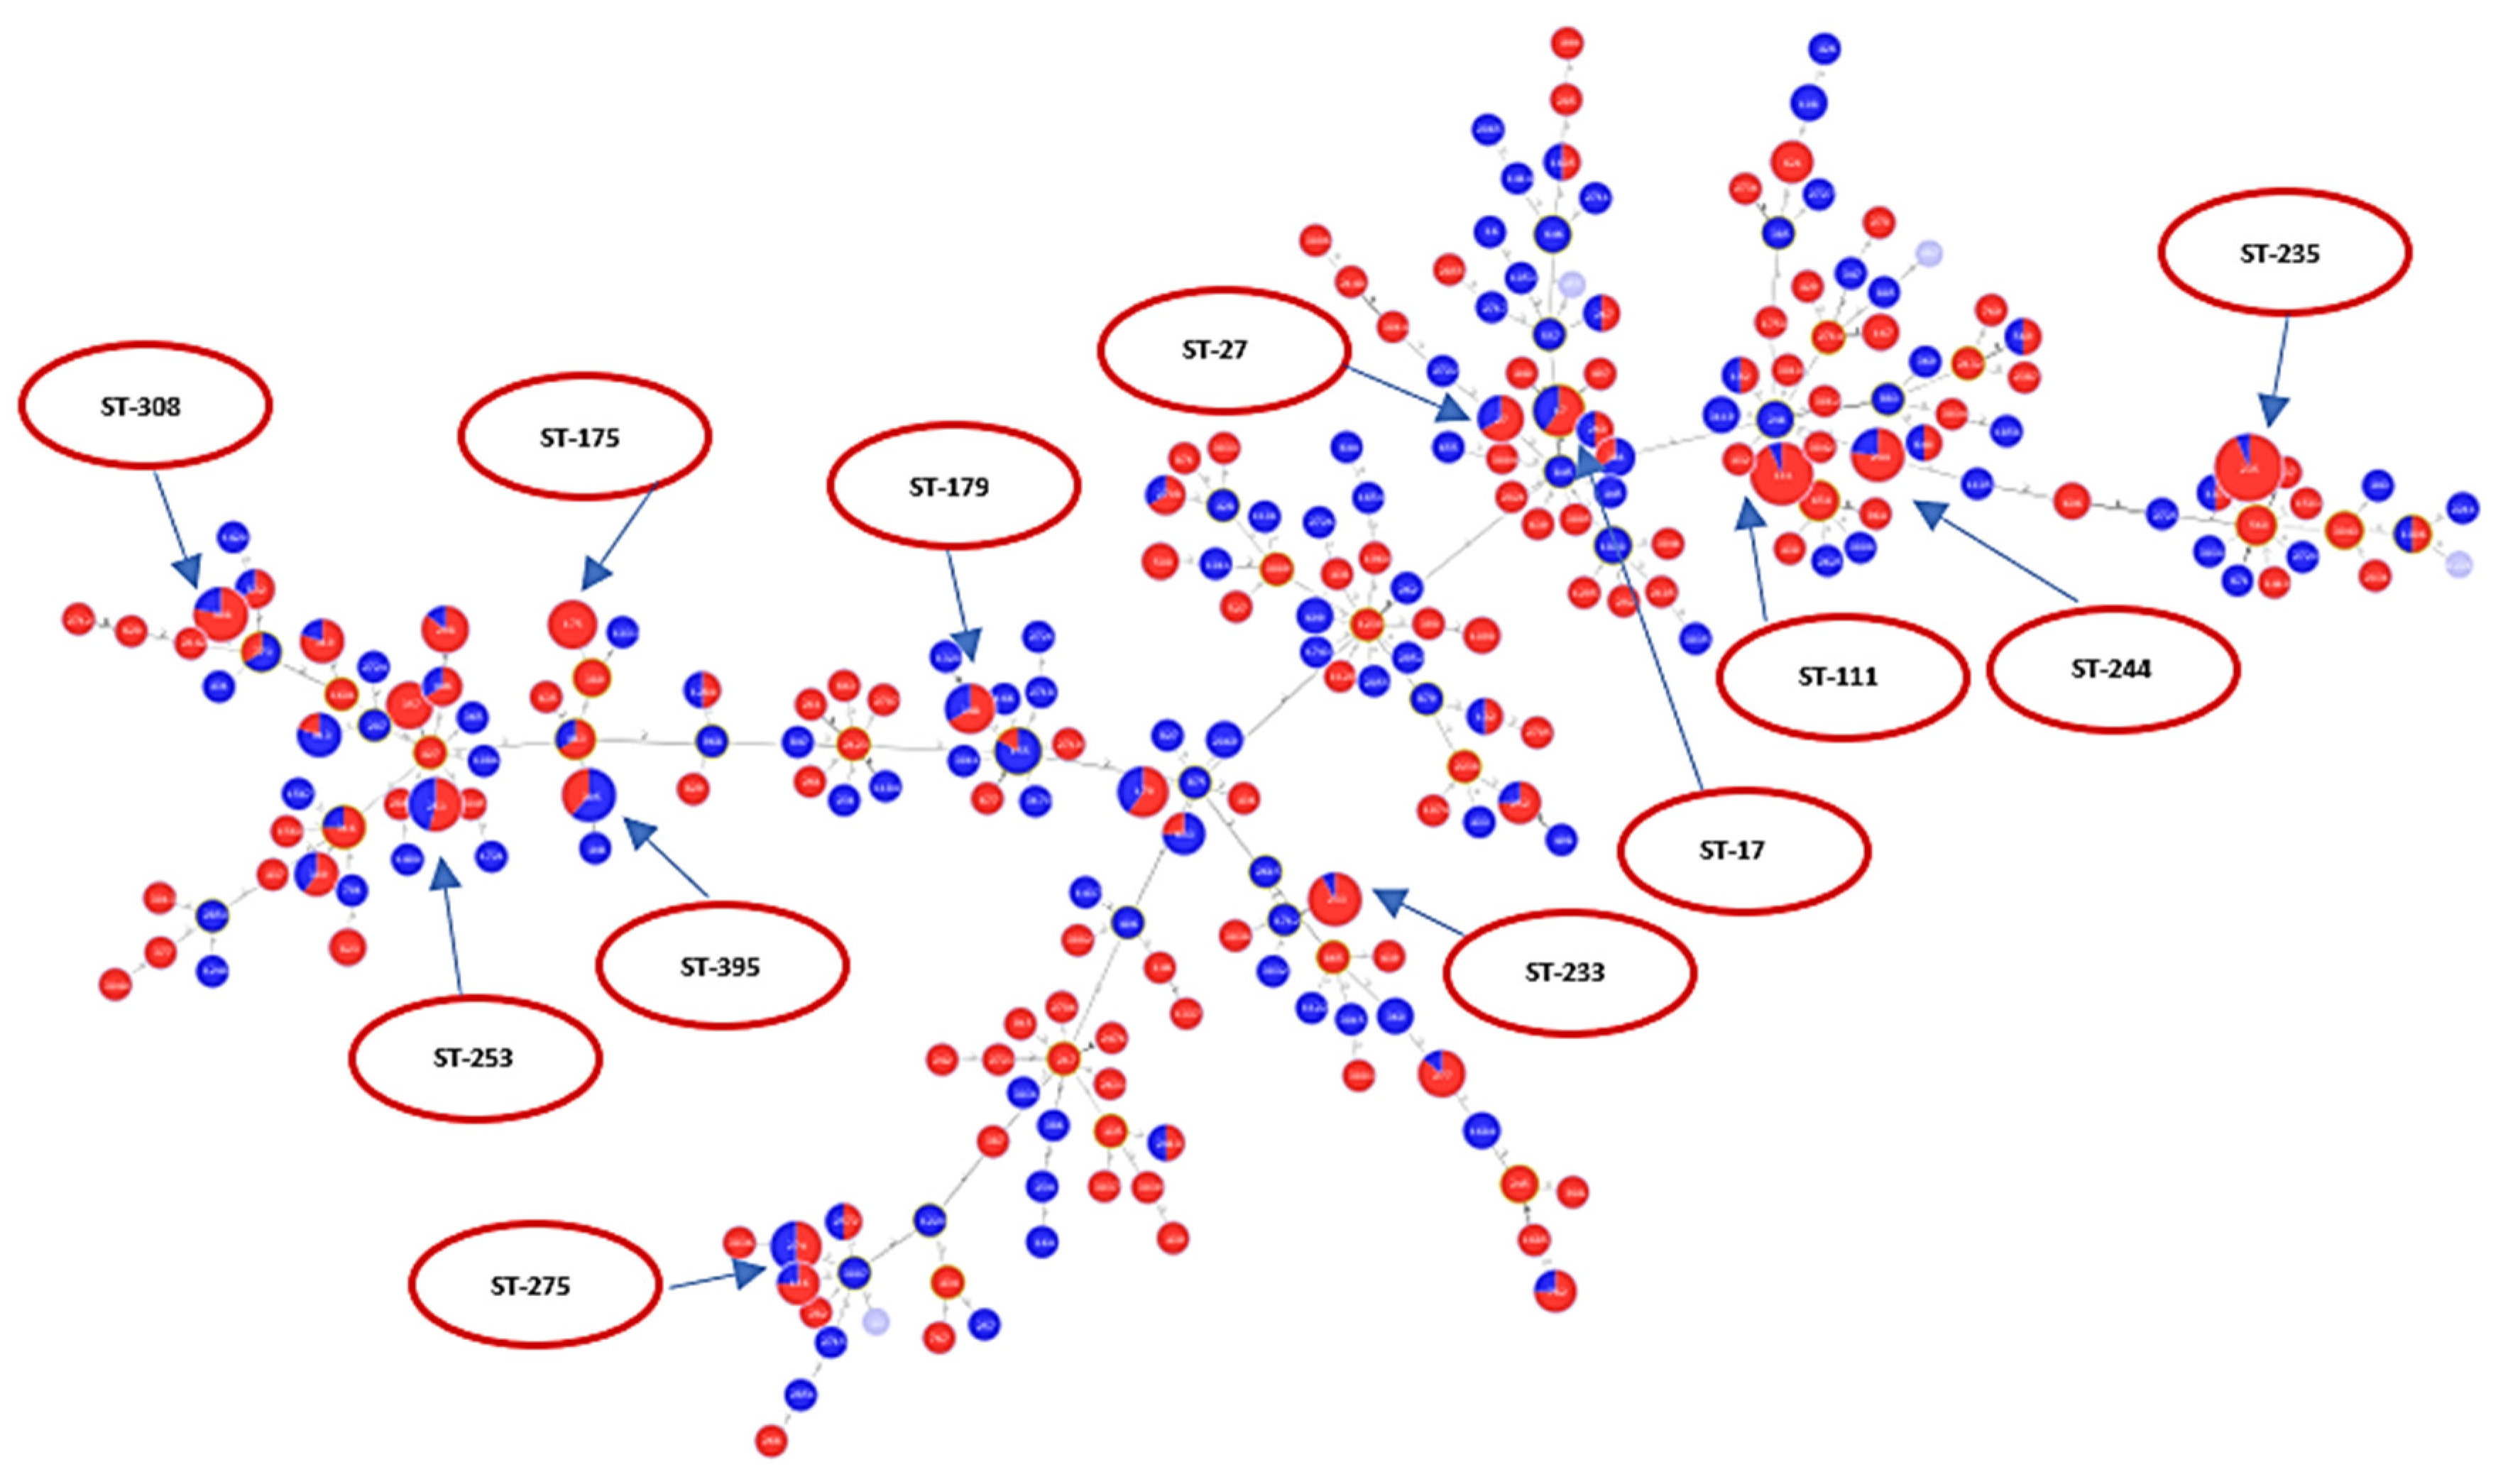
A total of 528 sequences were analyzed for levofloxacin susceptibility (338 resistant and 190 susceptible). Figure 3 is an MST tree showing levofloxacin susceptibility in relation to different STs. Levofloxacin susceptibility behavior does not show a specific clustering or clonal distribution pattern in relation to the ST classification in general. This figure also shows that ST111, ST235, ST175, and ST233 are majorly composed of resistant sequences, while nearly half of the sequences classified under ST253, ST244, ST17 and ST27 were not resistant. Of those analyzed, a total of 196 sequences belonged to epidemic high-risk clones (ST17 (N = 10), ST27 (N = 6), ST111 (N = 30), ST235 (N = 50), ST175 (N = 8), ST179 (N = 10), ST244 (N = 13), ST233 (N = 13), ST308 (N = 14), ST395 (N = 13), ST532 (N = 3), ST446 (N = 3), ST274 (N = 10), and ST253 (N = 13)).
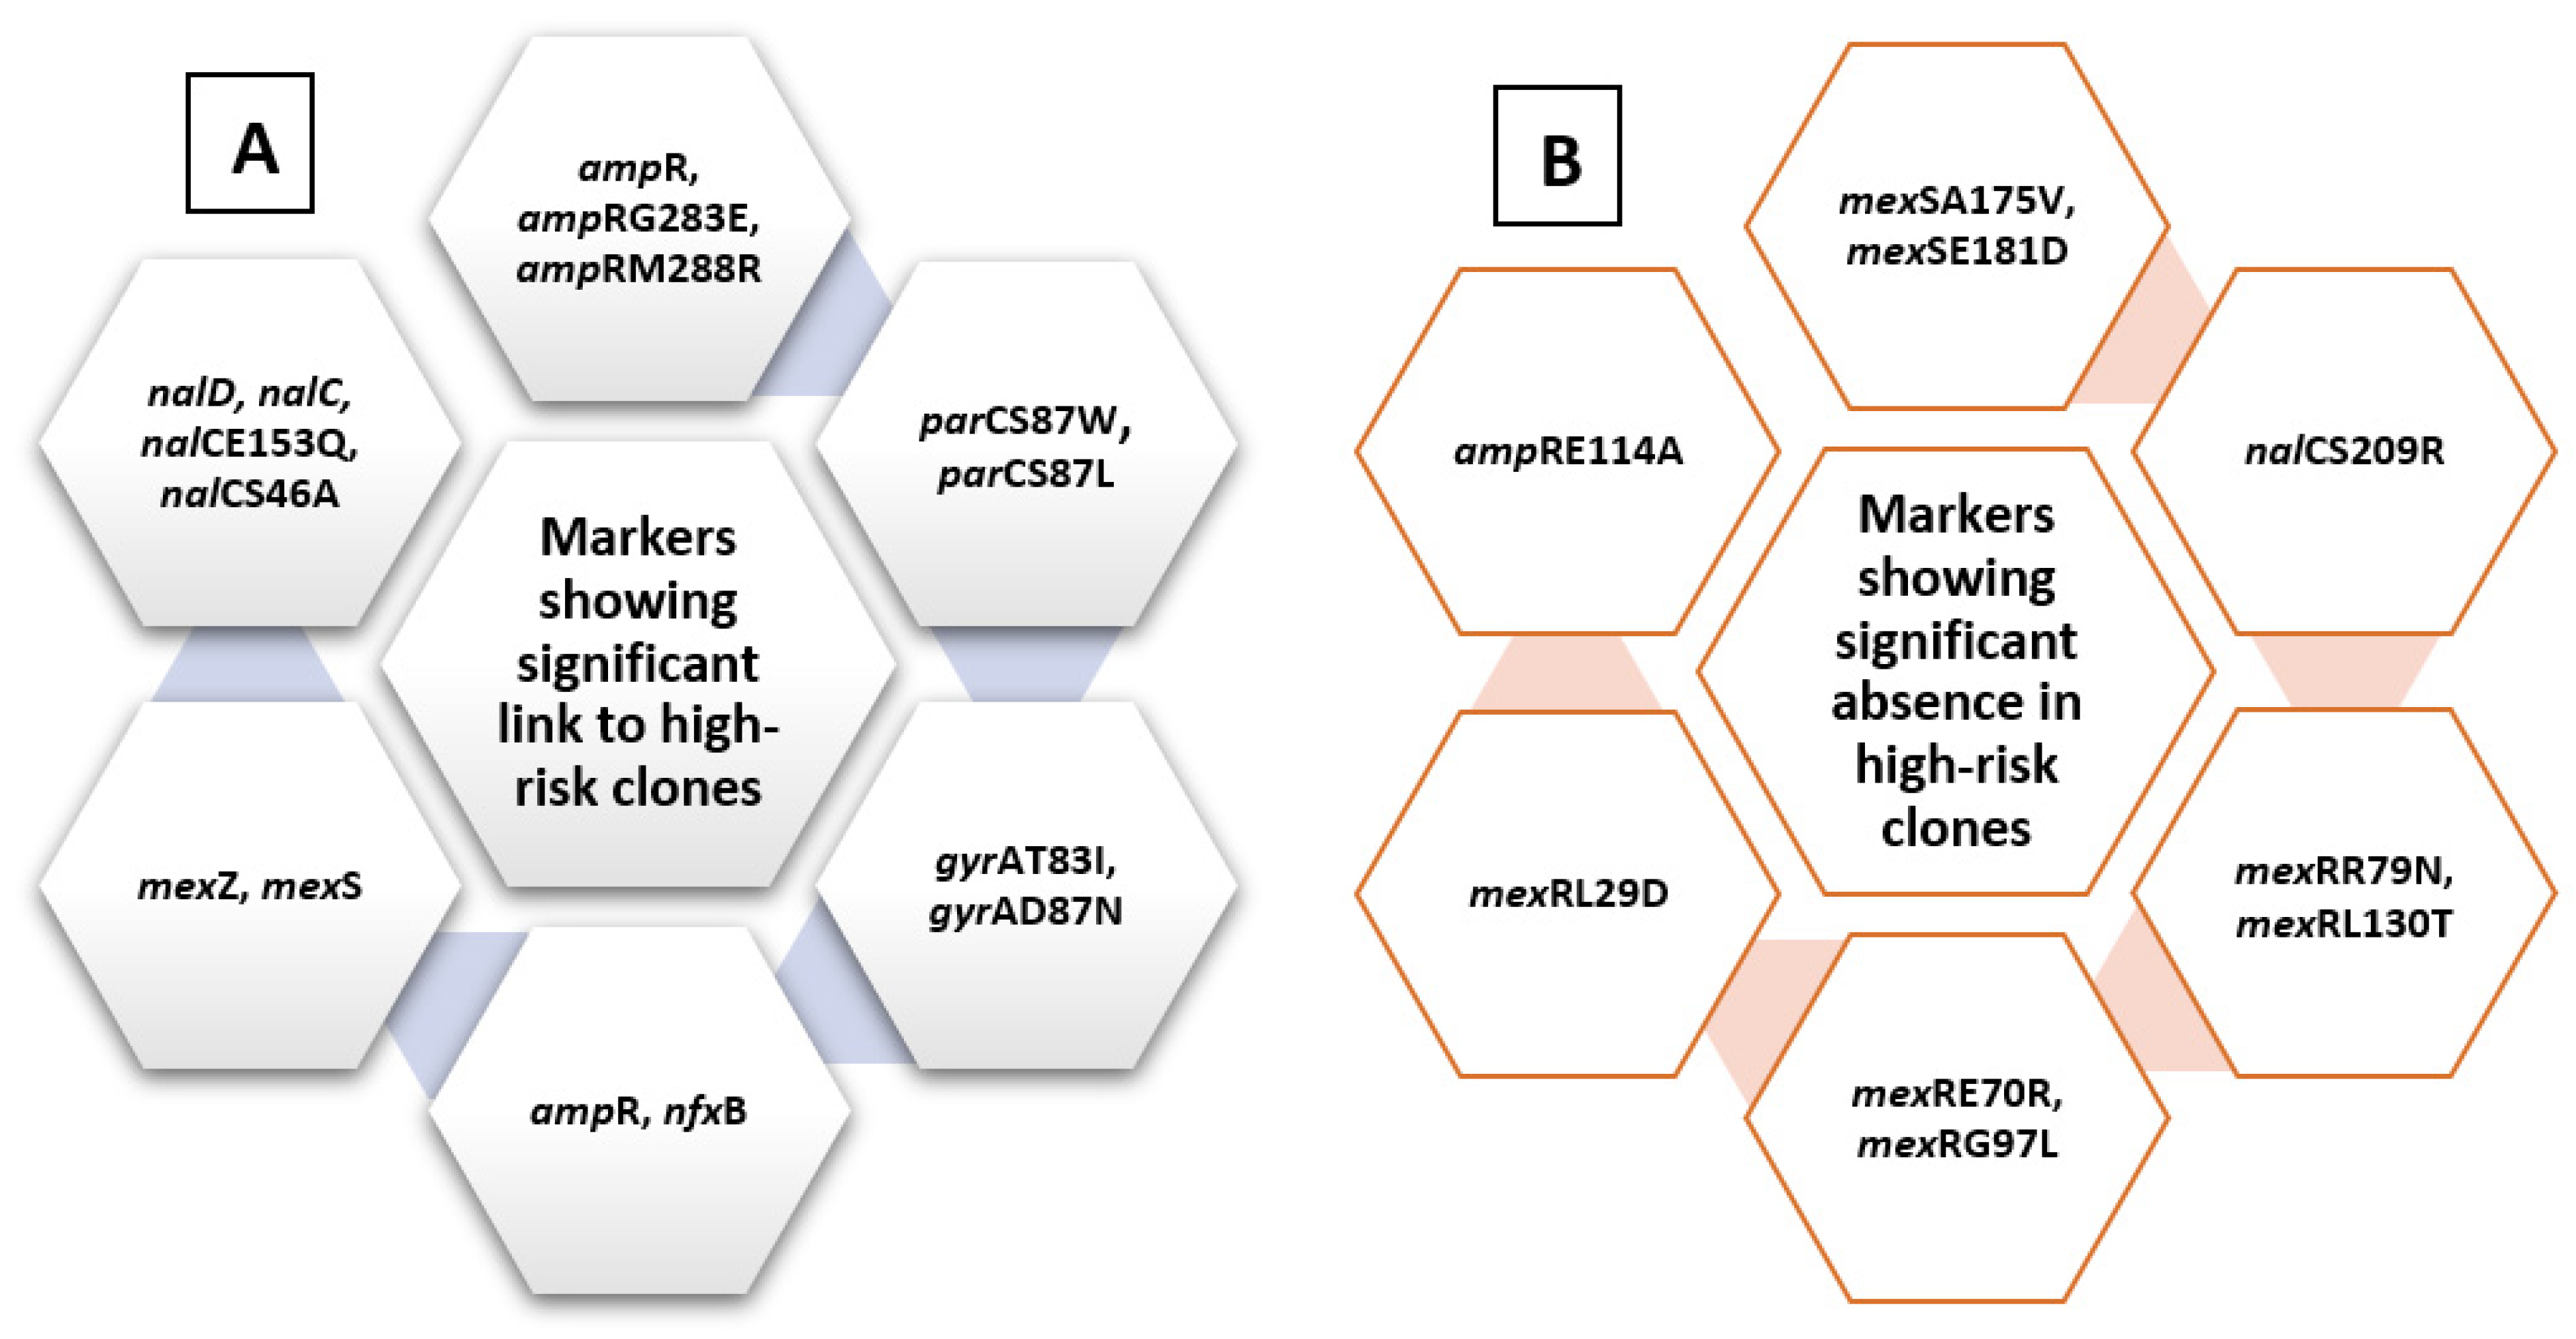
A chi-square test for independence (with Yates’ continuity correction) indicated significant associations between ampR, x2 (1, n = 528) = 5.7, p = 0.017, phi = 0.104; arm R, x2 (1, n = 528) = 9.5, p = 0.002, phi = 0.134; mexZ, x2 (1, n = 528) = 5.9, p = 0.015, phi = 0.106; nfxB, x2 (1, n = 528) = 6.74, p = 0.009, phi = 0.113; mexS, x2 (1, n = 528) = 6.2, p = 0.013, phi = 0.109; nalC, x2 (1, n = 528) = 6.2, p = 0.013, phi = 0.109; nalD, x2 (1, n = 528) = 3.9, p = 0.05, phi = 0.085; gyrAT83I, x2 (1, n = 528) = 64.3, p < 0.005, phi = 0.349; gyrAD87N, x2 (1, n = 528) = 13.23, p < 0.005, phi = 0.158; nalCE153Q, x2 (1, n = 528) = 10.014, p = 0.001, phi = 0.139; nalCS46A, x2 (1, n = 528) = 6.23, p = 0.013, phi = 0.109; parCS87W, x2 (1, n = 528) = 28.03, p < 0.005, phi = 0.23; parCS87L, x2 (1, n = 528) = 47.6, p < 0.005, phi = 0.301, ampRG283E, x2 (1, n = 528) = 5.1, p = 0.024, phi = 0.098; ampRM288R, x2 (1, n = 528) = 7.66, p = 0.006, phi = 0.121, and high-risk groups. These are listed in Figure 4.
Some markers also showed significant links to specific clones, including mexSSer124Arg, nalD, nalCG71E, nalCA186T, nalCS46A, nalCE153Q, parCS87W, parCS87L, gyrAT83I, gyrAD87N, ampRG283E, and ampRM288R. These are shown in Table 2.
On the other hand, some other markers showed significant absence in relation to high-risk clones, including mexSA175V, x2 (1, n = 528) = 8.5, p = 0.004, phi = −0.127; mexSE181D, x2 (1, n = 528) = 6.135, p = 0.013, phi = −0.108; nalCS209R, x2 (1, n = 528) = 18.3, p < 0.005, phi = −0.186; mexRR79N, x2 (1, n = 528) = 6.7, p = 0.01, phi = −0.112; mexRE70R, x2 (1, n = 528) = 11.99, p = 0.001, phi = −0.151; mexRL130T, x2 (1, n = 528) = 8.95, p = 0.003, phi = −0.13; mexRG97L, x2 (1, n = 528) = 12.5, p < 0.005, phi = −0.154, mexRL29D, x2 (1, n = 528) = 11.5, p < 0.005, phi = −0.154, and ampRE114A, x2 (1, n = 528) = 14.32, p < 0.005, phi = −0.165, summarized in Figure 4.
2.4.2. Ciprofloxacin-Related Molecular Markers
A total of 142 sequences were analyzed for ciprofloxacin susceptibility (105 resistant and 37 susceptible). Figure 5 is an MST tree showing ciprofloxacin susceptibility in relation to different STs. The pattern of distribution of antibiotic phenotype in relation to MLST classification is similar to that observed with the levofloxacin MST tree. No clustering of the susceptible phenotype is observed in relation to different STs. This may indicate that information drawn from MLST is not sufficient alone to reflect antibiotic susceptibility behavior in a highly recombining organism like P. aeruginosa. Of those analyzed, a total of 39 sequences belonged to epidemic high-risk clones (ST17 (N = 1), ST27 (N = 1), ST111 (N = 4), ST179 (N = 3), ST233 (N = 5), ST235 (N = 12), ST244 (N = 2), ST253 (N = 2), ST274 (N = 2), ST308 (N = 2), ST446 (N = 1), ST395 (N = 3), and ST532 (N = 1)).
A chi-square test for independence (with Yates’ continuity correction) indicated significant associations between nalCE153Q, x2 (1, n = 142) = 7.831, p = 0.005, phi = 0.235; parCS87L, x2 (1, n = 142) = 6.86, p = 0.009, phi = 0.22; gyrAT83I, x2 (1, n = 142) = 7.362, p = 0.007, phi = 0.228; gyrAD87N, x2 (1, n = 142) = 4.668, p = 0.031, phi = 0.181; ampRM288R, x2 (1, n = 142) = 5.068, p = 0.024, phi = 0.189, and high-risk groups.
Furthermore, mexS Val333Gly, x2 (1, n = 142) = 10.9, p = 0.001, phi = 0.277; nalCE153Q, x2 (1, n = 142) = 46.937, p < 0.005, phi = 0.575; nalDI153Q, x2 (1, n = 142) =4.5, p < 0.033, phi = 0.179; gyrAT83I, x2 (1, n = 142) = 5.72, p = 0.017, phi = 0.201; ampRG283E, x2 (1, n= 142) = 15.975, p < 0.005, phi = 0.335, and ampRM288R, x2 (1, n = 142) =24.26, p < 0.005, phi = 0.413, showed significant links to ST235.
2.4.3. Amikacin-Related Molecular Markers
A total of 528 sequences were analyzed for amikacin susceptibility (142 resistant and 386 susceptible). Figure 6 is an MST tree showing amikacin susceptibility in relation to different STs. Based on the distribution of high-risk clones seen in Figure 6, amikacin resistance does not appear to correlate with high-risk clones. Except for ST233, the majority of sequences forming all other high-risk STs were mostly susceptible. About half of the isolates forming ST111 and ST235 were resistant. For the ST111 group, 14 sequences were amikacin-resistant and 16 were amikacin-susceptible. For ST235, 23 sequences were amikacin-resistant and 27 were amikacin-susceptible.
Of those analyzed, a total of 196 sequences belonged to epidemic high-risk clones (ST17 (N = 10), ST27 (N = 6), ST111 (N = 30), ST235 (N = 50), ST175 (N = 8), ST179 (N = 10), ST244 (N = 13), ST233 (N = 13), ST308 (N = 14), ST395 (N = 13), ST532 (N = 3), ST446 (N = 3), ST274 (N = 10), and ST253 (N = 13)).
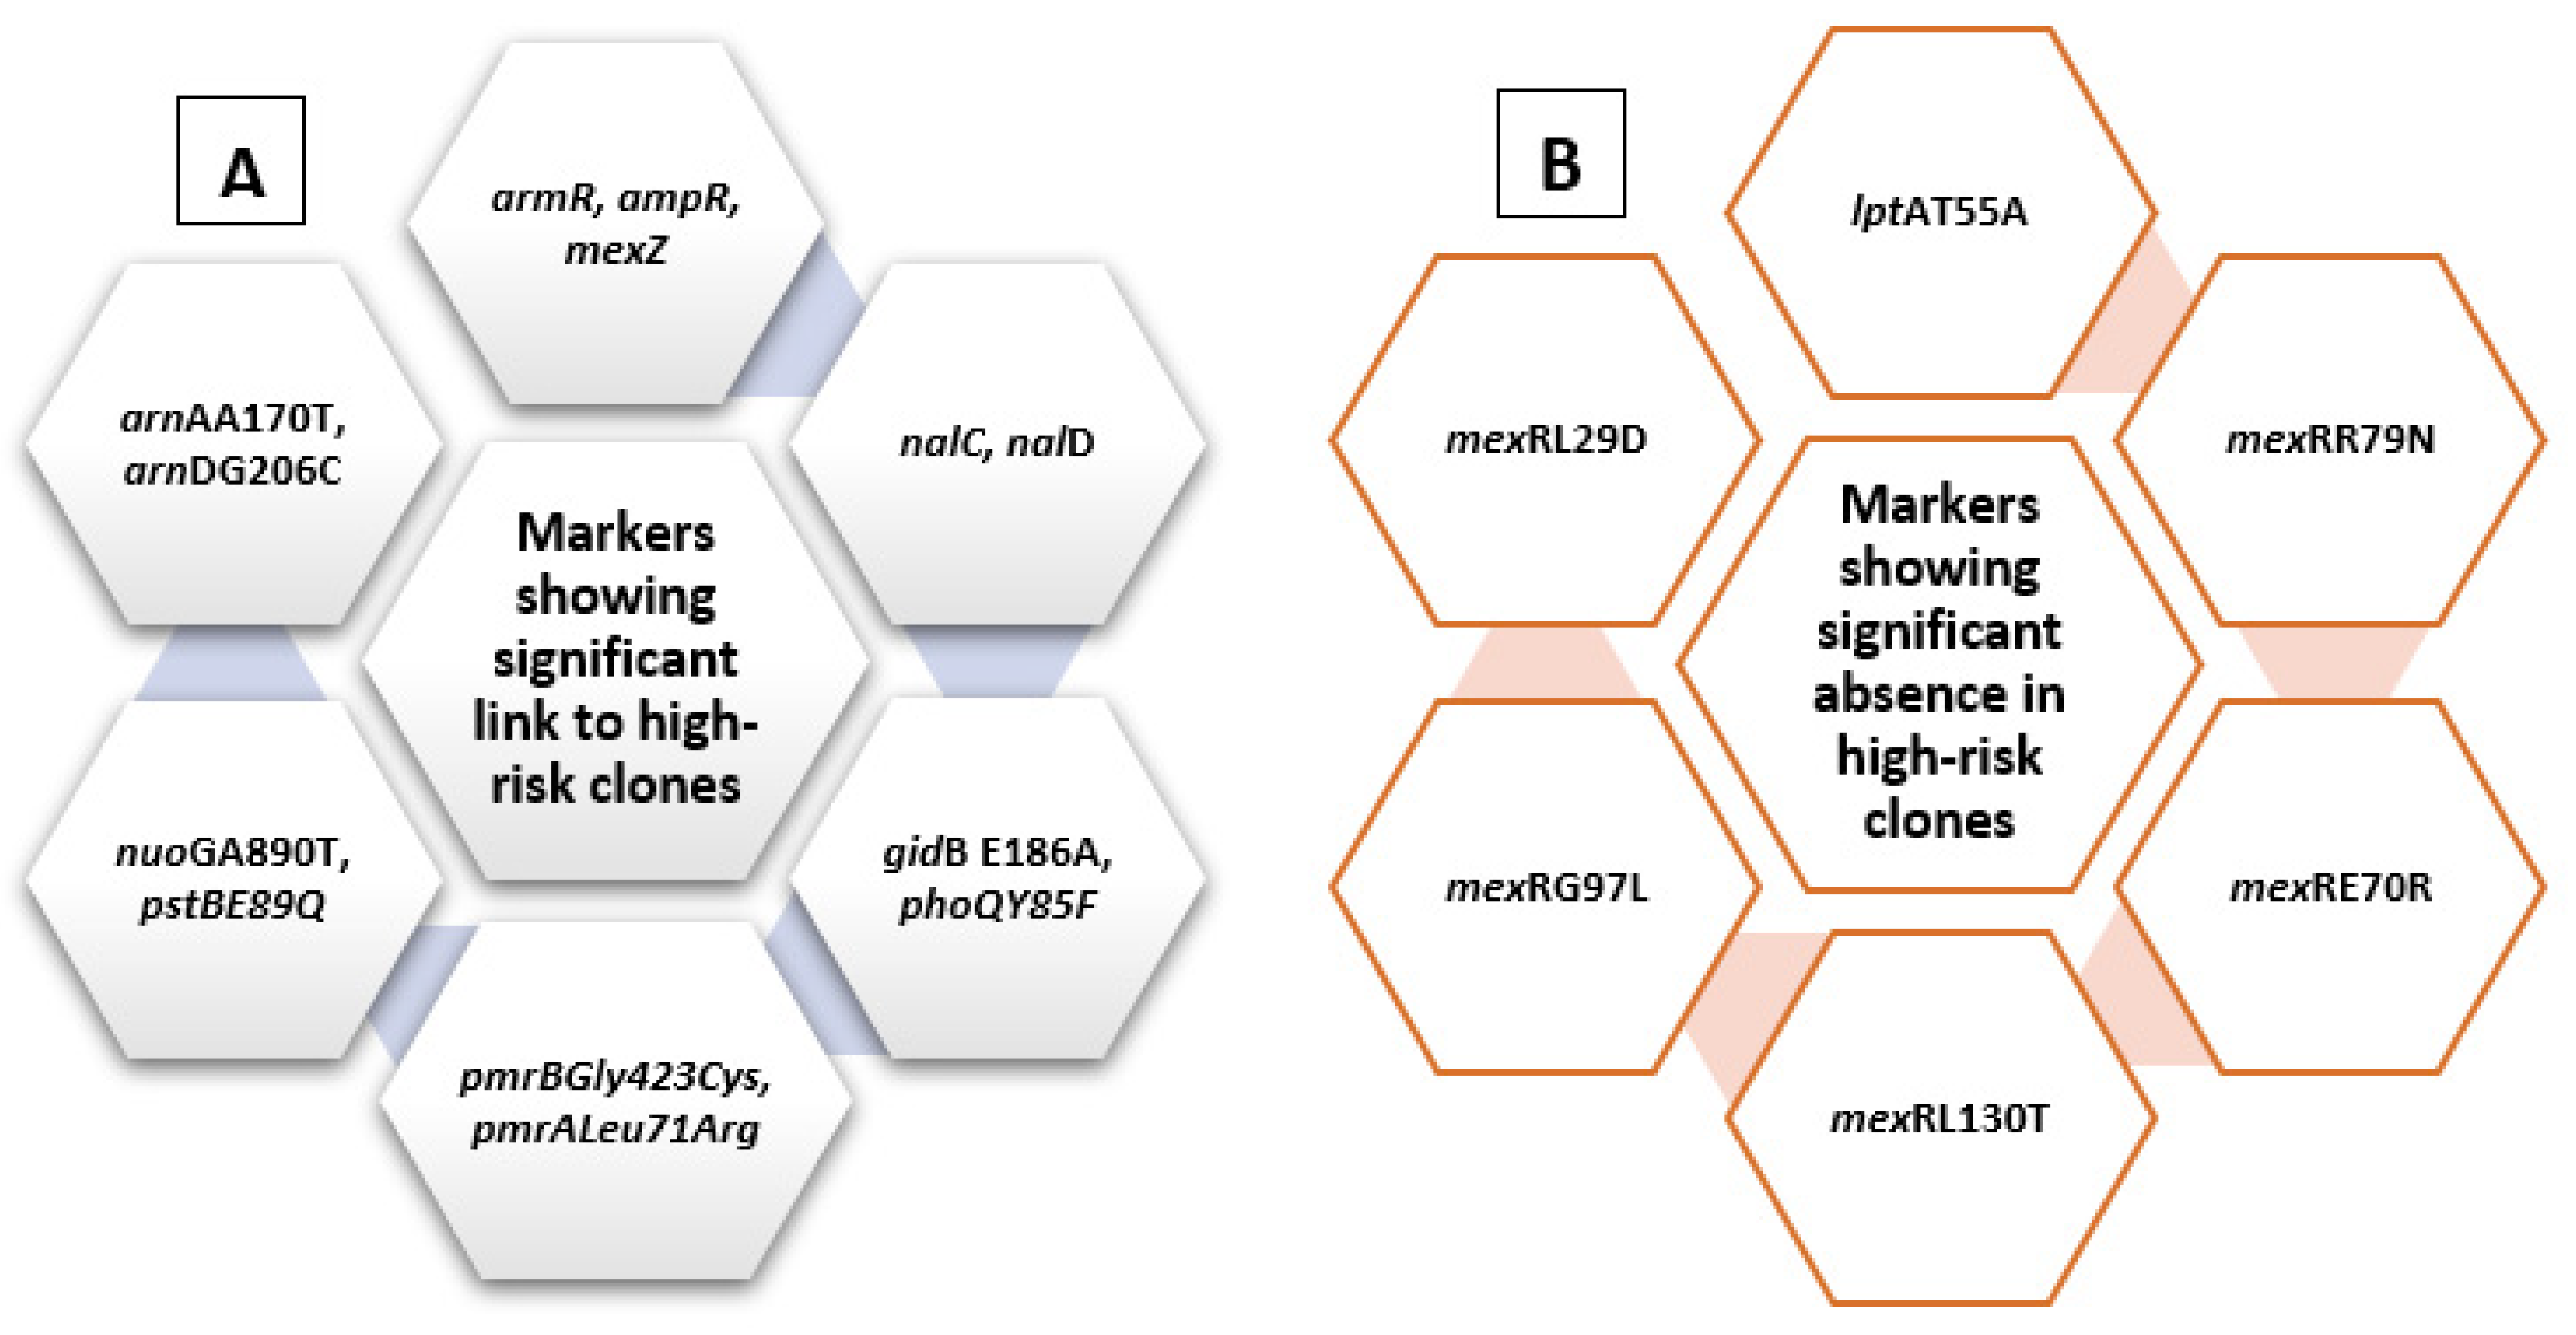
A chi-square test for independence (with Yates’ continuity correction) indicated significant associations between armR and high-risk groups, x2 (1, n = 528) = 9.5, p = 0.002, phi = 0.134. A significant association was also found between each of nalC, x2 (1, n = 528) = 6.218, p = 0.013, phi = 0.109; nalD, x2 (1, n = 528) = 3.856, p = 0.05, phi = 0.085; mexZ, x2 (1, n = 528) = 5.904, p = 0.015, phi = 0.106; ampR, x2 (1, n = 528) = 5.701, p = 0.017, phi = 0.104; gidBE186A, x2 (1, n = 528) = 89.753, p < 0.005, phi = 0.412; pmrBGly423Cys, x2 (1, n = 528) = 21.478, p < 0.005, phi = 0.202; pmrALeu71Arg, x2 (1, n = 528) = 14.546, p < 0.005, phi = 0.166; nuoGA890T, x2 (1, n = 528) = 16.236, p < 0.005, phi = 0.175; pstBE89Q, x2 (1, n = 528) = 6.92, p = 0.009, phi = 0.114; arnAA170T, x2 (1, n = 528) = 3.878, p = 0.049, phi = 0.086; arnDG206C, x2 (1, n = 528) = 3.878, p = 0.049, phi = 0.086; and phoQY85F, x2 (1, n = 528) = 60.031, p < 0.005, phi = 0.337, and high-risk groups. These are summarized in Figure 7.
Some markers appeared to be conserved to specific high-risk clones, showing very high effect sizes, including phoQY85F, nuoGA890T, pstBE89Q, arnAA170T, gidBE186A, and arnDG206C. Table 3 summarizes amikacin molecular markers showing links to specific high-risk clones.
phoQY85F showed high conservation to ST235 (x2 (1, n = 528) = 400.38, p < 0.005), with high effect size (phi = 0.871). The marker was identified in 48/50 ST235 sequences and rarely identified in other high-risk clones. nuoGA890T was exclusively identified in all sequences with ST395 (13/13) and not identified at all in any other high-risk clone (x2 (1, n = 528) = 455.82, p < 0.005), showing very high effect size (phi = 0.929). Similarly, pstBE89Q showed high conservation to ST233. It was identified in all sequences with ST233 (13/13) and not identified at all in any other high-risk clone assessed (x2 (1, n = 528) = 338.5, p < 0.005, phi = 0.801). Similarly, both arnAA170T and arnDG206C were exclusively identified in ST233 (13/13 sequences) and not in any other high-risk clone among those assessed; x2 (1, n = 528) = 292.64, p < 0.005, phi = 0.744, and x2 (1, n = 528) = 292.64, p < 0.005, phi = 0.744, respectively. On the other hand, gidB E186A showed significant conservation in ST235 (49/50 sequences); x2 (1, n = 528) = 493.946, p < 0.005, with very high effect size, phi = 0.967.
On the other hand, some other markers showed absence in relation to high-risk clones, including each of lptAT55A, x2 (1, n = 528) = 22.8, p < 0.005, phi = −0.208; mexRR79N, x2 (1, n = 528) = 6.669, p = 0.01, phi = −0.112; mexRE70R, x2 (1, n = 528) = 11.995, p = 0.001, phi = −0.151; mexRL130T, x2 (1, n = 528) = 8.953, p = 0.003, phi = −0.130; mexRG97L, x2 (1, n = 528) = 12.523, p < 0.005, phi = −0.154, and mexRL29D, x2 (1, n = 691) = 12.502, p < 0.005, phi = −0.154 (Figure 7).
2.4.4. Gentamycin-Related Molecular Markers
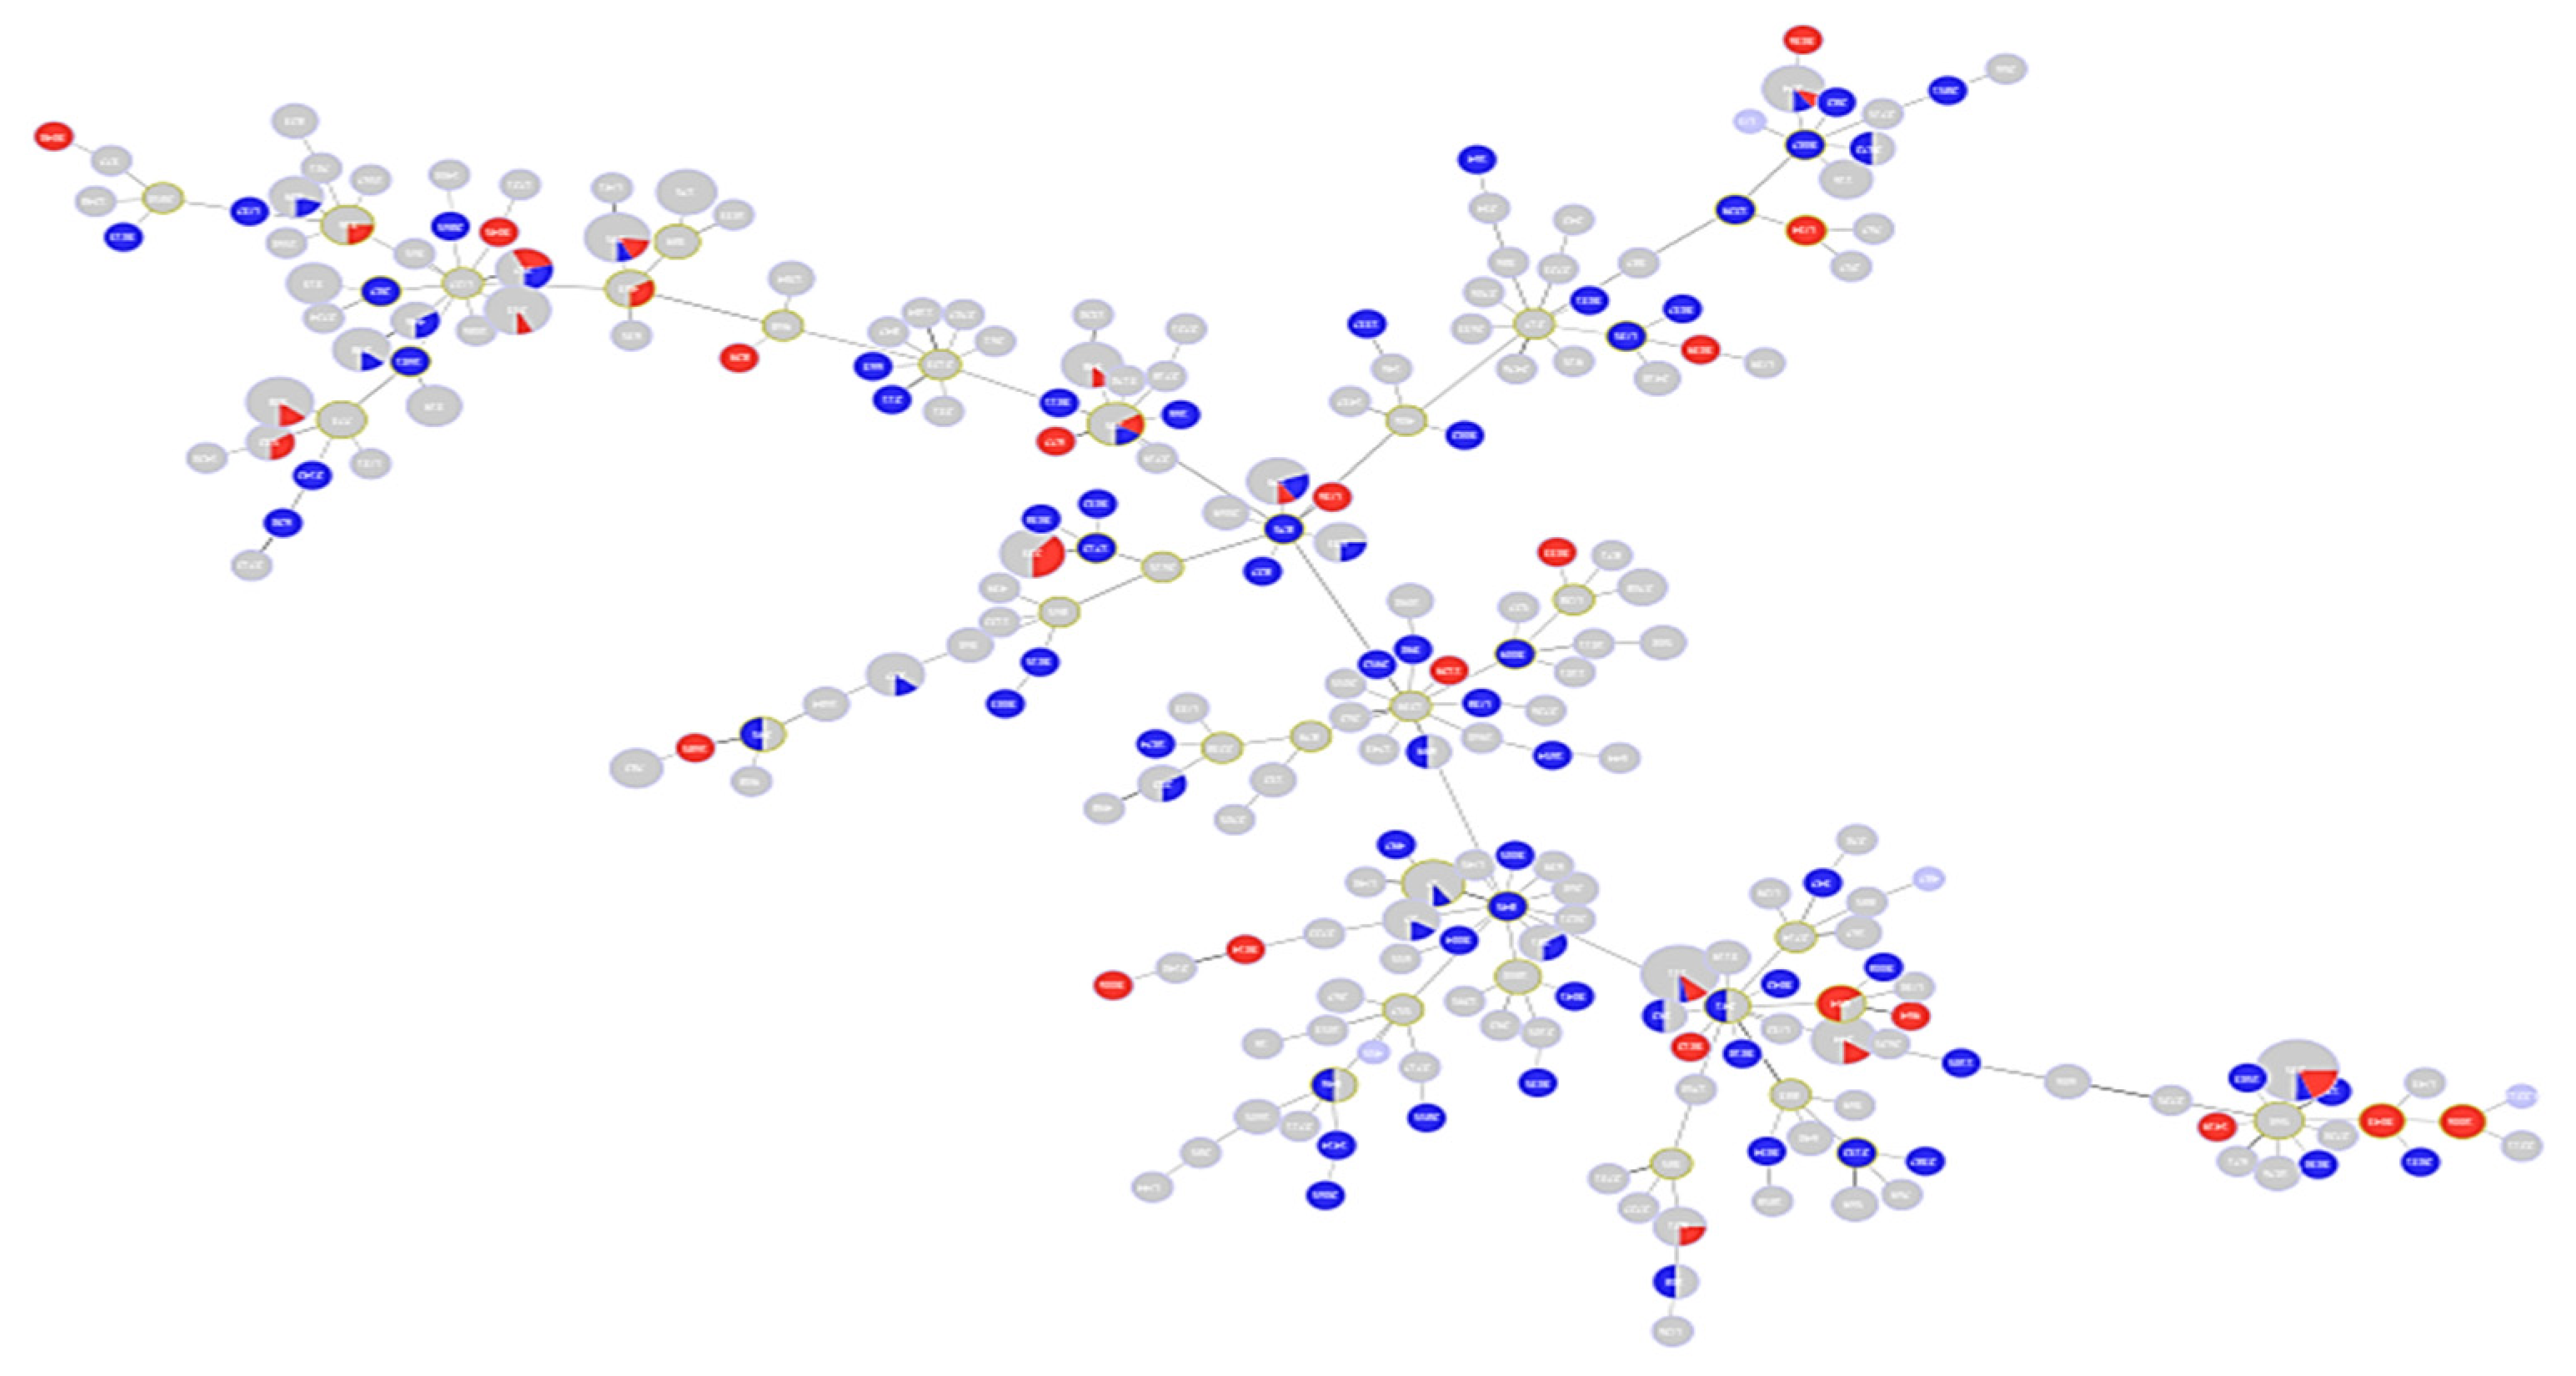
A total of 139 sequences were analyzed for gentamycin susceptibility phenotype (57 resistant and 82 susceptible). Figure 8 is an MST tree showing gentamycin susceptibility in relation to different STs. The distribution of gentamycin susceptibility and resistance in Figure 8 shows that both gentamycin-resistant and gentamycin-susceptible isolates are evenly distributed all over the MST tree. This may indicate that the antibiotic susceptibility phenotype relates to different STs at different distances and is not clustering in clones or in relation to specific clonal complexes. This is also similar to what was observed with quinolones in Figure 3 and Figure 5. Furthermore, the high-risk clones shown in the graph include both resistant and susceptible sequences. Of those analyzed, a total of 39 sequences belonged to epidemic high-risk clones (ST523 (N = 1), ST446 (N = 1), ST395 (N = 3), ST308 (N = 2), ST274 (N = 2), ST253 (N = 1), ST244 (N = 2), ST235 (N = 13), ST233 (N = 5), ST179 (N = 3), ST111 (N = 4), ST27 (N = 1), and ST17 (N = 1)).
A chi-square test for independence (with Yates’ continuity correction) indicated significant association between nalCE153Q and high-risk groups; x2 (1, n = 139) = 22.475, p < 0.005, phi = 0.402. Significant associations were also found between each of gidBE97Q, x2 (1, n = 139) = 36.772, p < 0.005, phi = 0.514; gidBE186A, x2 (1, n = 139) = 36.772, p < 0.005, phi = 0.514; pstBE89Q, x2 (1, n = 139) = 4.989, p = 0.026, phi = 0.189; and arnDG206C, x2 (1, n = 139) = 4.989, p = 0.026, phi = 0.189 and high-risk groups. Gentamycin molecular markers showing significant links to specific high-risk clones are summarized in Table 4.
3. Discussion
Understanding the reason for the success of epidemic high-risk clones is essential for designing treatment and infection control strategies [28]. The specific genetic resistance markers of these high-risk clones were described in detail for the first time by Cabot et al. [29]. These include multiple combinations of chromosomal mutations and/or horizontally acquired resistance elements. The mosaic nature observed for both chromosomal and acquired resistance elements in relation to high-risk clones necessitates being cautious before making conclusions about the molecular bases of success for these clones [30]. Correa et al. (2015) showed that the dissemination of extensively drug-resistant P. aeruginosa has been repeatedly linked to the presence of mobile genetic elements that would facilitate their successful spread and clonal dissemination [21]. Gene cassettes carried by class 1 integrons has also been suggested as an underlying cause for clonal success [31,32].
The analysis performed in this study used previously investigated quinolone and aminoglycoside resistance markers to study their correlation with high-risk clones. The identified high-risk related molecular markers for the studied quinolone group included ampR, mexZ, armR, nfxB, mexS, nalC, nalD, gyrAT83I, gyrAD87N, nalCE153Q, nalCS46A, parCS87W, parCS87L, ampRG283E, and ampRM288R.
Interestingly, it was observed that 41 sequences out of 50 within the high-risk group ST235 showed the following cluster/combination of molecular markers: mexZ, armR, nfxB, mexS, mexR, and nalC. gyrAT83I was identified in 36/50 sequences and nalCS46A in 43/50 sequences. Both gyrAT83I and parCS87L showed significant links to high-risk clones and specifically to ST235 and ST111, exhibiting the highest effect sizes for individual mutations among all those tested.
Similarly observed for ST111, 27 sequences out of 30 showed the same cluster of molecular markers (mexZ, armR, nfxB, mexS, mexR, and nalC). gyrAT83I was identified in 23/30 sequences and nalCS46A was identified in 24/30 sequences. Both showed statistically significant associations.
The findings from the current study can be supported by findings from the literature showing mexZ G195E, leading to MexXY overexpression, and gyrAT83I among the variants observed in relation to the spread of ST175 XDR phenotype. These were also identified by Kos et al. [3] among mutational resistance mechanisms showing frequent occurrence in both ST111 and ST235 high-risk clones [3]. Other findings by Treepong et al. (2017) also support the link between each of gyrAT83I and parCS87(80)I and the clone ST235 [33] A recent study has also identified a wide range of mutations in all efflux pump regulators in relation to high-risk clones including nalCE153Q, thus supporting findings from the current analysis [34].
Other recent observations also support the same findings, demonstrating the importance of QRDR-related mutations in high-risk clones [35]. In the same study, Horna et al. (2019) identified QRDR mutations in all sequences belonging to ST235 and ST357.
The molecular markers identified for the aminoglycoside group in relation to high-risk clones from the current analysis included armR, ampR, nalC, nalD, mexZ, pmrALeu71Arg, pmrBGly423Cys, nuoGA890T, pstBE89Q, phoQY85F, arnAA170T, arnDG206C, and gidBE186A. The pattern of their distribution seemed to be highly conserved for specific markers in relation to specific high-risk clones. Markers showing high conservation to specific high-risk clones with very high effect sizes included phoQY85F and gidB E186A with ST235, nuoGA890T with ST395, and pstBE89Q, arnAA170T, and arnDG206C with ST233.
Although it was shown by Chowdhury et al. [31] that the presence of resistance gene cassettes carried by class 1 integrons may be a characteristic of ST235 clonal lineage, there is no sufficient evidence to show whether this link is related to MDR behavior or whether it is an inherent character of the ST235 lineage. nfxB gene, the phoQ variant F76Y, and the pmrB variant V15I were all identified in all ST235 sequences evaluated from the same study [31]. These findings support the findings from the current analysis about the possible important link of nfxB, phoQ, and pmrAB variants to the ST235 clone.
Findings from the current analysis may also be supported by other recent findings shown by Pelegrin et al. (2019) [34], who identified the same variant phoQY85F as highly conserved in ST235. The same study has also shown that pmrALeu71Arg was frequently identified in both ST235 and ST446. Multiple other variants have also been identified in nuoG in relation to high-risk clones from the same study [34]. On the other hand, both arnAA170T and arnDG206C, previously identified as resistance markers to aminoglycosides (under preparation for publication), have also shown significant links to high-risk behavior, especially with ST233, showing very high effect size.
Changes in PhoP-PhoQ activity have been implicated in resistance to cationic antimicrobial peptides as a result of lipopolysaccharide (LPS) modification [36,37,38]. Similar changes may also underlie high-risk behavior, and this could explain the current findings.
pmrALeu71Arg appeared to be highly conserved in some high-risk clones including ST308 (12/14 sequences), ST233 (12/13 sequences), ST253 (11/13 sequences), ST179 (10/10 sequences), and ST175 (8/8 sequences). These findings are supported by findings from a recent study showing upregulation of pmrAB and phoPQ in relation to high-risk clones and colistin resistance [39]. In addition, some mutations in the two-component sensor-regulator system pmrAB have been linked to a changed aminoglycoside resistance phenotype. These include pmrALeu71Arg located within the signal receiver domain of the response regulator. While activation of each of the two systems separately only showed slight increases in MIC, combined activation led to a four-fold increase in the tobramycin MIC [40].
These findings collectively support findings from the literature showing that mutations in several two-component regulatory systems including pmrAB, phoPQ, and the related overexpression of the arnBCADTEF-pmrE operon can lead to lipid A modification. This effect proved to be associated with polymyxin resistance in P. aeruginosa [41]. A similar effect may also lead to aminoglycoside resistance or high-risk behavior, which may explain the current findings.
4. Materials and Methods
As a primary step to explore the specific molecular markers explaining the global success of epidemic high-risk clones, the population structure of P. aeruginosa in a large comprehensive dataset was analyzed. A large set of public P. aeruginosa genomes from the Patric database [22] were studied. The studied sequences are referred to in Supplementary Table S3. The analyzed set included the whole spectrum of resistance profiles for ciprofloxacin, levofloxacin, gentamycin, and amikacin antibiotics. An extensive panel of molecular markers studied and identified in a previous work in relation to antibiotic resistance (data not shown here) were evaluated in this study for their potential relation to clonal success.
4.1. Multilocus Sequence Typing (MLST) and Serotypes (O-type) Analysis
MLST was performed for all sequences according to the previously described typing scheme by Curran [23]. An ST was assigned to each unique allelic profile according to the P. aeruginosa PubMLST database (http://pubmlst.org/paeruginosa/). Whole-genome sequence data (WGS) for the selected sequences from Patric database (528 genomes) were used to identify STs using the method publicly available at www.cbs.dtu.dk/services/MLST [42]. WGS data were also used to determine the serogroups of all studied isolates based on the sequence of O-specific antigen (OSA) gene cluster using the P. aeruginosa serotyper (PAst) web tool available on the Center for Genomic Epidemiology (CGE) service platform (https://cge.cbs.dtu.dk/services/PAst-1.0/) [43].
4.2. Phylogenetic Analysis
Phylogenetic analysis and hierarchical clustering were performed to evaluate the distribution of the studied set of sequences among all known P. aeruginosa genomes. The genes encoding the metabolic enzymes, acsA, aroE, guaA, mutL, nuoD, ppsA, and trpE, which are commonly used for MLST typing, were used. Concatenated sequences of these genes for the studied set of 528 genomes, as extracted from the MLST output tool provided by https://cge.cbs.dtu.dk/services/MLST/, and concatenated sequences of all other known STs for P. aeruginosa, as extracted from the Pseudomonas aeruginosa MLST website, available at https://pubmlst.org/paeruginosa/, were aligned using the MUSCLE option [44] implemented in the software MEGA 7 [45]. The phylogenetic tree of the concatenated genes was constructed using the UPGMA algorithm.
4.3. Population Structure and Diversity Analysis
Strain relationships were analyzed using the geoBURST Full MST algorithm [24], as implemented in the software PHYLOVIZ [25], to construct a minimum spanning tree (MST) of the total set of P. aeruginosa strains based on MLST data according to the steps shown in Phyloviz documentation release 2.0, available at http://www.phyloviz.net/. Clonal complexes (CCs) were defined in the current analysis as complexes or “groups of studied sequences” containing at least three STs sharing the same allele numbers in at least five of seven loci. Isolate-specific metadata, including serotypes, quinolone, and aminoglycoside resistance data, were then overlaid on top of the minimum spanning tree. Allelic linkage disequilibrium was assessed with two test options of both Monte Carlo methods and Parametric with 100 resampling using LIAN version 3.7 [26], available at http://guanine.evolbio.mpg.de/cgi-bin/lian/lian.cgi.pl/query.
The standardized index of association (ISA) and the mean genetic diversity (H) were used to assess the linkage equilibrium and degree of association between alleles [46,47].
Discriminatory power (Simpson’s index) and concordance (cluster agreement) between 2 typing methods (adjusted Rand index and adjusted Wallace) were evaluated according to Carriço et al. [48] using the web source http://www.comparingpartitions.info/.
4.4. Resistance Genes and Markers Correlations
A primary literature review to extract genes and gene variants associated with quinolone and aminoglycoside resistance was carried out on PMC PubMed Central, ACADEMIC SEARCH COMPLETE (EBSCO host), and ScienceDirect using the following search criteria:
“Pseudomonas aeruginosa” [title/abstract] AND “aminoglycosides resistance”[title/abstract]
“Pseudomonas aeruginosa” [title/abstract] AND “Quinolone resistance”[title/abstract].
Secondary more specific searches were also conducted using search criteria “Efflux pumps OR Target mutations AND Pseudomonas aeruginosa”. All search results were analyzed to extract variants and genes with function related to antibiotic resistance for the studied antibiotic groups. A large set of data was generated. The correlations of these markers were further tested in relation to antibiotic susceptibility and were prioritized based on their diagnostic predictive values (data not shown here).
High-risk clones studied here included the most well-known and well-studied groups as extracted by Oliver et al. (2015) [11] and relevant review articles. The final set of the previously identified and prioritized antibiotic-resistance-related markers were then explored for their correlation with the well-studied P. aeruginosa high-risk STs in order to study their potential to explain the success of epidemic high-risk clones. Markers that have been previously identified from the literature in relation to antibiotic resistance and those novel ones are listed in Table 5. Chi-square test for independence (with Yates’ continuity correction) was used to compare groups. A p-value of < 0.05 was considered as statistically significant.
The panel of previously tested ciprofloxacin and levofloxacin resistance molecular markers was analyzed for possible correlation with high-risk clones. These markers included mexZ, nalCS46A, nalCS209R, nalCG71E, gyrAT83I, gyrAD87N, parCS87W, parCS87L, nalCE153Q, nalCThr50pro, mexS gene, nalD gene, nfxB gene, armR gene, parEV460G, ampRD135N, ampRG283E, and ampRM288R.
For gentamycin and amikacin, the molecular markers tested included phoQY85F, nuoGA890T, pstBE89Q, lptAT55A, lptAR62S, faoAT385A, arnAA170T, arnDG206C, mexRR79N, mexRE70R, mexRL130T, mexRG97L, mexRL29D, mexZ, ampR gene, pmrBGly423Cys, pmrALeu71Arg, fusA1D588G, gidBE186A, armR (PA3719), nalC gene, nalD, nalDser32Asn, gidBQ28K, gidBE97Q, nalCE153Q, and ampRA51T.
5. Conclusions
The findings from the current study point to the importance of membrane protein variants and efflux pump regulators in the success of high-risk clones. The functional modifications caused by these variants may give the clones their success in addition to being related to resistance or virulence characteristics. Although inactivating enzymes were not assessed in the current study, a new group of mutational variants in chromosomal genes related to efflux pumps, efflux pump regulators, and membrane proteins showing strong correlations in a large diverse set of sequences can support the assumption that horizontally acquired elements, whether through plasmids or integrons, are not the sole underlying molecular elements behind the success and spread of epidemic high-risk clones. Variants identified from the current analysis can represent biologic markers showing increased fitness and leading to the acquisition of specific adaptive or beneficial traits. These variants may also represent an adaptation to chronic infections. However, this needs to be further investigated by studying the variants’ biologic effect, which is beyond the objectives of this work.
P. aeruginosa sub-lineages have been previously observed to show independent signatures of adaptation that may result into distinct biologic activities [50] and this support the assumption from the current study. Although not much information is available on the mutation rate of high-risk P. aeruginosa clones, it has been suggested that the mutator phenotypes observed in high-risk clones may play a role in the adaptability required for the global success and dissemination of high-risk clones showing markers similar to those observed in chronic infections [51,52,53]. This assumption can also be supported by findings from the current analysis. Further evidence suggesting the independent acquisition of adaptive characters is in the findings of mutational resistance arising independently across distinct phylogenetic lineages and contributing to the mutation-driven evolution of the P. aeruginosa population structure [54].
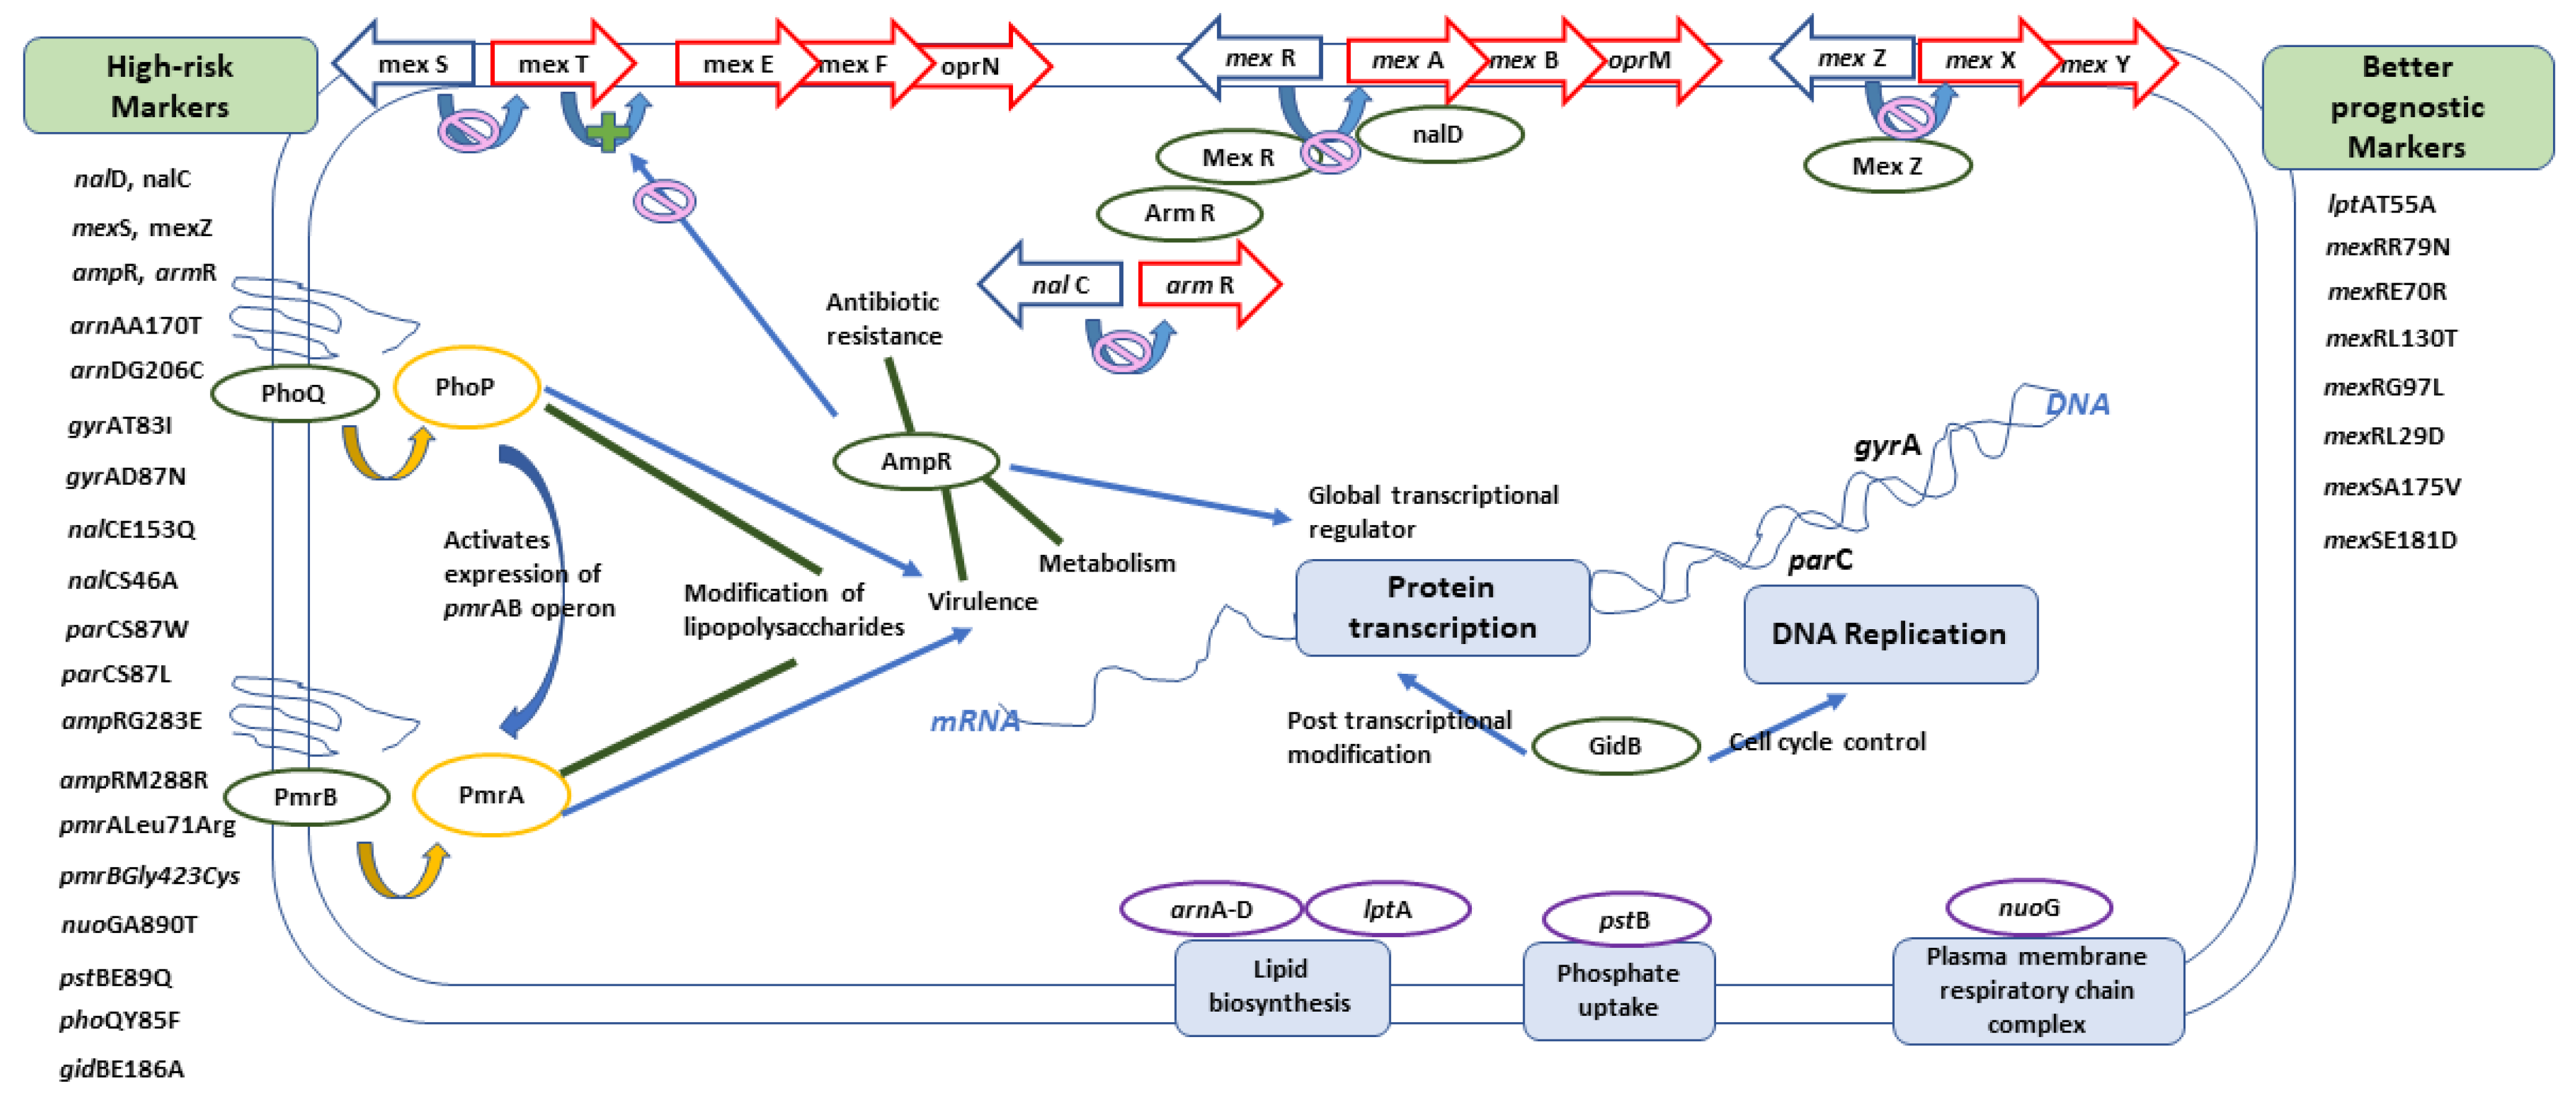
In conclusion, armR, ampR, nalC, nalD, mexZ, mexS, gyrAT83I, gyrAD87N, nalCE153Q, nalCS46A, parCS87W, parCS87L, ampRG283E ampRM288R, pmrALeu71Arg, pmrBGly423Cys, nuoGA890T, pstBE89Q, phoQY85F, arnAA170T, arnDG206C, and gidBE186A can all be considered as molecular markers of high-risk behavior, while other markers including lptAT55A, mexRR79N, mexRE70R, mexRL130T, mexRL29D, mexSA175V, mexSE181D, and mexRG97L can indicate the absence of risky clones and, consequently, better prognosis. Figure 9 shows a graphical summary of the main conclusions, representing the role of different genes within the cell. Finding risk-associated markers during hospital molecular surveillance or outbreak investigation necessitates applying more infection-control precautions to prevent transmission of such risky clones.
Supplementary Materials
The following are available online at https://www.mdpi.com/2079-6382/10/1/35/s1, Table S1: Quinolones’ MIC values for the studied set of sequences and their corresponding STs and serotypes; Table S2: Aminoglycosides’ MIC values for the studied set of sequences and their corresponding STs and serotypes; Table S3: ID of studied set of sequences from the Patric database and their accession numbers.
Author Contributions
Conceptualization, W.N.; methodology, W.N.; validation, W.N., R.R.M., D.H.A. and Z.M.M.; formal analysis, W.N.; investigation, W.N. and R.R.M.; resources, W.N., R.R.M., D.H.A. and Z.M.M.; data curation, W.N., R.R.M., D.H.A. and Z.M.M.; writing—original draft preparation, W.N. and R.R.M.; writing—review and editing, W.N., R.R.M., D.H.A. and Z.M.M.; visualization, W.N., R.R.M., D.H.A. and Z.M.M. All authors have read and agreed to the published version of the manuscript.
Funding
This research received no external funding.
Institutional Review Board Statement
Not applicable.
Informed Consent Statement
Not applicable.
Data Availability Statement
Primary sequence data analyzed in this study are available in Supplementary Materials S1, S2, and S3.
Conflicts of Interest
The authors declare no conflict of interest.
References
- European Centre for Disease Prevention and Control. Antimicrobial Resistance Surveillance in Europe 2013; Annual Report of the European Antimicrobial Resistance Surveillance Network (EARS-Net); ECDC: Stockholm, Sweden, 2014. [Google Scholar]
- CDC. Antibiotic Resistance Threats in the United States; U.S. Department of Health and Human Services, Centers for Disease Control and Prevention: Atlanta, GA, USA, 2019; pp. 1–150. Available online: http://dx.doi.org/10.15620/cdc:82532 (accessed on 30 November 2020).
- Kos, V.N.; Déraspe, M.; McLaughlin, R.E.; Whiteaker, J.D.; Roy, P.H.; Alm, R.A.; Corbeil, J.; Gardner, H. The resistome of Pseudomonas aeruginosa in relationship to phenotypic susceptibility. Antimicrob. Agents Chemother. 2015, 59, 427–436. [Google Scholar] [CrossRef] [PubMed] [Green Version]
- Pendleton, J.N.; Gorman, S.P.; Gilmore, B.F. Clinical relevance of the ESKAPE pathogens. Expert Rev. Anti-Infect. Ther. 2013, 11, 297–308. [Google Scholar] [CrossRef] [PubMed]
- World Health Organization. Prioritization of Pathogens to Guide Discovery, Research and Development of New Antibiotics for Drug-Resistant Bacterial Infections, Including Tuberculosis; World Health Organization: Geneva, Switzerland, 2017. [Google Scholar]
- Willyard, C. The drug-resistant bacteria that pose the greatest health threats. Nature 2017, 543, 15. [Google Scholar] [CrossRef] [PubMed] [Green Version]
- Foxman, B.; Zhang, L.; Koopman, J.S.; Manning, S.D.; Marrs, C.F. Choosing an appropriate bacterial typing technique for epidemiologic studies. Epidemiol. Perspect. Innov. 2005, 2, 10. [Google Scholar] [CrossRef] [PubMed] [Green Version]
- Magalhães, B.; Valot, B.; Abdelbary, M.M.H.; Prod’hom, G.; Greub, G.; Senn, L.; Blanc, D.S. Combining Standard Molecular Typing and Whole Genome Sequencing to Investigate Pseudomonas aeruginosa Epidemiology in Intensive Care Units. Front. Public Health 2020, 8, 3. [Google Scholar] [CrossRef] [Green Version]
- Spratt, B.G. Exploring the Concept of Clonality in Bacteria BT. In Genomics, Proteomics, and Clinical Bacteriology: Methods and Reviews; Woodford, N., Johnson, A.P., Eds.; Humana Press: Totowa, NJ, USA, 2004; pp. 323–352. ISBN 978-1-59259-763-5. [Google Scholar]
- Jeukens, J.; Freschi, L.; Kukavica-Ibrulj, I.; Emond-Rheault, J.-G.; Tucker, N.P.; Levesque, R.C. Genomics of antibiotic-resistance prediction in Pseudomonas aeruginosa. Ann. N. Y. Acad. Sci. 2019, 1435, 5–17. [Google Scholar] [CrossRef] [Green Version]
- Oliver, A.; Mulet, X.; López-Causapé, C.; Juan, C. The increasing threat of Pseudomonas aeruginosa high-risk clones. Drug Resist. Updat. 2015, 21–22. [Google Scholar] [CrossRef]
- Fernández-Olmos, A.; García-Castillo, M.; María Alba, J.; Morosini, M.I.; Lamas, A.; Romero, B.; Galán, J.C.; Del Campo, R.; Cantón, R. Population structure and Antimicrobial susceptibility of both nonpersistent and persistent Pseudomonas aeruginosa isolates recovered from cystic fibrosis patients. J. Clin. Microbiol. 2013, 51. [Google Scholar] [CrossRef] [Green Version]
- Van Mansfeld, R.; Willems, R.; Brimicombe, R.; Heijerman, H.; Van Berkhout, F.T.; Wolfs, T.; Van Der Ent, C.; Bonten, M. Pseudomonas aeruginosa genotype prevalence in Dutch Cystic Fibrosis patients and age dependency of colonization by various P. aeruginosa sequence types. J. Clin. Microbiol. 2009, 47. [Google Scholar] [CrossRef] [Green Version]
- Caballero, J.D.D.; del Campo, R.; Cobo, M.; Chinchón, G.; López-Causapé, C.; Antonio, O.; Tato, M.; Cantón, R. 59 Population structure and antimicrobial susceptibility of Pseudomonas aeruginosa from a national survey involving 24 cystic fibrosis units in Spain. J. Cyst. Fibros. 2014, 13, S61. [Google Scholar] [CrossRef] [Green Version]
- Garcia-Castillo, M.; Morosini, M.I.; Rodriguez-Baños, M.; Máiz, L.; Lamas, A.; Baquero, F.; Cantón, R.; del Campo, R. 128 Population structure of Pseudomonas aeruginosa from cystic fibrosis patients. J. Cyst. Fibros. 2011, 10, S33. [Google Scholar] [CrossRef]
- Woodford, N.; Turton, J.F.; Livermore, D.M. Multiresistant Gram-negative bacteria: The role of high-risk clones in the dissemination of antibiotic resistance. FEMS Microbiol. Rev. 2011, 35, 736–755. [Google Scholar] [CrossRef] [PubMed] [Green Version]
- Pena, C.; Cabot, G.; Gomez-Zorrilla, S.; Zamorano, L.; Ocampo-Sosa, A.; Murillas, J.; Almirante, B.; Pomar, V.; Aguilar, M.; Granados, A.; et al. Influence of Virulence Genotype and Resistance Profile in the Mortality of Pseudomonas aeruginosa Bloodstream Infections. Clin. Infect. Dis. 2015, 60, 539–548. [Google Scholar] [CrossRef] [PubMed]
- Mogayzel, P.J.; Naureckas, E.T.; Robinson, K.A.; Brady, C.; Guill, M.; Lahiri, T.; Lubsch, L.; Matsui, J.; Oermann, C.M.; Ratjen, F.; et al. Cystic Fibrosis Foundation Pulmonary Guideline. Pharmacologic Approaches to Prevention and Eradication of Initial Pseudomonas aeruginosa Infection. Ann. Am. Thorac. Soc. 2014, 11, 1640–1650. [Google Scholar] [CrossRef]
- Zhang, Y.; Zhou, H.; Jiang, Q.; Wang, Q.; Li, S.; Huang, Y. Bronchoscope-related Pseudomonas aeruginosa pseudo-outbreak attributed to contaminated rinse water. Am. J. Infect. Control 2020, 48, 26–32. [Google Scholar] [CrossRef]
- Moloney, E.M.; Deasy, E.C.; Swan, J.S.; Brennan, G.I.; O’Donnell, M.J.; Coleman, D.C. Whole-genome sequencing identifies highly related Pseudomonas aeruginosa strains in multiple washbasin U-bends at several locations in one hospital: Evidence for trafficking of potential pathogens via wastewater pipes. J. Hosp. Infect. 2019, 4–11. [Google Scholar] [CrossRef]
- Correa, A.; Del Campo, R.; Perenguez, M.; Blanco, V.M.; Rodríguez-Baños, M.; Perez, F.; Maya, J.J.; Rojas, L.; Cantón, R.; Arias, C.A.; et al. Dissemination of high-risk clones of extensively drug-resistant pseudomonas aeruginosa in Colombia. Antimicrob. Agents Chemother. 2015, 59, 2421–2425. [Google Scholar] [CrossRef] [Green Version]
- Wattam, A.R.; Davis, J.J.; Assaf, R.; Boisvert, S.; Brettin, T.; Bun, C.; Conrad, N.; Dietrich, E.M.; Disz, T.; Gabbard, J.L.; et al. Improvements to PATRIC, the all-bacterial Bioinformatics Database and Analysis Resource Center. Nucleic Acids Res. 2017, 45, D535–D542. [Google Scholar] [CrossRef]
- Curran, B.; Jonas, D.; Grundmann, H.; Pitt, T.; Dowson, C.G. Development of a multilocus sequence typing scheme for the opportunistic pathogen Pseudomonas aeruginosa. J. Clin. Microbiol. 2004, 42, 5644–5649. [Google Scholar] [CrossRef] [Green Version]
- Francisco, A.P.; Bugalho, M.; Ramirez, M.; Carriço, J.A. Global optimal eBURST analysis of multilocus typing data using a graphic matroid approach. BMC Bioinform. 2009, 10, 152. [Google Scholar] [CrossRef] [Green Version]
- Francisco, A.P.; Vaz, C.; Monteiro, P.T.; Melo-Cristino, J.; Ramirez, M.; Carriço, J.A. PHYLOViZ: Phylogenetic inference and data visualization for sequence based typing methods. BMC Bioinform. 2012, 13, 87. [Google Scholar] [CrossRef] [PubMed] [Green Version]
- Haubold, B.; Hudson, R.R. LIAN 3.0: Detecting linkage disequilibrium in multilocus data. Bioinformatics 2000, 16, 847–849. [Google Scholar] [CrossRef] [PubMed]
- Severiano, A.; Pinto, F.R.; Ramirez, M.; Carriço, J.A. Adjusted Wallace coefficient as a measure of congruence between typing methods. J. Clin. Microbiol. 2011, 49, 3997–4000. [Google Scholar] [CrossRef] [PubMed] [Green Version]
- Baquero, F.; Coque, T.M.; de la Cruz, F. Ecology and evolution as targets: The need for novel eco-evo drugs and strategies to fight antibiotic resistance. Antimicrob. Agents Chemother. 2011, 55, 3649–3660. [Google Scholar] [CrossRef] [PubMed] [Green Version]
- Cabot, G.; Ocampo-Sosa, A.A.; Domínguez, M.A.; Gago, J.F.; Juan, C.; Tubau, F.; Rodríguez, C.; Moyà, B.; Peña, C.; Martínez-Martínez, L.; et al. Genetic markers of widespread extensively drug-resistant Pseudomonas aeruginosa high-risk clones. Antimicrob. Agents Chemother. 2012, 56, 6349–6357. [Google Scholar] [CrossRef] [PubMed] [Green Version]
- Kugelberg, E.; Löfmark, S.; Wretlind, B.; Andersson, D.I. Reduction of the fitness burden of quinolone resistance in Pseudomonas aeruginosa. J. Antimicrob. Chemother. 2005, 55, 22–30. [Google Scholar] [CrossRef] [Green Version]
- Chowdhury, P.R.; Scott, M.; Worden, P.; Huntington, P.; Hudson, B.; Karagiannis, T.; Charles, I.G.; Djordjevic, S.P. Genomic islands 1 and 2 play key roles in the evolution of extensively drug-resistant ST235 isolates of Pseudomonas aeruginosa. Open Biol. 2016, 6. [Google Scholar] [CrossRef]
- Roy Chowdhury, P.; Scott, M.J.; Djordjevic, S.P. Genomic islands 1 and 2 carry multiple antibiotic resistance genes in Pseudomonas aeruginosa ST235, ST253, ST111 and ST175 and are globally dispersed. J. Antimicrob. Chemother. 2017, 72, 620–622. [Google Scholar] [CrossRef]
- Treepong, P.; Kos, V.N.; Guyeux, C.; Blanc, D.S.; Bertrand, X.; Valot, B.; Hocquet, D. Global emergence of the widespread Pseudomonas aeruginosa ST235 clone. Clin. Microbiol. Infect. 2018, 24, 258–266. [Google Scholar] [CrossRef] [Green Version]
- Pelegrin, A.C.; Saharman, Y.R.; Griffon, A.; Palmieri, M.; Mirande, C.; Karuniawati, A.; Sedono, R.; Aditianingsih, D.; Goessens, W.H.F.; van Belkum, A.; et al. High-risk international clones of carbapenem-nonsusceptible pseudomonas aeruginosa endemic to Indonesian intensive care units: Impact of a multifaceted infection control intervention analyzed at the genomic level. MBio 2019, 10, 1–14. [Google Scholar] [CrossRef] [Green Version]
- Horna, G.; Amaro, C.; Palacios, A.; Guerra, H.; Ruiz, J. High frequency of the exoU+/exoS+ genotype associated with multidrug-resistant “high-risk clones” of Pseudomonas aeruginosa clinical isolates from Peruvian hospitals. Sci. Rep. 2019, 9, 1–13. [Google Scholar] [CrossRef] [PubMed] [Green Version]
- Macfarlane, E.L.A.; Kwasnicka, A.; Ochs, M.M.; Hancock, R.E.W. PhoP-PhoQ homologues in Pseudomonas aeruginosa regulate expression of the outer-membrane protein OprH and polymyxin B resistance. Mol. Microbiol. 1999, 34, 305–316. [Google Scholar] [CrossRef] [PubMed] [Green Version]
- McPhee, J.B.; Lewenza, S.; Hancock, R.E.W. Cationic antimicrobial peptides activate a two-component regulatory system, PmrA-PmrB, that regulates resistance to polymyxin B and cationic antimicrobial peptides in Pseudomonas aeruginosa. Mol. Microbiol. 2003, 50, 205–217. [Google Scholar] [CrossRef] [PubMed]
- Moskowitz, S.M.; Ernst, R.K.; Miller, S.I. PmrAB, a two-component regulatory system of Pseudomonas aeruginosa that modulates resistance to cationic antimicrobial peptides and addition of aminoarabinose to lipid A. J. Bacteriol. 2004, 186, 575–579. [Google Scholar] [CrossRef] [Green Version]
- Vatansever, C.; Menekse, S.; Dogan, O.; Gucer, L.S.; Ozer, B.; Ergonul, O.; Can, F. Co-existence of OXA-48 and NDM-1 in colistin resistant Pseudomonas aeruginosa ST235. Emerg. Microbes Infect. 2020, 9, 152–154. [Google Scholar] [CrossRef] [Green Version]
- Schniederjans, M.; Koska, M.; Häussler, S. Transcriptional and Mutational Profiling of an Aminoglycoside-Resistant Pseudomonas aeruginosa Small-Colony Variant. Antimicrob. Agents Chemother. 2017, 61. [Google Scholar] [CrossRef] [Green Version]
- Han, M.-L.; Zhu, Y.; Creek, D.J.; Lin, Y.-W.; Gutu, A.D.; Hertzog, P.; Purcell, T.; Shen, H.-H.; Moskowitz, S.M.; Velkov, T.; et al. Comparative Metabolomics and Transcriptomics Reveal Multiple Pathways Associated with Polymyxin Killing in Pseudomonas aeruginosa. mSystems 2019, 4, 1–18. [Google Scholar] [CrossRef] [Green Version]
- Larsen, M.V.; Cosentino, S.; Rasmussen, S.; Friis, C.; Hasman, H.; Marvig, R.L.; Jelsbak, L.; Sicheritz-Ponten, T.; Ussery, D.W.; Aarestrup, F.M.; et al. Multilocus Sequence Typing of Total-Genome-Sequenced Bacteria. J. Clin. Microbiol. 2012, 50, 1355–1361. [Google Scholar] [CrossRef] [Green Version]
- Thrane, S.W.; Taylor, V.L.; Lund, O.; Lam, J.S.; Jelsbak, L. Application of Whole-Genome Sequencing Data for O-Specific Antigen Analysis and In Silico Serotyping of Pseudomonas aeruginosa Isolates. J. Clin. Microbiol. 2016, 54, 1782–1788. [Google Scholar] [CrossRef] [Green Version]
- Edgar, R.C. MUSCLE: Multiple sequence alignment with high accuracy and high throughput. Nucleic Acids Res. 2004, 32, 1792–1797. [Google Scholar] [CrossRef] [Green Version]
- Kumar, S.; Stecher, G.; Tamura, K. MEGA7: Molecular Evolutionary Genetics Analysis Version 7.0 for Bigger Datasets. Mol. Biol. Evol. 2016, 33, 1870–1874. [Google Scholar] [CrossRef] [PubMed] [Green Version]
- Smith, J.M.; Smith, N.H.; O’Rourke, M.; Spratt, B.G. How clonal are bacteria? Proc. Natl. Acad. Sci. USA 1993, 90, 4384–4388. [Google Scholar] [CrossRef] [PubMed] [Green Version]
- Lenski, R.E. Assessing the genetic structure of microbial populations. Proc. Natl. Acad. Sci. USA 1993, 90, 4334–4336. [Google Scholar] [CrossRef] [Green Version]
- Carriço, J.A.; Silva-Costa, C.; Melo-Cristino, J.; Pinto, F.R.; de Lencastre, H.; Almeida, J.S.; Ramirez, M. Illustration of a common framework for relating multiple typing methods by application to macrolide-resistant Streptococcus pyogenes. J. Clin. Microbiol. 2006, 44, 2524–2532. [Google Scholar] [CrossRef] [PubMed] [Green Version]
- Hunter, P.R.; Gaston, M.A. Numerical index of the discriminatory ability of typing systems: An application of Simpson’s index of diversity. J. Clin. Microbiol. 1988, 26, 2465–2466. [Google Scholar] [CrossRef] [Green Version]
- O’Brien, S.; Williams, D.; Fothergill, J.L.; Paterson, S.; Winstanley, C.; Brockhurst, M.A. High virulence sub-populations in Pseudomonas aeruginosa long-term cystic fibrosis airway infections. BMC Microbiol. 2017, 17, 30. [Google Scholar] [CrossRef] [Green Version]
- Mena, A.; Smith, E.E.; Burns, J.L.; Speert, D.P.; Moskowitz, S.M.; Perez, J.L.; Oliver, A. Genetic adaptation of Pseudomonas aeruginosa to the airways of cystic fibrosis patients is catalyzed by hypermutation. J. Bacteriol. 2008, 190, 7910–7917. [Google Scholar] [CrossRef] [Green Version]
- Oliver, A.; Cantón, R.; Campo, P.; Baquero, F.; Blázquez, J. High frequency of hypermutable Pseudomonas aeruginosa in cystic fibrosis lung infection. Science 2000, 288, 1251–1253. [Google Scholar] [CrossRef]
- Mulet, X.; Cabot, G.; Ocampo-Sosa, A.A.; Domínguez, M.A.; Zamorano, L.; Juan, C.; Tubau, F.; Rodríguez, C.; Moyà, B.; Peña, C.; et al. Biological markers of Pseudomonas aeruginosa epidemic high-risk clones. Antimicrob. Agents Chemother. 2013, 57, 5527–5535. [Google Scholar] [CrossRef] [Green Version]
- Zamudio, R.; Hijazi, K.; Joshi, C.; Aitken, E.; Oggioni, M.R.; Gould, I.M. Phylogenetic analysis of resistance to ceftazidime/avibactam, ceftolozane/tazobactam and carbapenems in piperacillin/tazobactam-resistant Pseudomonas aeruginosa from cystic fibrosis patients. Int. J. Antimicrob. Agents 2019, 53, 774–780. [Google Scholar] [CrossRef] [Green Version]
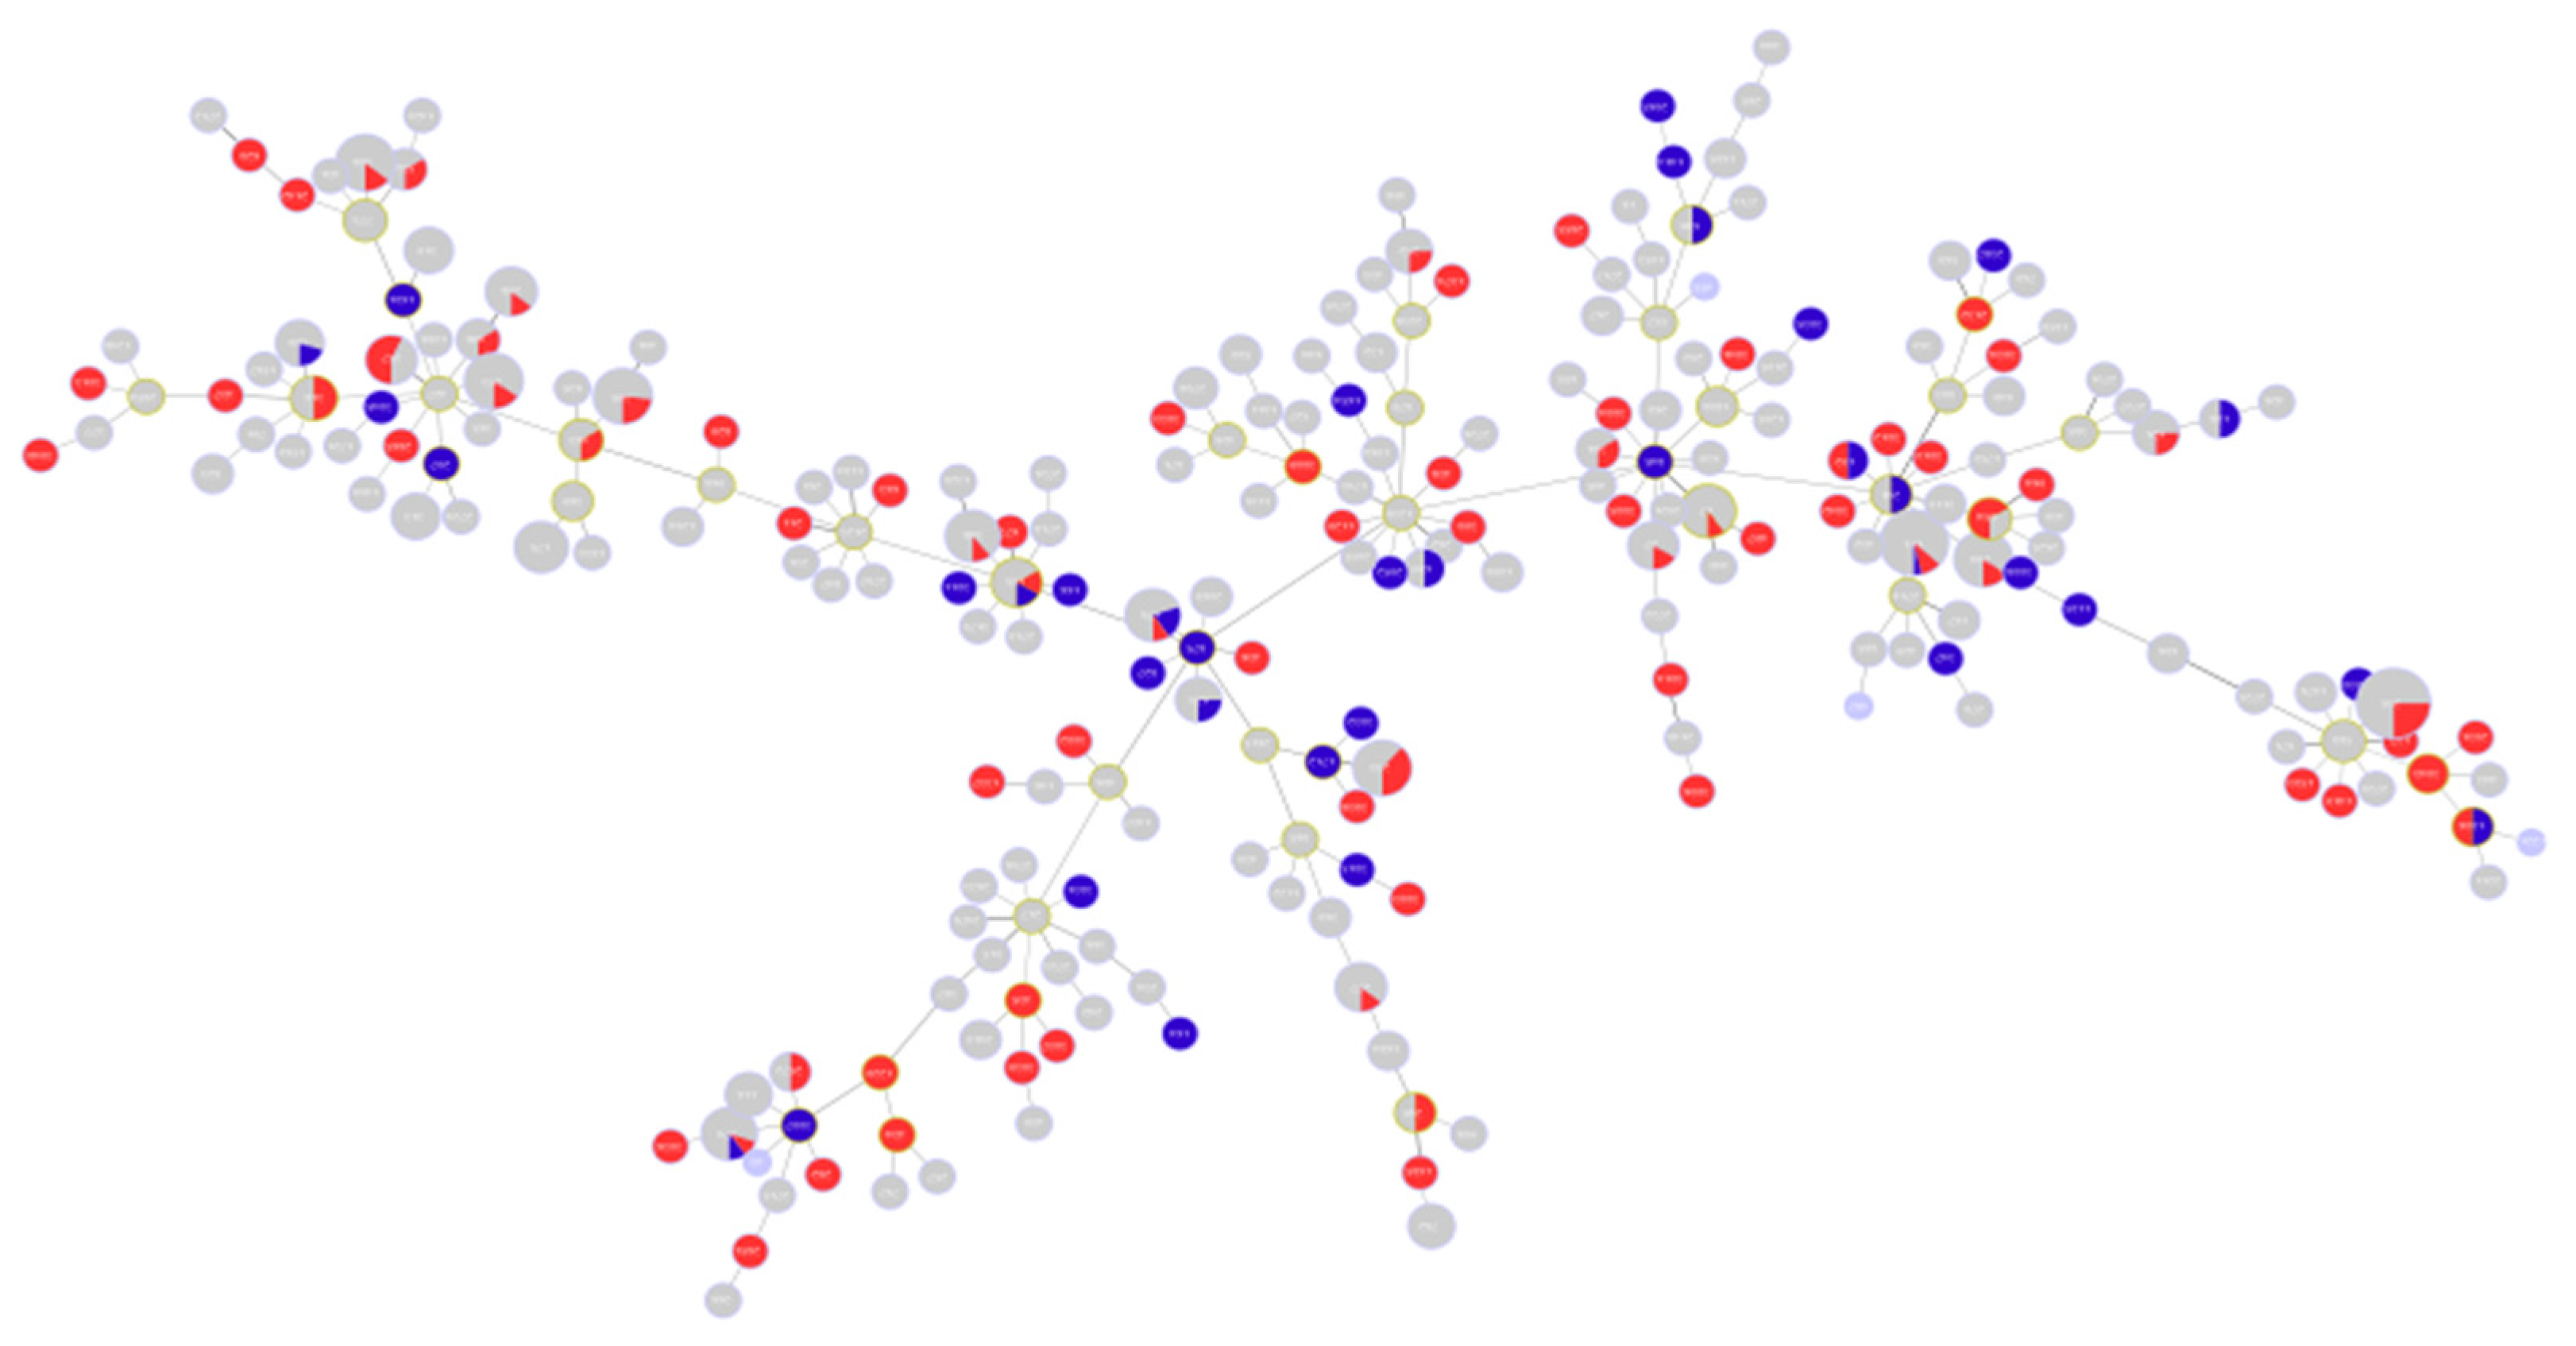
Figure 1.
Hierarchical clustering showing the distribution of analyzed sequences among all known Sequence Types STs. Blue circles indicate the position of the studied sequences among all other P. aeruginosa sequences. The positions of high-risk clones are also shown on the figure using different colors.

Figure 2.
Each serotype is shown in a different color as indicated in the ligand. The figure shows how different serotypes are clustered in relation to different clonal complexes. High-risk clones are shown in red circles.
Figure 2.
Each serotype is shown in a different color as indicated in the ligand. The figure shows how different serotypes are clustered in relation to different clonal complexes. High-risk clones are shown in red circles.

Figure 3.
Minimum spanning tree (MST) diagram showing distribution of levofloxacin susceptibility in relation to different STs. Red color: levofloxacin-resistant (n = 338); blue color: levofloxacin-susceptible (n = 190).
Figure 3.
Minimum spanning tree (MST) diagram showing distribution of levofloxacin susceptibility in relation to different STs. Red color: levofloxacin-resistant (n = 338); blue color: levofloxacin-susceptible (n = 190).

Figure 4.
Summary diagram showing levofloxacin-related molecular markers. The figure summarizes markers showing significant presence in high-risk clones (A) and those showing significant absence in relation to high-risk clones (B).
Figure 4.
Summary diagram showing levofloxacin-related molecular markers. The figure summarizes markers showing significant presence in high-risk clones (A) and those showing significant absence in relation to high-risk clones (B).

Figure 5.
MST diagram showing distribution of ciprofloxacin susceptibility in relation to different STs. Red color: ciprofloxacin-resistant (n = 105); blue color: ciprofloxacin-susceptible (n = 37); grey color: unknown susceptibility to ciprofloxacin.
Figure 5.
MST diagram showing distribution of ciprofloxacin susceptibility in relation to different STs. Red color: ciprofloxacin-resistant (n = 105); blue color: ciprofloxacin-susceptible (n = 37); grey color: unknown susceptibility to ciprofloxacin.

Figure 6.
MST diagram showing distribution of amikacin susceptibility in relation to different STs. Red color: amikacin resistant (n = 142); blue color: amikacin susceptible (n = 386).
Figure 6.
MST diagram showing distribution of amikacin susceptibility in relation to different STs. Red color: amikacin resistant (n = 142); blue color: amikacin susceptible (n = 386).

Figure 7.
Summary diagram showing amikacin-related molecular markers. The figure summarizes markers showing significant presence in high-risk clones (A) and those showing significant absence in relation to high-risk clones (B).
Figure 7.
Summary diagram showing amikacin-related molecular markers. The figure summarizes markers showing significant presence in high-risk clones (A) and those showing significant absence in relation to high-risk clones (B).

Figure 8.
MST diagram showing distribution of gentamycin susceptibility in relation to different STs. Red color: gentamycin resistant (n = 57); blue color: gentamycin susceptible (n = 82); grey color: unknown susceptibility to gentamycin.
Figure 8.
MST diagram showing distribution of gentamycin susceptibility in relation to different STs. Red color: gentamycin resistant (n = 57); blue color: gentamycin susceptible (n = 82); grey color: unknown susceptibility to gentamycin.

Figure 9.
A graphical summary showing the role of different genes within the cell.


Table 1.
Summary of sequences belonging to high-risk clones with their corresponding quinolone and aminoglycoside susceptibility.
Table 1.
Summary of sequences belonging to high-risk clones with their corresponding quinolone and aminoglycoside susceptibility.
| High-risk clone | Number of sequences | Ciprofloxacin-resistant | Ciprofloxacin-susceptible | Unrecorded ciprofloxacin-susceptibility | Levofloxacin-resistant | Levofloxacin-susceptible | Gentamycin-resistant | Gentamycin-susceptible | Unrecorded gentamycin-susceptibility | Amikacin-resistant | Amikacin-susceptible |
| ST235 | 50 | 13 | - | 37 | 46 | 4 | 3 | 10 | 37 | 23 | 27 |
| ST111 | 30 | 3 | 1 | 26 | 28 | 2 | 3 | 1 | 26 | 14 | 16 |
| ST244 | 13 | 2 | - | 11 | 10 | 3 | 2 | - | 11 | 6 | 7 |
| ST395 | 13 | 3 | - | 10 | 5 | 8 | 2 | 1 | 10 | 1 | 12 |
| ST175 | 8 | - | - | 8 | 8 | - | - | - | 8 | - | 8 |
| ST17 | 10 | 1 | - | 9 | 6 | 4 | - | 1 | 9 | 2 | 8 |
| ST274 | 10 | 1 | 1 | 8 | 5 | 5 | 1 | 1 | 8 | 1 | 9 |
(-) sign refers to (No sequences) in the category specified.
Table 2.
Levofloxacin molecular markers showing significant association with specific high-risk clones.
Table 2.
Levofloxacin molecular markers showing significant association with specific high-risk clones.
| Molecular Marker | High-Risk Clone | Chi-Square | p-Value | Phi Coefficient |
|---|---|---|---|---|
| mexSSer124Arg | ST235 | 39.6 | <0.005 | 0.274 |
| mexSSer124Arg | ST395 | 14.06 | <0.005 | 0.163 |
| nalD | ST395 | 3.97 | 0.046 | 0.274 |
| nalCG71E | ST395 | 5.7 | 0.017 | 0.103 |
| nalCA186T | ST233 | 147.6 | <0.005 | 0.529 |
| nalCS46A | ST235 | 3.06 | 0.08 | 0.076 |
| nalCS46A | ST244, ST253 | 4.44 | 0.035 | 0.092 |
| nalCE153Q | ST235 | 71.06 | <0.005 | 0.367 |
| nalID153Q | ST235 | 20.7 | <0.005 | 0.198 |
| parCS87W | ST274 | 7.9 | 0.005 | 0.122 |
| parCS87L | ST111 | 17.09 | <0.005 | 0.18 |
| parCS87L | ST233 | 32.3 | <0.005 | 0.248 |
| parCS87L | ST235 | 49 | <0.005 | 0.306 |
| parCS87L | ST244 | 9.5 | 0.005 | 0.135 |
| parCS87L | ST308 | 16.6 | <0.005 | 0.178 |
| gyrAT83I | ST111 | 25.7 | <0.005 | 0.22 |
| gyrAT83I | ST233 | 20.1 | <0.005 | 0.195 |
| gyrAT83I | ST235 | 35.42 | <0.005 | 0.259 |
| gyrAT83I | ST244 | 4.5 | 0.035 | 0.092 |
| gyrAT83I | ST308 | 12.7 | <0.005 | 0.155 |
| gyrAD87N | ST395 | 7.13 | 0.008 | 0.116 |
| ampRG283E | ST235 | 49.85 | <0.005 | 0.307 |
| ampRG283E | ST308 | 9.78 | 0.002 | 0.136 |
| ampRM288R | ST235 | 82.776 | <0.005 | 0.396 |
| ampRM288R | ST308 | 18.658 | <0.005 | 0.188 |
Table 3.
Amikacin molecular markers showing significant associations with specific high-risk clones.
Table 3.
Amikacin molecular markers showing significant associations with specific high-risk clones.
| Molecular Marker | High-Risk Clone | Chi-Square | p-Value | Phi Coefficient |
|---|---|---|---|---|
| phoQY85F | ST235 | 400.38 | <0.005 | 0.871 |
| nuoGA890T | ST395 | 455.82 | <0.005 | 0.929 |
| pstBE89Q | ST233 | 338.5 | <0.005 | 0.801 |
| arnAA170T | ST233 | 292.64 | <0.005 | 0.744 |
| arnDG206C | ST233 | 292.64 | <0.005 | 0.744 |
| gidBE186A | ST235 | 493.946 | <0.005 | 0.967 |
| lptAR62S | ST446 | 85.48 | <0.005 | 0.402 |
| faoAT385A | ST244 | 121.92 | <0.005 | 0.481 |
| pmrBGly423Cys | ST111 | 22.492 | <0.005 | 0.206 |
| pmrBGly423Cys | ST235 | 28.103 | <0.005 | 0.231 |
| pmrBGly423Cys | ST253 | 14.338 | <0.005 | 0.165 |
| pmrBGly423Cys | ST308 | 12.493 | <0.005 | 0.154 |
| pmrALeu71Arg | ST17 | 29.38 | <0.005 | 0.236 |
| pmrALeu71Arg | ST233 | 30.868 | <0.005 | 0.242 |
| pmrALeu71Arg | ST253 | 24.145 | <0.005 | 0.214 |
| pmrALeu71Arg | ST308 | 27.034 | <0.005 | 0.226 |
| pmrALeu71Arg | ST175 | 23.414 | <0.005 | 0.211 |
| pmrALeu71Arg | ST179 | 29.38 | <0.005 | 0.236 |
| pmrALeu71Arg | ST532 | 8.696 | 0.003 | 0.128 |
Table 4.
Gentamycin molecular markers showing significant associations with specific high-risk clones.
Table 4.
Gentamycin molecular markers showing significant associations with specific high-risk clones.
| Molecular Marker | High-Risk Clone | Chi-Square | p-Value | Phi Coefficient |
|---|---|---|---|---|
| nalDSer32Asn | ST235 | 3.955 | 0.047 | 0.169 |
| nalCE153Q | ST235 | 98.99 | <0.005 | 0.844 |
| pmrALeu71Arg | ST308 | 5.594 | 0.018 | 0.201 |
| pmrALeu71Arg | ST233 | 14.298 | <0.005 | 0.321 |
| pmrALeu71Arg | ST179 | 8.453 | 0.004 | 0.247 |
| pstBE89Q | ST233 | 84.93 | <0.005 | 0.782 |
| arnA A170T | ST233 | 74.917 | <0.005 | 0.734 |
| arnDG206C | ST233 | 84.93 | <0.005 | 0.782 |
| gidBE97Q | ST235 | 139 | <0.005 | 1 |
| gidBE186A | ST235 | 139 | <0.005 | 1 |
Table 5.
Markers tested for their correlation with high-risk clones.
| Molecular Markers Previously Identified in Relation to Antibiotic Resistance | Newly Identified Molecular Markers |
|---|---|
| mexZ nalCS46A nalCS209R nalCG71E gyrAT83I gyrAD87N parCS87W parCS87L nalCE153Q nalCThr50pro mexS gene mexSA175V mexSE181D nalD gene nfxB armR parEV460G ampRD135N nalC ampR pmrBGly423Cys pmrALeu71Arg nalDser32Asn ampRA51T ampRG283E ampRM288R | phoQY85F nuoGA890T pstBE89Q lptAT55A lptAR62S faoAT385A arnAA170T arnDG206C mexRR79N mexRE70R mexRL130T mexRG97L mexRL29D fusA1D588G gidBE186A gidBQ28K gidBE97Q |
Publisher’s Note: MDPI stays neutral with regard to jurisdictional claims in published maps and institutional affiliations. |
© 2021 by the authors. Licensee MDPI, Basel, Switzerland. This article is an open access article distributed under the terms and conditions of the Creative Commons Attribution (CC BY) license (http://creativecommons.org/licenses/by/4.0/).
Share and Cite
MDPI and ACS Style
Nageeb, W.; Amin, D.H.; Mohammedsaleh, Z.M.; Makharita, R.R. Novel Molecular Markers Linked to Pseudomonas aeruginosa Epidemic High-Risk Clones. Antibiotics 2021, 10, 35. https://doi.org/10.3390/antibiotics10010035
AMA Style
Nageeb W, Amin DH, Mohammedsaleh ZM, Makharita RR. Novel Molecular Markers Linked to Pseudomonas aeruginosa Epidemic High-Risk Clones. Antibiotics. 2021; 10(1):35. https://doi.org/10.3390/antibiotics10010035
Chicago/Turabian StyleNageeb, Wedad, Dina H. Amin, Zuhair M. Mohammedsaleh, and Rabab R. Makharita. 2021. "Novel Molecular Markers Linked to Pseudomonas aeruginosa Epidemic High-Risk Clones" Antibiotics 10, no. 1: 35. https://doi.org/10.3390/antibiotics10010035
Note that from the first issue of 2016, this journal uses article numbers instead of page numbers. See further details here.