
An Exploratory Study of the Development and Pilot Testing of an Interactive Visual Tool of Neuropsychological Test Results in Memory Clinics
Abstract
Background:
Neuropsychological feedback is an important part of the neuropsychological assessment process. However, patients have difficulties remembering this information.
Objective:
The aim of this study was to develop a web-based visual tool to improve the understanding of neuropsychological results, information retention, and psychologist-patient communication.
Methods:
The visual tool was developed and optimized using an iterative three-phase stepwise approach to determine its usability, technology acceptance, and feasibility in a memory clinic population. Feedback from different user perspectives (patients, family members, and psychologists) was obtained in each phase using a multimethod approach (e.g. a multidisciplinary brainstorm session, think-aloud sessions, focus groups). The prototype was subsequently tested in a pilot study.
Results:
The first phases offered insights that led to optimization of the prototype. On a scale ranging from 0 to 100, psychologists evaluated the usability as high [88.1±7.6,70–87]. During the pilot study, both patients and significant others gave positive feedback, but information retention in patients remained low. All participants thought the benefits of the visual tool included seeing cognitive strengths and weaknesses with a translation to daily life all at one glance and receiving feedback on paper to take home. Important barriers were mentioned by psychologists, such as a limited set of tests included and no integration with hospital systems.
Conclusion:
Overall, patients, family members, and psychologists reported that a visual display of the cognitive profile with insights into daily life had added value to clinical practice. Feedback from the pilot study was adopted in the tool for future implementation purposes.
INTRODUCTION
A dementia diagnosis has a huge impact on patients and their significant others. Understanding the consequences of this diagnosis may, however, enable them to make positive adjustments and cope with the experienced loss [1–3]. Therefore, accurate and clear communication during the diagnostic process and disclosure are required. A common assessment tool in supporting the diagnosis of dementia is a neuropsychological assessment. A recent systematic review showed the added value of a neuropsychological assessment in improving the accuracy of diagnosis, predicting patient outcomes, and increasing referrer satisfaction [4]. The majority of patients also perceived the assessment as helpful [4].
Neuropsychological feedback is an important co-mponent of a neuropsychological assessment, which offers the opportunity to discuss cognitive strengths and weaknesses and provides recommendations for daily life functioning [5, 6]. Furthermore, neuropsychological feedback increases a patient’s quality of life, understanding of a disease, and coping abilities [7]. Previous studies showed that patients were more satisfied with a neuropsychological assessment when they received such feedback and that they perceived this feedback as useful [8–11]. However, a standardized approach in communication techniques for providing feedback is lacking [12]. Giving feedback may be challenging due to the complex nature of neuropsychological test results [5, 6]. In addition, information retention of medical information is low in general [13–15]. Written information is more easily remembered compared to verbal information, and the former was found to improve treatment adherence and enhance free recall of neuropsychological recommendations [13, 16, 17]. However, neuropsychological reports sometimes face challenges related to readability and complexity for laypersons. Understanding written reports and remembering neuropsychological feedback might be even more challenging for people with cognitive impairments or low literacy [18]. Adapting these reports is often necessary to make findings more understandable for patients and family [19].
In other medical fields it has been shown that visual aids enhance the recall of spoken medical instructions [20, 21]. Visual aids also improved the understanding of medical instructions, especially when a combination of visual, written, and verbal instructions was used [22]. To our knowledge, no studies have explored the use of visual aids in providing neuropsychological feedback. A patient-friendly tool to visualize neuropsychological test performances could enable professionals to deliver patient-tailored information and may improve understanding of cognitive strengths and weaknesses and patient satisfaction.
The aim of this study was to develop a web-based visual tool for neuropsychological test results to increase the understanding of neuropsychological performances, to improve information retention, and to support communication during feedback sessions. The second aim of this study was to determine the usability, technology acceptance, and feasibility of the tool.
METHODS
Iterative development process
An iterative process was used to develop the web- based interactive visual tool during the “Innovations in NeuroPsychological assessment in the timely Diagnosis of Dementia” (INPAD) project. The visual tool was co-created with patients, family members, and neuropsychology experts using a stepwise approach including three consecutive phases spread over a 3-year time period (2017–2020) (Fig. 1). All sessions in each phase were audiotaped and analyzed by summarizing and grouping the feedback.
Fig. 1
Overview of the iterative development process of the visual tool.
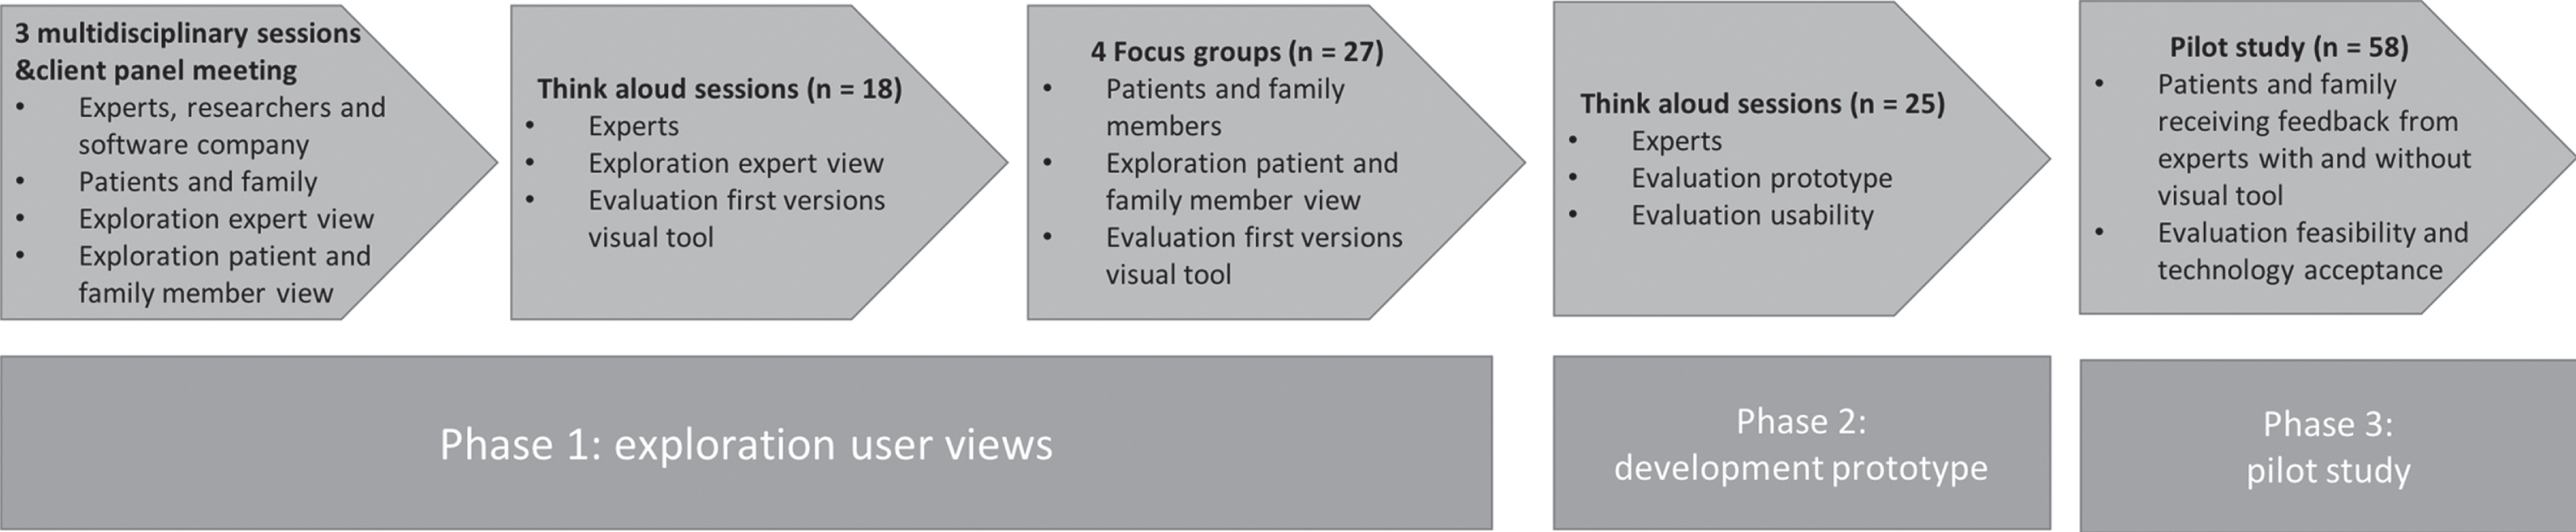
Phase 1: Exploration potential user views
Methods and participants
During the first phase, the content and design of the visual tool was developed using an iterative approach during which adaptions were made to concept versions of the visual tool based on the feedback collected. The following steps were carried out:
• Three multidisciplinary brainstorming sessions of 1.5 hours with different disciplines (researchers, neuropsychologists, software developers, interaction designer) to decide which cognitive tests to include and what visualization should be used.
• Meeting between the researchers of the INPAD project and client panel members (patients with dementia, informal caregivers) from the Alzheimer Center Limburg to inquire what type of visualization should be used.
• Showing concept versions of the visual tool using the think-aloud method [23] in neuropsychology experts (n = 18) working at memory clinics across twelve Dutch hospitals. These potential users were asked to think out loud while inspecting the different versions of both the patient and clinician modules. They were asked to rank the versions according to their preference.
• Showing concept versions of the visual tool during four focus group sessions with fourteen patients and thirteen family members across three Dutch MCs. Characteristics of patients and family members are represented in Table 1. Participants were asked to participate if they were referred to the memory clinic for the evaluation of cognitive complaints and if they had had a neuropsychological assessment in the past year. More information about this procedure is described elsewhere [24]. The participants were asked for their opinions regarding these concept versions and to rank the versions according to their preference.
Table 1
Characteristics of patients (n = 14) and family members (n = 13)
| Focus group participants | ||
| (n = 27) | ||
| Patients | Family members | |
| (n = 14) | (n = 13) | |
| Age (mean±SD | 66.1±7.9 | 62.9±15.1 |
| [min-max]) | [49–76] | [30–82] |
| Women n (%) | 5 (36%) | 8 (62%) |
| Diagnosis MC visitor | ||
| NCI | 6 (43%) | 5 (39%) |
| MCI | 3 (21%) | 4 (30%) |
| AD dementia | 3 (21%) | 2 (15%) |
| CBS | 1 (7.5%) | 1 (8%) |
| FTD | 1 (7.5%) | 1 (8%) |
| Relationship to MC visitor | ||
| Spouse | 11 (85%) | |
| Child | 2 (15%) | |
Demographics are represented in n (%) unless stated otherwise. SD, standard deviation; NCI, no cognitive impairment; MCI, mild cognitive impairment; AD, Alzheimer’s disease; CBS, corticobasal syndrome; FTD, frontotemporal dementia.
Results
Following the exploration of potential user views, a consensus was reached on a visual tool with two modules (separate modules for psychologists and patients/family members) and on the cognitive tests to be included (Concept Shifting Test [25], Trail Making Test [26], Letter Digit Substitution Test [27], Stroop Color-Word Test [28], Digit Span from the Wechsler Adult Intelligence Scale IV-NL [29], category fluency [30], Auditory Verbal Learning Test [31], and Visual Association Test [32]). In the prototype, the standardized age and education adjusted scores would be implemented based on the available extensive normative data for the Dutch versions of the commonly used tests in Dutch MCs [33]. The module for the psychologist should improve the diagnostic workflow and should contain detailed information regarding neuropsychological results. Psychologists preferred the incorporation of a reliable change index [34, 35]. The module for the patient should be easy to read and include recommendations for daily life functioning. Patients expressed a need for more information on how to deal with their deficits. Feedback was given on the content (e.g., missing cognitive tests, questionnaires and observations, missing “language” as relevant cognitive domain, descriptions of daily life consequences too brief) and design (e.g., larger font size, different colors, and better contrasts). A line graph was preferred by all users, as this was easiest to interpret.
Phase 2: Development of prototype
Methods and participants
The web-based prototype was developed using all feedback from the first phase. Implemented in the prototype of the tool was the automatic transformation of raw scores into age and education adjusted standard scores [33], as well as the computation of reliable change indices according to Jacobson and Truax [34] or Chelune et al. [35]. The cognitive test battery was adapted to the recently published monodisciplinary guideline for neuropsychological assessment in the diagnostic work up for mild cognitive impairment and dementia [36]. The usability of the prototype was evaluated by the same neuropsychological experts (n = 18) who participated in phase 1. Additional experts working at seven different institutions were recruited to maximize variation (total n = 25). The think-aloud procedure was repeated, but this time, experts had to fill in raw test results from a dummy patient into the web-based prototype. They also completed a survey about the design of the tool with eleven items scored on a 7-point Likert scale (1 = totally disagree, 7 = totally agree). Experts were also asked to list three positive and negative aspects of the tool. Usability was evaluated using the System Usability Scale (SUS), which consists of ten items scored on a 5-point Likert scale (1 = strongly disagree, 5 = strongly agree) with a maximum score of 100. This scale has been shown to have good psychometric properties [37, 38].
Results
Overall, the experts were satisfied with the adaptations in the tool (e.g., more detailed description of daily life implications, easy data entry). Some additional remarks to optimize usability were given (e.g., the need for more specific fields for observations during the neuropsychological assessment, clearer warnings for data entry, choice in type of standard scores). On the survey, experts reported being very satisfied with the design (6.1 ± 0.8, range: 5–7), and the usability was rated as excellent (88.1 ± 7.6, range: 70–87) [39]. The most commonly listed positive aspects were user-friendliness, clear information to give to patients, and opportunity to improve harmonization between MCs. The most frequently mentioned negative aspects were the lack of other commonly used tests, and fonts being too small.
Phase 3: Pilot study of feasibility and technology acceptance
Methods
All feedback from phase 2 was implemented, resulting in an optimized prototype of the visual tool (Figs. 2 and 3). An essential adaptation consisted of extending the section on everyday life implications. Here, psychologists could select implications of the neuropsychological assessment results for the patient’s daily life and provide corresponding tips per cognitive domain (e.g., ‘you can switch your attention very well when doing multiple things’, ‘learning new information costs a lot of effort’, ‘writing things down could help you to remember to do the things you have planned’, ‘try and use pictures as a memory aid’). Next to standard sentences, psychologists could add their own interpretations to individualize these recommendations. This prototype was subsequently used in the pilot evaluation in which two groups were compared (one receiving neuropsychological feedback without the tool and one with the visual tool) in three hospital-based centers in the Netherlands (Maastricht UMC+, Catharina Hospital Eindhoven, Radboudumc Nijmegen) to ascertain diversity in diagnostic disclosure procedures.
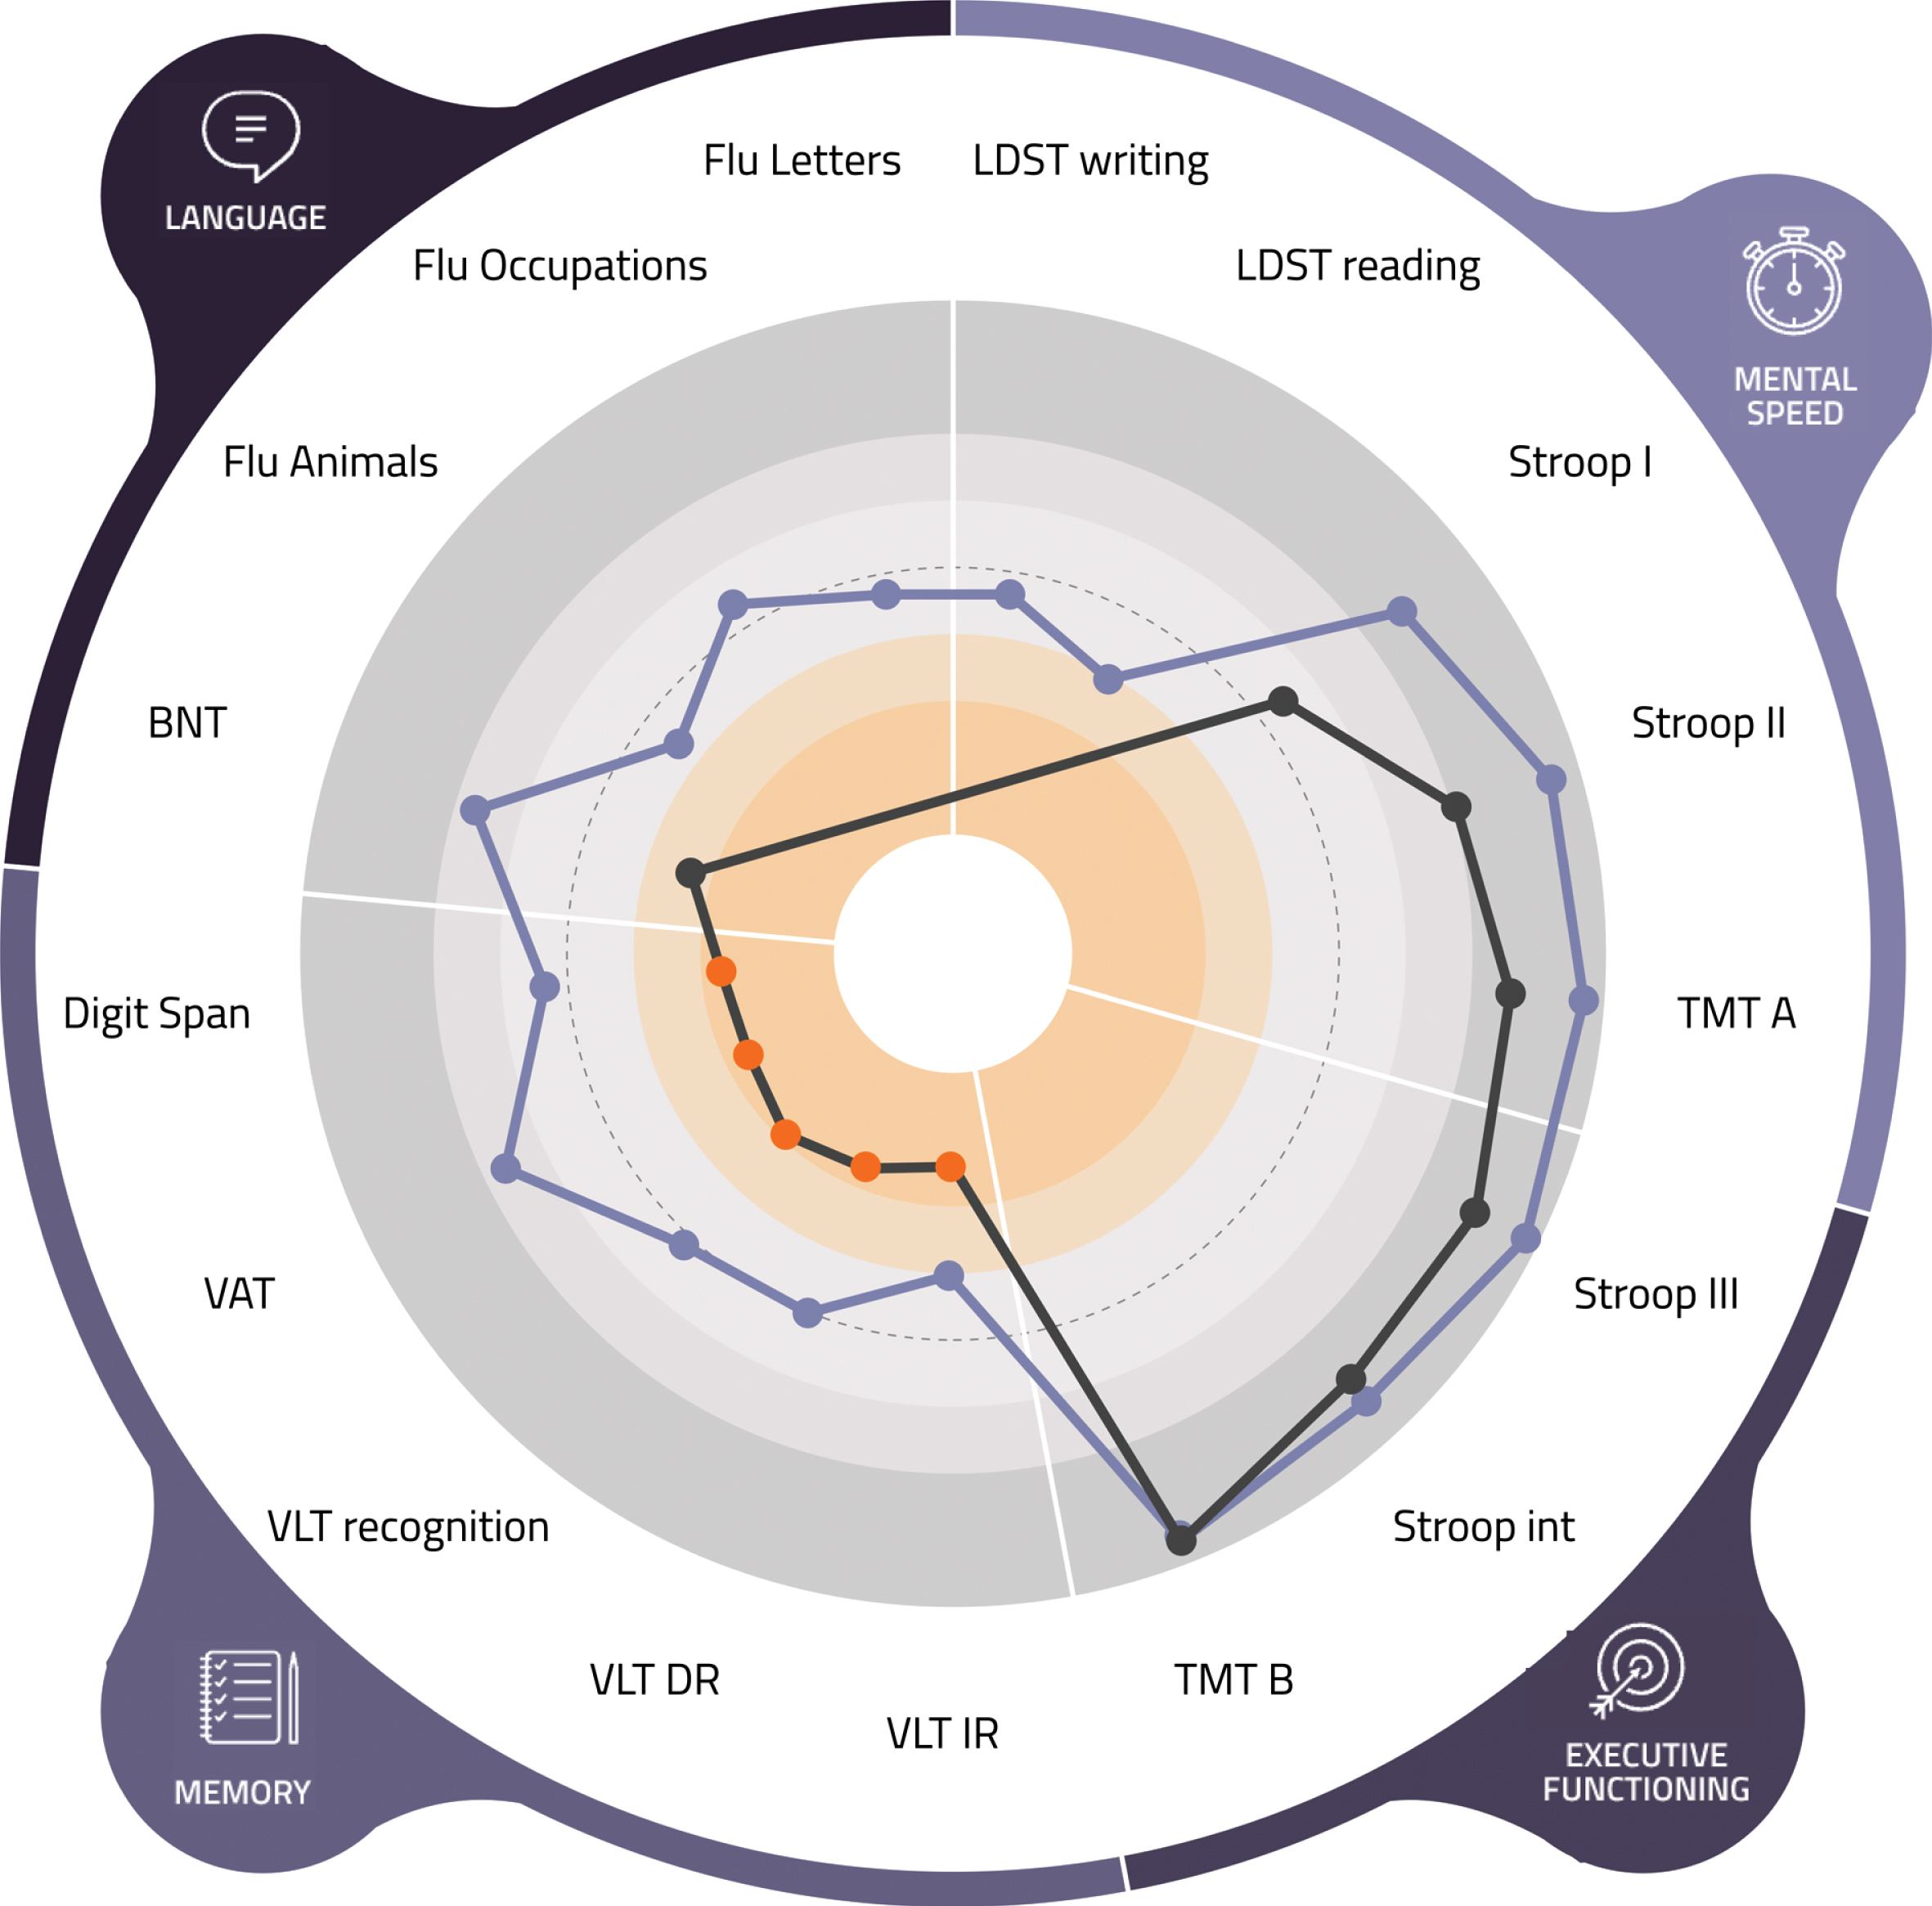
Fig. 2
Patient view (of a fictional patient) of the visual tool. This figure shows the results of the most recent assessment on the domains of mental speed, complex attention, memory, and language. Each dot in the bar above the cognitive domains represents the score on a subtest. An orange dot indicates a performance lower than minus 2 standard deviations. Below the figure the translation to daily life functioning can be found.

Fig. 3
Psychologist view (of a fictional patient) of the visual tool. LDST, Letter Digit Substitution Test; TMT, Trail Making Test; int, interference; VLT, Verbal Learning Test; VAT, Visual Association Test; BNT, Boston Naming Test; Flu, Fluency.
Pilot study participants
In each of three centers, ten patients from the memory clinic (with a family member, if available) were recruited (30 dyads). Patients were recruited when they were referred for a neuropsychological assessment. Patients were excluded if they had a Mini-Mental State Exam score <20, impaired vision (i.e., would not be able to perceive the visual tool), an intellectual disability (Full Scale IQ ≤70), or a history of (<12 months) or current treatment for psychiatric disorders (e.g., major depressive disorder, bipolar disorder, psychotic disorder). Between February and December 2019, 37 patients and 35 family members were recruited for this pilot study. During the intake with the psychologist, patients, and family members received written information about the study. Two weeks before the consultation with the psychologist, they were contacted by phone to inquire if they wanted to participate. Four patients and two family members did not want to participate, and three patients were excluded. In total, 30 patients and 28 family members participated in the study. One dyad participated in the study but did not return the surveys, despite several reminders by phone. Furthermore, the eight psychologists who used the visual tool participated in the pilot study.
Procedures
During the pilot study, patients (n = 15) and family members (n = 15) received individual neuropsychological feedback without the visual tool. Feedback given by the psychologists was not standardized but could include use of white boards or highlighting results on test scoring sheets. Next, the visual tool was implemented in the participating centers and used by the psychologists during individual feedback sessions with patients (n = 15) and family members (n = 13). After the feedback session, patients and family members of both groups completed several questionnaires. Furthermore, in both groups, six dyads (patient –family members) were randomly selected for in-depth interviews. A semi-structured guide was used with questions about their experience with the consultation and, if applicable, the visual tool. The psychologists also completed a questionnaire after each consultation and participated in an in-depth interview using a semi-structured guide with questions about the experience with the visual tool during neuropsychological feedback.
Questionnaire for the patients and family members
To assess whether patients and their family mem-bers understood the explained findings of the neuropsychological assessment, three items (“I understand my neuropsychological assessment results”, “The explanation gave insight into cognitive weaknesses”, “The explanation gave insight into cognitive strengths”) were constructed by the authors. Items could be scored on a 5-point Likert scale (1 = fully disagree, 5 = fully agree). To evaluate the interaction between participants and psychologists, questions from the Patient Provider Interaction questionnaire [40] were adapted and translated into Dutch. Items were scored on a 4-point Likert scale (1 = no, 2 = possibly no, 3 = possibly yes, 4 = yes). The total score ranged from 0 to 52. Several other questionnaires were also administered after they were translated into Dutch. First, the Patient Satisfaction Questionnaire (PSQ) was used to measure the satisfaction following the consultation using a visual analogue scale ranging from 0 (not satisfied at all) to 100 (extremely satisfied) [41]. The Patient-Doctor Relationship Questionnaire (PDRQ-9) evaluated the perceived relationship (e.g., helpfulness, trustworthiness, understanding) with the psychologist [42], and items could be scored on a 5-point Likert scale (1 = not at all appropriate, 5 = totally appropriate). The total score ranged from 0 to 45. The participants who received feedback with the visual tool were asked additional questions regarding the added value (“The graph made me understand the information better”, “The graph made it easier to follow the consultation”, “The graph gave me more insight into the cognitive complaints”, “Receiving the graph to take home had added value”), layout, and application of the visual tool (e.g., whether or not they inspected it at home or discussed it with others). These items were constructed by the authors and could be scored on a 5-point Likert scale (1 = totally disagree, 5 = totally agree).
Questionnaire for the psychologists
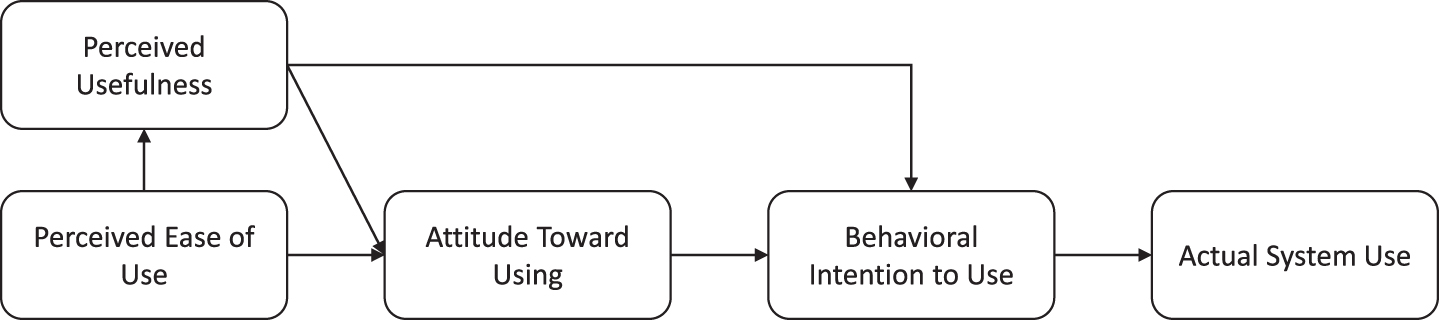
To investigate the level of acceptance, the psychologists completed the Technology Acceptance Model questionnaire [43]. The questions addressed the following domains: perceived usefulness, perceived ease of use, intention to use, and attitude toward using the technology. The higher the scores on these domains, the more likely someone is to use the technology in question (Fig. 4) [43]. Additional questions on feasibility and satisfaction with the visual tool were constructed by the authors. All items (technology acceptance, feasibility, and satisfaction) were scored on a 7-point Likert scale (1 = totally disagree, 7 = totally agree).
Fig. 4
Relation between domains of Technology Acceptance Model and actual system use.
Data analysis
Statistical analyses were conducted using version 24 of the Statistical Package for Social Sciences (SPSS). To examine group differences between the groups (with versus without visual tool), χ2-tests or independent samples t-tests were conducted. Furthermore, descriptive statistics were reported. All interviews were transcribed verbatim and analyzed independently by two raters using ATLAS.ti version 8.4.4. One of the authors was not involved in previous phases of the INPAD study and became involved at a later stage to ascertain an independent view when conducting the analysis. First, an inductive approach was applied by adding open codes in the transcript. Then, themes were based on both the open codes and the semi-structured guide: expectations, experiences during the consultation, facilitators and barriers in remembering the information, and adjustment after the consultation. The categories and codes were discussed with two other authors to improve credibility [44]. To gain insight into differences between the centers, the interviews were analyzed separately. The quotes used in the results section were selected and translated from Dutch into English.
RESULTS
Results among patients and family members
Background characteristics
Table 2 describes the characteristics of 30 patients and 28 family members. The majority of family members were spouses and had daily contact with the patient. No significant differences regarding age, sex, and education were found between participants in the group with and without the tool.
Table 2
Characteristics of patients (n = 30) and family members (n = 28)
| Without visual tool (n = 30) | With visual tool (n = 28) | |||
| Patients | Family members | Patients | Family members | |
| (n = 15) | (n = 15) | (n = 15) | (n = 13) | |
| Age, y (mean±SD | 72.5±8.7 [49–85] | 67.2±12.2 [44–77] | 71.1±7.9 [59–88] | 65.3±13.3 [37–89] |
| [min-max]) | ||||
| Women | 6 (40%) | 11 (73%) | 6 (43%) | 9 (75%) |
| Education | ||||
| Low | 0 (0%) | 0 (0%) | 0 (0%) | 0 (0%) |
| Middle | 10 (67%) | 9 (60%) | 10 (71%) | 5 (42%) |
| High | 5 (33%) | 6 (40% | 4 (29%) | 7 (58%) |
| Diagnosis | ||||
| NCI | 6 (40%) | 7 (47%) | ||
| MCI | 6 (40%) | 6 (40%) | ||
| Dementia | 3 (20%) | 2 (13%) | ||
| Relationship to patient | ||||
| Spouse | 13 (87%) | 10 (83%) | ||
| Child | 2 (13%) | 2 (17%) | ||
| Contact with patient | ||||
| Daily | 13 (87%) | 10 (83%) | ||
| 4–6 times a week | 0 (0%) | 0 (0%) | ||
| 1–3 times a week | 2 (13%) | 2 (17%) | ||
| 1–3 times a month | 0 (0%) | 0 (0%) | ||
Demographics are represented in n (%) unless stated otherwise. SD, standard deviation; NCI, no cognitive impairment; MCI, mild cognitive impairment.
Expectations before the consultation
Both patients and family members with and without the visual tool expressed that they did not know what to expect from the consultation. This was present in two centers where patients received the diagnostic disclosure together with neuropsychological feedback. These patients were worried and experienced feelings of uncertainty. Furthermore, they were all focused on the question of whether they, or their family member, had dementia or not. In one center where neuropsychological feedback was given after two weeks, these feelings were not present.
“Those are all things you take along ... There is a signal in your head that is dormant, but present. Then I think, my God, what will be waiting for me if that is the case?” (patient with visual tool)
Experiences during the consultation
Overall, patients and family members in both groups were very positive regarding the consultation with the psychologist. They liked the psychologists’ tranquility, clear explanation, and attitude. They also appreciated the opportunity to ask all the questions they wanted, and they felt no time constraints. On the questionnaire, no significant differences were found between the groups concerning interaction, patient-psychologist relationship, and satisfaction with the consultation (Table 3).
Table 3
Comparison between groups without and with the visual tool concerning communication, satisfaction and patient-psychologist relationship
| Without visual tool | With visual tool | |||
| (n = 30) | (n = 28) | |||
| Patients | Family members | Patients | Family members | |
| (n = 15) | (n = 15) | (n = 15) | (n = 13) | |
| Communication | 46.7 ± 4.7 [23–43] | 49.9 ± 3.9 [39–52] | 47.6 ± 3.6 [41–52] | 49.8 ± 2.3 [44–52] |
| Satisfaction with | ||||
| Needs addressed | 80.7 ± 14.9 [60–100] | 83.3 ± 9.8 [70–100] | 74.3 ± 22.1 [20–100] | 80.0 ± 12.1 [50–100] |
| Patient’s involvement | 83.3 ± 12.9 [60–100] | 86.0 ± 9.9 [70–100] | 79.3 ± 23.0 [20–100] | 84.2 ± 10.0 [70–100] |
| Information given | 84.0 ± 12.4 [60–100] | 86.0 ± 11.8 [60–100] | 76.4 ± 22.4 [20–100] | 84.2 ± 9.9 [70–100] |
| Emotional support | 78.7 ± 24.8 [0–100] | 84.0 ± 11.8 [70–100] | 77.9 ± 19.7 [40–100] | 80.8 ± 14.4 [50–100] |
| Interaction in general | 85.33 ± 11.9 [70–100] | 86.7 ± 10.5 [70–100] | 81.4 ± 16.1 [50–100] | 84.2 ± 10.0 [70–100] |
| Overall satisfaction | 82.4 ± 11.1 [66–100] | 85.2 ± 9.3 [70–100] | 77.9 ± 19.6 [32–100] | 82.7 ± 9.9 [64–100] |
| Relationship | 39.7 ± 4.9 [32–45] | 38.7± 4.9 [32–45] | 37.9 ± 6.2 [27–45] | 39.3 ± 4.2 [33–45] |
All scores are represented as the mean ± SD [range]. The higher the score, the more patients or family members agreed. The communication scale ranged from 0 to 52, the satisfaction scales from 0 to 100 and the relationship scale from 0 to 45.
“I went home feeling relieved. Perhaps due to receiving attention for the first time. Those people know what they are doing. So many people do not understand it at all. You get the feeling that you are stupid.” (center 3, patient without visual tool)
Regardless of the visual tool, information retention was reported to be low, which was experienced more by patients than by family members. They often remembered the diagnosis (or only that it was not dementia) but forgot other details. In case of no dementia this was accompanied by feelings of relief; in case of a dementia diagnosis, this was a confirmation of their suspicions. Participants needed some time during the consultation to process the information about the diagnosis.
“It lets you know where this is coming from. This gives some peace of mind even though it is a disease that is not really nice. Then you know what caused it and that you are not going crazy.” (center 1, patient with visual tool)
Patients and family members especially perceived benefits due to receiving information and concrete recommendations about the implications of the neuropsychological assessment results for daily life. The group in which the visual tool was used, appreciated that they could take home the concrete tips on paper. In both groups, the consultation mainly focused on cognitive weaknesses, and participants would have liked to hear more about cognitive strengths as well.
Facilitators and barriers in remembering information
Over 60% of the patients and 80% of the family members in the group without the visual tool indicated that they would have liked to receive something on paper to take home and thought that a visual aid would have been helpful. During the interviews, they explained that receiving information on paper meant that they could read it at home at their own pace. When the visual tool was used, more than 90% of the patients and 80% of the family members liked that a graph was used and perceived the ability to take it home on paper as having added value. Both groups indicated that taking someone with you to the consultation facilitated information retention. Barriers in information retention were related to the emotions that accompanied receiving the diagnosis, cognitive impairment of the patient, and the setting of the consultation (e.g., when there were too many people present).
“Just put everything on paper. If you cannot recall it anymore you can check it again. If you then still do not recall it, you check it again. Paper is very patient.” (center 3, family member without visual tool)
“The psychologist drew a figure of the cognitive profile of my mother. And then I thought it wasn’t too bad ... A picture says more than a thousand words. Then you can see it visually.” (center 2, family member without visual tool)
Adjustment after the consultation
During the interviews, patients and family members from both groups mentioned that they discussed the results of the neuropsychological assessment within their social network. They also experienced that they were able to better cope with the cognitive complaints after the consultation (e.g., being more honest, more understanding toward the cognitive complaints). However, it remained difficult for some family members to adapt to the changed behaviors of the patient.
Opinion of visual tool
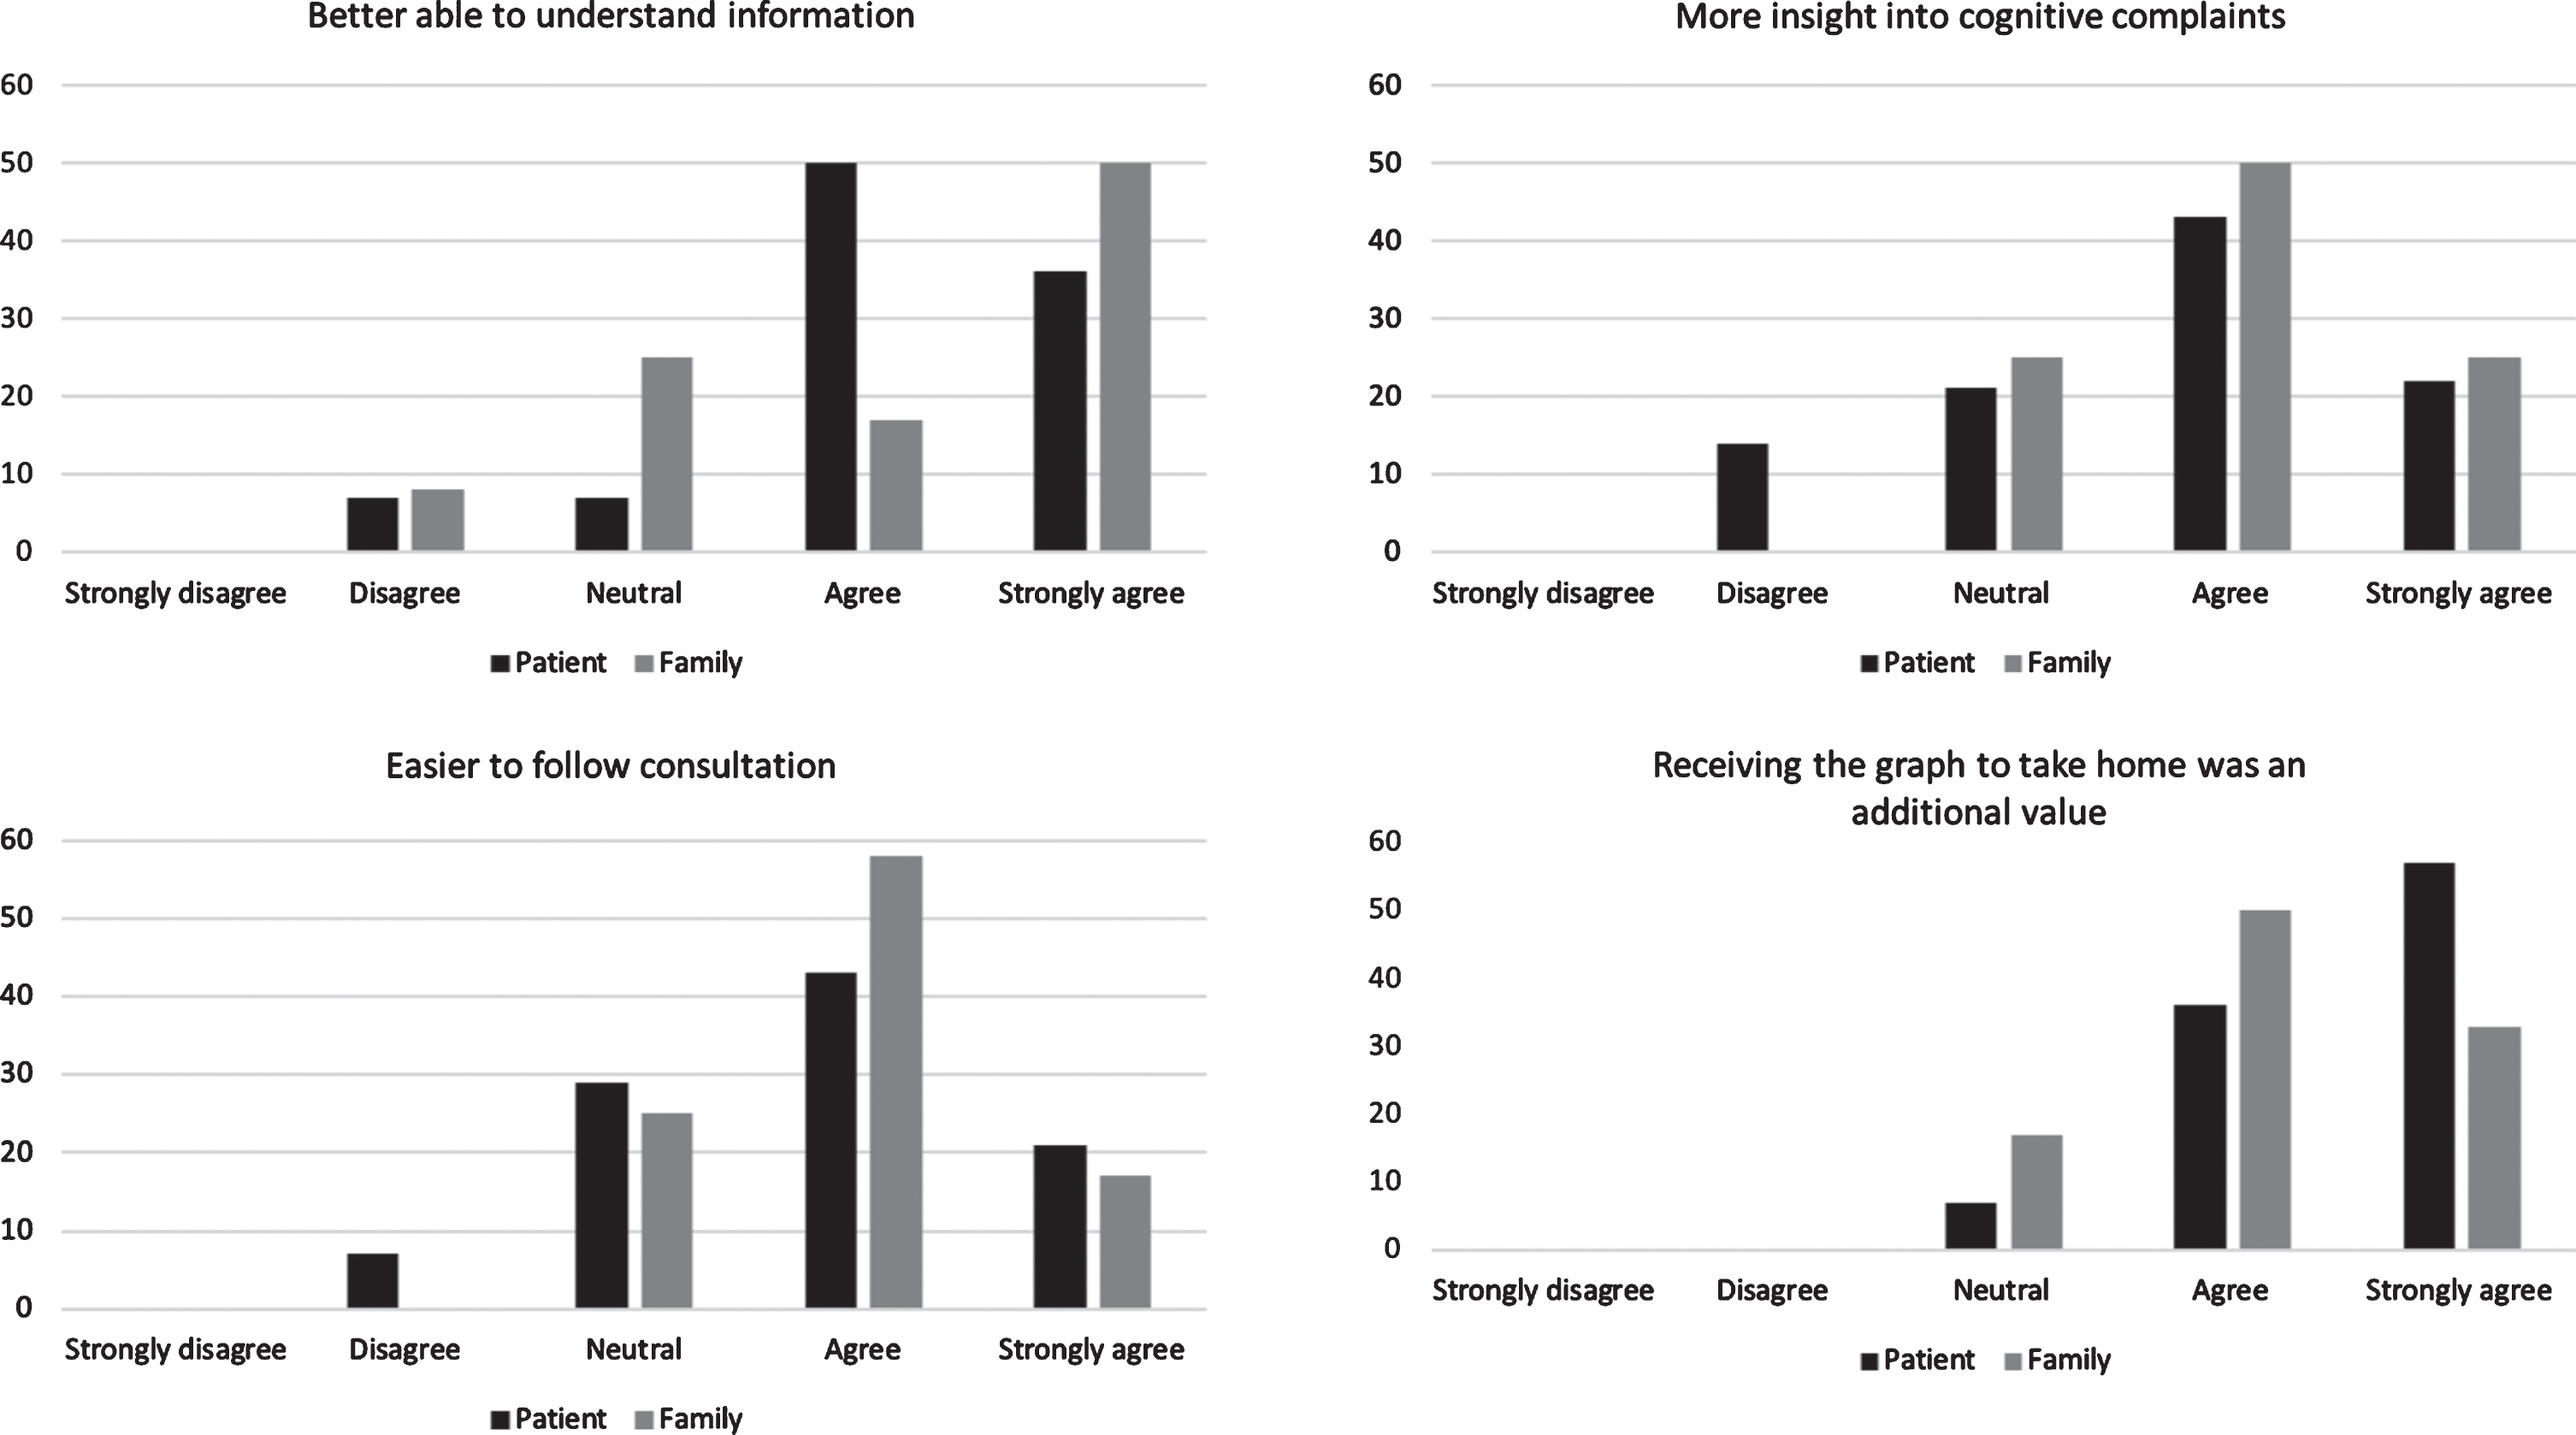
Patients and family members indicated that visual information was easier to understand and easier to remember compared to only receiving verbal information. One patient with dementia found the graph difficult to understand. Other aspects that added value included the ability to see their cognitive profile at one glance, the ability to receive implications of the neuropsychological assessment results for daily life, and an easier interpretation of their own performance by comparing it to a reference group. They also highly appreciated that they received something to take home (Fig. 5). Furthermore, they emphasized that the visual tool is only helpful when explained by psychologists during a face-to-face consultation.
Fig. 5
Level of agreement regarding the added value of the visual tool in patients (n = 15) and family members (n = 13).
Results among psychologists
Background characteristics
The work experience of the psychologists involved (n = 8) was on average (mean±SD) 14.3±6.6 years [range: 2.5–22]. Seven psychologists followed basic or advanced post-master’s professional clinical training, and one psychologist was still in training for a clinical license.
Added value of visual tool
In line with the patients and family members, psychologists reported seeing the cognitive strengths and weaknesses at one glance and giving something to take home as advantages of the visual tool. Having the reliable change index implemented in the tool was also considered a benefit. The psychologists argued that using multiple modalities (auditory, written, and visual) might lead to a better understanding and retention of the information. The visual tool was evaluated as user-friendly and easy to use. Furthermore, some psychologists considered the visual tool as a way to standardize neuropsychological feedback sessions across psychologists.
“I think we say a lot to patients who sometimes only remember if they have dementia or not. By making it visual you can take them by the hand, and I think they will remember it much better ... It really helps because you when you explain this in words, that makes it easily gets more complicated. To keep the language simple, a visual aid is very supportive.” (psychologist 8)
“I think the added value is that you can see the profile of strengths and weakness in one image. With repeated measurements you can also see it at one glance, what went better and what takes more effort. You have to use less words to explain this, and the words you use are supported by the visual tool.” (psychologist 2)
Changes in the consultation
Using the visual tool led to a different way of explaining neuropsychological assessment results. It was considered valuable for explaining these results because psychologists could use the tool to summarize their explanation, and it felt more professional as they did not have to search through papers or draw their own graphs on a board or piece of paper. According to the psychologists, the use of the visual tool did not necessarily lead to more interaction. However, they indicated that the structure of the interaction did change, as patients and family members were prompted by the tool to ask questions right away. All psychologists said they would use the tool in their clinical work, but using the tool was something they had to get used to. Furthermore, psychologists in two centers said they would only use it if barriers and concerns were solved. This was particularly related to the integration of more tests in the tool to fit better with routine practice.
“I had to get used to it, because I have a routine in how I say and explain things. ... I was searching for what I was actually seeing on my screen and how I could explain that in small steps to the person sitting in front of me.” (psychologist 2)
“It makes it professional in a way. It appeals more to the imagination more than when I only have a folder full of loose sheets and papers” (psychologist 4)
Barriers and concerns
As mentioned above, a major concern was the limited number of tests available in the visual tool, which made it difficult to explain the full assessment. A few practical concerns were also raised, such as better integration with the software of the electronic patient files so that test results do not have to be entered twice, a lack of clarity with respect to the graphs due to grayscale printers at the clinics, and the low availability of computers in some consultation rooms.
“Just imagine that you administered other cognitive tests which are now missing in the tool. This can truly change the visualization of the results. Sometimes it seemed as if the domain memory had a very low performance, but we administered other memory tests that went well. Then, I have to adapt that with a pen and that creates confusion.” (psychologist 7)
Technology acceptance
All psychologists indicated that the visual tool was helpful for explaining neuropsychological assessment results and that the ability to select the imp-lications of the results for daily life was an important feature of the system. They were satisfied with the system (mean±SD, range; 5.6±0.7, 5–7) and indicated that it had a good design (5.9±0.6, 5–7), attractive layout (6.0±0.5, 5–7), and readable text (5.8±0.7, 5–7). Furthermore, high levels of agreement were present in the domains of perceived usefulness (5.4±0.8, 4.0–6.2) and attitude toward using (6.0±0.8, 4.5–7.0). Average agreement was reported on perceived ease of use (3.5±0.6, 2.6–4.3).
DISCUSSION
The aim of this study was to develop a web-based visual tool to improve the explanation and understanding of neuropsychological test results, information retention, and psychologist-patient communication. The second aim was to determine the usability, technology acceptance, and feasibility of the tool. An iterative process incorporating perspectives of different end-users (patients, family members, neuropsychology experts) was used to develop the tool. During the early development, already all users reported positive feedback about the visual tool to explain the results of a neuropsychological assessment. The usability of the tool was evaluated as excellent by psychologists. The pilot study indicated that regardless of the visual tool, patients and family members were positive regarding the consultation with the psychologist. The visual tool led to an increase in understanding of neuropsychological assessment results. All users reported high levels of satisfaction with the visual tool. In general, these high levels could be explained by having something available to aid explanation and to improve awareness of receiving extra explanation. In addition, the qualitative data showed that patients, family members, and psychologists specifically indicated that the overview of cognitive strengths and weaknesses, the implications of the results for daily life, and receiving something to take home was an added value of the visual tool. However, the information retention in patients remained low. Psychologists indicated that the tool was useful and intuitive, and technology acceptance was high. Nevertheless, some barriers were mentioned that have to be addressed to increase feasibility in clinical practice.
Experiences with neuropsychological feedback
Patients and family members from both groups were positive regarding the consultation with the psychologist, which might be related to patients receiving useful feedback [8, 11]. Neuropsychological feedback is increasingly part of care as usual and used as a therapeutic intervention [8, 45]. However, in Dutch MCs, neuropsychological feedback is not part of standard practice. This is sometimes related to financial barriers but may also be due to the multidisciplinary nature of the MC [46], in which the medical specialist often communicates the diagnosis. Based on the small body of literature on experiences with a neuropsychological assessment in MC settings, a need for a follow-up consultation with the neuropsychologist has been reported [8, 24, 47, 48]. Furthermore, providing neuropsychological feedback has been related to positive outcomes in other disorders [7]. For example, in patients with traumatic brain injury, feedback helped both patients and family cope with the consequences [49], and in patients with a mood disorder, reductions in psychiatric and cognitive symptoms were observed [50].
Information retention during neuropsychological feedback
In our pilot study, the information retention of patients, with and without the visual tool, remained low. No other studies have investigated whether retention of neuropsychological feedback improved by offering visual aids, but other fields showed improved retention and understanding [21, 51]. Fewer worries were reported among patients and families in the center who had already received the diagnostic disclosure two weeks before receiving neuropsychological feedback. While low retention is likely to be at least partly due to memory problems, other factors may play a role as well. For example, the low level of information retention might be due to the emotional impact of receiving a diagnosis. Emotional information might be prioritized over other competing information, and neutral information has been found to decay over time more rapidly than emotionally loaded information [5, 52]. Other explanations for low medical information retention could be clinician-related factors (e.g., using difficult terminology), patient-related factors (e.g., education, experienced stress), or a focus on diagnosis-related information [13, 15]. All participants indicated that receiving both oral, written, and visual information would facilitate information retention. To our knowledge, only two studies showed that written information increased free recall of neuropsychological recommendations, but no differences were found in the recall of diagnostic information [16, 17]. Offering tailored and high-quality information remains important because it can give patients the opportunity to take more responsibility for their health, respond better to health-related problems [53], feel more in control [54], and participate in a more active manner in shared decision making [55]. It is also important to provide neuropsychological feedback after patients have received the diagnostic disclosure and not at the same time. Furthermore, interventions that support information provision improved quality of life in patients with dementia [56].
Strengths and limitations
A prominent strength of the current study is co-creation with different users of the tool, which might have resulted in the high rates of usability in our visual tool. The feedback of patients, family members, and neuropsychology experts on the content, design, and layout of the tool led to an adapted version that better fits the needs of the end-users. Co-creation involves different user perspectives because every individual brings their own knowledge, which can lead to collective creativity [57], a shared understanding of the product [58], innovative generation of ideas, critical thinking, reciprocal knowledge gain, and long-term involvement of the potential users [59]. From a software development perspective, high usability (also referred to as “quality in use”) prevents the occurrence of errors and results in higher user satisfaction, reduced training and documentation costs, and a better cost-benefit ratio [60]. Another strength is the involvement of three different centers to take the variability between centers into account. The variability in the sample was further increased by using a purposive sampling approach to account for the heterogeneity present in memory clinic populations. Furthermore, multiple types of triangulation in our methodological approach have led to an enrichment of the data.
However, some limitations have to be considered as well. Due to the variability between the centers, it is difficult to generalize our findings to a broader memory clinic population. Methodological problems with questionnaire data should also be considered. For example, respondents often score equally high or low on domains of outcome measures, which can lead to an underestimation [61]. Another important note is that the visual tool might not be suitable for all participants. In our study, one patient with dementia found the visual tool too difficult to comprehend. However, the caregiver of this patient was very grateful for the information because it gave her more tools to cope with the diagnosis of her husband.
CONCLUSION
A standardized visual tool could be used as a com-munication aid during neuropsychological feedback sessions by giving the psychologist a frame of relevant feedback aspects, including the translation to daily life recommendations. The visual tool developed in this paper provides such a framework and can be used as a starting point. Future research should optimize the visual tool. More cognitive tests and normative data should be included. Additionally, integration with the hospital-based patient system would be ideal. Moreover, adaptation of the tool for other patient groups, such as patients with traumatic brain injury, stroke or psychiatric disorders, should be explored, as well as longer evaluation periods in larger samples.
ACKNOWLEDGMENTS
We would like to express our gratitude to the software company that developed our tool and all participants (patients, family members, and neuro-psychological experts) for their time, effort, and valuable feedback on the visual tool. We also would like to thank Angela Wenting and Susanne Valentijn for enabling us to organize focus groups and conduct the pilot study in the Catharina Hospital in Eindhoven. We would also like to thank the ANDI research group for sharing the normative scores of two cognitive tests. Our gratitude also goes to Martine van Zandvoort and Eva van Grinsven for sharing their reliable change index formula. This study was supported by an independent grant from the Noaber Foundation and Alzheimer Nederland.
Authors’ disclosures available online (https://www.j-alz.com/manuscript-disclosures/20-1128r1).
REFERENCES
[1] | Lee SM , Roen K , Thornton A ((2014) ) The psychological impact of a diagnosis of Alzheimer’s disease. Dementia (London) 13: , 289–305. |
[2] | de Vugt ME , Verhey FR ((2013) ) The impact of early dementia diagnosis and intervention on informal caregivers. Prog Neurobiol 110: , 54–62. |
[3] | Turner GM , McMullan C , Atkins L , Foy R , Mant J , Calvert M ((2019) ) TIA and minor stroke: A qualitative study of long-term impact and experiences of follow-up care. BMC Fam Pract 20: , 176. |
[4] | Watt S , Crowe SF ((2018) ) Examining the beneficial effect of neuropsychological assessment on adult patient outcomes: A systematic review. Clin Neuropsychol 32: , 368–390. |
[5] | Postal KS , Armstrong K ((2013) ) Feedback that sticks: The art of effectively communicating neuropsychological assessment results. Oxford University Press, Oxford. |
[6] | Gorske TT , Smith SR ((2009) ) Collaborative Therapetuic Neuropsychological Assessment, Springer, New York. |
[7] | Rosado DL , Buehler S , Botbol-Berman E , Feigon M , León A , Luu H , Carrión C , Gonzalez M , Rao J , Greif T , Seidenberg M , Pliskin NH ((2018) ) Neuropsychological feedback services improve quality of life and social adjustment. Clin Neuropsychol 32: , 422–435. |
[8] | Bennett-Levy J , Klein-boonschate MA , Batchelor J , McCarter R , Walton N ((1994) ) Encounters with Anna Thompson: The consumer’s experience of neuropsychological assessment. Clin Neuropsychol 8: , 219–238. |
[9] | Westervelt HJ , Brown LB , Tremont G , Javorsky DJ , Stern RA ((2007) ) Parent satisfaction with neuropsychological consultation after pediatric mild traumatic brain injury. Child Neuropsychol 23: , 273–283. |
[10] | Kirkwood MW , Peterson RL , Baker DA , Connery AK ((2017) ) Parent satisfaction with neuropsychological consultation after pediatric mild traumatic brain injury. Child Neuropsychol 23: , 273–283. |
[11] | Farmer JE , Brazeal TJ ((1998) ) Parent perceptions about the process and outcomes of child neuropsychological assessment. Appl Neuropsychol 5: , 194–201. |
[12] | Postal K , Chow C , Jung S , Erickson-Moreo K , Geier F , Lanca M ((2018) ) The stakeholders’ project in neuropsychological report writing: A survey of neuropsychologists’ and referral sources’ views of neuropsychological reports. Clin Neuropsychol 32: , 326–344. |
[13] | Kessels RPC ((2003) ) Patients’ memory for medical information. J R Soc Med 96: , 219–222. |
[14] | Langewitz W , Ackermann S , Heierle A , Hertwig R , Ghanim L , Bingisser R ((2015) ) Improving patient recall of information: Harnessing the power of structure. Patient Educ Couns 98: , 716–721. |
[15] | Ley P ((1988) ) Communicating with Patients: Improving Communication, Satisfaction and Compliance, Croom Helm, New York. |
[16] | Fallows RR , Hilsabeck RC ((2013) ) Comparing two methods of delivering neuropsychological feedback. Arch Clin Neuropsychol 28: , 180–188. |
[17] | Meth M , Calamia M , Tranel D ((2016) ) Does a simple intervention enhance memory and adherence for neuropsychological recommendations? Appl Neuropsychol Adult 23: , 21–28. |
[18] | Abley C , Manthorpe J , Bond J , Keady J , Samsi K , Campbell S , Watts S , Robinson L ((2013) ) Patients’ and carers’ views on communication and information provision when undergoing assessments in memory services. J Health Serv Res Policy 18: , 167–173. |
[19] | Baum KT , von Thomsen C , Elam M , Murphy C , Gerstle M , Austin CA , Beebe DW ((2018) ) Communication is key: The utility of a revised neuropsychological report format. Clin Neuropsychol 32: , 345–367. |
[20] | Houts PS , Witmer JT , Egeth HE , Loscalzo MJ , Zabora JR ((2001) ) Using pictographs to enhance recall of spoken medical instructions II. Patient Educ Couns 43: , 231–242. |
[21] | Houts PS , Bachrach R , Witmer JT , Tringali CA , Bucher JA , Localio RA ((1998) ) Using pictographs to enhance recall of spoken medical instructions. Patient Educ Couns 35: , 83–88. |
[22] | Katz MG , Kripalani S , Weiss BD ((2006) ) Use of pictorial aids in medication instructions: A review of the literature. Am J Health Syst Pharm 63: , 2391–2397. |
[23] | Jaspers MWM ((2009) ) A comparison of usability methods for testing interactive health technologies: Methodological aspects and empirical evidence. Int J Med Inform 78: , 340–353. |
[24] | Gruters AAA , Christie HL , Ramakers IHGB , Verhey FRJ , Kessels RPC , de Vugt ME ((2020) ) Neuropsychological assessment and diagnostic disclosure at a memory clinic: A qualitative study of the experiences of patients and their family members. Clin Neuropsychol, doi: 10.1080/13854046.2020.1749936 |
[25] | Van der Elst W , Van Boxtel MP , Van Breukelen GJ , Jolles J ((2006) ) The Concept Shifting Test: Adult normative data. Psychol Assess 18: , 424–432. |
[26] | Vink M , Jolles J ((1985) ) A new version of the Trail Making Test as an informant processing task. J Clin Neuropsychol 7: , 162. |
[27] | van der Elst W , van Boxtel MP , van Breukelen GJ , Jolles J ((2006) ) The Letter Digit Substitution Test: Normative data for 1,858 healthy participants aged 24-81 from the Maastricht Aging Study (MAAS): Influence of age, education, and sex. J Clin Exp Neuropsychol 28: , 998–1009. |
[28] | Van der Elst W , Van Boxtel MP , Van Breukelen GJ , Jolles J ((2006) ) The Stroop Color-Word Test: Influence of age, sex and education; and normative data for a large sample across the adult age range. Assessment 13: , 62–79. |
[29] | Wechsler D ((2008) ) WAIS-IV-Nl. Afname en scoringshandleiding. Pearson, Amsterdam. |
[30] | Van der Elst W , Van Boxtel MP , Van Breukelen GJ , Jolles J ((2006) ) Normative data for the Animal, Profession and Letter M Naming verbal fluency tests for Dutch speaking participants and the effects of age, education and sex. J Int Neuropsychol Soc 12: , 80–89. |
[31] | Van der Elst W , van Boxtel MPJ , van Breukelen GJ , Jolles J ((2005) ) Rey’s verbal learning test: Normative data from 1855 healthy participants aged 24-81 years and the influence of age, sex, education, and mode of presentation. J Int Neuropsychol Soc 11: , 290–302. |
[32] | Lindeboom J , Schmand B ((2003) ) Visual Association Test. Handleiding. PITS BV, Leiden. |
[33] | Bouma A , Mulder J , Lindeboom J , Schmand B ((2012) ) Handboek neuropsychologische diagnostiek, Pearson, Amsterdam. |
[34] | Jacobson NS , Truax P ((1991) ) Clinical significance: A statistical approach to defining meaningful change in psychotherapy research. J Consult Clin Psychol 59: , 12–19. |
[35] | Chelune GI , Naugle RI , Lüders H , Sedlak J , Awad IA ((1993) ) Individual change after epilepsy surgery: Practice effects and base-rate information. Neuropsychology 7: , 41–52. |
[36] | Ramakers I , Gruters A , Schmand B , Kessels R , de Vugt M , Appels B , in de Braek D , Duits A , Knipping A , sectie Neuropsychology NIP ((2019) ) Monodisciplinaire richtlijn neuropsychologisch onderzoek bij lichte cognitieve stoornissen (MCI) en dementie. Retrieved from https://www.psynip.nl/secties/neuropsychologie/Published September 2019, Accessed December 2019. |
[37] | Brooke J ((1996) ) SUS: A “quick and dirty” usability scale. In Usability evaluation in industry, Jordan P , Thomas B , Weerdmeester B , eds. Taylor & Francis, London UK, pp. 189–194. |
[38] | Lewis JR ((2018) ) The System Usability Scale: past, present, and future. Int J Hum Comput Int 34: , 577–590. |
[39] | Bangor A , Kortum P , Miller J ((2009) ) Determining what individual SUS scores mean: Adding an adjective rating scale. J Usability Studies 4: , 114–123. |
[40] | Sustersic M , Gauchet A , Kernou A , Gibert C , Foote A , Vermorel C , Bosson JL ((2018) ) A scale assessing doctor-patient communication in a context of acute conditions based on a systematic review. PloS One 13: , e0192306. |
[41] | Zandbelt LC , Smets EMA , Oort FJ , Godfried MH , de Haes HCJM ((2004) ) Satisfaction with the outpatient encounter: A comparison of patients’ and physicians’ views. J Gen Intern Med 19: , 1088–1095. |
[42] | Van der Feltz-Cornelis CM , Van Oppen P , Van Marwijk HW , De Beurs E , Van Dyck R ((2004) ) A patient-doctor relationship questionnaire (PDRQ-9) in primary care: Development and psychometric evaluation. Gen Hosp Psychiatry 26: , 115–120. |
[43] | Davis FD ((1989) ) Perceived usefulness, perceived ease of use, and user acceptance of information technology. MIS Quarterly 13: , 319–340. |
[44] | Graneheim UH , Lundman B ((2004) ) Qualitative content analysis in nursing research: Concepts, procedures and measures to achieve trustworthiness. Nurse Educ Today 24: , 105–112. |
[45] | Curry KT , Hanson WE ((2010) ) National survey of psychologists’ test feedback training, supervision, and practice: A mixed methods study. J Pers Assess 92: , 327–336. |
[46] | Gruters AAA , Ramakers I , Kessels R , Bouwman FH , Olde Rikkert MGM , Blom MM , de Vugt ME , Verhey FRJ ((2019) ) Development of memory clinics in the Netherlands over the last twenty years. Int J Geriatr Psychiatry 34: , 1267–1274. |
[47] | Keady J , Gilliard J ((2002) ) The experience of neuropsychological assessment for people with suspected Alzheimer’s disease. In The Person with Alzheimer’s Disease. Pathways to understanding the experience., Harris BH , ed. The John Hopkins University Press, Baltimore. |
[48] | Kunneman M , Pel-Littel R , Bouwman FH , Gillissen F , Schoonenboom NSM , Claus JJ , van der Flier WM , Smets EMA ((2017) ) Patients’ and caregivers’ views on conversations and shared decision making in diagnostic testing for Alzheimer’s disease: The ABIDE project. Alzheimers Dement 3: , 314–322. |
[49] | Gass CS , Brown MC ((1992) ) Neuropsychological test feedback to patients with brain dysfunction. Psychol Assess 4: , 272–277. |
[50] | Lanca M , Giuliano AJ , Sarapas C , Potter AI , Kim MS , West AL , Chow CM ((2020) ) Clinical outcomes and satisfaction following neuropsychological assessment for adults: A community hospital prospective quasiexperimental study. Arch Clin Neuropsychol, 35: , 1303–1311. |
[51] | Garcia-Retamero R , Galesic M ((2010) ) Who proficts from visual aids: Overcoming challenges in people’s understanding of risks. Soc Sci Med 70: , 1019–1025. |
[52] | Kensinger EA ((2004) ) Remembering emotional experiences: The contribution of valence and arousal. Rev Neurosci 15: , 241–252. |
[53] | Heinemann AW , Magasi S , Hammel J , Carlozzi NE , Garcia SF , Hahn EA , Lai JS , Tulsky D , Gray DB , Hollingsworth H , Jerousek S ((2015) ) Environmental factors item development for persons with stroke, traumatic brain injury, and spinal cord injury. Arch Phys Med Rehab 96: , 589–595. |
[54] | Husson O , Mols F , van de Poll-Franse LV ((2011) ) The relation between information provision and health-related quality of life, anxiety and depression among cancer survivors: A systematic review. Ann Oncol 22: , 761–772. |
[55] | Martins JC ((2009) ) Patients’ satisfaction with information on disease and morbidity. Rev Lat Am Enfermagem 17: , 335–340. |
[56] | Corbett A , Stevens J , Aarsland D , Day S , Moniz-Cook E , Woods R , Brooker D , Ballard C ((2012) ) Systematic review of services providing information and/or advice to people with dementia and/or their caregivers. Int J Geriatr Psychiatry 27: , 628–636. |
[57] | Sanders EBN , Stappers PJ ((2008) ) Co-creation and the new landscapes of design. CoDesign 4: , 5–18. |
[58] | Kleinsmann M , Valkenburg R ((2008) ) Barriers and enablers for creating shared understanding in co-design projects. Des Studies 29: , 369–386. |
[59] | Rock J , McGuire M , Rogers A ((2018) ) Multidisciplinary perspectives on co-creation. Sci Commun 40: , 541–552. |
[60] | Juristo N , Moreno AM , Sanchez-Segura M-I ((2007) ) Analysing the impact of usability on software design. J Syst Softw 80: , 1506–1516. |
[61] | Song Y , Son YJ , Oh D ((2015) ) Methodological issues in questionnaire design. J Korean Acad Nurs 45: , 323–328. |

