Holistic Metabolomic Laboratory-Developed Test (LDT): Development and Use for the Diagnosis of Early-Stage Parkinson’s Disease

 ,
,  ,
,  ,
,  and
and 
Abstract
:
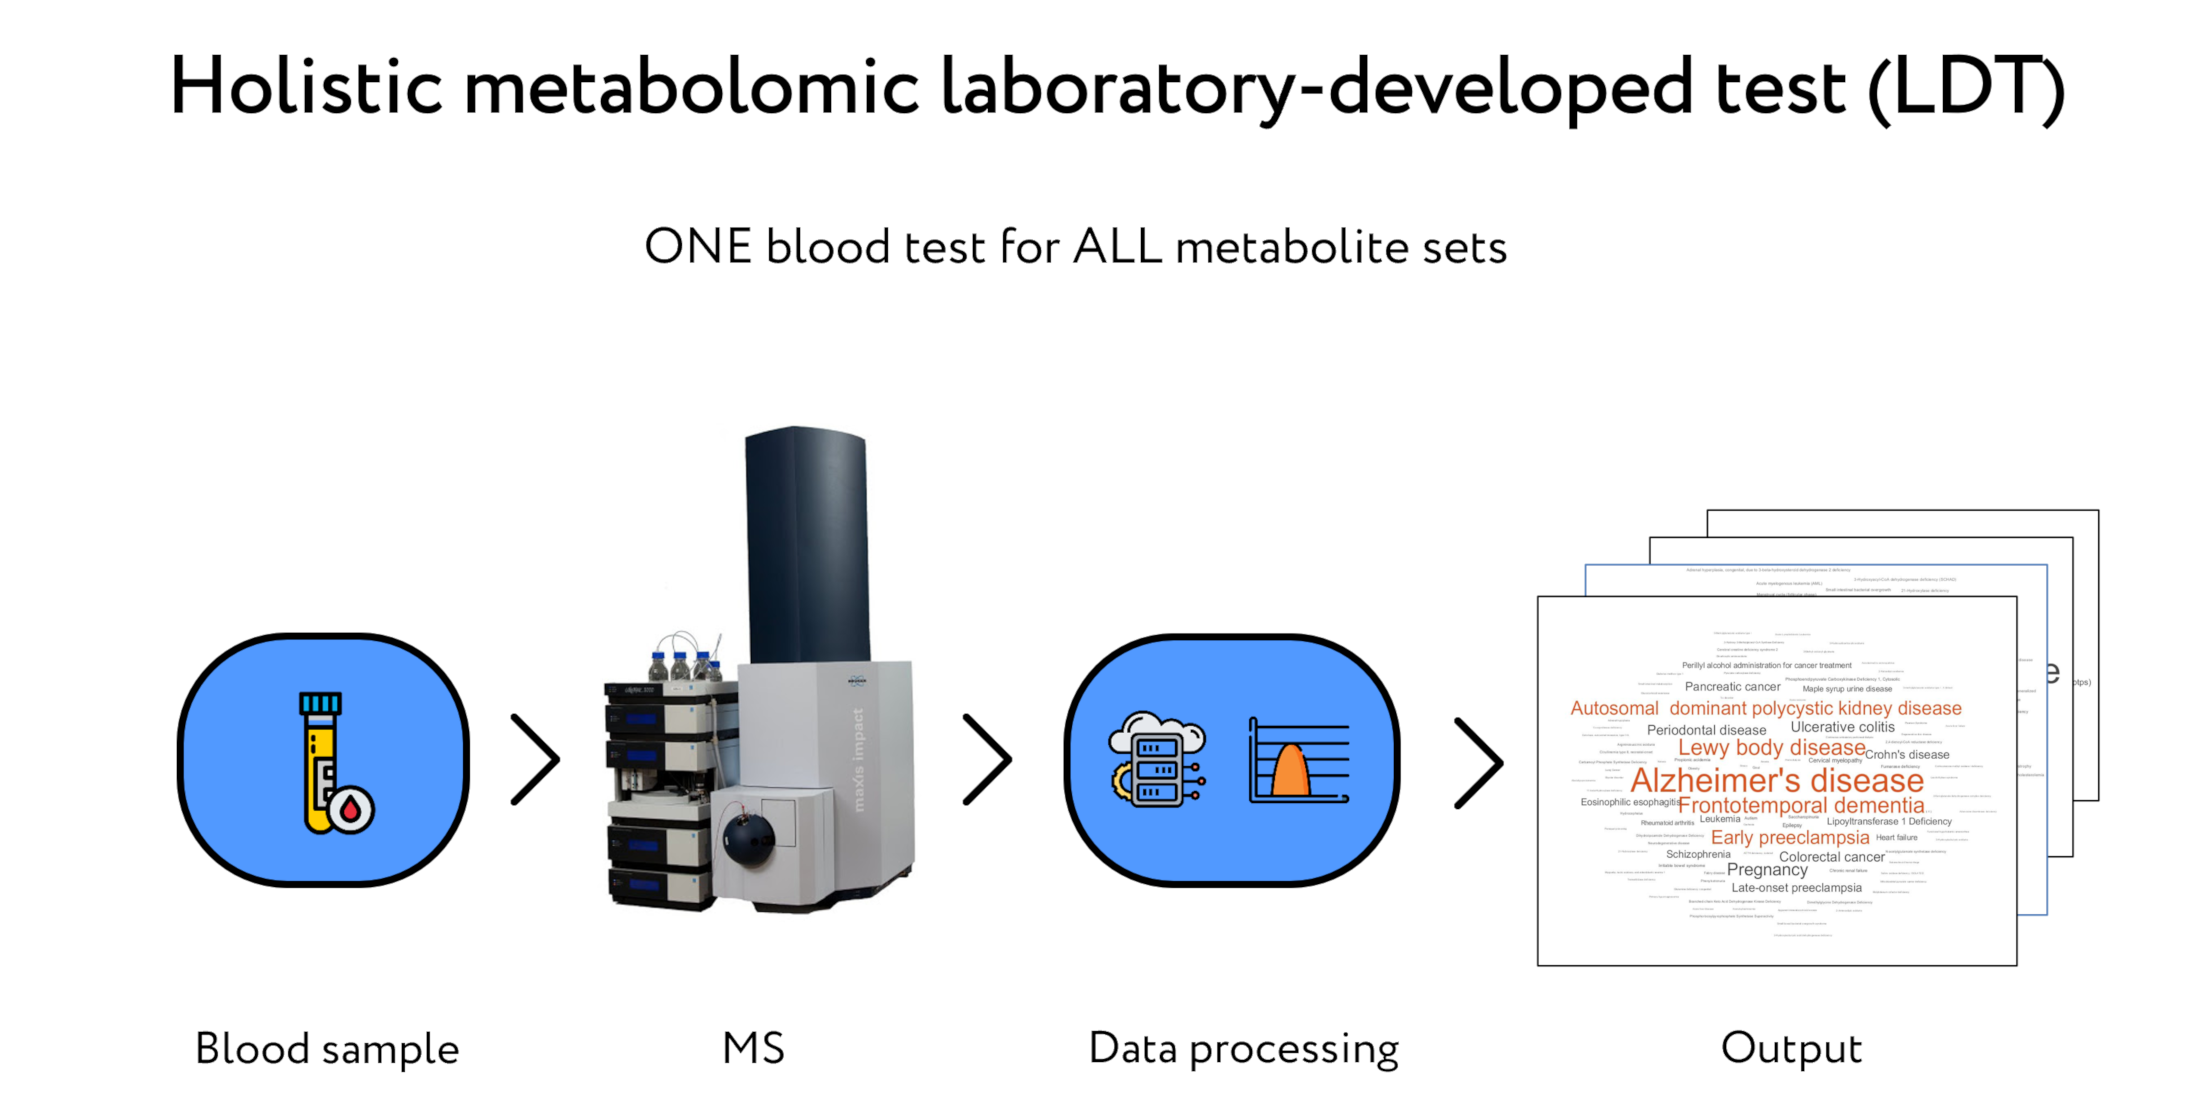
1. Introduction
2. Results
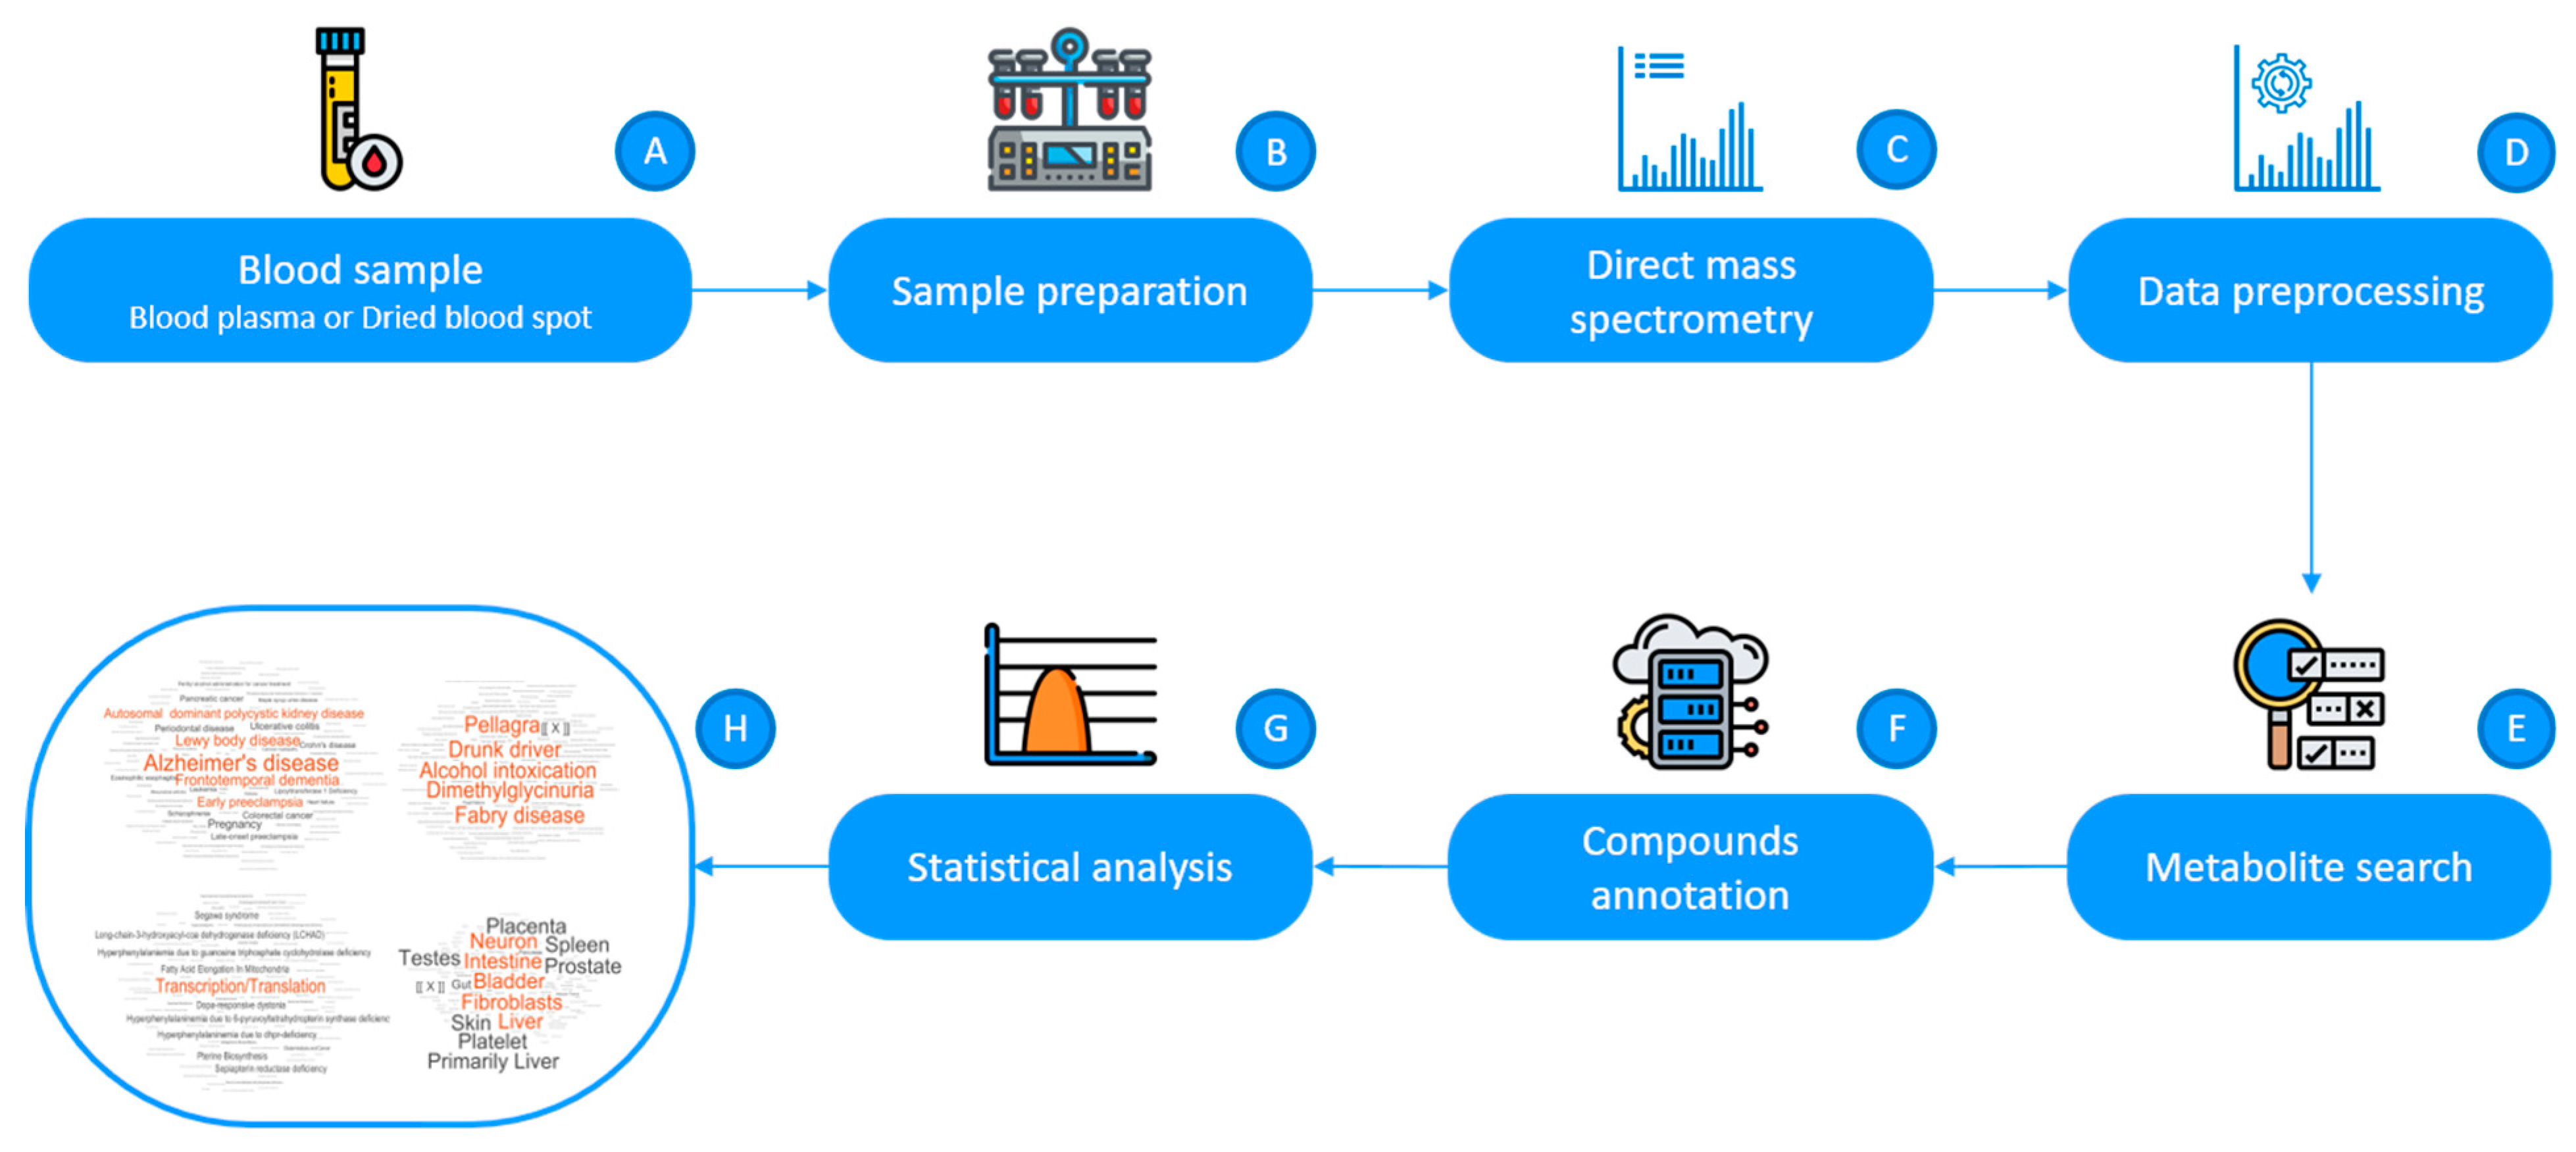
2.1. Mass Spectrometric Analysis of Compounds in Blood
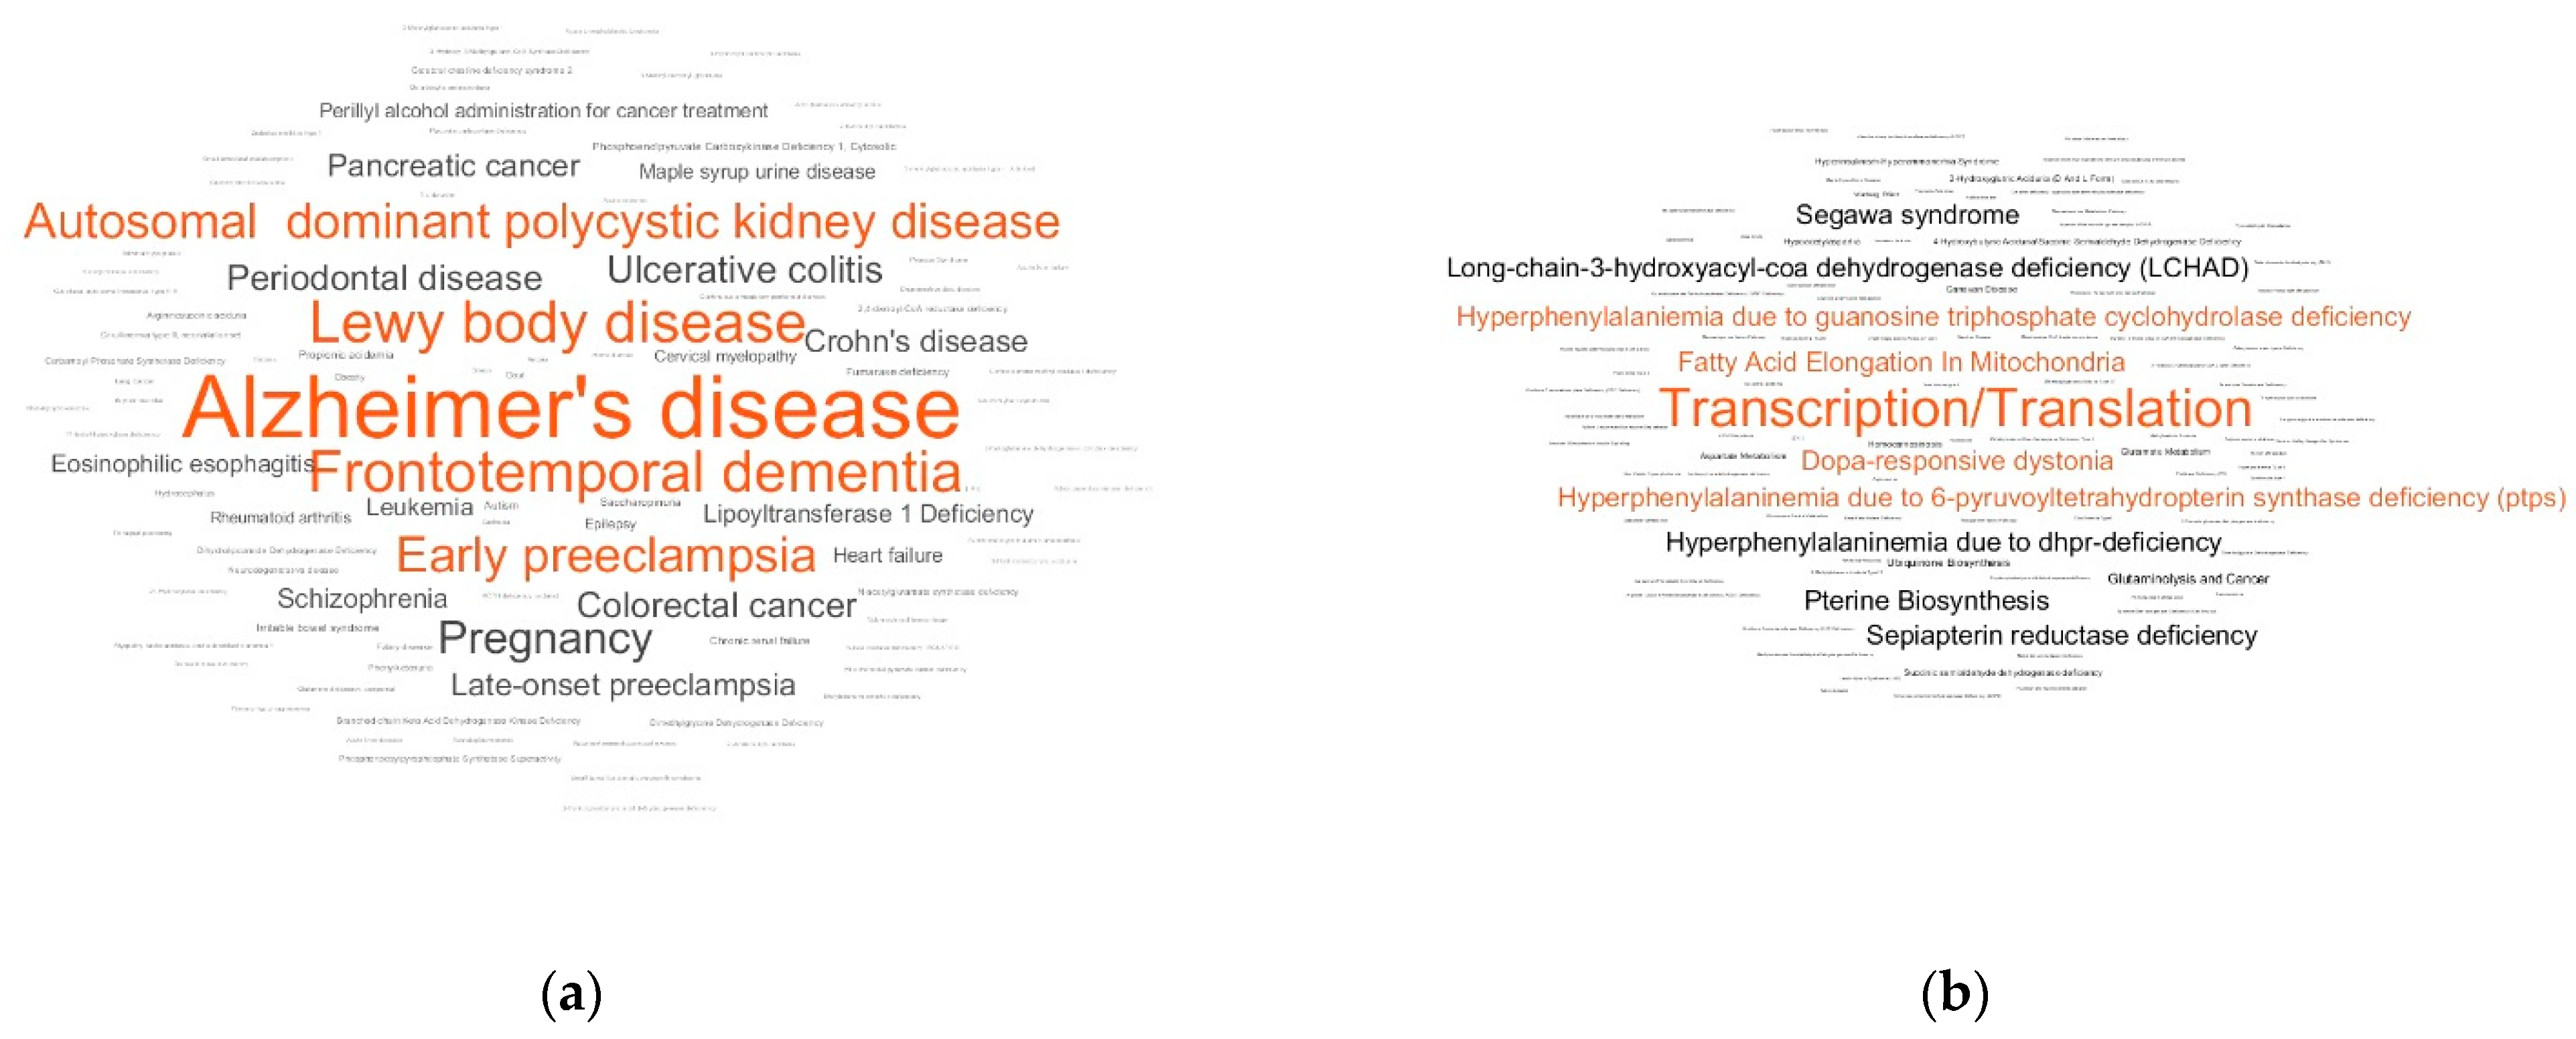
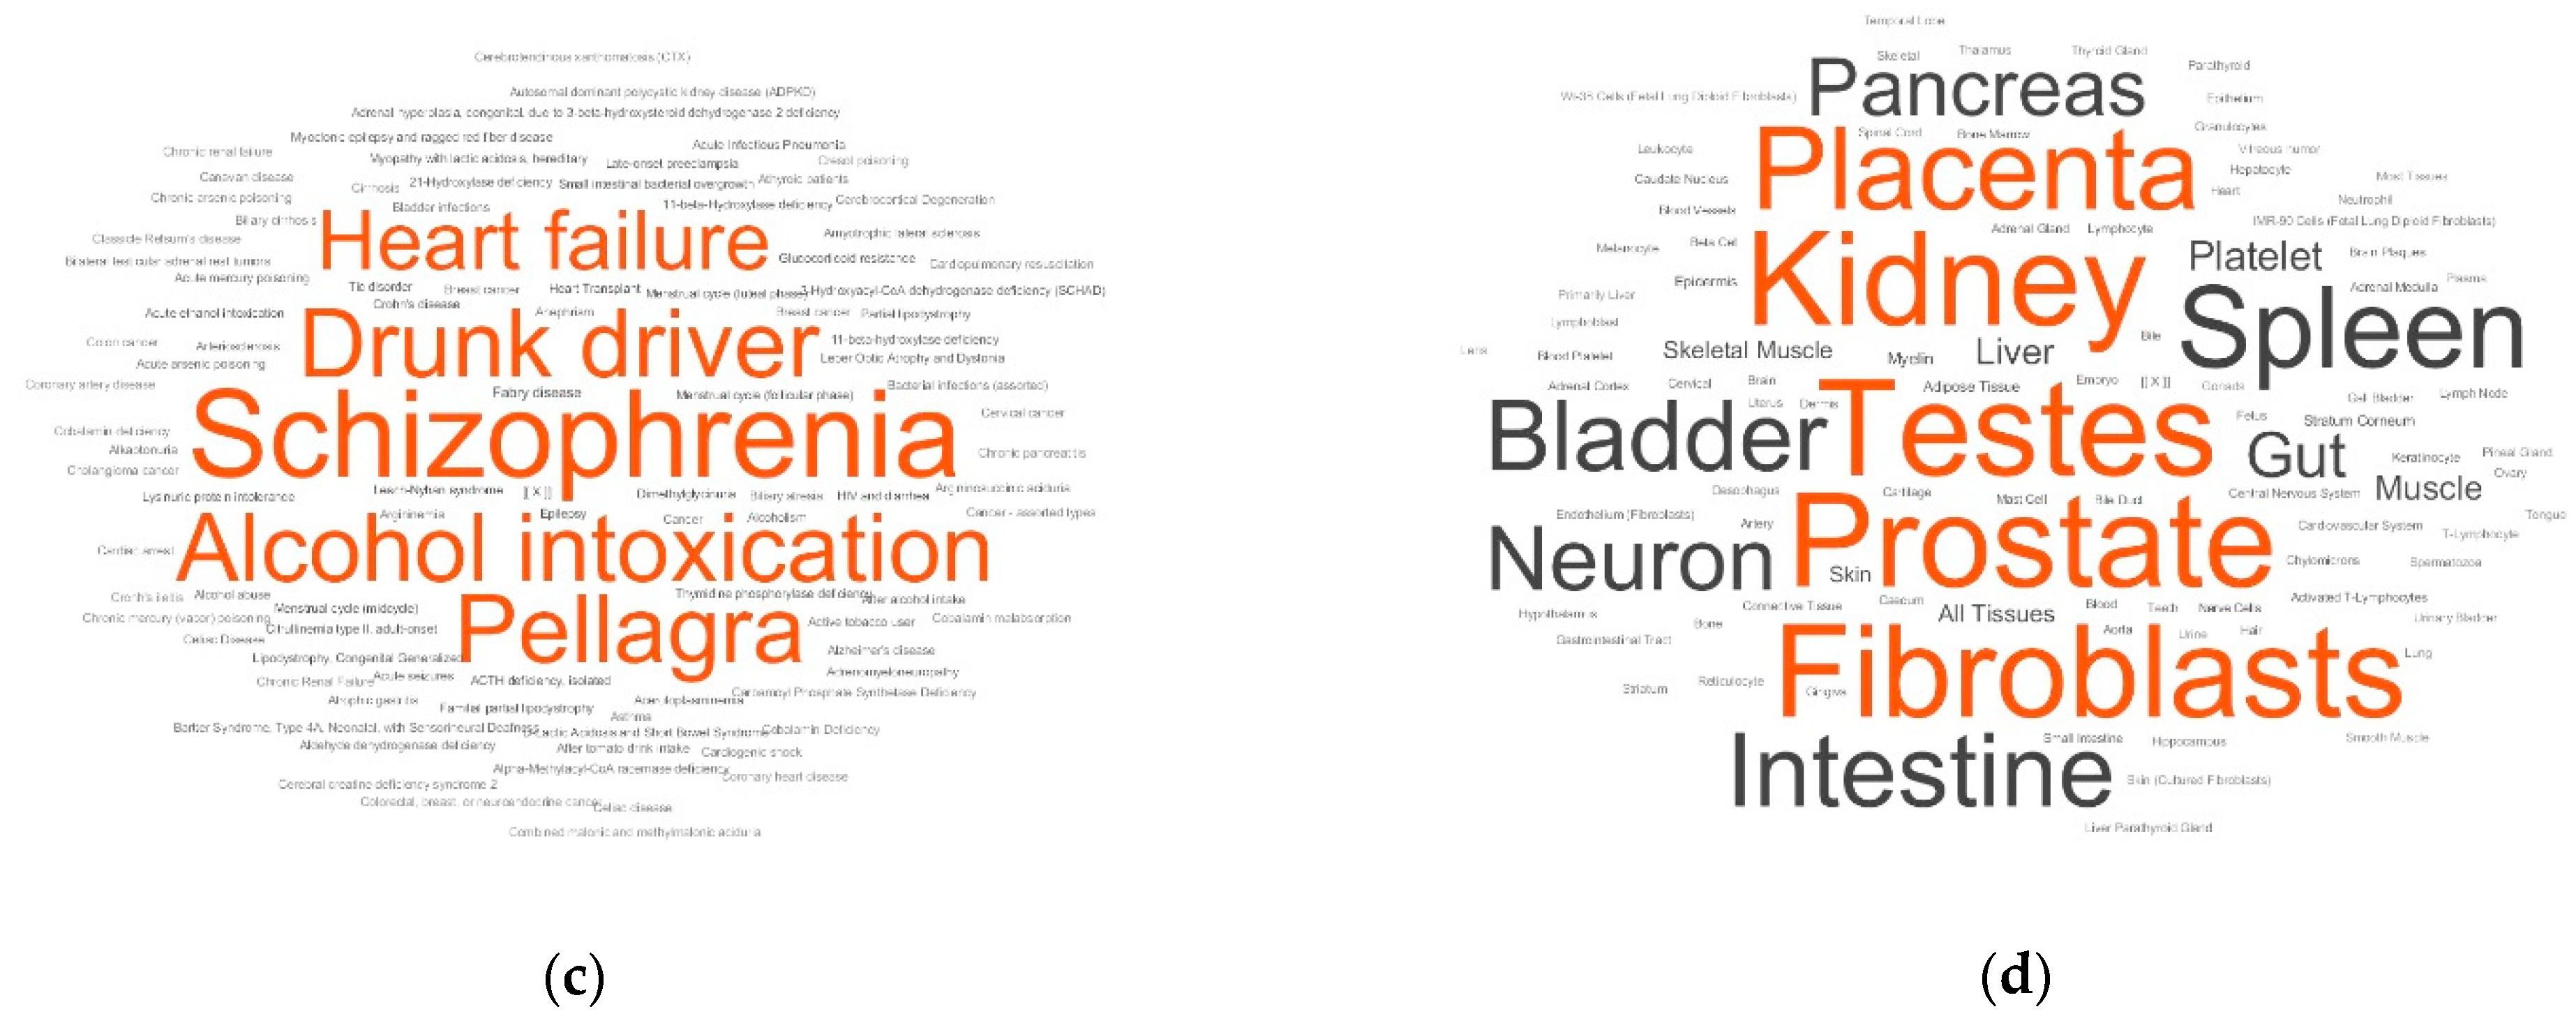
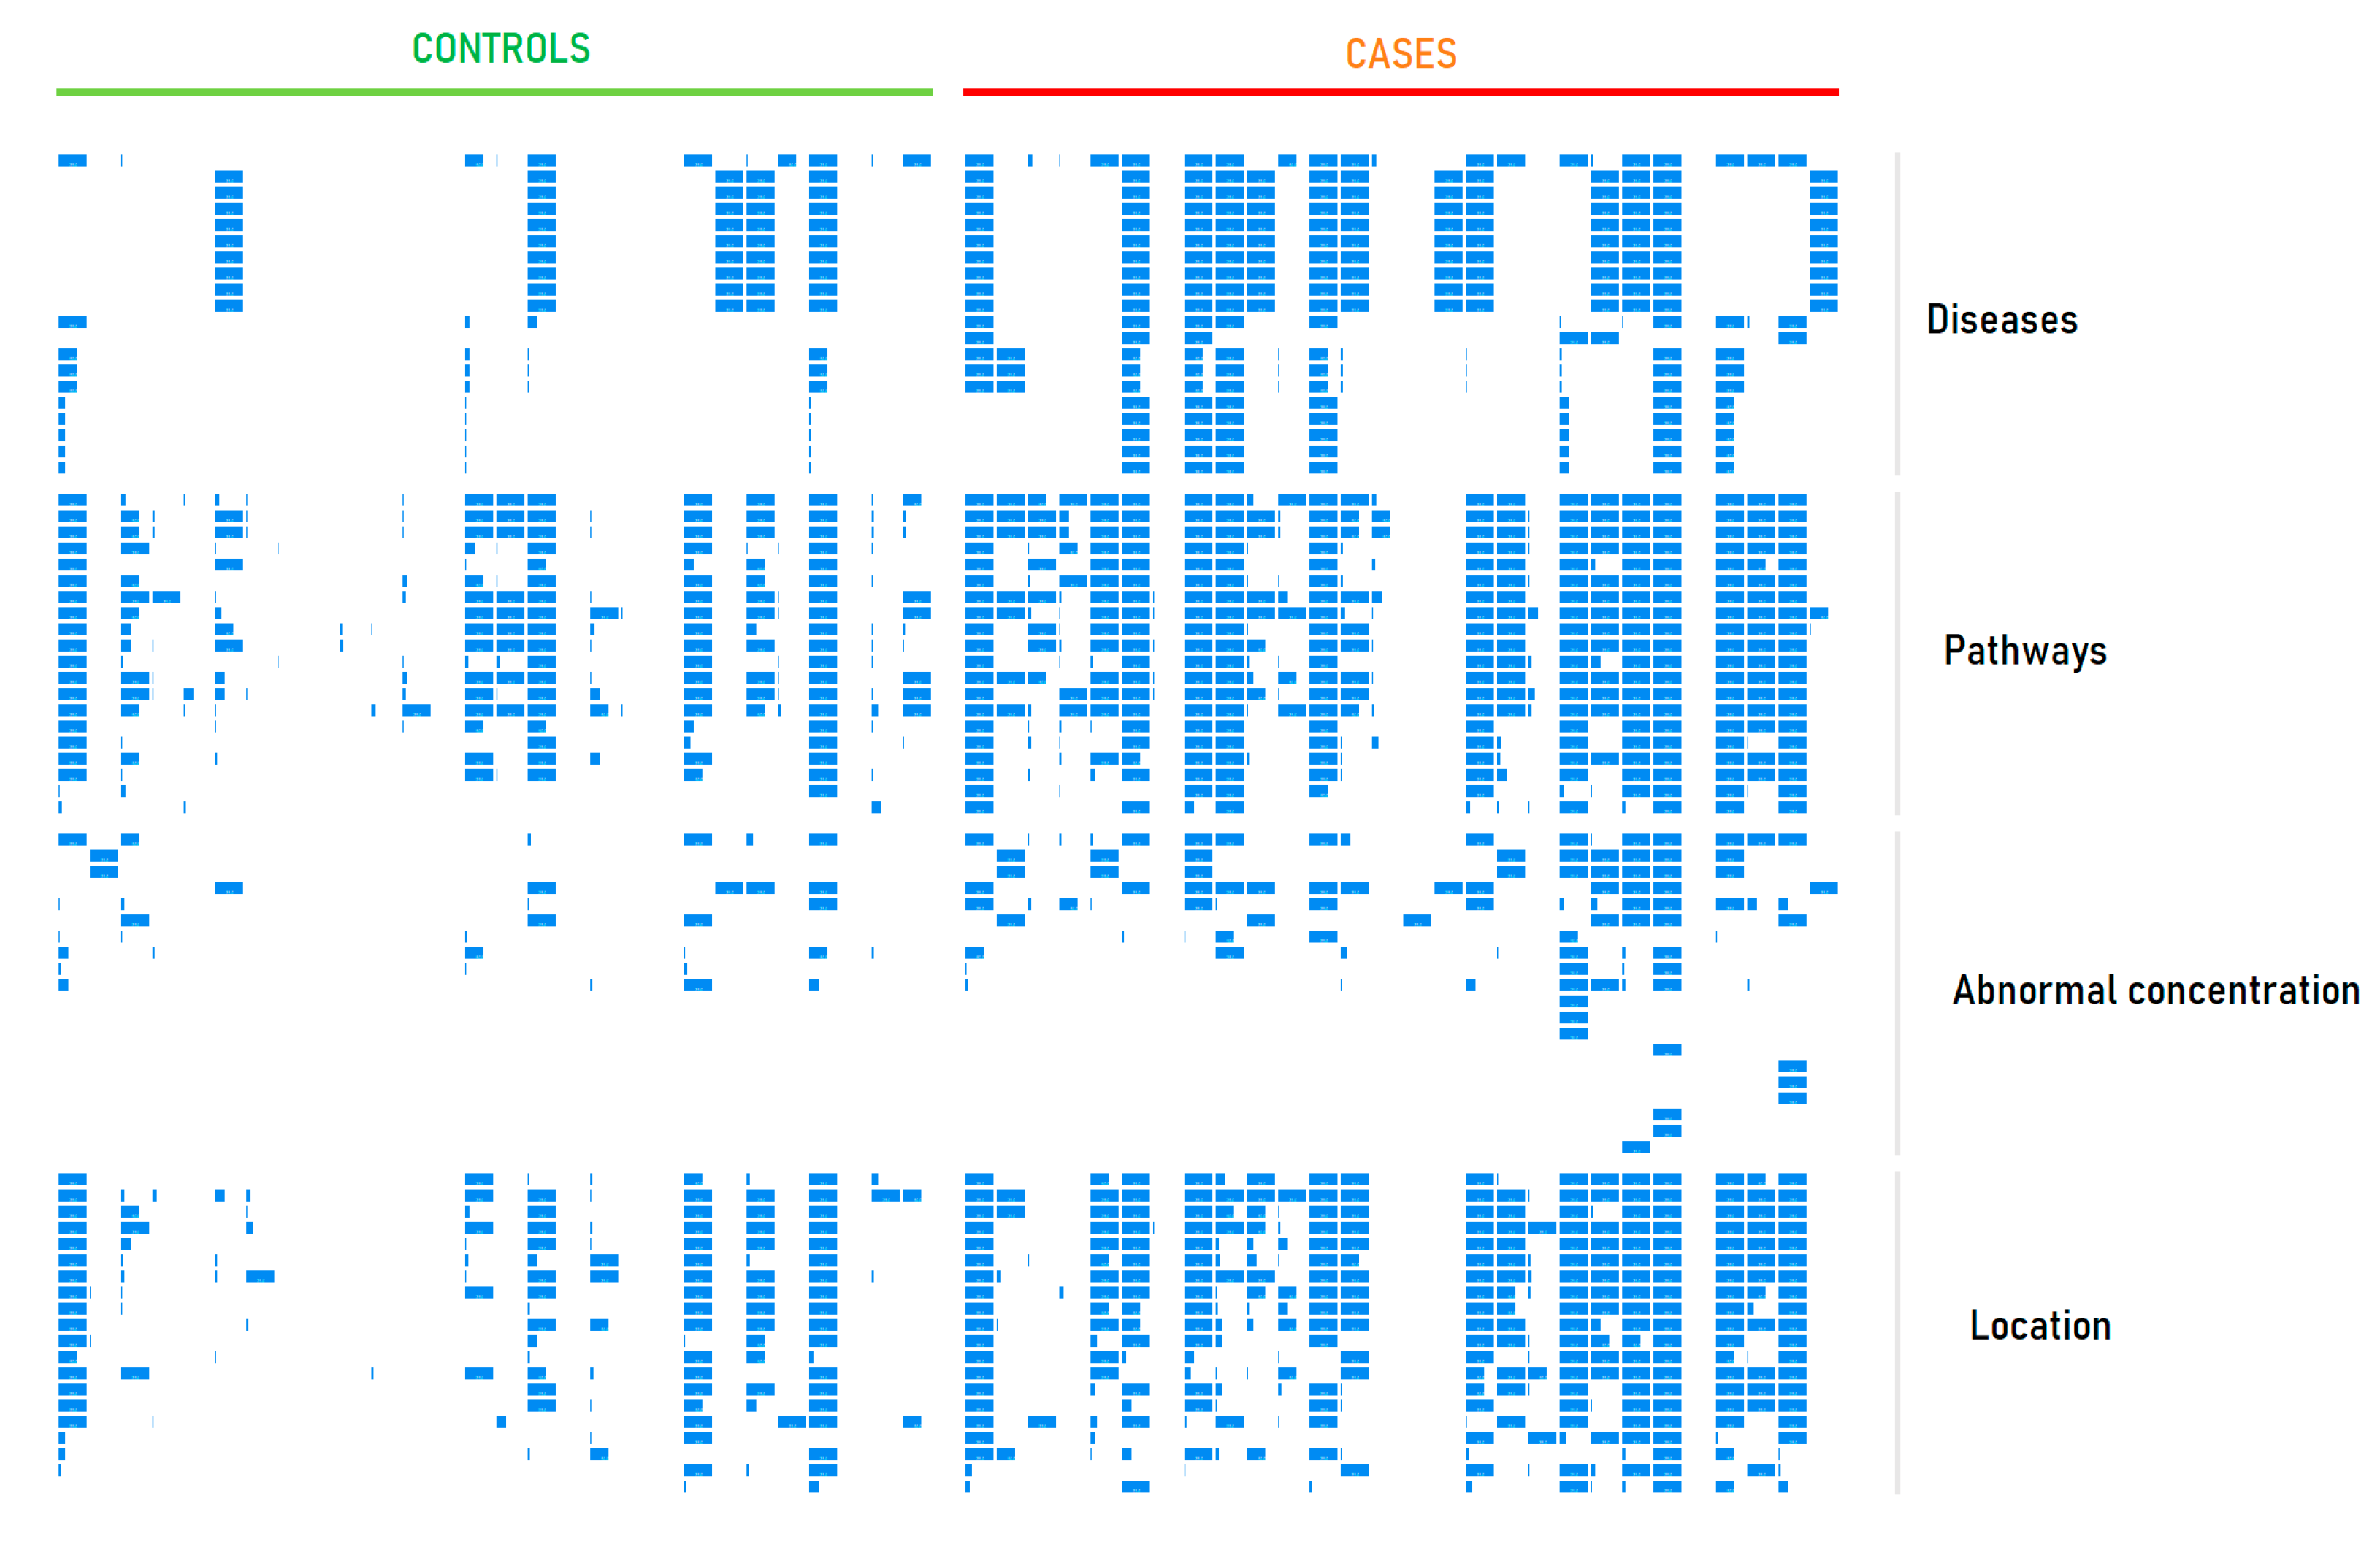
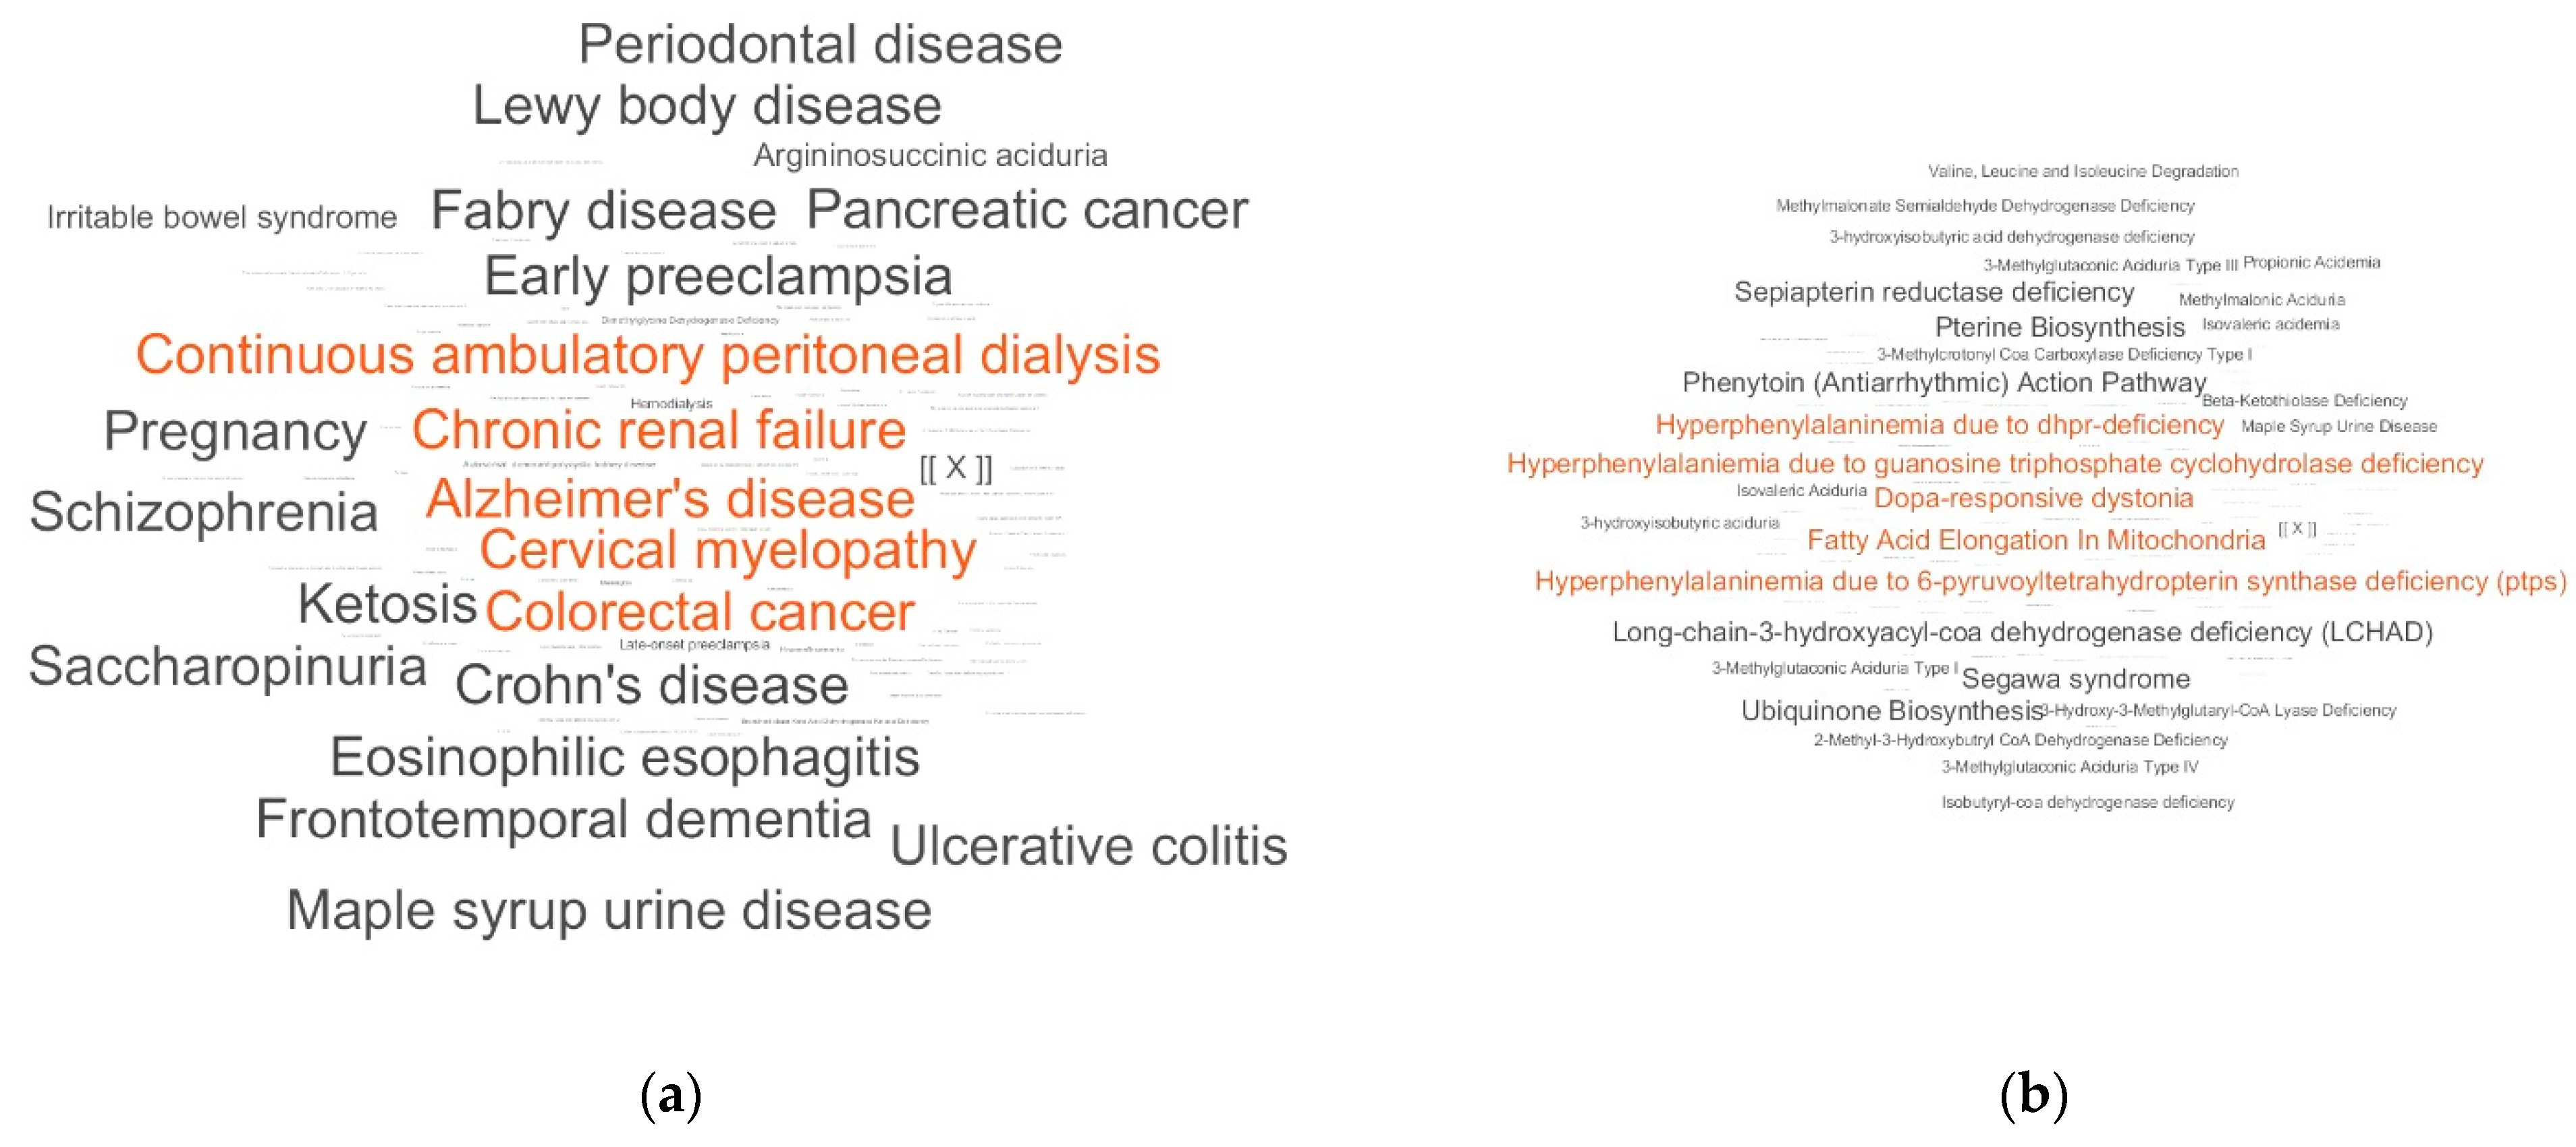
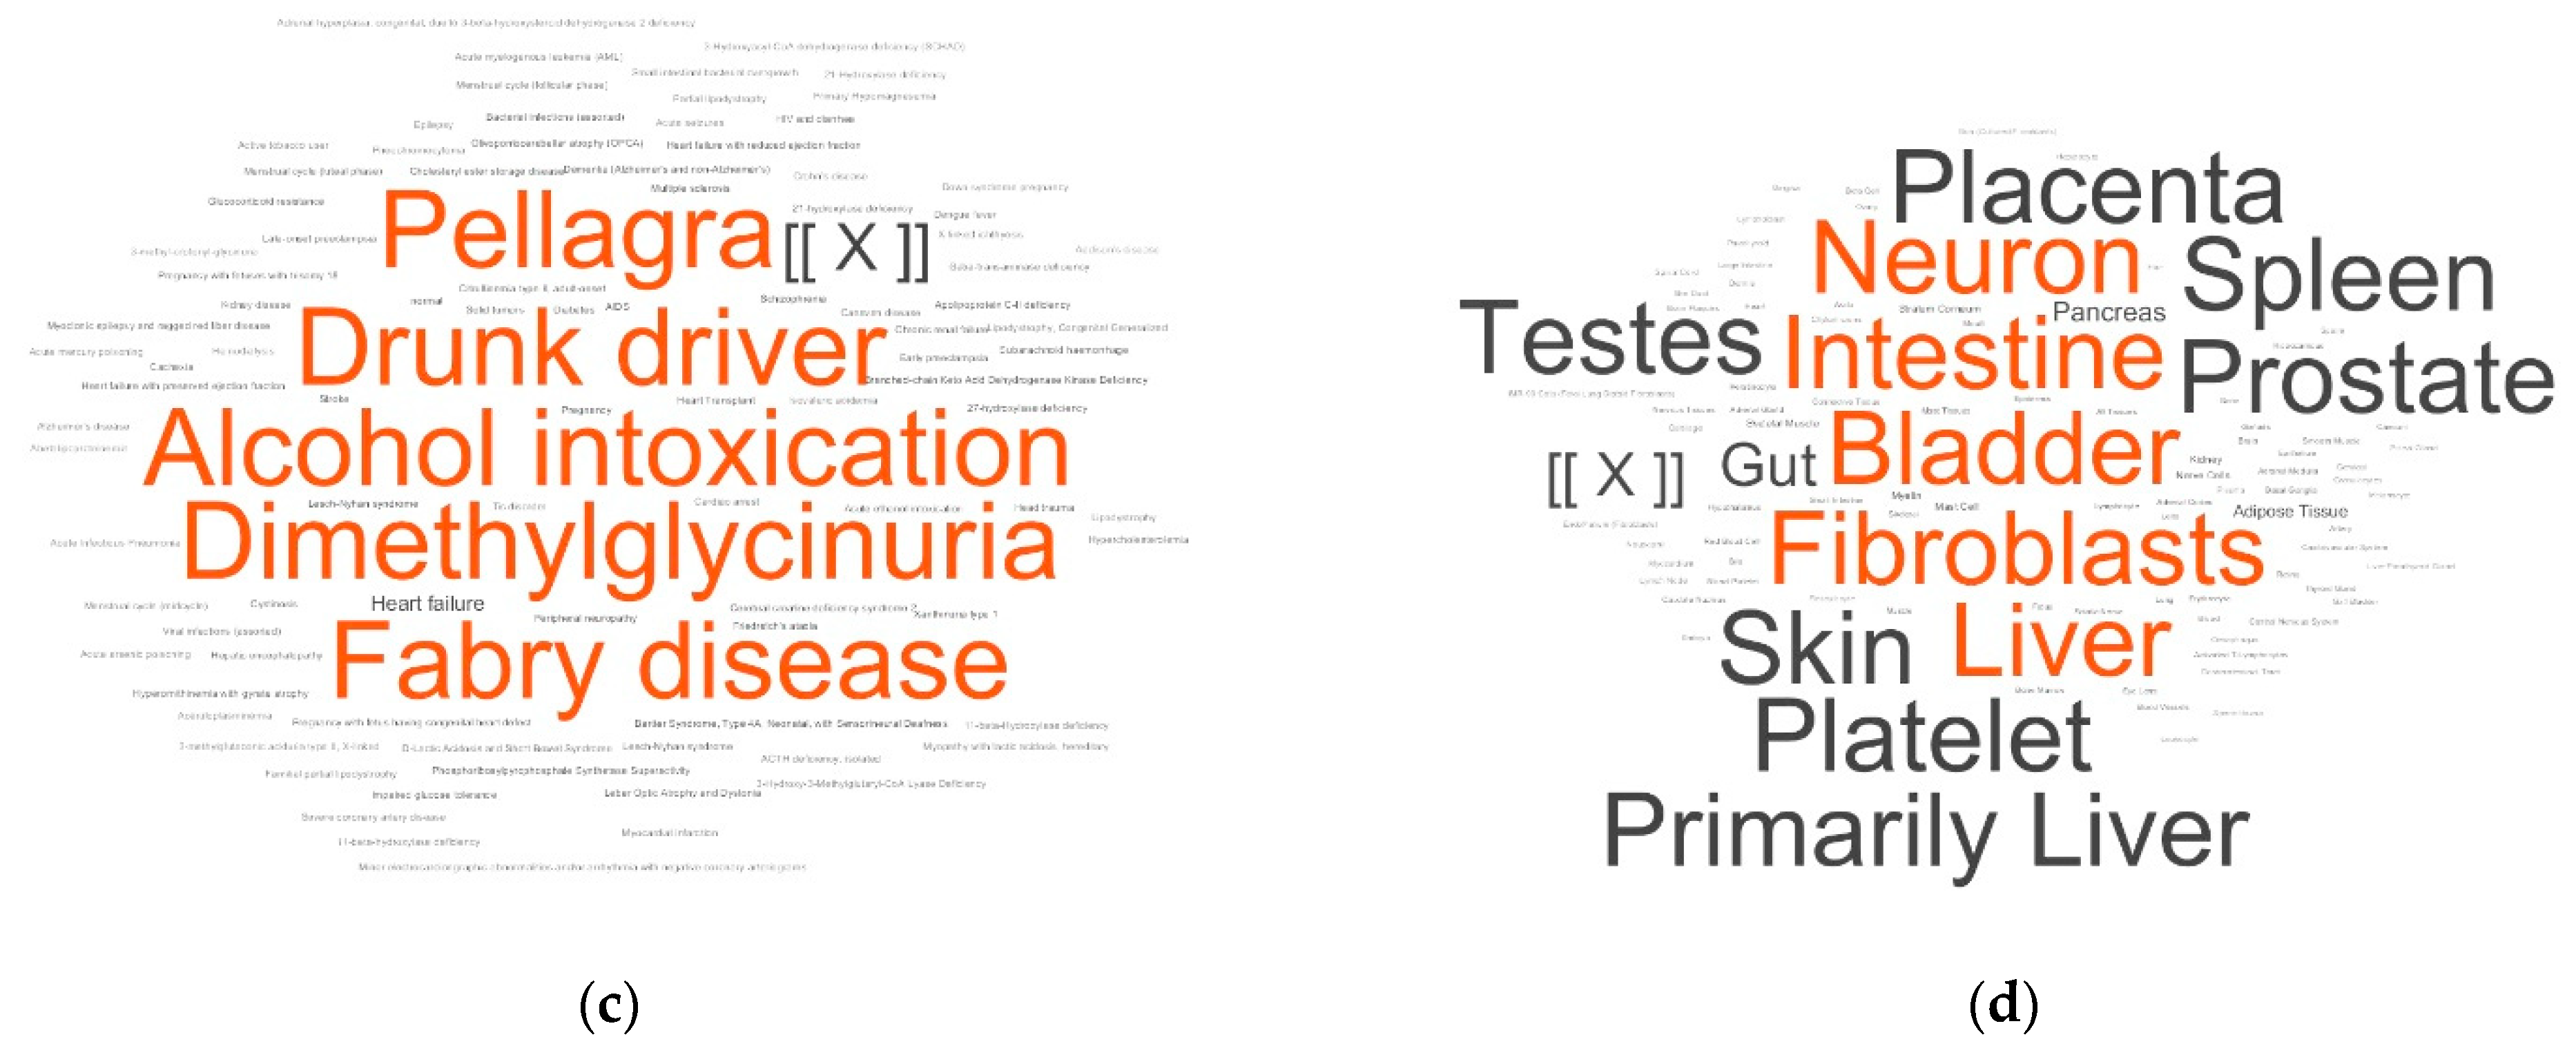
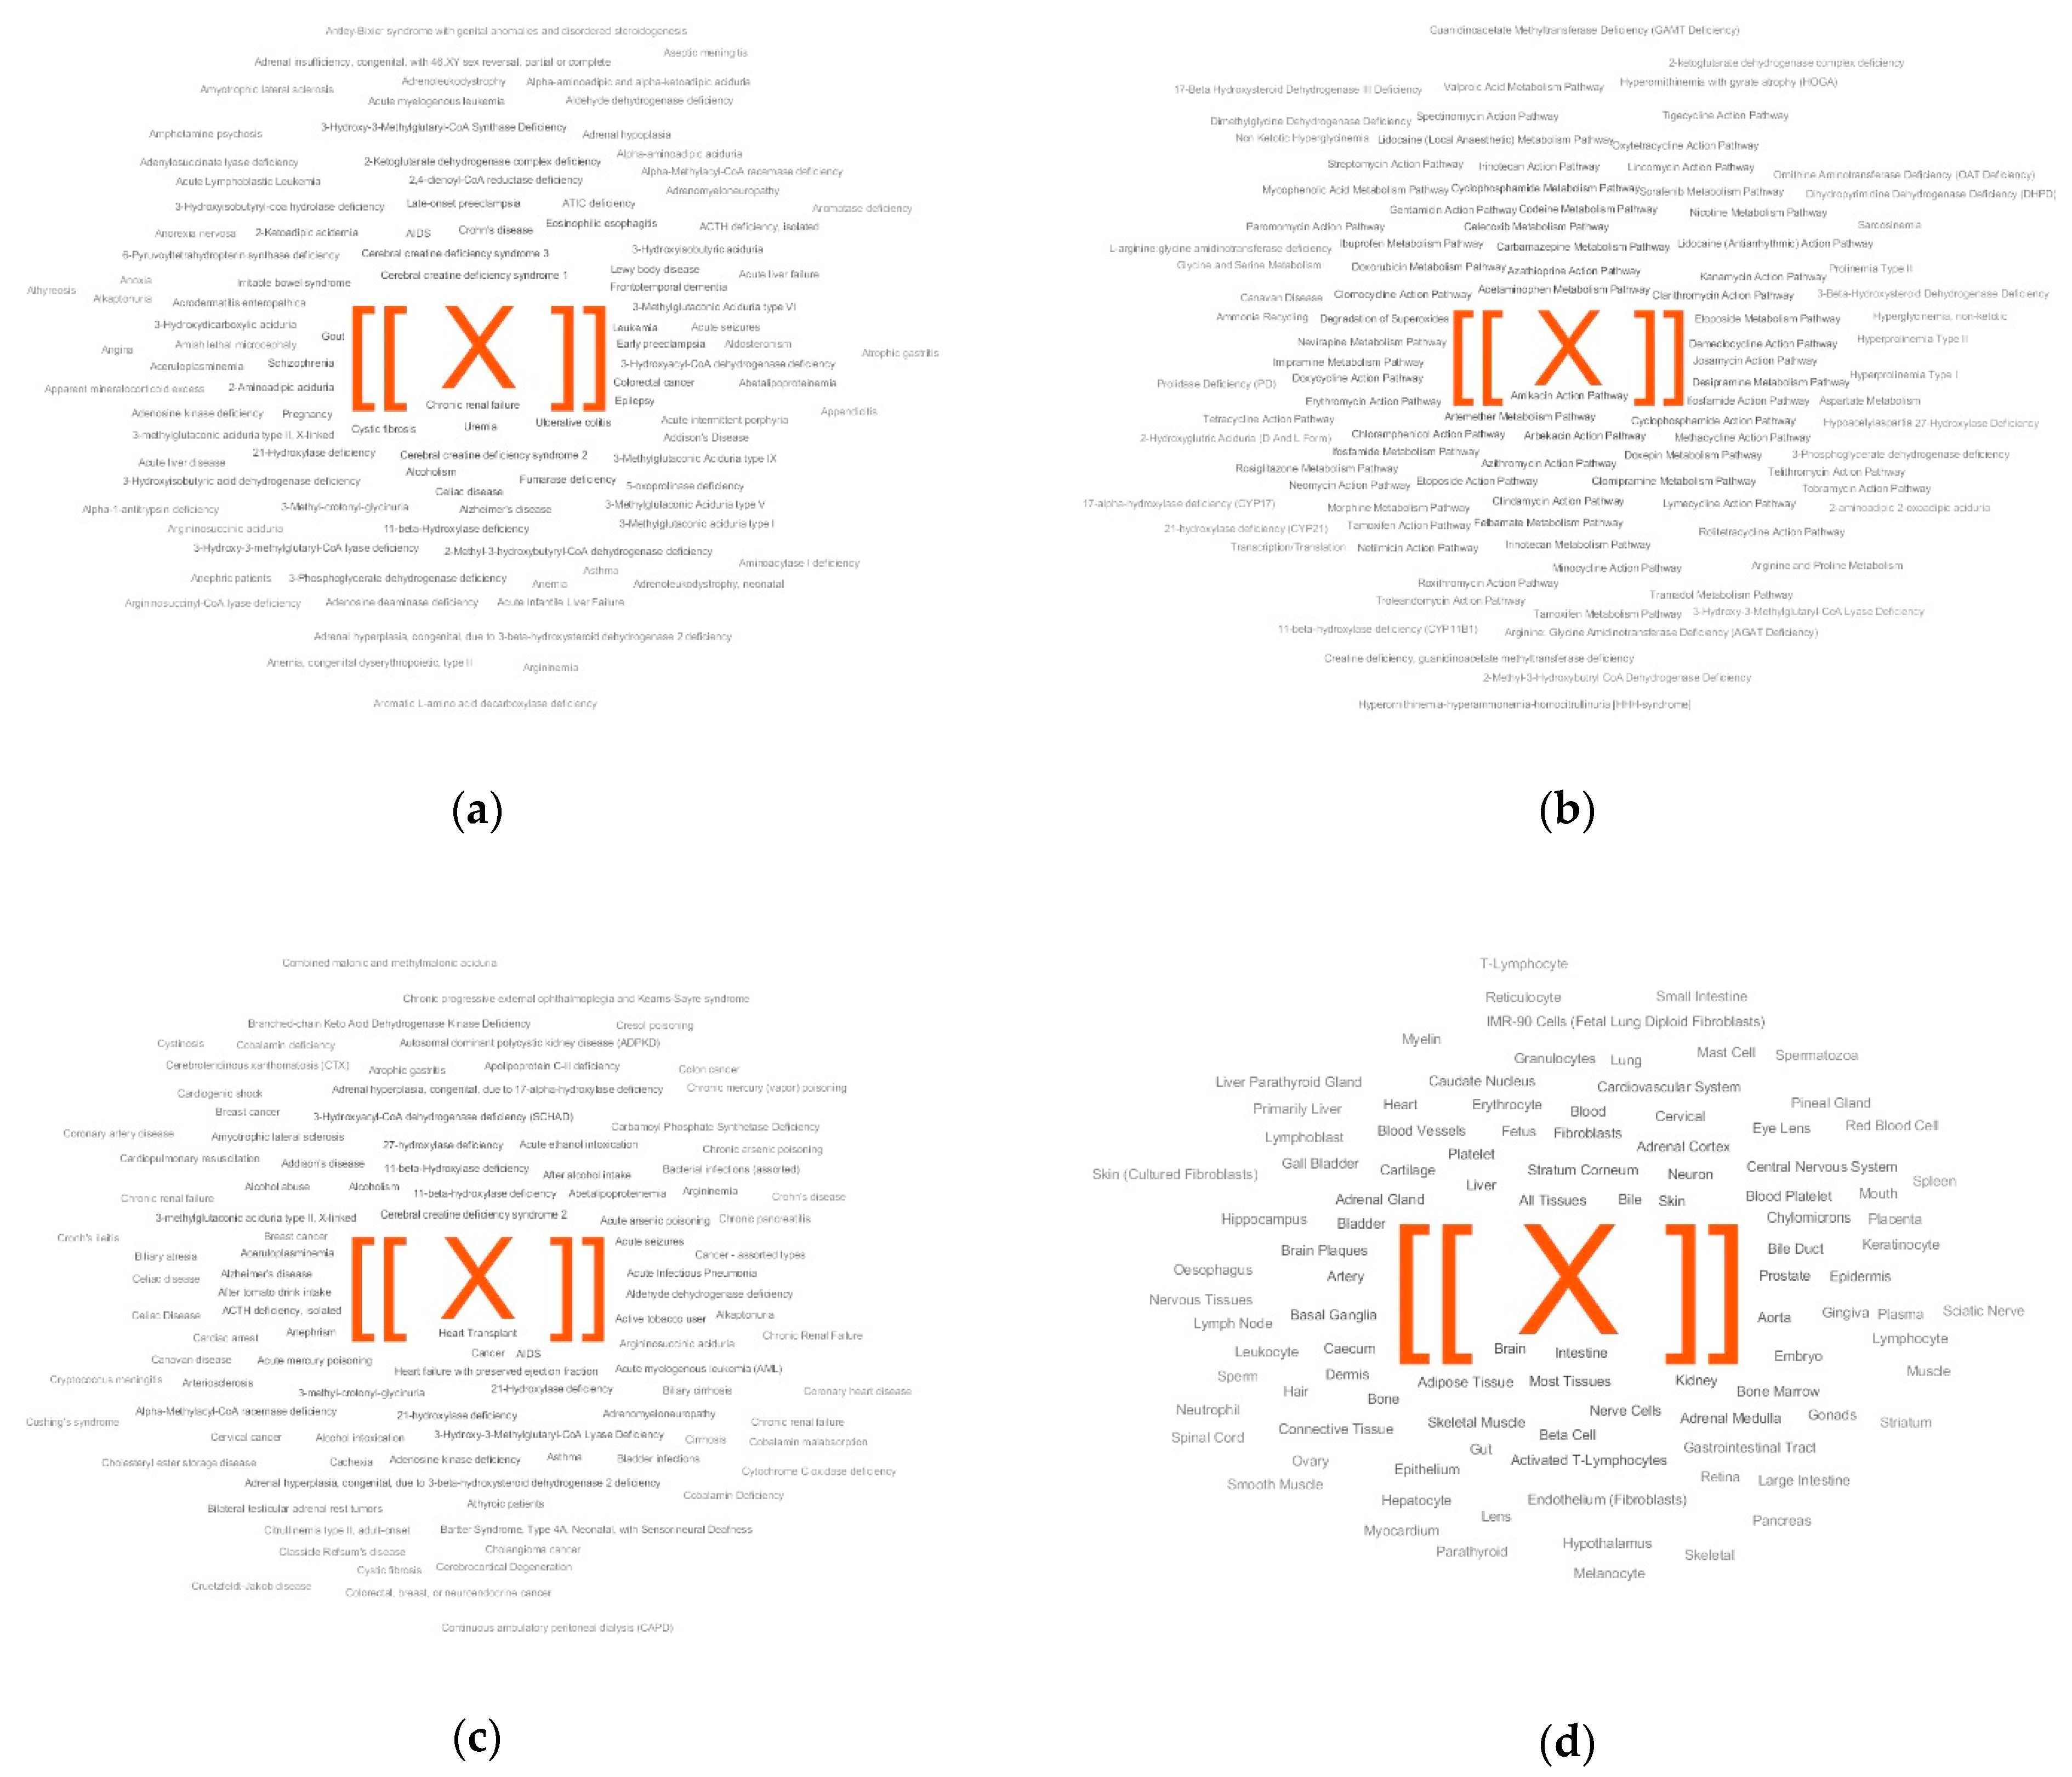
2.2. Metabolite Set Overrepresentation Patterns in the LDT Output
2.3. Diagnostic Performance of the LDT
2.4. Diagnosis of PD by the LDT
2.5. LDT Output for a ‘Healthy’ Individual
3. Discussion
- Confirmation of a person’s healthy state. This option of the LDT is the most obvious; the output of the LDT in this case is self-explanatory and comprehensively confirms human health at the molecular level. The LDT shows that the detected deviations in the blood composition do not form any patterns specific to a disease or pathology. So, the LDT is ready for use to determine wellness and longevity. It is expected that the healthy state can be confirmed by the LDT and that any abnormalities that will appear at the molecular level can be detected in a timely manner, which lays the foundation for a long and quality life.
- Score-based diagnostics. Score-based diagnostics requires control samples and samples from a cohort of patients with disease. The advantage of such diagnostics is the absence of human error in diagnosis and possible full automation.
- Disease diagnosis based on metabolite set overrepresentation (i.e., without diagnostic scoring). This option of the LDT is ready to use (i.e., cohorts are not required) for the diagnosis of a wide diversity of diseases. The metabolite set names cloud allows visualization of the LDT output data that a physician can interpret. An example of this is demonstrated in this paper for the diagnosis of PD, although, among the LDT outputs, there were also results that were difficult to interpret. It is possible that the effectiveness of the LDT output interpretation will increase as further LDT output data are accumulated. Most importantly, the LDT is panoramic in terms of measuring substances and untargeted in terms of diagnosing diseases, which in the end makes it especially valuable.
4. Materials and Methods
4.1. Mass Spectra of Blood Plasma

| Characteristics | Values | |
|---|---|---|
| Subjects with PD | Control Subjects | |
| Number | 28 | 28 |
| Gender (male/female) | 14/14 | 14/14 |
| Age (years; mean ± s.d. (range)) | 62.6 ± 8.6 (37–77) | 62.8 ± 8.7 (45–77) |
| PD stages (1/1.5/2/2.5) 1 | 6/6/12/4 | - |
4.2. Compound Annotation
4.3. Metabolite Set Overrepresentation Analysis
4.4. Analysis of Individual Samples by the LDT
5. Conclusions
Author Contributions
Funding
Institutional Review Board Statement
Informed Consent Statement
Data Available Statement
Conflicts of Interest
References
- Trifonova, O.; Lokhov, P.; Archakov, A. Postgenomics diagnostics: Metabolomics approaches to human blood profiling. OMICS 2013, 17, 550–559. [Google Scholar] [CrossRef]
- Omenn, G.S.; DeAngelis, C.D.; DeMets, D.L.; Fleming, T.R.; Geller, G.; Gray, J.; Hayes, D.F.; Henderson, G.I.; Kessler, L.; Lapidus, S.; et al. Evolution of Translational Omics: Lessons Learned and the Path Forward—Institute of Medicine; National Academies Press: Washington, DC, USA, 2012; ISBN 0309224185. [Google Scholar]
- Nass, S.J.; Moses, H.L. Cancer Biomarkers: The Promises and Challenges of Improving Detection and Treatment; National Academies Press: Washington, DC, USA, 2007; ISBN 0309667119. [Google Scholar]
- FDA. Laboratory Developed Tests. Available online: https://www.fda.gov/medical-devices/vitro-diagnostics/laboratory-developed-tests (accessed on 5 October 2018).
- Burchard, P.R.; Abou, T.A.N.; Lefferts, J.A.; Lewis, L.D.; Tsongalis, G.J.; Cervinski, M.A. Development of a rapid clinical TPMT genotyping assay. Clin. Biochem. 2014, 47, 126–129. [Google Scholar] [CrossRef] [PubMed]
- Munari, E.; Zamboni, G.; Lunardi, G.; Marconi, M.; Brunelli, M.; Martignoni, G.; Netto, G.J.; Quatrini, L.; Vacca, P.; Moretta, L.; et al. PD-L1 expression in non–small cell lung cancer: Evaluation of the diagnostic accuracy of a laboratory-developed test using clone E1L3N in comparison with 22C3 and SP263 assays. Hum. Pathol. 2019, 90, 54–59. [Google Scholar] [CrossRef] [PubMed]
- Fiset, P.O.; Labbé, C.; Young, K.; Craddock, K.J.; Smith, A.C.; Tanguay, J.; Pintilie, M.; Wang, R.; Torlakovic, E.; Cheung, C.; et al. Anaplastic lymphoma kinase 5A4 immunohistochemistry as a diagnostic assay in lung cancer: A Canadian reference testing center’s results in population-based reflex testing. Cancer 2019, 125, 4043–4051. [Google Scholar] [CrossRef] [PubMed]
- Tinawi-Aljundi, R.; King, L.; Knuth, S.T.; Gildea, M.; Ng, C.; Kahl, J.; Dion, J.; Young, C.; Schervish, E.W.; Frontera, J.R.; et al. One-year monitoring of an oligonucleotide fluorescence in situ hybridization probe panel laboratory-developed test for bladder cancer detection. Res. Rep. Urol. 2015, 7, 49–55. [Google Scholar]
- Brukner, I.; Eintracht, S.; Forgetta, V.; Papadakis, A.I.; Spatz, A.; Oughton, M. Laboratory-developed test for detection of acute Clostridium difficile infections with the capacity for quantitative sample normalization. Diagn. Microbiol. Infect. Dis. 2019, 95, 113–118. [Google Scholar] [CrossRef]
- Kulis-Horn, R.K.; Tiemann, C. Evaluation of a laboratory-developed test for simultaneous detection of norovirus and rotavirus by real-time RT-PCR on the Panther Fusion® system. Eur. J. Clin. Microbiol. Infect. Dis. 2020, 39, 103–112. [Google Scholar] [CrossRef] [Green Version]
- Calvert, J.; Saber, N.; Hoffman, J.; Das, R. Machine-learning-based laboratory developed test for the diagnosis of sepsis in high-risk patients. Diagnostics 2019, 9, 20. [Google Scholar] [CrossRef] [Green Version]
- Lokhov, P.G.; Trifonova, O.P.; Maslov, D.L.; Lichtenberg, S.; Balashova, E.E. Diagnosis of Parkinson’s disease by a metabolomics-based laboratory-developed test (LDT). Diagnostics 2020, 10, 332. [Google Scholar] [CrossRef]
- Wishart, D.S.; Feunang, Y.D.; Marcu, A.; Guo, A.C.; Liang, K.; Vázquez-Fresno, R.; Sajed, T.; Johnson, D.; Li, C.; Karu, N.; et al. HMDB 4.0: The human metabolome database for 2018. Nucleic Acids Res. 2018, 46, D608–D617. [Google Scholar] [CrossRef]
- Sommer, A.; Winner, B.; Prots, I. The Trojan horse—Neuroinflammatory impact of T cells in neurodegenerative diseases. Mol. Neurodegener. 2017, 12, 78. [Google Scholar] [CrossRef] [Green Version]
- Lei, S.; Powers, R. NMR Metabolomics Analysis of Parkinson’s Disease. Curr. Metab. 2013, 1, 191–209. [Google Scholar] [CrossRef] [PubMed] [Green Version]
- Chen-Plotkin, A.S.; Albin, R.; Alcalay, R.; Babcock, D.; Bajaj, V.; Bowman, D.; Buko, A.; Cedarbaum, J.; Chelsky, D.; Cookson, M.R.; et al. Finding useful biomarkers for Parkinson s disease. Sci. Transl. Med. 2018, 10, 454. [Google Scholar] [CrossRef] [PubMed]
- Lokhov, P.G.; Balashova, E.E.; Trifonova, O.P.; Maslov, D.L.; Ponomarenko, E.A.; Archakov, A.I. Mass Spectrometry-Based Metabolomics Analysis of Obese Patients’ Blood Plasma. Int. J. Mol. Sci. 2020, 21, 568. [Google Scholar] [CrossRef] [PubMed] [Green Version]
- Dorval, V.; Hébert, S.S. LRRK2 in transcription and translation regulation: Relevance for Parkinson’s disease. Front. Neurol. 2012, 3, 12. [Google Scholar] [CrossRef] [PubMed] [Green Version]
- Parlato, R.; Liss, B. How Parkinson’s disease meets nucleolar stress. Biochim. Biophys. Acta Mol. Basis Dis. 2014, 1842, 791–797. [Google Scholar] [CrossRef] [PubMed] [Green Version]
- Kalia, L.V.; Lang, A.E. Parkinson’s disease. Lancet 2015, 386, 896–912. [Google Scholar] [CrossRef]
- Eckert, G.P.; Lipka, U.; Muller, W.E. Omega-3 fatty acids in neurodegenerative diseases: Focus on mitochondria. Prostaglandins Leukot. Essent. Fat. Acids 2013, 88, 105–114. [Google Scholar] [CrossRef]
- Birtwistle, J.; Baldwin, D. Role of dopamine in schizophrenia and Parkinson’s disease. Br. J. Nurs. 1998, 7, 832–834. [Google Scholar] [CrossRef]
- Brisch, R.; Saniotis, A.; Wolf, R.; Bielau, H.; Bernstein, H.G.; Steiner, J.; Bogerts, B.; Braun, K.; Kumaratilake, J.; Henneberg, M.; et al. The role of dopamine in schizophrenia from a neurobiological and evolutionary perspective: Old fashioned, but still in vogue. Front. Psychiatry 2014, 19, 47. [Google Scholar]
- Engleman, E.A.; Keen, E.J.; Tilford, S.S.; Thielen, R.J.; Morzorati, S.L. Ethanol drinking reduces extracellular dopamine levels in the posterior ventral tegmental area of nondependent alcohol-preferring rats. Alcohol 2011, 45, 549–557. [Google Scholar] [CrossRef] [Green Version]
- Urban, N.B.L.; Kegeles, L.S.; Slifstein, M.; Xu, X.; Martinez, D.; Sakr, E.; Castillo, F.; Moadel, T.; O’Malley, S.S.; Krystal, J.H.; et al. Sex differences in striatal dopamine release in young adults after oral alcohol challenge: A positron emission tomography imaging study with [11C]raclopride. Biol. Psychiatry 2010, 68, 689–696. [Google Scholar] [CrossRef] [PubMed] [Green Version]
- Szabó, N.; Kincses, Z.T.; Toldi, J.; Vécsei, L. Altered tryptophan metabolism in Parkinson’s disease: A possible novel therapeutic approach. J. Neurol. Sci. 2011, 310, 256–260. [Google Scholar] [CrossRef] [PubMed]
- Wise, A.H.; Yang, A.; Naik, H.; Stauffer, C.; Zeid, N.; Liong, C.; Balwani, M.; Desnick, R.J.; Alcalay, R.N. Parkinson’s disease prevalence in Fabry disease: A survey study. Mol. Genet. Metab. Rep. 2018, 14, 27–30. [Google Scholar] [CrossRef] [PubMed]
- Lokhov, P.G.; Dashtiev, M.I.; Moshkovskii, S.A.; Archakov, A.I. Metabolite profiling of blood plasma of patients with prostate cancer. Metabolomics 2010, 6, 156–163. [Google Scholar] [CrossRef]
- Lokhov, P.G.; Kharybin, O.N.; Archakov, A.I. Diagnosis of lung cancer based on direct-infusion electrospray mass spectrometry of blood plasma metabolites. Int. J. Mass Spectrom. 2011, 309, 200–205. [Google Scholar] [CrossRef]
- Lokhov, P.G.; Trifonova, O.P.; Maslov, D.L.; Archakov, A.I. Blood plasma metabolites and the risk of developing lung cancer in Russia. Eur. J. Cancer Prev. 2013, 22, 335–341. [Google Scholar] [CrossRef]
- Lokhov, P.G.; Balashova, E.E.; Voskresenskaya, A.A.; Trifonova, O.P.; Maslov, D.L.; Archakov, A.I. Mass spectrometric signatures of blood plasma metabolome for disease diagnostics. Biomed. Rep. 2016, 4, 122–126. [Google Scholar] [CrossRef]
- Lokhov, P.G.; Dashtiev, M.I.; Bondartsov, L.V.; Lisitsa, A.V.; Moshkovskiĭ, S.A.; Archakov, A.I. Metabolic fingerprinting of blood plasma for patients with prostate cancer. Biomed. Khim 2009, 55, 247–254. [Google Scholar] [CrossRef]
- Lokhov, P.G.; Trifonova, O.P.; Maslov, D.L.; Balashova, E.E.; Archakov, A.I.; Shestakova, E.A.; Shestakova, M.V.; Dedov, I.I. Diagnosing impaired glucose tolerance using direct infusion mass spectrometry of blood plasma. PLoS ONE 2014, 9, e105343. [Google Scholar] [CrossRef] [Green Version]
- Balashova, E.E.; Lokhov, P.G.; Maslov, D.L.; Trifonova, O.P.; Khasanova, D.M.; Zalyalova, Z.A.; Nigmatullina, R.R.; Archakov, A.I.; Ugrumov, M.V. Plasma Metabolome Signature in Patients with Early-stage Parkinson Disease. Curr. Metab. 2018, 6, 75–82. [Google Scholar] [CrossRef]
- Trifonova, O.P.; Lokhov, P.G.; Archakov, A.I. Metabolic profiling of human blood. Biochem. Suppl. Ser. B Biomed. Chem. 2013, 7, 179–186. [Google Scholar] [CrossRef]
- Lokhov, P.G.; Archakov, A.I. Mass spectrometry methods in metabolomics. Biochem. Suppl. Ser. B Biomed. Chem. 2009, 3, 1–9. [Google Scholar] [CrossRef]
- Lokhov, P.G.; Arckakov, A.I. Mass spectrometry methods in metabolomics. Biomeditsinskaya Khimiya 2008, 54, 497–511. [Google Scholar] [CrossRef]
- Lokhov, P.G.; Maslov, D.L.; Kharibin, O.N.; Balashova, E.E.; Archakov, A.I. Label-free data standardization for clinical metabolomics. BioData Min. 2017, 10, 10. [Google Scholar] [CrossRef] [Green Version]
- Viant, M.R.; Kurland, I.J.; Jones, M.R.; Dunn, W.B. How close are we to complete annotation of metabolomes? Curr. Opin. Chem. Biol. 2017, 36, 64–69. [Google Scholar] [CrossRef]
- de Jong, F.; Beecher, C.; Raskind, A.; Chamberlain, C.; Guingab, J.; Garrett, T. MetaboNews. Available online: http://www.metabonews.ca/Aug2017/MetaboNews_Aug2017.htm (accessed on 10 August 2017).
- Rogers, S.; Scheltema, R.A.; Girolami, M.; Breitling, R. Probabilistic assignment of formulas to mass peaks in metabolomics experiments. Bioinformatics 2009, 25, 512–518. [Google Scholar] [CrossRef] [Green Version]
- Silva, R.R.; Jourdan, F.; Salvanha, D.M.; Letisse, F.; Jamin, E.L.; Guidetti-Gonzalez, S.; Labate, C.A.; Vêncio, R.Z.N. ProbMetab: An R package for Bayesian probabilistic annotation of LC-MS-based metabolomics. Bioinformatics 2014, 30, 1336–1337. [Google Scholar] [CrossRef] [Green Version]
- Sumner, L.W.; Amberg, A.; Barrett, D.; Beale, M.H.; Beger, R.; Daykin, C.A.; Fan, T.W.-M.; Fiehn, O.; Goodacre, R.; Griffin, J.L.; et al. Proposed minimum reporting standards for chemical analysis Chemical Analysis Working Group (CAWG) Metabolomics Standards Initiative (MSI). Metabolomics 2007, 3, 211–221. [Google Scholar] [CrossRef] [Green Version]
- Kennedy, A.D.; Wittmann, B.M.; Evans, A.M.; Miller, L.A.D.; Toal, D.R.; Lonergan, S.; Elsea, S.H.; Pappan, K.L. Metabolomics in the clinic: A review of the shared and unique features of untargeted metabolomics for clinical research and clinical testing. J. Mass Spectrom. 2018, 53, 1143–1154. [Google Scholar] [CrossRef]
- Blochberger, A.; Jones, S. Parkinson’s disease clinical features and diagnosis. Clin. Pharm. 2011, 3, 361–366. [Google Scholar]
- Gelb, D.J.; Oliver, E.; Gilman, S. Diagnostic criteria for Parkinson disease. Arch. Neurol. 1999, 56, 33–39. [Google Scholar] [CrossRef] [PubMed]
- Trifonova, O.P.; Maslov, D.L.; Balashova, E.E.; Urazgildeeva, G.R.; Abaimov, D.A.; Fedotova, E.Y.; Poleschuk, V.V.; Llarioshkin, S.N.; Lokhov, P.G. Parkinson’s Disease: Available Clinical and Promising Omics Tests for Diagnostics, Disease Risk Assessment, and Pharmacotherapy Personalization. Diagnostics 2020, 10, 339. [Google Scholar] [CrossRef] [PubMed]
- Trifonova, O.P.; Maslov, D.L.; Balashova, E.E.; Lokhov, P.G. Evaluation of dried blood spot sampling for clinical metabolomics: Effects of different papers and sample storage stability. Metabolites 2019, 9, 277. [Google Scholar] [CrossRef] [Green Version]
- Goetz, C.G.; Poewe, W.; Rascol, O.; Sampaio, C.; Stebbins, G.T.; Counsell, C.; Giladi, N.; Holloway, R.G.; Moore, C.G.; Wenning, G.K.; et al. Movement Disorder Society Task Force report on the Hoehn and Yahr staging scale: Status and recommendations. Mov. Disord. 2004, 19, 1020–1028. [Google Scholar] [CrossRef]
- Steuer, R.; Kurths, J.; Fiehn, O.; Weckwerth, W. Observing and interpreting correlations in metabolomic networks. Bioinformatics 2003, 19, 1019–1026. [Google Scholar] [CrossRef] [Green Version]
- Martens, H.A.; Dardenne, P. Validation and verification of regression in small data sets. Chemom. Intell. Lab. Syst. 1998, 44, 99–121. [Google Scholar] [CrossRef]


| Parameter | Value |
|---|---|
| Detection mass range (m/z) | 45–900 |
| Detected compound mass peaks (mean ± s.d.) | 9664 ± 620 1 |
| Masses submitted to metabolite search block | 14,857 |
| ‘Mass peak/metabolite name’ pairs submitted to the annotation algorithm | 31,724 |
| Mass peaks with annotated compound(s) | 2741 |
| Unique compound annotations | 709 |
| Metabolite Set | Representation Score | Over-Representation | Diagnostic Performance | |||
|---|---|---|---|---|---|---|
| Controls | Cases | Sensitivity | Specificity | Accuracy | ||
| Disease-associated metabolite sets | ||||||
| Alzheimer’s disease | 21.9 | 53.8 | 31.9 | 75.0 | 71.4 | 73.2 |
| Frontotemporal dementia | 24.4 | 53.0 | 28.6 | 75.0 | 67.9 | 71.4 |
| Lewy body disease | 24.4 | 53.0 | 28.6 | 75.0 | 67.9 | 71.4 |
| Early preeclampsia | 15.0 | 42.5 | 27.5 | 67.9 | 71.4 | 69.6 |
| Autosomal dominant polycystic kidney disease | 12.6 | 40.1 | 27.4 | 60.7 | 78.6 | 69.6 |
| Pregnancy | 16.8 | 43.6 | 26.8 | 75.0 | 67.9 | 71.4 |
| Ulcerative colitis | 27.5 | 53.0 | 25.5 | 78.6 | 60.7 | 69.6 |
| Colorectal cancer | 26.8 | 52.0 | 25.1 | 89.3 | 57.1 | 73.2 |
| Periodontal disease | 20.8 | 45.8 | 25.0 | 60.7 | 78.6 | 69.6 |
| Pancreatic cancer | 23.2 | 47.7 | 24.5 | 64.3 | 71.4 | 67.9 |
| Late-onset preeclampsia | 12.1 | 36.7 | 24.5 | 60.7 | 75.0 | 67.9 |
| Crohn’s disease | 25.9 | 50.0 | 24.2 | 71.4 | 64.3 | 67.9 |
| Schizophrenia | 25.0 | 48.3 | 23.2 | 64.3 | 71.4 | 67.9 |
| Eosinophilic esophagitis | 28.5 | 51.1 | 22.6 | 64.3 | 71.4 | 67.9 |
| Lipoyltransferase 1 deficiency | 10.2 | 32.7 | 22.5 | 71.4 | 67.9 | 69.6 |
| Leukemia | 9.0 | 31.3 | 22.3 | 75.0 | 75.0 | 75.0 |
| Maple syrup urine disease | 16.3 | 37.5 | 21.1 | 67.9 | 67.9 | 67.9 |
| Perillyl alcohol administration for cancer treatment | 12.9 | 33.9 | 21.1 | 67.9 | 71.4 | 69.6 |
| Heart failure | 3.3 | 24.0 | 20.7 | 53.6 | 85.7 | 69.6 |
| Rheumatoid arthritis | 1.6 | 20.8 | 19.2 | 46.4 | 89.3 | 67.9 |
| Parameters for the whole group of metabolite sets: | 78.6 | 60.7 | 69.6 | |||
| Pathway-associated metabolite sets | ||||||
| Transcription/translation | 17.4 | 43.2 | 25.7 | 71.4 | 71.4 | 71.4 |
| Dopa-responsive dystonia | 13.4 | 34.8 | 21.4 | 46.4 | 82.1 | 64.3 |
| Fatty acid elongation in mitochondria | 13.4 | 34.8 | 21.4 | 46.4 | 82.1 | 64.3 |
| Hyperphenylalaniemia due to guanosine triphosphate cyclohydrolase deficiency | 13.4 | 34.8 | 21.4 | 46.4 | 82.1 | 64.3 |
| Hyperphenylalaninemia due to 6-pyruvoyltetrahydropterin synthase deficiency (PTPS) | 13.4 | 34.8 | 21.4 | 46.4 | 82.1 | 64.3 |
| Hyperphenylalaninemia due to DHPR-deficiency | 13.4 | 34.8 | 21.4 | 46.4 | 82.1 | 64.3 |
| Long-chain-3-hydroxyacyl-coa dehydrogenase deficiency (LCHAD) | 13.4 | 34.8 | 21.4 | 46.4 | 82.1 | 64.3 |
| Pterine biosynthesis | 13.4 | 34.8 | 21.4 | 46.4 | 82.1 | 64.3 |
| Segawa syndrome | 13.4 | 34.8 | 21.4 | 46.4 | 82.1 | 64.3 |
| Sepiapterin reductase deficiency | 13.4 | 34.8 | 21.4 | 46.4 | 82.1 | 64.3 |
| Glutaminolysis and cancer | 4.1 | 22.0 | 17.8 | 57.1 | 75.0 | 66.1 |
| Ubiquinone biosynthesis | 0.1 | 16.1 | 16.0 | 28.6 | 92.9 | 60.7 |
| Aspartate metabolism | 4.2 | 19.4 | 15.2 | 57.1 | 78.6 | 67.9 |
| Canavan disease | 4.2 | 19.4 | 15.2 | 57.1 | 78.6 | 67.9 |
| Hypoacetylaspartia | 4.2 | 19.4 | 15.2 | 57.1 | 78.6 | 67.9 |
| 2-Hydroxyglutric aciduria (D and L Form) | 1.0 | 16.1 | 15.1 | 25.0 | 100.0 | 62.5 |
| 4-Hydroxybutyric Aciduria/succinic semialdehyde Dehydrogenase deficiency | 1.0 | 16.1 | 15.1 | 25.0 | 100.0 | 62.5 |
| Glutamate metabolism | 1.0 | 16.1 | 15.1 | 25.0 | 100.0 | 62.5 |
| Homocarnosinosis | 1.0 | 16.1 | 15.1 | 25.0 | 100.0 | 62.5 |
| Hyperinsulinism-hyperammonemia syndrome | 1.0 | 16.1 | 15.1 | 25.0 | 100.0 | 62.5 |
| Parameters for the whole group of metabolite sets: | 82.1 | 64.3 | 73.2 | |||
| Abnormal concentration-associated metabolite sets | ||||||
| Schizophrenia | 10.9 | 33.6 | 22.7 | 64.3 | 75.0 | 69.6 |
| Alcohol intoxication | 2.7 | 24.1 | 21.4 | 32.1 | 96.4 | 64.3 |
| Drunk driver | 2.7 | 24.1 | 21.4 | 32.1 | 96.4 | 64.3 |
| Pellagra | 13.4 | 34.8 | 21.4 | 46.4 | 82.1 | 64.3 |
| Heart failure | 3.3 | 24.0 | 20.6 | 53.6 | 89.3 | 71.4 |
| Fabry disease | 8.0 | 18.8 | 10.7 | 25.0 | 89.3 | 57.1 |
| Epilepsy | 0.5 | 6.8 | 6.3 | 21.4 | 92.9 | 57.1 |
| Heart transplant | 5.0 | 11.0 | 6.0 | 50.0 | 67.9 | 58.9 |
| Lesch-Nyhan syndrome | 0.7 | 5.8 | 5.1 | 75.0 | 57.1 | 66.1 |
| Dimethylglycinuria | 4.7 | 9.8 | 5.1 | 32.1 | 85.7 | 58.9 |
| Menstrual cycle (follicular phase) | 0.0 | 2.7 | 2.7 | 42.9 | 82.1 | 62.5 |
| Menstrual cycle (luteal phase) | 0.0 | 2.7 | 2.7 | 42.9 | 82.1 | 62.5 |
| Menstrual cycle (midcycle) | 0.0 | 2.7 | 2.7 | 42.9 | 82.1 | 62.5 |
| ACTH deficiency, isolated | 0.0 | 2.7 | 2.7 | 39.3 | 85.7 | 62.5 |
| Small intestinal bacterial overgrowth | 0.0 | 2.7 | 2.7 | 28.6 | 89.3 | 58.9 |
| Crohn’s disease | 0.0 | 2.7 | 2.7 | 28.6 | 89.3 | 58.9 |
| HIV and diarrhea | 0.0 | 2.7 | 2.7 | 28.6 | 89.3 | 58.9 |
| Glucocorticoid resistance | 0.0 | 2.7 | 2.7 | 35.7 | 89.3 | 62.5 |
| Tic disorder | 0.0 | 2.7 | 2.7 | 35.7 | 89.3 | 62.5 |
| Thymidine phosphorylase deficiency | 0.0 | 2.7 | 2.7 | 39.3 | 82.1 | 60.7 |
| Parameters for the whole group of metabolite sets: | 82.1 | 64.3 | 73.2 | |||
| Location-based metabolite sets | ||||||
| Testes | 11.0 | 39.4 | 28.4 | 57.1 | 85.7 | 71.4 |
| Prostate | 22.8 | 51.2 | 28.4 | 67.9 | 75.0 | 71.4 |
| Kidney | 15.8 | 44.1 | 28.3 | 67.9 | 75.0 | 71.4 |
| Fibroblasts | 19.5 | 47.8 | 28.2 | 78.6 | 67.9 | 73.2 |
| Placenta | 14.6 | 42.1 | 27.5 | 64.3 | 78.6 | 71.4 |
| Spleen | 12.8 | 40.1 | 27.3 | 60.7 | 82.1 | 71.4 |
| Intestine | 19.7 | 46.4 | 26.7 | 67.9 | 71.4 | 69.6 |
| Bladder | 16.4 | 42.7 | 26.4 | 71.4 | 75.0 | 73.2 |
| Neuron | 11.1 | 36.8 | 25.6 | 78.6 | 71.4 | 75.0 |
| Pancreas | 15.5 | 40.6 | 25.1 | 71.4 | 71.4 | 71.4 |
| Gut | 8.2 | 31.6 | 23.4 | 60.7 | 78.6 | 69.6 |
| Platelet | 7.0 | 27.6 | 20.5 | 60.7 | 75.0 | 67.9 |
| Liver | 15.9 | 35.7 | 19.8 | 64.3 | 71.4 | 67.9 |
| Muscle | 13.4 | 32.8 | 19.4 | 71.4 | 78.6 | 75.0 |
| Skeletal muscle | 10.8 | 28.0 | 17.2 | 60.7 | 75.0 | 67.9 |
| All tissues | 13.6 | 30.4 | 16.8 | 75.0 | 60.7 | 67.9 |
| Skin | 3.5 | 20.1 | 16.6 | 64.3 | 64.3 | 64.3 |
| Myelin | 5.3 | 18.4 | 13.1 | 60.7 | 85.7 | 73.2 |
| Adipose tissue | 5.9 | 17.7 | 11.8 | 64.3 | 71.4 | 67.9 |
| Stratum corneum | 1.1 | 12.5 | 11.4 | 50.0 | 89.3 | 69.6 |
| Parameters for the whole group of metabolite sets: | 71.4 | 71.4 | 71.4 | |||
| Parameters for the whole groups of metabolite sets: | 89.3 | 57.1 | 73.2 | |||
Publisher’s Note: MDPI stays neutral with regard to jurisdictional claims in published maps and institutional affiliations. |
© 2020 by the authors. Licensee MDPI, Basel, Switzerland. This article is an open access article distributed under the terms and conditions of the Creative Commons Attribution (CC BY) license (http://creativecommons.org/licenses/by/4.0/).
Share and Cite
Lokhov, P.G.; Maslov, D.L.; Lichtenberg, S.; Trifonova, O.P.; Balashova, E.E. Holistic Metabolomic Laboratory-Developed Test (LDT): Development and Use for the Diagnosis of Early-Stage Parkinson’s Disease. Metabolites 2021, 11, 14. https://doi.org/10.3390/metabo11010014
Lokhov PG, Maslov DL, Lichtenberg S, Trifonova OP, Balashova EE. Holistic Metabolomic Laboratory-Developed Test (LDT): Development and Use for the Diagnosis of Early-Stage Parkinson’s Disease. Metabolites. 2021; 11(1):14. https://doi.org/10.3390/metabo11010014
Chicago/Turabian StyleLokhov, Petr G., Dmitry L. Maslov, Steven Lichtenberg, Oxana P. Trifonova, and Elena E. Balashova. 2021. "Holistic Metabolomic Laboratory-Developed Test (LDT): Development and Use for the Diagnosis of Early-Stage Parkinson’s Disease" Metabolites 11, no. 1: 14. https://doi.org/10.3390/metabo11010014