

Abstract
For the practical application of carbon-knife with fine carbon-ion beams, the quantification of the dose distribution is essential and requires a high spatial resolution. We propose a novel method to quantify dose distributions with a spatial resolution smaller than the dosimeter size. The proposed method innovates the iterative reconstruction technique. Using a diode dosimeter with a sensitive area of 1 mm2, two-dimensional dose-area-product (DAP) distributions were measured at a 0.1 mm step at the surface and near the Bragg peak depths for fine carbon-ion beams of ∼1 mm size at the full width at half maximum (FWHM). Then, the dose distributions were reconstructed with a spatial resolution of 0.1 × 0.1 mm2 from the measured DAP distributions. However, an unnaturally high noise was observed in the reconstructed dose distributions, which were considered to originate from the measurement reproducibility errors of the DAP distributions estimated to be 2.5%–3%. Therefore, a low-pass filtering process was implemented to reduce the errors on the reconstructed dose distributions. The optimum cut-off frequencies of the low-pass filter were estimated depending on the amplitude of the induced noise. Using the filtering process with the obtained optimum cut-off frequency, the dose distribution was quantified with an average error of approximately 3% or less with respect to the peak value, when the actual measurement had an error of 3%. In the reconstructed dose rate distributions, a steep penumbra P80-20 ∼ 0.2 mm was observed at the surface, and a dose rate at the center axis of ∼90 Gy s−1 and a beam size of ∼1.1 mm at FWHM near the Bragg peak were obtained. The proposed method is expected to be useful for the measurement-based determination of microbeam models for commissioning and dose distribution calculations toward carbon-knife applications.
Export citation and abstract BibTeX RIS

Original content from this work may be used under the terms of the Creative Commons Attribution 4.0 license. Any further distribution of this work must maintain attribution to the author(s) and the title of the work, journal citation and DOI.
1. Introduction
Stereotactic radiosurgery (SRS) is a kind of external radiotherapy used for the treatment of small intracranial lesions (Harris & M Das 2020, Kondziolka et al 2015). Small and sharp field dose distributions of SRS are advantageous for accurately targeting tumours and sparing surrounding normal tissue. However, the penumbra size is limited to at least a few millimetres using photon beams (Keller et al 2007, Sahgal et al 2017) or more in actual clinical situations (Flickinger et al 1990, Kramer et al 1998, Shields et al 2015, Nilsen et al 2020). In SRS with photon beams including gamma knife, multiple beams with various directions surrounding the target are generally used. Consequently, widely spread lower dose distributions around the target and penumbra region may influence complications for organs at risk (OAR), such as the brain. Therefore, insufficient dose prescription may be forced in practical situations (Kirkpatrick et al 2017).
Carbon-ion cancer therapy has demonstrated a remarkable therapeutic effectiveness for more than two decades (Malouff et al 2020). A carbon-knife with fine carbon-ion beams is considered an efficacious treatment for intracranial cancerous and/or non-cancerous diseases with millimetre sizes because of its physical advantages, such as the Bragg peak with high linear energy transfer (LET) and a sharper lateral penumbra. Examinations of irradiation field formation of several to 10 mm were performed at the Gunma University Heavy Ion Medical Center (GHMC) (Keawsamur et al 2018). Then, fine carbon-ion beam formation tests of 1 mm size were initiated for application to biological irradiation in small areas. When the collimator diameter and/or beam size become smaller than a few millimetres, irrespective of whether the beam is highly focused with or without a collimator, a uniform irradiation field is no longer produced, as with the gamma knife, even if carbon-ion beams are used.
For the practical application of such fine carbon-ion beams, the quantification of the dose distribution is essential and requires high spatial resolution. For this purpose, radiochromic films are generally used for the dosimetry. A scanning resolution of 72 dpi, corresponding to 0.35 mm/pixel, is generally used for accurate quantification (Lewis et al 2012, Tagiling et al 2018) as it provides a fair balance between image resolution and dose reading accuracy. In addition, the resolution is considered to be sufficient for quality assurance as the grid size of the dose distribution in the treatment plan used for comparison with the film is usually approximately 0.5 mm or more. In this case, the spatial resolution seems to be insufficient to quantify the dose distribution of a 1 mm-sized beam. If the pixel size is set to a smaller value, the spatial resolution will increase, but the dose accuracy may deteriorate (Tagiling et al 2018). Furthermore, the most cumbersome issue is the necessity to consider the LET dependence of carbon-ion beams for the film calibration (Castriconi et al 2017, Yonai et al 2018, Kawashima et al 2020). In this case, it is necessary to know the LET at each measurement point in advance; however, the validity of the LET distribution at each local position in small carbon-ion beams, which includes the effect of edge scattering of the collimator, should be considered even though a Monte Carlo simulation is used. In addition, since there is a limited dose range within which the dose can be estimated by the film dosimetry (Seco et al 2014), measurement errors may increase at high doses and/or high dose rates of the spot carbon-ion beams. As described above, many challenges remain unaddressed regarding the use of radiochromic films to measure the dose distributions of fine carbon-ion beams. Similar problems also apply to the use of scintillators with CCD cameras (Russo et al 2017, Yogo et al 2019). Pixel semiconductor detectors are promising tools for measuring ion beams, providing two dimensionally distributed sensitive volumes with pixel sizes of less than 0.1 mm. They are used, for example, for the detection of energy deposition to measure radiation qualities such as distributions of lineal energy or LET (Tran et al 2018) and positions of ion beam tracks (Martišíková et al 2018), which are based on event-by-event detections of transmitted ions. At present, such pixel detectors do not establish the dose distribution measurements for beams with locally higher intensity used for actual treatments or the carbon-knife experiments conducted in this study.
Ionization chambers and diode dosimeters that are commonly used in commerce basically assume a uniform dose distribution at the measurement field (Giordanengo et al 2017). In this case, the dose can be estimated with high accuracy through calibration and is widely used for treatments. Contrarily, when the dose is not uniform, the amount of charge generated in the sensitive area of the dosimeter is converted to an average value based on the calibration coefficient. When a fine beam is used, the lateral dose distribution changes steeply, even in the sensitive area. Then, it becomes necessary to know the dose at each position in the region, not only the average value. In addition, the impact of the high dose rate on these dosimeters should be carefully considered for accurate dosimetry.
In this study, we propose a novel method to quantify a dose distribution with a spatial resolution smaller than the sensitive area. Here, we consider dose distributions of fine carbon-ion beams using a commercially available calibratable dosimeter. We deploy a parallel plate ionization chamber or a diode dosimeter with a small water equivalent thickness of the sensitive volume. Therefore, it is possible to perform depth dependence measurements with high spatial resolution by adjusting the water equivalent thickness to the detector in the beam direction. In the lateral plane of the beam, the dose estimation with spatial resolution less than the dosimeter size becomes an issue to be addressed. In this study, a dose distribution reconstruction method using an iterative approximation is innovated to obtain a small-sized dose distribution by deploying a dosimeter with a finite size. The value measured by the dosimeter is considered to be the integrated value in the sensitive area, i.e. dose-area product (DAP) (Palmans and Vatnisky 2016). Regarding this value as a forward projection of the dose in the area, the dose at each point can be quantified by back projection from multiple DAP measurement values around the point. Because many DAP measurements are required to obtain the reconstructed dose with small spatial resolution, it may be unsuitable for routine operations because it is time consuming. However, it is expected to be useful in the measurement-based determination of microbeam models for commissioning and dose distribution calculations toward carbon-knife applications. Furthermore, it is demonstrated that the noise of the reconstructed dose distribution obtained using this method is relatively high owing to errors in the measured values. In this paper, we present the methodology and the results of a dose distribution reconstruction for fine carbon-ion beams and examinations of the filtering process for noise reduction.
2. Materials and methods
2.1. Iterative reconstruction of dose distribution
In this study, a diode dosimeter with planar sensitive volume is considered. If the water equivalent thickness of the volume is sufficiently thin for a carbon-ion beam perpendicularly incident on the plane, the depth spatial resolution is sufficiently high. Here, we consider the dose distribution in the lateral plane. For a certain depth, the measured DAP value at the center position (X, Y) of the dosimeter, DAP(X, Y), is regarded as an area integral of dose D(x, y) at each position (x, y) within the sensitive area. Then, it can be expressed as follows:

where  is a dimensionless quantity related to the sensitive area that equals one or zero according to whether the position (x, y) is located inside or outside of the sensitive area, respectively, and the center of the area is set to the origin. In case of a circular sensitive area of radius rd, s is given as follows:
The term  expresses the sensitive area occupied in the area element
  at the position (x, y). Equation (1) indicates that the measured DAP value is the integral of the physical quantity D to be quantified; therefore, it may be regarded as the forward projection from the dose to the DAP. Then, the back projection from the measured DAP value to the dose D is considered. The back projection from one measured DAP value at a point to dose in the sensitive area is considered to be constant,
  , where S is the total sensitive area given as follows:

When many measured DAP values are obtained by scanning the dosimeter position in the plane, the dose at a certain position (x, y) can be expressed as the average of the contributions from all DAPs using the following equation:

Applying the relationship between these forward and back projections to the simultaneous iterative reconstruction technique of the multiplicative type (Gilbert 1972), the following recurrence formula for the dose D is obtained:
where DAP0 is the measured DAP, and  is the reconstructed dose at k-th iteration. This equation expresses that the ratio of the measured DAP0 value to the calculated DAP value is back-projected and multiplied by the dose D to update D. The word 'multiplicative type' in the description of the method comes from the dose updating calculation that multiplies the back projection of the ratio. The dose value is updated so that the ratio of each position becomes one, i.e. the dose converges by repeating the updating calculation so that the measured and calculated DAP values become identical. The dose distribution in the two-dimensional plane is obtained by iteratively calculating and converging equation (5).
2.2. Experiment
Carbon-ion beams with 140 MeV u−1 obtained via a synchrotron were used at an experimental irradiation port at the GHMC (Ohno et al 2011, Keawsamur et al 2018). The period of the synchrotron operation pattern was ∼2.333 s, and the beam was extracted within ∼1 s of the flat top duration. The beam transported to the irradiation room had a beam size of a standard deviation of ∼4.4 mm at a screen monitor placed at the isocenter and a beam intensity of approximately 1 × 10⁸ particles per second (pps) (Souda et al 2016). The beam center position was adjusted within 0.1 mm from the center of the screen monitor. The beam was fixed and passed through a brass collimator with a diameter of φ1 mm (nominal) and a thickness of 20 mm to generate a fine beam. An acrylic cuboid of 80 × 80 × 60 mm3 (made of polymethylmethacrylate (PMMA)) with a φ7 mm cylindrical hole in the center was used as a phantom, a diode dosimeter (PTW 60 020, sensitive area of 1 mm2) was inserted in the hole, and the top surface of the dosimeter was fixed to fit the surface of the phantom. The phantom with the diode dosimeter was mounted onto an XY stage (COMS PM80B-200XY-LMS) so that the sensitive volume disk surface was perpendicular to the beam axis. The center position of the collimator and the origin of the diode dosimeter were aligned using a laser pointer inserted in the beam line with the laser spot passed through the collimator. Acrylic plates of various thicknesses were inserted on the upper surface of the phantom to adjust the beam penetration depth. To finely adjust the penetration depth near the Bragg peak, 0.25 mm thick Mylar sheets were also used in addition to the acrylic plates. The height position of the entire phantom was adjusted so that the distance between the collimator and the top of the phantom and/or the inserted plates was constant at 2 mm. A photograph of the measurement system is shown in figure 1.
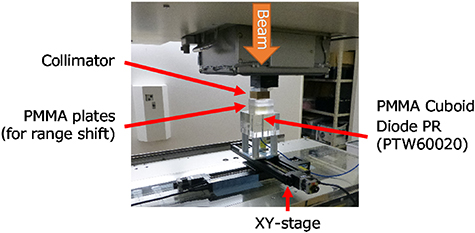
Figure 1. Photograph of the measurement system.
Download figure:
Standard image High-resolution imageThe diode dosimeter was cross-calibrated using a calibrated Advanced Markus ionization chamber (PTW 34 045) with a uniform field of scanning carbon-ion beams at the plateau of the surface depth. For the depth-DAP measurements on the central axis, the detector was fixed on the beam center axis and the thickness of the acrylic plate was adjusted. To measure the lateral DAP distributions at the surface and near the Bragg peak, the lateral plane of ± 2 mm was scanned in 0.1 mm steps. The water equivalent thicknesses of the inserted plates at the surface and near the Bragg peak were 0 mm and 42.08 mm, respectively, for the lateral distribution measurements. Here, the acrylic-to-water and Mylar-to-water stopping power ratios were estimated to be 1.16 and 1.30, respectively. The pre-set of the dose monitor output for each measurement was fixed so as to complete the measurement within one spill of the beam extracted from the synchrotron. From the measured two-dimensional DAP distribution, the dose distribution at each depth was derived with the spatial resolution of 0.1 × 0.1 mm2 by the simultaneous iterative reconstruction method (equation (5) with (dx, dy) → (Δx, Δy) = (0.1 mm, 0.1 mm)). Here, the initial dose distribution was set to be a uniform value obtained from the DAP measured at a peripheral position as a background, such as  . The maximum number of iterations k of the iterative approximation was set to 200 000 so as to converge until the variation of the dose was sufficiently small.
2.3. Examination of the filtering process
To examine the filtering process so as to reduce the error of the reconstructed dose distribution, the lateral dose distributions at each depth of the surface and the Bragg peak were obtained via the Monte Carlo simulation PHITS (ver. 3.10) (Sato et al 2018) with a spatial resolution of 0.1 × 0.1 mm2. The central peak values of the simulated dose distributions were normalized to unity and used as the reference distributions (i.e. correct answers). Random noise with a normal distribution and certain standard deviation was introduced to the predicted DAP distributions obtained from equation (1) to simulate the measured DAP distributions. Filtering processes were performed by changing the cut-off frequency of the low-pass filter to obtain filtered DAP distributions. Then, the reconstructed dose distributions from the filtered DAP distributions were compared with the reference distributions. Here, the low-pass filtering process was performed by a two-dimensional Fourier transform of the DAP distributions; the obtained two-dimensional frequency space distributions were multiplied by a unit step function in which the numerical value on the high frequency side of the cut-off frequency was set to zero. Then, a two-dimensional inverse Fourier transform was performed to derive the filtered DAP distributions. Finally, reconstructed dose distributions were obtained from the filtered DAP distributions using equation (5). To evaluate the error in the reconstruction dose distribution, the root mean square errors (RMSEs) with respect to the reference dose distributions were obtained. The dependence of the RMSE on the standard deviation of the random error and the cut-off frequency was investigated.
Using the optimized cut-off frequency that minimizes the RMSEs with respect to the reference dose distributions, the filtering processes were performed for the experimentally measured DAP distributions to obtain the reconstructed dose distributions at the surface and near the Bragg peak.
3. Results
The measured depth-DAP rate distribution for carbon-ion beam collimated with the φ1 mm collimator is shown in figure 2. The depth-DAP profile in an area of 1 mm2 on the central axis simulated by the PHITS is also shown in the figure; the peak position and the value on the vertical axis are fitted to the measurement data. The peak shift occurs owing to the energy attenuation of the transported carbon-ion beam passing through the beam line devices, e.g. the vacuum window, dose monitor, and surface material of the diode dosimeter.

Figure 2. Depth-DAP rate profile for a 140-MeV/u carbon-ion beam collimated to 1 mm. The plots and solid line indicate the measurements and Monte Carlo simulation (PHITS) results, respectively.
Download figure:
Standard image High-resolution imageThe measured DAP rate distributions at the surface and near the Bragg peak are shown in figures 3(a) and (b), respectively. The reconstructed dose rate distributions at the same depths are shown in figures 3(c) and (d), respectively. A sharp lateral penumbra is seen in the surface dose distribution, while unnaturally high noise is observed in the reconstructed dose distributions. These errors, seen as the noise in the figures, are considered to originate from the measurement errors of the DAP rate distributions.

Figure 3. Measured DAP rate distributions (a) at the surface and (b) near the Bragg peak. Reconstructed dose rate distributions (c) at the surface and (d) near the Bragg peak.
Download figure:
Standard image High-resolution imageThe reference dose distributions at the surface and Bragg peak obtained by the PHITS, which were used to investigate the effect of noise, are shown in figures 4(a) and (b), respectively. The reference DAP distributions obtained from the reference distributions by forward projection using equation (1) at the same depths are shown in figures 4(c) and (d), respectively. These are regarded as the simulated measurement values without error. Figures 5(a) and (b) show the RMSEs of the reconstructed dose distributions with respect to the reference dose distributions, obtained by changing the standard deviation σ of the added random noise to the reference DAP distributions at the Bragg peak and the surface, respectively. The error bars correspond to the standard deviations of five trials of random errors. In the absence of noise (σ = 0), the RMSEs of the reconstructed dose distributions also become 0, indicating that the reconstructed dose distributions from the forward-projected DAP distributions completely reproduce the original reference dose distributions. The RMSEs in the reconstructed dose distribution increase as the standard deviation of random noise increases. When σ of the random error is 3%, the errors in the reconstructed dose distributions are considerably large, i.e. approximately 8% and 13% in RMSE with respect to the peak values at the surface and Bragg peak, respectively.
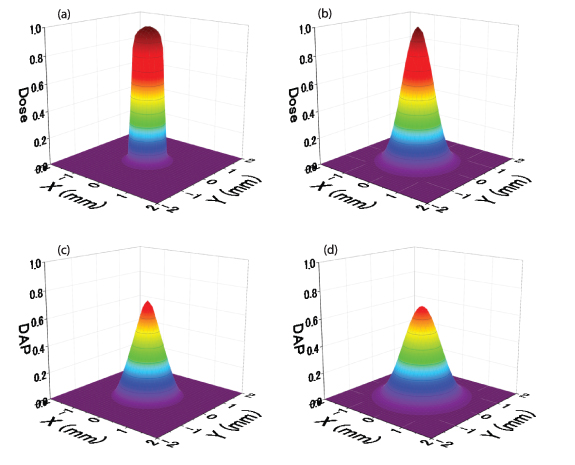
Figure 4. Reference dose distributions (a) at the surface and (b) the Bragg peak obtained by Monte Carlo simulations (PHITS). Reference DAP distributions (c) at the surface and (d) the Bragg peak obtained by forward projection (equation (1)) from (a) and (b), respectively.
Download figure:
Standard image High-resolution image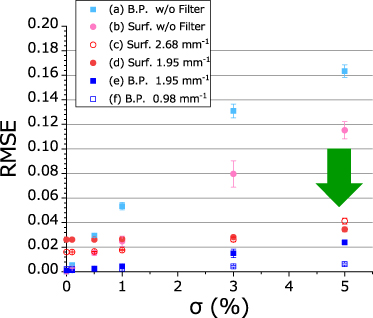
Figure 5. Root mean square errors (RMSEs) of the reconstructed dose distribution, depending on the standard deviation σ of the induced random errors. Panels (a) and (b) correspond to the surface and Bragg peak without filtering, respectively. Panels (c)–(f) correspond to the surface and Bragg peak with filtering using the optimum cut-off frequencies indicated in the legend. (Surf.: Surface, B.P.: Bragg peak).
Download figure:
Standard image High-resolution imageThe dependence of the RMSE of the reconstructed dose distribution on the cut-off frequency of the low-pass filter is shown in figure 6, where the standard deviation of the random noise is 0%–5%. The maximum cut-off frequency corresponds to no filtering. Except for the cases of small σ, the RMSE diminishes as the cut-off frequency decreases, i.e. as the frequency components of the two-dimensional DAP distribution are removed from the higher ones. When the cut-off frequency is further reduced, the RMSE increases again because the shape of the distribution is largely affected by the filtering process itself. When σ ≤ 0.1% at the surface, the RMSE increases with decreasing cut-off frequency. This indicates that the steep change in the dose distribution at the surface makes the latter less reproducible by incorporating the filtering process.

Figure 6. Dependences of the RMSEs of the reconstructed dose distributions (a) at the surface and (b) the Bragg peak on the cut-off frequency of the low-pass filter when the standard deviations of induced random errors are 0%–5%.
Download figure:
Standard image High-resolution imageA DAP distribution measurement was performed by raster scanning of the dosimeter in a plane. It took several hours to perform the measurement along one plane. When the already measured line was measured again during this prolonged measurement, different DAP values and subsequent profiles different from the previous one were obtained. As a result of the multiple repeated measurements on the same line, the reproducibility error in the actual DAP distribution measurements was approximately 2.5%–3%. In the case of σ = 3% shown in figure 6, the cut-off frequencies at which the RMSEs of the reconstructed dose distributions were minimum at the surface and near the Bragg peak were 2.68 mm−1 and 0.98 mm−1, respectively. The optimum cut-off frequency for the surface dose distribution is larger than that at the Bragg peak because the filtering process with smaller cut-off frequency cannot reproduce the sharp penumbra at the surface. The cut-off frequency at which the average value of both RMSEs was the smallest was 1.95 mm−1. The RMSE of the reconstructed dose distribution becomes approximately 3% or less with respect to the peak value by using these optimum cut-off frequencies.
The dependence of the RMSE of the reconstructed dose distribution on the standard deviation σ of random noise is shown in figures 5(c)–(f), where the obtained optimum cut-off frequencies are used. The RMSEs of the reconstructed dose distributions can be largely reduced with a filter compared to those without the filter (figures 5(a) and (b)) when the random noise is large (σ > 1%). The RMSEs of the reconstructed dose distribution are approximately 3%–4% of the examined range or less, regardless of the magnitude of the random noise. When the random noise is small (e.g. σ = 0), no filtering is preferred. This is because the filtering process itself affects the original distribution shape.
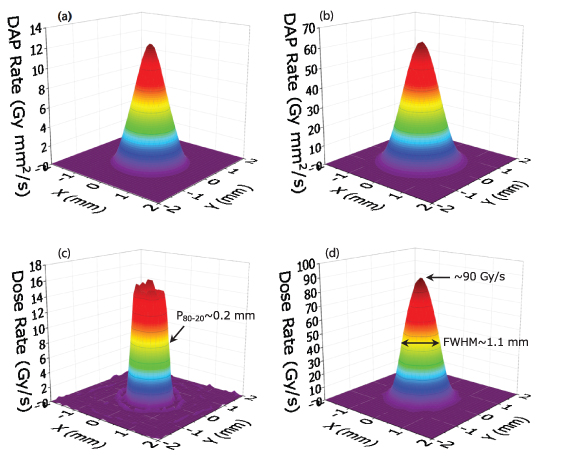
The DAP rate distributions obtained from filtering with the common optimal cut-off frequency (1.95 mm−1) for the experimentally measured DAP rate distributions at the surface and near the Bragg peak are shown in figures 7(a) and (b), respectively; the subsequent reconstructed dose rate distributions are shown in figures 7(c) and (d). Panels (a) and (b) of figure 7 are almost identical to those of figure 3; however, the noises of the reconstructed dose distributions are substantially suppressed compared with those of figures 3(c) and (d). In the dose rate distribution at the surface, a steep penumbra of P80-20 ∼ 0.2 mm and a beam of size of ∼1.1 mm at the full width at half maximum (FWHM) are obtained. Even after the filtering process, some noise persists in the reconstructed dose distribution at the surface because of the insufficiently high cut-off frequency of the low-pass filter, which is applied to keep the reproducibility of the sharp penumbra. As shown in figure 7(d), the dose rate distribution near the Bragg peak at the center axis of ∼90 Gy s−1 and the beam size of ∼1.1 mm at the FWHM are obtained. Compared with the estimated beam size of ∼1.0 mm at the FWHM of the dose distributions simulated by the PHITS at the surface and Bragg peak, the actual aperture size was expected to be slightly larger than the nominal size of 1 mm, which was measured to be between φ1.02 mm and φ1.03 mm using pin gauges with 0.01 mm steps.
Figure 7. DAP rate distributions obtained by filtering with the common optimal cut-off frequency for the measured DAP rate distributions (a) at the surface and (b) near the Bragg peak. The reconstructed dose rate distributions from (a) and (b) are shown in (c) and (d), respectively.
Download figure:
Standard image High-resolution image
4. Discussion
The proposed method can quantify the dose distribution with a spatial resolution smaller than the sensitive area using a commercially available and calibratable dosimeter. The quantifiability of dose distributions with the spatial resolution of 0.1 mm step and the measurability for the practical beam intensity, especially for the beams with high dose rate used in this study, of this method are advantageous, considering conventional films and semiconductor pixel detectors have critical issues in the dosimetry of such small-sized, high LET and high dose rate beams. In our Monte Carlo simulations using PHITS, the variations of the LET distributions for fine carbon-ion beams are estimated by changing the radial position r. At the surface, the dose contribution (i.e. relative dose) of LET components, except for the peak around 20 keV μm−1, to overall contribution increases from 21% to 73% as r is varied from 0 mm to 0.5 mm, while the dose contribution of LET components less than 100 keV μm−1 at the Bragg peak depth increases from 0.4% to 2.4% as r is varied from 0 mm to 1.0 mm. The radial position-dependent variations of the LET distributions are considered to be due to the edge scattering of the collimator. In addition to the depth direction impact, the impacts of these variations of LET distributions in the radial direction on the film darkness to dose conversion may have to be carefully investigated for accurate film dosimetry with fine carbon-ion beams. In the reconstructed dose distribution shown in figure 7(c), a steep penumbra is obtained, which rises at approximately 0.2 mm at the surface. Further, as shown in figure 7(d), a high dose rate of ∼90 Gy s−1 in the center area of size of 0.01 mm2 near the Bragg peak is obtained, although a dose rate of ∼60 Gy s−1 is measured as the average value in the 1 mm2 region of the dosimeter sensitive area shown in figure 3(b). The proposed method can quantify dose distributions with a high spatial resolution of 0.1 mm using a dosimeter with a sensitive area of 1 mm2 (diameter of φ1.13 mm). Focusing on the peripheral low dose rate regions, the actual dose distributions (figures 7(c) and (d)) are noticeably narrower than the measured DAP distributions (figures 3(a) and (b)).
Generally, in dose measurements using an ionization chamber or a diode dosimeter, it is premised that the amount of charge output in the sensitive area and the dose are proportional. Knowledge of the DAP is not required in the case of a uniform irradiation field, and the dose can be obtained from the calibration constant of the amount of charge to the average dose. Even in the case of a non-uniform dose distribution, the proposed method assumes that the amount of charge at each position in the sensitive area is proportional to the dose at the position. This is because, even if the fluence in the sensitive area is non-uniform, the charge collection efficiency at each position is assumed to be the same. However, when the beam intensity or dose rate is locally high, the charge collection efficiency may not be constant. In that case, if the dose rate dependence of the charge collection efficiency is estimated, the dose distribution can be also quantified using the proposed method by modifying the term s(x, y) so as to include a dose rate dependent correction term. Saini et al (2004) reported that the dose rate dependences of the sensitivities of various types of diode dosimeters with pulsed photon beams could vary within a few % at ∼100 Gy s−1, although different types of beams and dosimeters were used from those in this study. However, as the presented measurements largely agree with the simulation (see figure 2), it can be considered that there is no large change in the charge collection efficiency under the present beam conditions, such as the measured depths and dose rates. In addition, the used beam intensity is equivalent to that used in many particle beam facilities, and since the beam intensity is considerably reduced by the φ1 mm collimator, the beam intensity dependence is negligible. Nevertheless, the dose rate dependence of carbon-ion beams should be further investigated to achieve more accurate dosimetry.
In principle, the proposed iterative approximation method can reconstruct any distribution shape. In the case of σ = 0 shown in figure 5 (without error), the reconstructed dose distributions match the reference distributions (RMSE = 0), confirming the validity of the proposed formulation. Here, to satisfy such reproducibility it is important to eliminate contradictions between the dose and the DAP at each position between forward and back projection calculations. However, an error exists in the actual measurement, which affects the reconstruction of the dose distribution. As shown in figures 5(a) and (b), an error of 3% included in the DAP distributions leads to RMSEs of approximately 8% and 13% in the reconstructed dose distributions at the surface and Bragg peak, respectively. If the DAP distribution error increases, the error in the reconstructed dose also rises. In general, iterative approximation is a method in which a reasonably accurate value can be obtained by repeatedly converging a problem that is difficult to solve analytically. However, the measured DAP values having inevitable errors in a plane cannot be completely reproduced from a single dose distribution. For the measurements in this study, a 4 mm square area was scanned at a 0.1 mm step to measure 1681 points; one series of measurements was performed in over three hours. An error may be enhanced during such prolonged measurements owing to changes such as slight positional changes of the beam or accompanying devices. Therefore, the error of reproducibility of the entire distribution might be larger than the error of the repeated measurements just at one point. The reproducibility error of the measured DAP distribution was confirmed at approximately 2.5%–3%. To improve the accuracy of the reconstructed dose distribution, more careful measurements that reduce the reproducibility errors may be required; this might be one of several future investigation directions. At present, as a countermeasure, low-pass filtering processes could be effective in smoothing the inconsistency (e.g. spikes in the distributions) of the measured values.
The optimum cut-off frequency that reduces the error in the reconstructed dose distribution is expected to change depending on the shape of the dose distribution and the size of the induced error in the original DAP distribution (see figures 5 and 6). When the standard deviation σ of the induced random noise is small, the RMSE of the reconstructed dose distribution with filtering becomes large compared to that with no filtering. Thus, the filtering process is largely unnecessary for a small σ, while the optimum cut-off frequency can be large; i.e. wider frequency components can be passed to reproduce the original distribution shape. However, similar RMSEs are obtained over a wide range of cut-off frequencies (see figure 5), so it may be available within some error, even with less precise frequency tuning. Considering that the reproducibility error of the actual measurement is approximately 2.5%–3%, the lateral dose distributions of all depths from the surface to the Bragg peak may be quantified with an average error of approximately 3% or less with respect to the peak dose values using the obtained optimum cut-off frequencies. For the application of carbon-knife, larger energies may be used to obtain longer beam ranges. Although the collimator thickness may have to be adjusted according to the energy, the proposed dose-reconstruction method will still be applicable.
Several possible factors need to be considered to explain the slightly larger sizes of the reconstructed dose distributions than those obtained by PHITS simulations. First, the actual aperture size, which is measured to be 1.02–1.03 mm, is evidently different from the nominal aperture size of 1 mm. Second, there may be an error in the size of the sensitive area of the diode dosimeter. If the actual size is different from the nominal one, a different size of the radius rd in equation (2), consequently a different shape of the function s(x, y) would be used, which will affect the size of the reconstructed dose distribution. We examined the reconstructions using smaller and larger sizes of the sensitive area by changing the radius rd , and approximately according to the size error, they resulted in larger and smaller sizes of the reconstructed dose distributions, respectively. The size error will also affect the reconstructed dose values because the integrated area will be different. When a more accurate sensitive area is obtained, subsequent more accurate dose distribution reconstruction will be possible by updating the function s. Alternatively, if the dose distribution and beam size can be accurately measured by other measurement methods such as films and/or scintillators, it will be possible to inversely estimate the effective sensitive area by the proposed method. Other potential errors related to beam transport calculations such as multiple Coulomb scattering underlying in Monte Carlo simulations should also be considered (Nose et al 2005, Puchalska et al 2017).
In this study, the proposed iterative dose-reconstruction method has been demonstrated to quantify a dose distribution with a spatial resolution smaller than the detector size within a reasonably acceptable error. This proves a basic concept but is the first attempt ever reported. However, many measurements are required to reduce the spatial resolution. It may be unsuitable for routine operations because it is time consuming but is expected to be useful for the measurement-based determination of microbeam models for commissioning and dose distribution calculations toward carbon-knife applications. For more practical use, various methods of dosimetry should be complementarily available. For example, radiochromic film dosimetry can be a convenient tool if the calibration issues on LET and dose rate dependences are addressed or if it becomes available even in their limited conditions. Quantification using the iterative approximation method is expected to be applicable to various other problems if the relationships between the measured values and target physical quantities are formulated.
5. Conclusion
To obtain dose distributions of fine carbon-ion beams using a calibratable dosimeter, we proposed a novel dose distribution reconstruction method, using the iterative approximation, and quantified the dose distribution with a spatial resolution smaller than the sensitive area. A low-pass filtering process was shown to reduce the errors in the reconstructed dose distributions. It was considered that the dose distribution could be quantified with an average error of approximately 3% or less with respect to the peak value, when the actual measurement had an error of 3%. In reconstructed dose rate distributions, a steep penumbra P80-20 ∼ 0.2 mm at the surface was observed, and the dose rate at the center axis of ∼90 Gy s−1 and the beam size of ∼1.1 mm at the FWHM near the Bragg peak were quantified.
Acknowledgments
We would like to thank Y Kano, M Oishi, R Tsumuraya, and T Miyabe of the Accelerator Engineering Corporation for their experimental support. This study was carried out as a research project with heavy ions at GHMC.