

Abstract
Nitrogen dioxide (NO2) is a major urban air pollutant and is associated with new onset asthma among children worldwide. Since NO2 concentrations are spatially heterogeneous and correlated with population, the spatial resolution of concentration estimates and disease burden calculations could strongly influence the magnitude and spatial distribution of estimated NO2-attributable pediatric asthma (PA) cases. Here, we investigate the effect of spatial resolution of exposure and population data on estimated NO2 attributable PA incidence. We use epidemiologically derived health impact functions to estimate NO2-attributable asthma incidence for the U.S. and India, two countries with different degrees of urbanicity, using population and NO2 concentration estimates at 100 m resolution and aggregated to coarser spatial resolutions: 500 m, 1 km, 10 km, and 100 km. Estimated NO2-attributable PA burdens differ by <1% for resolutions of 100 m up to 1 km for both countries. However, performing the analysis at 10 km and 100 km results in 5% and 17% fewer new asthma cases among children in India and 6% and 32% fewer in the U.S., respectively. We performed a similar analysis for the 13 000 urban areas and present the results for the 500 most populated cities at 1 km and 10 km resolution, finding that the coarser resolution leads to lower estimated NO2-attributable asthma incidence in nearly all cities, especially for cities with smaller land areas. We conclude that 1 km spatial resolution is a good balance between accuracy and computational efficiency in estimating NO2-attributable asthma burdens at national and urban levels, and that coarser resolutions may result in underestimates.
Export citation and abstract BibTeX RIS

Original content from this work may be used under the terms of the Creative Commons Attribution 4.0 license. Any further distribution of this work must maintain attribution to the author(s) and the title of the work, journal citation and DOI.
1. Introduction
NO2 is a pervasive air pollutant that is mostly emitted by high-temperature fossil fuel combustion. It is often used as an indicator for the nitrogen oxides (NOx ) group of pollutants, as well as an indicator of traffic-related air pollution (Beckerman et al 2008). With an average atmospheric lifetime of ∼4 h (Liu et al 2016), NO2 transforms into other chemical species shortly after being emitted. As a result, NO2 has a highly spatially heterogeneous distribution with higher concentration in urban areas and near emission sources such as roads and power plants.
Recent studies have linked air pollutants emitted by the transportation sector and traffic indicator pollutants such as fine particulate matter (PM2.5) and NO2 to asthma incidence (Gasana et al 2012, Takenoue et al 2012, Anderson et al 2013, Bowatte et al 2015, Kheris et al 2017), particularly among children (Jacquemin et al 2015, Anenberg et al 2018). Since asthma prevalence is widespread globally (Asher et al 1995, Enilari and Sinha 2019), understanding the contribution of air pollution to this public health burden can inform asthma mitigation approaches. The first study to estimate the global burden of NO2 on pediatric asthma (PA) incidence found ∼4 million attributable asthma cases per year, with up to 48% of urban PA burdens attributable to NO2 (Achakulwisut et al 2019). Given the strength of the evidence linking NO2 with PA incidence, and the magnitude of the estimated NO2-attributable asthma burdens in countries and cities worldwide, the Institute for Health Metrics and Evaluation is now evaluating this risk-outcome pair for inclusion in their Global Burden of Disease (GBD) study. Presently, the GBD includes only two ambient air pollution risk factors—PM2.5 and ozone—and does not consider their potential influence on asthma.
Since both NO2 concentrations and the populations exposed to them are highly spatially heterogeneous and co-located, NO2-attributable disease burden estimates are likely influenced by the grid resolution of data inputs and the disease burden calculations. Previous studies have investigated the influence of spatial resolution on estimated mortality burdens attributable to PM2.5 and ozone, finding strong influence of resolution for PM2.5 mortality but not for ozone mortality (Thompson and Selin 2012, Punger and West 2013, Li et al 2016, Fenech et al 2018, Jiang et al 2018, Korhonen et al 2019, Parvez and Wagstrom 2020), driven by the shorter atmospheric lifetime of PM2.5 (days to weeks) compared with ozone (weeks to months). Spatial resolution may influence NO2 disease burden estimates even more than PM2.5 since NO2 has a shorter atmospheric lifetime (hours) and is mainly emitted in urban areas with large nearby populations. Only one study to our knowledge has investigated the influence of spatial resolution on estimated NO2-attributable disease burdens, finding up to 40% decreases in health impacts in several European cities when aggregating datasets from ∼tens of meters to 20 km resolutions (Bino et al 2017). The larger influence of spatial resolution on NO2 compared with PM2.5 disease burdens is supported by similar results for just the primary component of PM2.5 compared with total PM2.5 (Korhonen et al 2019), since primary PM2.5 exhibits fine-scale spatial structure similar to NO2.
Given the intensive computational requirements for estimating impacts at very high grid resolutions (e.g. 100 m, as was used by Achakulwisut et al 2019), identifying grid resolutions that balance accuracy with computational efficiency can inform design of future NO2 health risk and impact assessments. Here, we investigate the effect of the spatial resolution on estimated NO2-attributable PA incidence. To isolate the effect of resolution, we recalculate the number of PA cases that could be attributable to NO2 using the same NO2 concentration and population data averaged to various grid sizes: 100 m (original datasets), 500 m, 1 km, 10 km, and 100 km. We focus on the U.S. and India because they represent contrasting spatial distributions of urban population. We also estimate NO2-attributable asthma cases using these various spatial resolutions in the 500 most populated cities globally.
2. Methodology
2.1. Health impact assessment
We calculate the fraction of PA that is attributable to NO2 using an epidemiologically-derived health impact function. This approach is used widely throughout the literature estimating the health impacts of air pollution exposure, including the GBD, as well as the first two studies to estimate global NO2-attributable asthma burdens (Anenberg et al 2018, Achakulwisut et al 2019). The health impact function is:
where C is the country, AG is the age group, Inc is the baseline asthma incidence rate for the age group and country, Pop is the grid-cell population, β is the concentration response factor relating the NO2 concentration with increased risk of asthma incidence, and X is the grid-cell annual average NO2 concentration. We calculate the burden of NO2 on PA incidence for each grid-cell, and then sum the estimated NO2-attributable PA cases for each country.
Following Achakulwisut et al (2019), we apply a log-linear relationship between relative risk (RR) and NO2 concentration and use a theoretical minimum risk exposure level (TMREL) of 2 ppm NO2. We apply an RR of 1.26 per 10 ppb increase in annual average NO2, drawn from Khreis et al (2017), the largest and most recent multi-national meta-analysis of epidemiological studies examining associations between traffic-related air pollution and asthma. The TMREL of 2 ppm is the 5th percentile of the lowest concentrations reported in the individual epidemiological studies analyzed by Khreis et al (2017). Our use of a log-linear concentration-response function may overestimate risk at low concentrations due to the steeper slope of the relationship between NO2 and PA incidence at low concentrations, as has been shown for PM2.5 (Anenberg et al 2012). While we did not include any health impact of concentrations lower than 2 ppb, it is possible that we have overestimated NO2-attributable PA impacts in grid-cells with low concentrations (e.g. <5 ppb). More epidemiological research will provide insights as to the shape of the concentration-response curve at low concentrations. We calculate the asthma burden attributable to NO2 as the difference between the burden at the total concentration (X) and the TMREL (see also figure S1, which is available online at https://stacks.iop.org/ERL/16/014019/mmedia):

We used national baseline asthma incidence rates from the GBD 2017 (Soriano et al 2020) Study. Sub-national asthma incidence rates are not currently available for most countries. For population, we use the 'World Pop Age & Sex structure' dataset at 100 m resolution for the year 2015 (Tatem 2017). We use data for age groups 1–5, 5–10, 10–15, and 15–20 years, and break out the last age group into 15–18 and 18–19 years, assuming a linear distribution between ages. We sum attributable burdens across age groups for each country, since age structure does not vary substantially at the grid-cell sizes under exploration.
Spatial boundaries of urban setting categories are from the Global Human Settlement (GHS) Settlement Model grid (SMOD) dataset (Pesaresi et al 2019). Grid-cells are categorized as: (a) minimum population of 50 000 and at least 1500 inhabitants km−2 or built up area of at least 50% (urban), (b) minimum of 5000 population and 300 inhabitants km−2 (suburban), (c) other inhabited areas (rural), and (d) undeveloped areas. We aggregate urban settings to coarser resolutions using the category of the majority of finer cells.
Surface annual average NO2 concentrations are from a land use regression model based on ground observations, satellite observations of NO2 columns (from GOME2 and SCIAMACHY sensors) scaled to surface concentrations using the GEOS-Chem chemical transport model (CTM), land use properties such as road density and normalized difference vegetation index, and locations of power plants (Larkin et al 2017). This dataset provides global coverage at 100 m resolution for the 2010–2012 average (figure S2) and was also used by Achakulwisut et al (2019). To our knowledge, this is the only publicly available dataset that provides surface NO2 concentration at high resolution (<1 km) on a global scale. Even though NO2 has seasonal variability, the annual average provided by this dataset matches the exposure used in epidemiological studies that we follow (Khreis et al 2017). The model has a global Pearson coefficient of determination (R2), root mean squared error (RMSE), and mean absolute error of 0.54, 5.0 ppb, and 3.7 ppb, respectively (0.52, 5.7 ppb, 4.4 ppb for North American and 0.52, 5.3 ppb, 4.7 ppb for Asia).
2.2. Simulations
To investigate the sensitivity of estimated NO2-attributable asthma incidence to spatial resolution, we summed the input population and averaged the concentration dataset (both originally available at 100 m), to 500 m, 1 km, 10 km, and 100 km. The 100 m, 500 m, and 1 km resolutions represent the higher and lower end resolutions of available land use regression and neural network model exposure datasets, respectively (e.g. Larkin et al 2017, Di et al 2020). The 10 km, and 100 km resolutions represent typical resolutions of regional (typically 10 km or smaller) and global CTMs (ranging ∼25–200 km) or satellite-derived concentration datasets, such as the Ozone Monitoring Instrument satellite product, at ∼10 km resolution (Boersma et al 2007), and Modern-Era Retrospective analysis for Research and Applications reanalysis product, at ∼0.5° resolution (Gelaro et al 2017).
We performed the simulations for each age group for two countries that have large populations with contrasting patterns of urbanicity: the U.S. and India. While nearly 82% of the U.S. population lives in urban areas, India is an agrarian country with only ∼34% of its population in urban areas and a much larger fraction of the population living in undeveloped areas (United Nations, Department of Economic and Social Affairs, Population Division 2019; figure S2). While the U.S. and India have approximately the same area of urban land, India has many more high-density urban areas, which are also more scattered. India has 3775 high-density urban clusters with a total area of 85 991 km2 compared to 321 clusters in the U.S. with a total area of 85 773 km2. The overall population in India is much larger than in the U.S.: the population in urban, suburban, rural, and undeveloped zones is 104 million, 46 million, 68 million, 216 million for India and 37 million, 20 million, 21 million, 584 000 for U.S., respectively (figure S3). Only 0.7% of the U.S. population lives in undeveloped areas, compared with nearly half (49.6%) for India. An additional 26% of the U.S. population lives in rural areas, compared with 16% for India in this dataset. As NO2 is a highly spatially heterogeneous pollutant and is much higher in urban compared with rural areas, we expect that the differences in urbanicity between the U.S. and India will lead to different influences of spatial resolution on NO2 disease burden assessment.
We hypothesize that estimated NO2-attributable asthma cases will decrease with coarser spatial resolution. We also hypothesize that this effect is amplified in India versus in the U.S., since the urban clusters in India are smaller in area (though more numerous than in the U.S.). These hypotheses are based on the expectation that, for smaller urban clusters, averaging from smaller to larger grid boxes will yield more artificial dilution because high concentrations in a small number of urban grid-cells are averaged with lower concentrations in surrounding suburban and rural grid-cells. In contrast, big urban clusters will be less affected because most of the smaller grid boxes are categorized as urban and have high NO2 concentrations.
Beyond the U.S. and India, we also investigate this effect in the 500 most populated cities globally. We ranked urban clusters based on 2015 population, and investigated the effect of spatial resolution by comparing estimated NO2-attributable PA incidence calculated at two spatial resolutions: 1 km and 10 km.
3. Results
3.1. Influence of spatial resolution on population and NO2 concentrations
Using the native 100 m resolution of the NO2 concentration dataset, national average surface annual average NO2 concentrations are similar for the U.S. (7.5 ppb) and India (7.0 ppb; figure S4). When aggregated to 100 km resolution, national average concentrations stay about the same for both countries, but high concentrations in urban areas are smoothed out as they are averaged with lower suburban and rural concentrations surrounding the urban centers.
To illustrate this further, we calculated city-average NO2 surface concentrations for three U.S. cities (Washington, DC; New York, NY; and Boston, MA) and New Delhi in India at three different spatial resolution of 100 m, 10 km, and 100 km (figure S5). Similar to the national scale, the city-average concentration stays the same, but the high concentration in urban areas that coincides with large and dense populations are averaged together with low concentrations in rural areas. This artificial dilution due to aggregation will result in the entire population in the coarser grid-cell to be exposed to similar levels of concentration, as opposed to the fine spatial resolution where the high population urban areas are co-located with the high levels of concentration.
3.2. Influence of spatial resolution on estimated NO2-attributable asthma incidence nationally
We first estimate NO2-attributable PA cases for the U.S. and India at 100 m grid resolution using 2015 population and baseline disease rates and 2010–2012 average NO2 concentrations. We estimate that the number of NO2-attributable asthma cases are of similar magnitude in both countries (209 000 in the U.S. and 240 000 in India; figure 1). While India has a much larger pediatric population (486 million people in India vs 78 million in U.S.), its baseline PA incidence rate is much lower. The overall number of asthma cases per year (not limited to those attributable to air pollution) for ages 1–18 years is ∼2.1 million in India, which is 0.42% of the pediatric population. That fraction is the lowest in GBD dataset by far (potentially caused by higher uncertainties in India due to poorer access to healthcare), with a median national fraction of 1.4% of the population across all countries globally. This fraction for U.S. is 1.4%, approximately equal to the global median. Due to the large difference in incidence rates between the two countries, we base our comparison between different spatial resolutions on percentage changes, rather than absolute numbers of new asthma cases. Since the health impact function is linear regarding the incidence rate parameter, and given that we also use the same incidence rate for different resolutions, comparing results of different spatial resolutions based on relative changes is unaffected by the differences in national incidence rates.

Figure 1. Estimated NO2-attributable pediatric asthma incidence (thousands of cases per year) for India (IND) and the USA for all investigated spatial resolutions, using 2010–2012 NO2 concentrations and 2015 population and baseline disease rates. Dashed lines show percent diversion (decrease) compared to original 100 m resolution.
Download figure:
Standard image High-resolution imageWe next compare estimated NO2-attributable PA incidence for both countries at the different spatial resolutions from 100 m to 100 km (figure 1). We find that the effect of spatial resolution on NO2-attributable asthma cases is insignificant up to 1 km resolution, with <1% difference between results using 100 m and 1 km resolutions. However, we observe a much larger decrease in the total NO2-attributable asthma burden as the grid-cell size is broadened from 1 km to 100 km (figure 1). Estimated NO2-attributable asthma burdens calculated using 100 km resolution are 17% and 32% lower compared to the results of the analysis performed at 100 m resolution for India and the U.S., respectively. When comparing the results for calculations performed at 10 km resolution versus 100 m, estimated attributable burdens are 5% and 6% lower for India and the U.S., respectively, indicating a much larger effect when moving from 10 km to 100 km than when moving from 100 m to 10 km.
In addition to the total NO2-attributable disease burdens, the spatial distribution of estimated NO2-attributable asthma incidence is also affected by grid resolution, driven largely by heterogeneity in population size, NO2 concentrations, and their co-location. Comparing NO2-attributable asthma rates per 100 000 people calculated at 100 m and 100 km resolution, we observe large differences in areas with higher concentrations, as well as in areas with large population (figure 2). The coarse 100 km resolution smooths out the urban features in the 100 m maps, with some cities no longer visible with the coarser resolution.
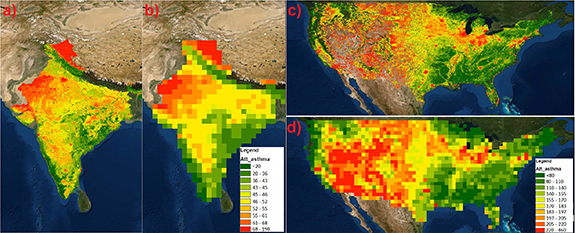
Figure 2. Spatial distribution of NO2-attributable asthma rates per 100 000 people for two sample resolutions of 100 m (panels (a) and (c)) and 100 km (panels (b) and (d)). Panels (a) and (b) illustrate the spatial distribution in India, and panels (c) and (d) show the spatial resolution in USA.
Download figure:
Standard image High-resolution imageFor each country and spatial resolution, we summed estimated NO2-attributable PA cases within urbanicity categories to explore how spatial resolution influences each of these categories individually (figure 3). As the estimates vary by only a small amount for 100 m, 500 m, and 1 km resolutions, we focus on the comparison between 1 km, 10 km, and 100 km resolutions. For both the U.S. and India, NO2-attributable asthma cases decreased in magnitude in the urban and, to a lesser degree, suburban areas when moving from finer to coarser resolution, due to the artificial dilution effect. Contrastingly, NO2-attributable asthma cases increased in undeveloped areas with coarser resolutions, as grid-cells categorized as urban and suburban at high resolutions are aggregated to rural due to the majority rule used to aggregate urbanicity. For rural areas, NO2-attributable asthma cases were higher in the U.S. at coarser resolutions, but were not heavily influenced by spatial resolution in India.
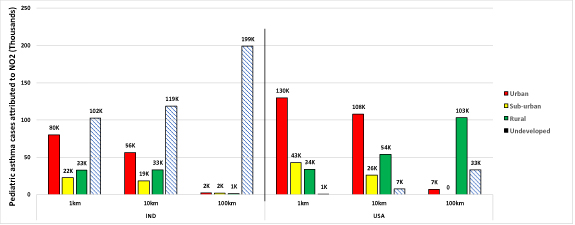
Figure 3. Estimated NO2-attributable pediatric asthma cases for three analyzed resolutions of 1 km, 10 km, and 100 km. The results are grouped based on the urbanacity into four groups: undeveloped (NoData), rural, suburban (low-density clusters), and urban (high-density clusters).
Download figure:
Standard image High-resolution image3.3. Influence of spatial resolution on estimated NO2-attributable asthma incidence in urban areas globally
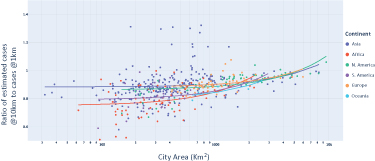
Here we investigate the influence of spatial resolution on estimated NO2-attributable asthma incidence in cities globally, since NO2 is largely an urban pollutant with large intra-urban variation (figure 4). Previous studies have shown that NO2 may contribute 6%–48% of PA incidence among the 125 most populated cities globally (Achakulwisut et al 2019). We focus on an expanded group of 500 most populous cities around the world to identify patterns and trends in the influence of spatial resolution on estimated NO2-attributable asthma burdens among cities with different spatial footprints. We find a consistent increase in the ratio of estimated NO2-attributable asthma cases calculated at 10 km versus 1 km as city size increases. The ratio is <1 for almost all the cities, indicating lower estimated NO2-attributable asthma cases using the coarser versus finer resolution. The ratio rapidly approaches 1 (representing equal results when the analysis is performed at both resolutions) as the area of the city increases. For cities larger than 1000 km2 (which is equivalent to ten 10 km cells, or one thousand 1 km cells), nearly all cities have ratios >0.8. The only cities with values <0.6 are those with area <200 km2. We also found that cities located near coastlines had ratios >1. In these cities, the opposite of 'artificial dilution' occurs, since there are no NO2 values in our dataset over water. With artificial dilution, the population in an urban area is exposed to the lower NO2 concentration resulting from averaging higher urban concentrations with lower concentrations in suburban, rural, and undeveloped areas. In coastal cities, the suburban populations are exposed to higher NO2 concentrations resulting from averaging concentrations in small suburban area with larger urban areas.
Figure 4. The ratio of estimated NO2-attributable pediatric asthma cases calculated at 10 km to estimates calculated at 1 km versus the spatial area of each city, for the 500 most populous cities worldwide. Each point represents an urban cluster (e.g. San Francisco, San Jose, and all the connected urban areas near them are clustered as one area).
Download figure:
Standard image High-resolution image
4. Discussion and conclusion
We investigated the effect of grid resolution on estimated NO2-attributable PA incidence in two countries (the U.S. and India) and in 500 cities globally. We found very little difference (<1%) in results between analyses calculated at 100 m, 500 m, and 1 km resolutions. However, across both national and urban analyses, we found that 10 km and 100 km grid resolutions lead to lower estimates of NO2-attributable asthma burdens compared with finer resolutions, due mainly to artificial dilution of NO2 concentrations when averaged across large grid-cells that cover both urban and rural land area. NO2-attributable asthma burdens calculated at 100 km resolution are 17% and 32% lower compared to the results of the analysis performed at 100 m resolution, for India and the U.S, respectively. The decrease in estimated NO2-attributable asthma cases when moving from 10 km to 100 km is much bolder than the effect from moving from 100 m to 10 km, even though the former is only upscaling by a factor of 10, while the latter is upscaling by a factor of 100. This result is likely due to the resolution that can represent the boundaries of the cities. Resolutions of 100 m to 1 km can capture spatial variations of NO2 in large urban areas since each urban areas is represented by many grid-cells. With 10 km resolution, intracity variation is not visible, especially for smaller cities, but urban areas are still distinguishable from rural areas. The 100 km resolution, however, is much larger than most urban footprints, precluding any visible gradients between the urban and rural areas.
We found a larger influence of spatial resolution on estimated NO2-attributable asthma cases in the U.S. compared with India. This is the opposite of what we expected based on the population and urbanicity of the two countries. Since India has so many more urban areas with the same total urban area size compared to U.S., we expected more dilution of NO2 concentrations when using coarser resolutions, due to high urban NO2 concentrations averaged with lower rural NO2 concentrations. This unexpected higher 'artificial dilution' in the U.S. can be explained by two factors. First, the NO2 exposure dataset that we used is optimized for urban areas, due to the majority of air monitoring stations being located in cities, and has unrealistically high NO2 concentrations in rural areas. Second, India has a more uniform distribution of population across urban and rural areas, while the U.S. population is much more concentrated in urban areas. With larger rural populations and more scattered urban areas in India compared with the U.S., unrealistically high rural NO2 concentrations leads to a smaller impact of averaging urban and rural concentrations across large grid-cells in India. In contrast, the U.S. has smaller rural populations and highly concentrated populations in large urban areas, leading to a larger dilution effect when NO2 concentrations are averaged across urban and rural areas. We anticipate that improving NO2 concentration estimates in rural areas may lead to a different outcome, potentially with a greater influence of spatial resolution on results for India compared with the U.S.
We also found that with coarser spatial resolutions, NO2-attributable asthma cases in urban and suburban areas decrease, and the percentage of attributable cases in rural and undeveloped areas increases. This pattern applies to both countries, despite differences in the spatial characteristics of their urban areas. Aggregating to coarser spatial resolutions changes the categorization of some higher density urban and suburban areas to rural and undeveloped. Thus larger populations are located in grid boxes considered to be rural or undeveloped in the coarser resolutions.
We compared results for 1 km (coarsest resolution without losing magnitude in estimated NO2-attributable asthma cases) and 10 km spatial resolutions (similar to available satellite-based NO2 concentration estimates) for urban areas. We found that the ratio of results at 10 km versus 1 km is nearly always <1, and approaches 1 as the area of the city increases. This result is expected, as urban areas with larger spatial footprints are still captured with coarser resolution, whereas cities with smaller area are only represented by a few grid-cells. This effect is amplified for cities smaller than 200 km2. We also found that the ratios for cities in Africa are lower than in other regions due to smaller cities, and ratios are closer to 1 for larger North American cities. These results indicate that the 10 km resolution typical of several satellite NO2 products and regional air quality models may adequately represent concentrations in large urban areas, but not for smaller cities. Finer resolutions (100 m to 1 km) are also able to capture within-city variation in NO2-attributable health impacts that would be lost at coarser resolutions.
We expected the influence of spatial resolution to be larger for NO2-attributable asthma impacts compared with PM2.5- and ozone-attributable health impacts, since NO2 has a shorter atmospheric lifetime (hours) and is therefore more spatially heterogeneous compared with PM2.5 (days) and ozone (weeks). Previous studies found a greater influence of spatial resolution on PM2.5-attributable mortality compared with ozone-attributable mortality, mainly because of the atmospheric lifetime difference. In particular, PM2.5-attributable mortality dropped by 30% while ozone-attributable mortality dropped by only <6% when moving from 12 km resolution to 250 km resolution. Our results for NO2-attributable asthma show a smaller effect of spatial resolution, potentially due to the high estimated NO2 concentrations in rural areas in the global NO2 dataset we used. These estimates can potentially be improved in future studies with exposure datasets with more accurate concentration levels in rural areas.
There are several important limitations to our analysis. We used national-scale baseline asthma rates, though a large degree of heterogeneity in asthma rates exists between neighborhoods and different population subgroups. If higher resolution disease rates were available, results could be assessed at the county (or the smallest available region) level, or a population-weighted average of the higher resolution incidence rates could be applied nationally. In addition, the NO2 concentration estimates from the global land use regression model are likely too high in rural areas, although the model predicts lower concentrations for rural areas compared to urban areas. This effect is visible in Northeast India and Midwest U.S., where concentrations are far lower than in urban areas in reality, but still high in this dataset. We also observed a much lower rate of NO2-attributable PA cases in India compared to the U.S., due to the low PA incidence rates in India. The low incidence rates may result from limitations in case diagnosis and reporting, and further research and surveillance is needed to shed light on the large gaps in asthma incidence rates between different countries. We expect that with more realistic levels of NO2 in rural areas, the influence of spatial resolution on NO2-attributable asthma cases would be bolder and much more visible. Lastly, the LUR concentration data might not represent what individuals are actually exposed to, considering outdoor exposure misclassification and time spent in indoor environments. However, this issue also exists in the epidemiological studies that were used to assess exposure-response relationships, as well as other air pollution health impact assessments (Anenberg et al 2018, Achakulwisut et al 2019).
Despite these limitations, our analysis yields some insights for the use of different types of NO2 concentration datasets for estimating NO2-attributable disease burdens. First, it may not be necessary to use spatial resolutions all the way down to 100 m to estimate these impacts. We suggest that 1 km resolution may provide more computational efficiency with little information loss, at least at the national level and for large cities (we did not investigate the impacts of spatial resolutions below 1 km at the urban level). Resolutions coarser than 1 km, including 10 km and 100 km scales, will underestimate NO2-attributable asthma cases, particularly in urban areas where NO2 concentrations will be diluted through averaging with lower rural concentrations and grid boxes change categories from urban to suburban, rural, or undeveloped. Our results suggest that NO2 concentration datasets should be developed at 1 km resolution or finer to support health impact analysis that adequately captures co-located high concentrations and large populations in urban areas. Examples of such datasets are already available, including by integrating satellite data and land use regression modeling. Recent and forthcoming geostationary satellites (e.g. GEMS, TEMPO, and Sentinel 4) observing air quality with vastly improved spatial resolution will further advance the availability of NO2 concentrations at urban and intra-urban scales, which can be used for future health impact assessments.
Acknowledgments
This work was supported by a NASA Health and Air Quality Applied Sciences Team (Award #NNX16AQ26G), the Health Effects Institute (Research Agreement #4977/20-11), and George Washington University. We thank Perry Hystad, Andy Larkin, and Michael Brauer for sharing the results of their global NO2 land use regression dataset and for helpful discussions. All data will be freely and openly shared via a public data repository upon acceptance.
Data availability statement
No new data were created or analyzed in this study.