


1. Introduction
In the Netherlands and many other countries, recent pension reforms and other labour market changes have made pension benefits based upon mandatory participation in public or occupational pension schemes less generous than before (see, e.g., European Commission, 2018). State and occupational pensions still provide a basic income after retirement, but often do not lead to a retirement income that is sufficient to maintain the pre-retirement standard of living. Individuals increasingly have to take their own responsibility and make decisions on, e.g., supplementary pension savings, how to invest (part of) their pension wealth, or the timing of their (gradual or full) retirement.
For various reasons, making optimal pension-related decisions is, to put it mildly, not an easy task (Adams and Rau, Reference Adams and Rau2011). It requires forward looking behaviour under uncertainty, with, e.g., a trade-off between the short-term gains of current consumption expenditures versus the expected long-term gains of consumption after retirement, in an environment with many sources of risk and uncertainty. Merton and Bodie (Reference Merton and Bodie2004) already argued that US households were increasingly asked to make complex financial decisions on asset allocation and retirement saving, which they did ‘not have to make in the past, are not trained to make in the present, and are unlikely to execute efficiently in the future, even with attempts at education’. Studies have shown that pension interest, knowledge, and awareness are universally low (see, e.g., Prast and van Soest, Reference Prast and van Soest2016). In addition, people may lack the self-control to save or postpone saving decisions until it is too late (see, e.g., Thaler and Shefrin, Reference Thaler and Shefrin1981).
Many studies have discussed how to help individuals to make pension-related decisions that are in their own long-term interest. They have shown that context, timing, defaults, and the organization of the decision process (e.g., decision steps and their order) have large effects on pension saving and ultimate choice outcomes (‘choice architecture’, see, e.g., Thaler and Benartzi, Reference Thaler and Benartzi2004). Other studies focus on information provision and pension communication, which can affect involvement as well as the ability to make good decisions – two necessary conditions for conscious and optimal decision-making (cf. the Elaboration Likelihood Model of Petty and Cacioppo, Reference Petty and Cacioppo1986). Providing more information on an individual's own future pension entitlements may increase awareness of pension income and associated standard of living after retirement. For those who under- or overestimated their pension entitlement, this information can lead to an adjustment of savings.
The current paper focuses on the effects of pension communication on pension knowledge and active pension decision-making. Different countries have organized their pension communication in different ways. In Section 2, we review the existing literature on the effectiveness of several national pension communication strategies. We then use longitudinal data for the Netherlands to analyse the relation between communication of an individual's personal pension entitlements, pension awareness, knowledge of pension reforms, and pension-related decisions. We use a representative panel of the Dutch adult population covering the years 2004–2016, described in Section 3. In Section 4, we use econometric panel data models to analyse the association between receiving a pension overview, pension knowledge, and pension-related decisions. We aim at identifying causal effects by allowing for fixed individual effects and exploiting the timing of events approach. Section 5 concludes.
We find that pension knowledge has a positive causal effect on active pension decision-making. This finding is quite robust for the identifying assumptions driving the specification of the model. Keeping pension knowledge constant, we find no significant (direct) effect of providing pension information on active pension decision-making. Moreover, providing an annual pension statement might have a small positive effect on pension knowledge. This result, however, is sensitive to the identifying assumptions.
2. Pension communication
Because pensions have become less generous and more risky, governments tend to put more effort into (planning for) pension communication (see, e.g., Atkinson et al., Reference Atkinson, Harrison, Messy and Yermo2012; European Commission, 2018). Across the EU, pension transparency, awareness, and information are seen as a priority in the context of pension reforms (Stevens and Van Assche, Reference Stevens and Van Assche2013). The view is that if individuals carry more risk and must make more choices, it is important that ‘European citizens obtain all the information needed to make well-informed decisions’ (Stevens and Van Assche, Reference Stevens and Van Assche2013). This applies to both mandatory and voluntary systems. Pension communication is also high on the agenda of the EU as a whole – EU Directive 2016/2341 requires institutions for occupational retirement provision in EU countries to design a Pension Benefit Statement for plan members, which should contain some key information indicators, including retirement age, pension projection(s), funding level, annual contributions, and administrative costs paid out of contributions.
Many countries introduced harmonized pension overviews for all or a large fraction of workers in the 1990s and 2000s, usually as letters sent each year to active participants. More recently, countries have introduced online platforms to help individuals with their online planning (e.g., Denmark, the Netherlands, Italy). Other countries are in the process of doing so (e.g., Germany, United Kingdom).Footnote 1 In this section, we discuss some studies that aim at evaluating the effects of these communication policies on knowledge and actual behaviour. This is mainly limited to an evaluation of the letters, which have been around for a longer time.
Mastrobuoni (Reference Mastrobuoni2011) analysed the effects of the introduction of the US Social Security Statement in 1995, an annual letter with an overview of a worker's old age social security benefits estimated benefits at several ages. He found a significant positive effect on pension knowledge, but no effects on retirement preparation behaviour or on the expected retirement age. On the other hand, Goda et al. (Reference Goda, Manchester and Sojourner2014), running a randomized experiment in the US giving individuals an income projection as well as general planning information, found additional contributions of about $1,000 on average among those who received income projections combined with enrolment information. Clark et al. (Reference Clark, Morrill and Allen2012) emphasize the importance of timing: employer provided financial education is particularly useful when the worker has just started or is approaching retirement.
Bilde and Linde (Reference Bilde and Linde2014) analysed pension knowledge in Denmark, where an online pension dashboard has been in place since 1999 (www.pensionsinfo.dk). They found that self-assessed pension knowledge is moderate, but measured knowledge is low, with between 11% and 50% of respondents giving the correct answer to factual questions. Moreover, around half of their respondents say they never looked up information in the year before the interview.
When Sweden introduced a funded pension component where individuals can choose among investment funds around 2000, a communication campaign stimulated individuals to choose their own portfolios among more than 450 government-approved investment funds. Cronqvist and Thaler (Reference Cronqvist and Thaler2004) argued that the campaign was successful in the sense that two out of three participants made an active portfolio choice instead of going for the default. After 3 years, the government ended its campaign to promote active choosing. In a recent follow-up study, Cronqvist et al. (Reference Cronqvist, Thaler and Yu2018) found that even after many years, employees have stuck to their original choice.
Larsson et al. (Reference Larsson, Paulsson, Sundén and Takayama2011) analysed knowledge of the pension system in Sweden before and after the introduction of the so-called ‘Orange envelope’ in 1999, providing information on accumulated public pension entitlements. They conclude that pension knowledge is poor and the introduction of the Orange envelope did not reverse the downward trend. People who read the Orange envelope know the system better, but it is doubtful whether this reflects a causal link and not merely a correlation. They also briefly summarized the effects on pension knowledge of similar resources as the Orange envelope in other countries, concluding that in all these countries, pension knowledge is limited and further research should determine whether sending the pension overview improves this knowledge.
An annual survey monitors the comprehension and use of the Orange Envelope, showing that most people know about it (around 90%), but only 75% of these say they read some of its content (Larsson et al., Reference Larsson, Paulsson, Sundén and Takayama2011). Despite the lack of evidence on its effectiveness, the Swedish Orange Envelope turned out to be an example for other countries.Footnote 2 Meanwhile, Sweden has introduced an online pension dashboard to give individuals an overview of pension rights and projected retirement income from all providers (https://www.minpension.se/), independent and free of charge for its users. The dashboard is essentially the online follow up of the orange envelope, with 50% of the working population registered as users (Moss, Reference Moss2016).
In Germany, major reforms as of 2001 increased the retirement age, made public pensions less generous and introduced tax-subsidized voluntary supplementary pensions (Riester pensions). Dolls et al. (Reference Dolls, Doerrenberg, Peichl and Stichnoth2018) analysed the causal effects of sending out annual information letters phased in after the reform. These letters provide detailed information about the pension system in general and individual features, such as the statutory retirement date, projected public pension amount, and how this depends on earnings. Using administrative data, they found substantial positive effects of receiving the letter on voluntary saving for retirement as well as on earnings. Bucher-Koenen et al. (Reference Bucher-Koenen, Hackethal, Kasinger and Laudenbach2018) analyse a pilot experiment with an online platform, providing individual pension forecasts, adding some information on risk. They emphasize the positive effects (perceived knowledge and savings increase) and recommend the general introduction of such a dashboard.
Knell et al. (Reference Knell, Segalla and Weber2015) assess pension knowledge in Austria after a 2013 pension information campaign, when the Pension Insurance Agency sent a letter to insured individuals born between 1958 and 1990, with information on their future pension. A survey conducted in early 2014 reveals that respondents understand that the retirement age will gradually increase in line with life expectancy. On the other hand, uncertainty about the future net pension replacement rate is high and people do not fully understand the pension rules. In particular, they underestimate the importance of the contribution period for the pension level and the deductions for early retirement (3.5% instead of 7%). Knell et al. therefore recommend that pension information should show how an individual's pension income changes depending on the retirement age.
In 2016, the Italian Social Security Institute INPS launched ‘la mia pensione’, providing online information to private sector employees and the self-employed on the day of retirement, predicted pension benefit (in real terms) and replacement rate, the impact of potential career interruptions, and scenario simulations showing the consequences of different career patterns. The INPS ran a survey among 36,000 users of ‘La mia pensione’ to evaluate the information service.Footnote 3 About 60% reported that their knowledge on pensions improved.
3. Pensions and pension communication in the Netherlands
The Dutch pension system consists of three layers. The bottom layer is a state pension, independent of work history and based upon the number of years the individual has lived (or paid taxes) in the Netherlands. It implies a gross monthly income, starting at the statutory retirement age, of around 1,250 euros for a single and 1,700 euros for a couple.Footnote 4
The second layer is a mandatory fully funded occupational pension arrangement: If a company offers a plan, employees are obliged to participate. Approximately 95% of companies offer a plan, covering almost all employees. There is no choice on the amount of savings or the pension portfolio allocation. Employers and employees jointly pay the pension premiums. These are tax-facilitated up to a maximum. In the past, retirees could count on a replacement rate of 70% gross and 90% net (income of retirees is taxed at a lower rate). Indexation of pension claims to cost-of-living increases was the rule. In bad times, a small increase in the savings rate of employees was sufficient to guarantee sufficient retirement income. When baby-boomers started to retire, however, the ratio between workers and retirees fell dramatically. If the coverage ratio of a pension fund falls below a critical level, it must lower retirement income payments. Indexation of pension claims to cost-of-living increases is no longer common and in recent years, low coverage ratios have forced many pension funds to reduce nominal pension levels. State and occupational pensions are paid as a lifelong annuity.
Because of the large mandatory saving, the third layer, individual voluntary pension saving, is small. For groups with low occupational pension savings, third layer pension savings are tax-favoured. This mainly applies to the self-employed. Starting a few years ago, the statutory retirement age has increased gradually, from 65 years in 2013 to 67 years in 2024. In the future, it will rise automatically with general life expectancy. Almost all occupational pension funds allow for earlier claiming in case of early retirement, at an actuarially neutral reduction of the annuity.
Pension communication became an issue when the Socioeconomic Council concluded that even in a mandatory system, situations may arise where action is required to prevent an inadequate pension. Examples are a divorce, a change of jobs, or a change in the characteristics of the employer pension plan. A law on pension communication, passed in 2005, became effective in 2007. It focuses on the individual pension income prospects rather than characteristics of the pension system, mandating the pension industry to provide plan members with a (hard copy of a) yearly Uniform Pension Overview (UPO)Footnote 5 as of 2008. At that time, most pension funds already provided their active participants with annual information letters. The underlying idea of UPO was that if employees have pension claims from various funds, a uniform way of presenting information would facilitate them in calculating their projected pension income. One of the explicitly stated goals of the mandated pension communication was enabling stakeholders to make an adequate financial planning.
The law also required the pension industry to set up an online pension register, as of 2011. Here individuals can find information online on all their first and second pillar pension rights in terms of the amount that they can expect to receive if they will continue working in their current job until the age of retirement.Footnote 6 The information is on the level of the individual, not the household. The ultimate goal of the legislation was to induce people to take action if needed by increasing pension awareness: ‘…the extent to which one is aware of pension income, knows whether this is sufficient in one's personal situation, knows what can be done to solve potential problems, and makes a deliberate decision whether or not to act’.
To assess the effect of the mandated pension communication, a pension-awareness index was introduced, measuring knowledge about the individual pension. The index showed no improvement in pension awareness in the years 2009–2011 (Wijzer in geldzaken, 2014). An evaluation concluded that improvements in communication strategy were needed to achieve the ultimate goal of better pension preparation. Based on an international survey of over 50,000 employees, Towers Watson (2012) concluded that pension awareness among the Dutch was low in an international perspective.
In 2015, a new Act on Pension Communication was passed,Footnote 7 changing the format and content of the UPO. The purpose of the new law was to improve information about pensions by putting the individual’ perspective at the centre stage. Moreover, the goal of pension communication became less ambitious in terms of inducing behavioural change. The new goal is that plan members know how much pension they can expect, can verify whether it is sufficient, and are aware of the risks of the pension arrangement. Moreover, pension communication should show plan members which choices they have (Prast and Teppa, Reference Prast and Teppa2017).
The 2015 Act allows the pension industry to choose between providing the UPO on paper, electronically, or both. Pension communication on the website is offered in three formats (Pension 1-2-3). Pension 1 contains key information that can be read in 5 min, Pension 2 (30 min reading) provides this information in more detail, while Pension 3 also contains relevant background documents, such as the pension fund's annual report.Footnote 8 The different levels aim at meeting the varying needs of heterogeneous plan members. Moreover, according to the 2015 Pension Communication Act (Article 51), UPO and pension register should project future pension income in a realistic, an optimistic, and a pessimistic scenario, making uncertainty explicit. This is triggered by the fact that second layer pensions are much more risky than they were in the past, as discussed above. This has not yet been implemented. The new legislation is too recent to draw conclusions on its effects on pension knowledge, let alone behaviour.
A challenge in the Netherlands is the growing group of self-employed who are not covered by an occupational plan – indeed, pension coverage among the self-employed is rather low. There are pension funds for traditional groups of independent professionals (by category, e.g., for specialized doctors), and all professionals are required to become a plan member if 60% of the profession agrees. However, there is no equivalent for the new self-employed who, as a group, are very heterogeneous and do not belong to a professional organization. Current pension communication legislation focuses on second layer pensions, to which these groups do not have access.
4. Empirical analysis for the Netherlands: data and descriptive statistics
We use longitudinal data on individuals to analyse the relations between receiving a pension overview (a UPO or its predecessor), objective and subjective measures of pension literacy, and a measure of active pension planning. The data are taken from the DNB Household Survey (DHS), part of the CentERpanel administered by CentERdata at Tilburg University. The panel contains roughly 2,000 households whose members fill out short questionnaires on a weekly basis (biweekly since 2017) via the Internet. The DHS collects annual data since 1993, on ‘income, wealth, health, employment, pensions, savings attitudes, and savings behaviour’. The main variables for our analysis are available since 2004, and we use the 14 waves from 2004 until 2017. The long panel is the main distinguishing feature of our data: We acknowledge that the indexes of active behaviour, information, and pension knowledge are not perfect, but the fact that they have been measured longitudinally for such a long time period is, to the best of our knowledge, a unique feature.
We only use information on individuals of ages 20–67 who have not yet retired and have no missing values on basic covariates. Our final dataset is an unbalanced panel of 21,028 observations, providing information on 5,797 individuals aged 20–67. Due to missing values, the number of observations used for the regressions will typically be smaller (see below).
4.1 Active pension behaviour
To measure active pension decision behaviour, we use a question on whether people will adjust their conduct if pensions are cut. The question was asked in all waves of the DHS, though only to a small minority in 2014. The wording of the question and possible responses is as follows:
Will you adjust your conduct if pensions are cut down, for example through an adjustment of indexation, postponing the retirement age or a different pension system?
I will put more money aside for my pension/No, I will see what I'll do when it happens/No, I think I can make ends meet fairly easily with the pension I will have/Otherwise, answer … (string)/Don't know
Note that this question measures intentions only. If individuals intend to undertake action but procrastinate indefinitely, the answer to the question suggests they are active decision makers while in fact they are not. On the other hand, we prefer to use this variable rather than a variable reflecting actual behaviour, since in the current institutional setting in the Netherlands, many people do not need to make any active pension-related decisions in a given year.
The responses were used to create a binary variable on pension decision-making which is equal to one if people report that they will adjust their behaviour (answer 1; 26.7% of the sample) or made the deliberate decision not to adjust behaviour since they can make ends meet fairly easily (answer 3; 20.1% of the sample). The binary variable is set to zero if the second answer was given (35.2% of the sample), which reflects procrastination in getting involved with pensions and making pension decisions. The binary variable is also set to zero if individuals answered with answer 5: ‘don't know’ (14.8% of the sample). Furthermore, the relatively small number of open-ended responses (answer 4, 3.1% of the sample) usually appeared to reflect a non-conscious decision. We therefore also placed them in the zero category.
The overall average of the binary variable for active or conscious pension decision-making created in this way is 0.484. Figure 1 shows how the mean develops over time. There seems to be a peak in conscious pension behaviour around 2011–2012, followed by a substantial drop in the last few years. A possible explanation is that the financial crisis increased uncertainty and induced a public debate on the sustainability of pensions and falling pension income replacement rates (in real terms), which may have stimulated individuals to start thinking about their future pension income.
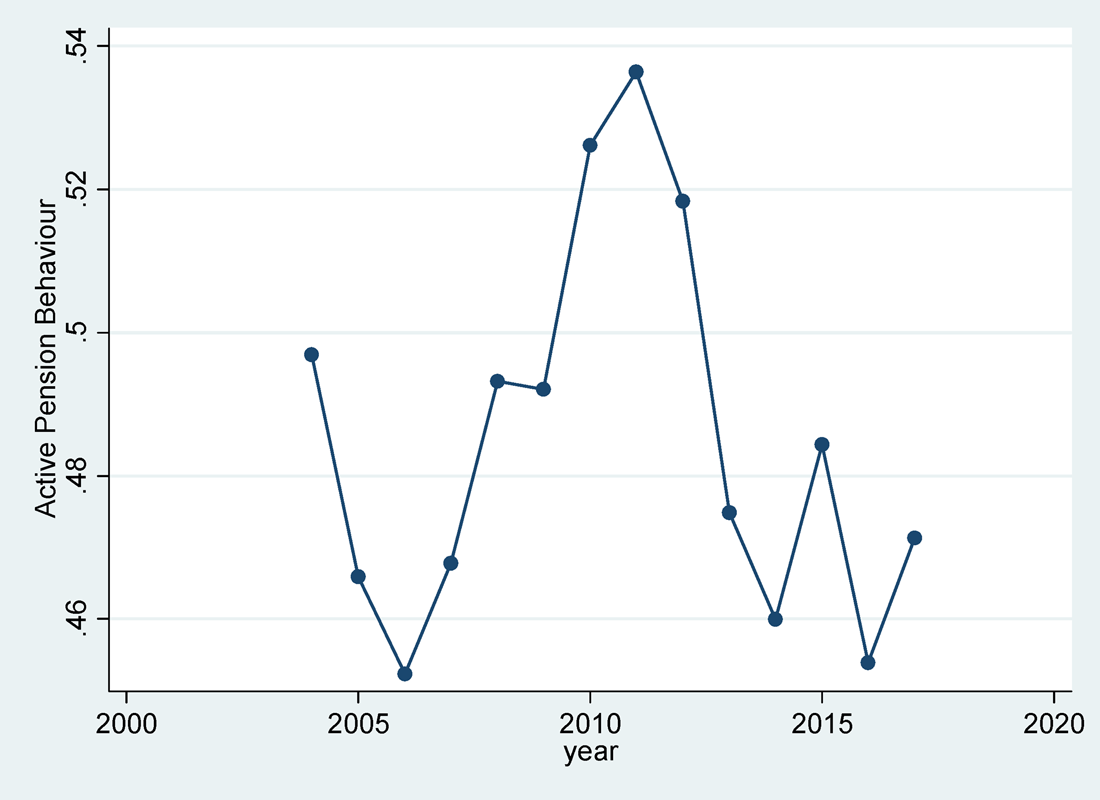
Figure 1. Active pension behaviour over time.
4.2 Pension communication
As discussed in the previous section, most pension providers send out annual pension statements to all their active participants. Since 2008, this is done through the mandatory uniform pension statement (UPO), presenting accumulated occupational pension entitlements at a given pension fund, similar to the Swedish Orange Envelope, but many providers already started sending their overviews much earlier. Our measure for pension communication is a binary response variable which is equal to one if the respondent reports that he or she has received such a pension overview in a particular year and zero otherwise. The exact wording of the question is:
Did your pension fund send you an overview of your pension rights in 2014? This also includes occupational pension schemes and pension benefits by insurance companies that were enclosed via your (former) employer.
Possible answers are ‘yes’ and ‘no’; there is no option: ‘don't know’. In our sample, 73.0% reported having received a pension overview. Somewhat surprisingly, Figure 2 shows that there is no increasing trend over time, in spite of the fact that sending the UPO to active participants became mandatory in 2008. Moreover, the percentage in 2013 is lower than in other years.
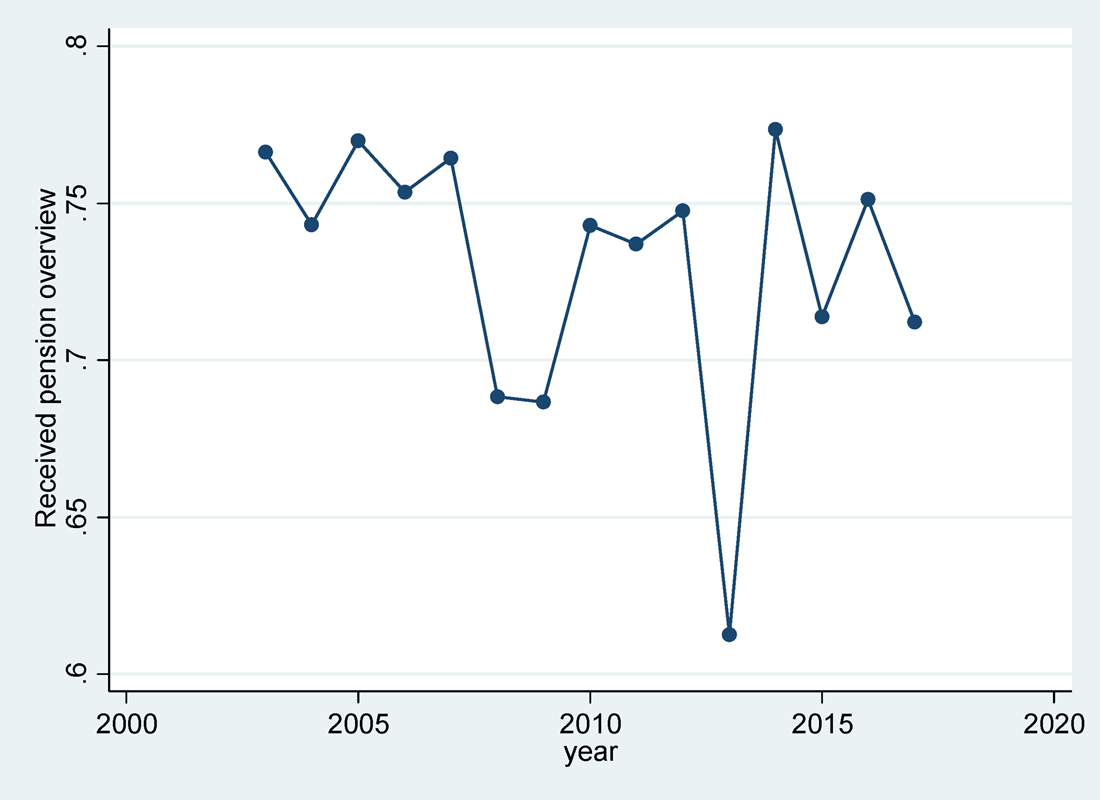
Figure 2. Sample fraction that received a (uniform) pension overview.
It should be emphasized that this variable is self-reported and may suffer from recall error. In particular, individuals who are not involved with their retirement planning might not recall having received a pension overview. Since we are interested in the effects of receiving a pension overview on pension planning and pension knowledge, such a lack of recall leads to an endogeneity problem. This will be accounted for in the econometric models.
4.3 Pension literacy
To assess members' knowledge of their own pension arrangement, we use three questions on pension knowledge from DHS. Respondents could reply to each of them with a specific answer or ‘don't know’. Since we do not have information on the respondents' actual arrangements, we assume that all specific answers are correct and that only the ‘don't know’ answers reflect lack of knowledge. The three questions used to address pension literacy are the following:
How is your pension built up?
Pension based on the final pay/Pension based on the average pay earned during my working career/Defined contribution/Don't know
Which part of the pension premium (in percentage points) is paid by the employer?
Open-ended answer/don't knowFootnote 9
A pension plan can include an arrangement for correcting the pension that can be claimed and/or the pension that is actually being paid according to a price-index and/or to a salary-index. Pensions that are corrected in this way are called indexed to inflation. Is your (future) retirement pension indexed to inflation?
Yes, price index/Yes, salary index/Yes, both salary and price index/Don't know
An answer other than ‘don't know’ was given in 68.3%, 26.8%, and 60.4% of all observations for the first, second, and third question, respectively. Figure 3 shows the development over time. The trend seems to be increasing until 2010 but decreasing afterwards.
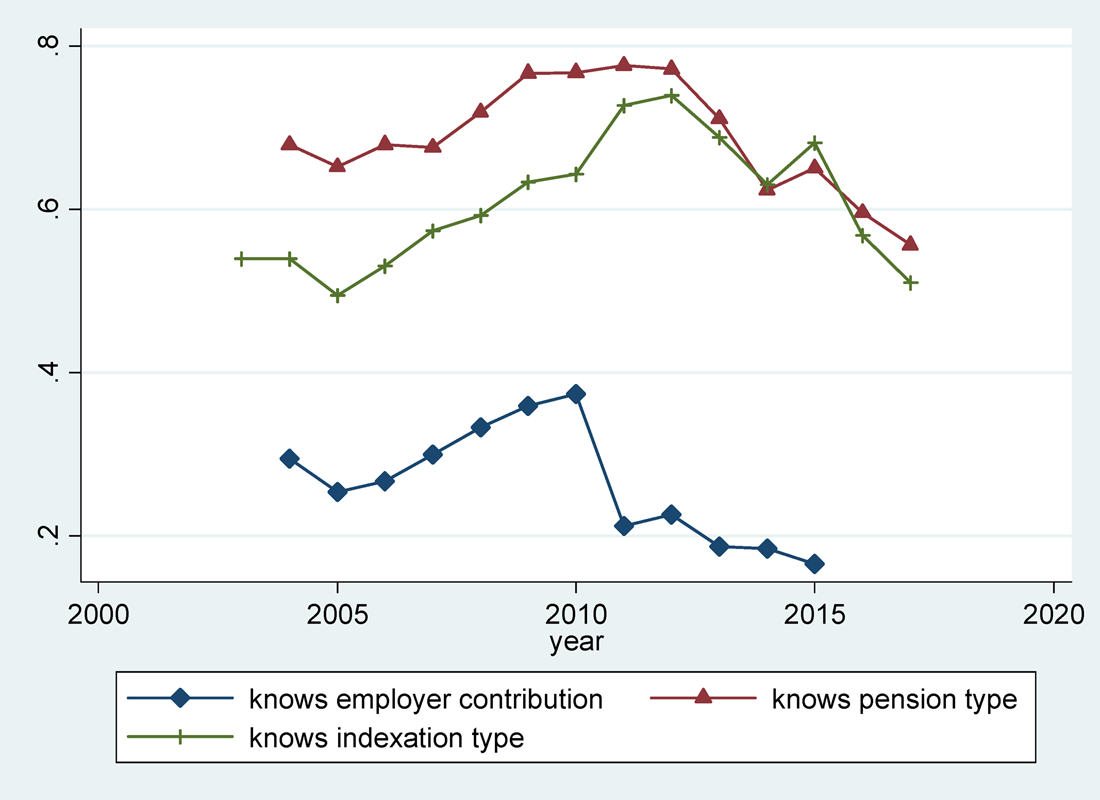
Figure 3. Pension literacy questions: fraction of answers other than ‘don't know’.
The first pension literacy index (pen_lit) we will use in the analysis is the number of answers other than ‘don't know’, with value 0, 1, 2, or 3. In 20.5% of all cases, each question is answered with ‘don't know’ and the index has value 0. In 22.1%, 37.6%, and 20.0% of all cases, the index has value 1, 2, and 3, respectively. This index has the drawback that it cannot be used for 2016 and 2017, when the question on the employer distribution was not asked. We therefore also use the index based upon the other two (relatively easy) questions only. This index has values 0, 1, and 2 in 22.8%, 25.5%, and 51.7% of all cases, respectively.
4.4 The feeling of being informed
The feeling of being informed about one's pension is a subjective indicator of pension knowledge that might play a role mediating the effect of pension communication on pension decision-making. We created a variable (feel_informed) for this with a score from 1 (feel no need to be informed, we'll see), 2 (not well-informed) to 6 (well-informed) from the following DHS question:Footnote 10
Do you feel adequately informed about your (future) pension arrangements?
Well informed/More than adequately informed/Adequately informed/Moderately informed/Not well-informed/Feel no need to be informed, we'll see
In total, 25.8% of the observations report that they feel well informed or more than adequately informed. The modal outcome is adequately informed (36.3%), while 19.7% ‘feel moderately informed’, 8.2% ‘feel not well informed’, and 10.3% ‘feel no need to be informed’. In the analysis, we treat the answer as a numerical variable (ordered from ‘feel no need to be informed’ to ‘very well informed’). Figure 4 suggests that the feeling of being informed about one's pension arrangement falls over time. As expected, this subjective index of pension knowledge is positively correlated with the objective pension knowledge index based upon the three questions in Figure 2; the correlation coefficient is 0.344.
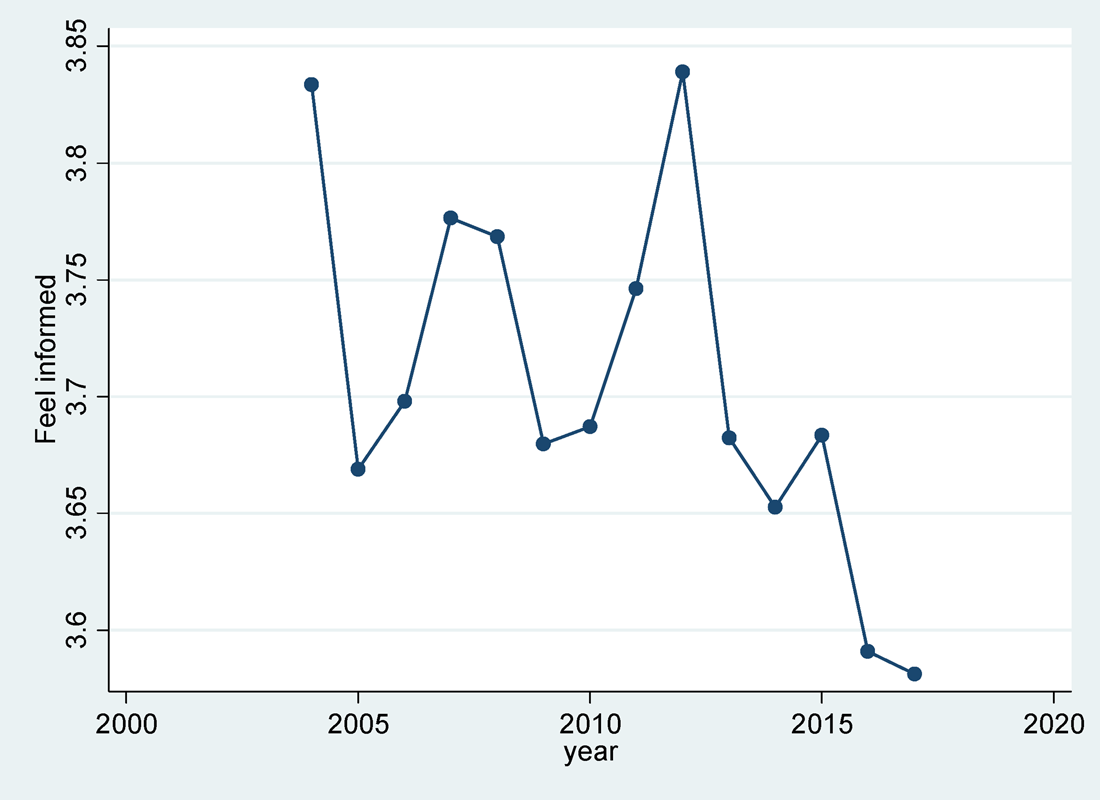
Figure 4. Average feeling of being informed about one's pension arrangements (1: no need to be informed, 2: not well-informed, … 6: well-informed).
5. Regression models
In this section, we consider panel data models that analyse the relations between our main variables of interest: pension communication (in particular, receiving a pension overview), pension knowledge (objectively measures pension literacy or the subjective feeling of being informed), and our measure of active pension behaviour (the question whether someone will adjust their behaviour if pensions are cut). We first show how reporting pension overview receipt relates to the respondents' individual characteristics and labour market position. In Section 5.1, we consider models for pension knowledge. In Section 5.2, we focus on active pension decision-making.
Table 1 presents the estimates of linear fixed-effects (FE) and random-effects (RE) models explaining the dummy for reported receipt of a pension overview.Footnote 11 As explanatory variables, we added a dummy for main wage earners, household size, dummy variables for home ownership and being married, a dummy for self-employment, and a dummy with value 1 if the respondent sees paid work as his or her main occupational status. All models also contain a full set of time dummies.Footnote 12 The RE model also has educational dummies, a dummy for females, and age.Footnote 13
Table 1. Random- and fixed-effects models explaining reported receipt of a pension overview
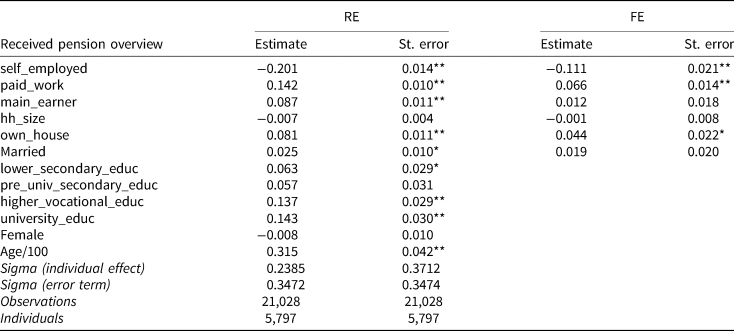
Dependent variable: 1 if respondents reports to have received a pension overview, 0 otherwise. Standard errors clustered at the individual level and robust to heteroscedasticity. Time dummies included but not presented. Paid_work: 1 if respondent sees paid work as the main activity, 0 otherwise. Other controls are self-explanatory.
*p < 0.05; **p < 0.01.
As expected, receiving a pension overview is strongly associated with doing paid work as an employee. Still, non-workers and self-employed workers can also receive a pension overview, if they worked in the past or consider working as an employee as a secondary activity. Conditional on labour market status, we see no good reasons why pension overview receipt is related to education level or other covariates. It seems likely that the association with education level in the RE model reflects that the higher educated more often recall having received a pension overview than the lower educated. It suggests that reported pension overview receipt (our observed variable) is not necessarily the same as actual pension overview receipt (the policy variable we are interested in). In other words, reporting errors may play a role. The bottom part of the table shows that individual effects capture a substantial part of the unsystematic variation in reported pension receipt.
5.1 Models explaining pension knowledge
Table A1 in the Appendix presents the results of static RE and FE linear models explaining our objective indexes of pension knowledge counting the number of questions on pension knowledge that are not answered by ‘don't know’, among all three or two of the three questions on knowledge of the respondent's own pension (see Figure 3). The main explanatory variable of interest is the dummy for reported receipt of a pension overview (received_PO). In addition, we added the same regressors as in Table 1. Using only two questions on pension literacy (and two additional waves of observations; right-hand panel of Table A1) gives qualitatively very similar results as using all three questions. Table A2 in the Appendix presents the results of similar models as Table A1, but now explaining our subjective pension knowledge measure (feel_informed, cf. Figure 4).
The main finding in Tables A1 and A2 is the significantly positive coefficient on the dummy for reported pension overview receipt: Respondents who report that they received a pension statement score significantly better on pension knowledge, keeping other factors constant (including the time-invariant unobserved characteristics captured by the individual effects). Whether these estimates reflect a causal effect of receiving a pension statement on pension knowledge remains to be seen. For example, it is possible that respondents who get more interested in pensions not only know more about pensions, but also remember better that they received a pension statement. In that case, reported receipt of a pension overview is endogenous to pension knowledge and the estimates in Tables A1 and A2 are not consistent for the causal effect of interest.
Home ownership is positively associated with (objective) pension knowledge, probably since buying a house induces people to study their long-term financial situation, including their future pension. Household composition is not significantly associated with pension literacy. Paid work plays a significant role in the RE model for objective pension knowledge only, suggesting that respondents who see paid work as their main occupational status also tend to know more about pensions but not necessarily because of a causal mechanism. The RE results in both tables also show that, as expected, pension knowledge is strongly positively associated with the level of education. Moreover, it is substantially larger for men than for women with the same other observed characteristics. These findings are in line with the literature on financial literacy in general (e.g., Bucher-Koenen et al., Reference Bucher-Koenen, Lusardi, Alessie and van Rooij2017). Pension knowledge increases with age, reflecting the common finding that individuals of working age get more involved with pension issues the closer they come to retirement. In the FE models, household and employment characteristics are insignificant, possibly due to lack of variation over time in these variables.
5.1.1 Identifying the causal effect
To identify the causal effect of receiving a pension statement on (objective or subjective) pension knowledge, we use the timing of events. Pension knowledge at time t may affect whether someone reports having received a pension overview at time t, but it seems quite plausible that it does not affect whether someone reported having received a pension statement one year earlier (at time t–1). Pension knowledge at time t might still be correlated with reported pension statement receipt at t–1 because individuals who know a lot about their pensions also tend to recall receiving the statement, but this is captured by individual FE (which can be correlated with the regressor received_PO). Our identifying assumption will thus be that the unpredictable changes in pension knowledge (the error terms in the pension knowledge equations) are uncorrelated with past values of reporting pension overview receipt.
This essentially means that the lagged value of received_PO can be used as an instrument for the current value of received_PO. In order to make this a valid instrument, the dynamics of pension knowledge need to be properly accounted for. Moreover, we have to allow for fixed individual effects. This can all be achieved in the dynamic panel data model of Arellano and Bond (Reference Arellano and Bond1991), using a GMM estimator in first differences. The main assumption is that the error terms in the pension knowledge equation for time period t are independent of everything that happened before time period t. They should not only be unrelated to past reporting of receiving a pension overview, but also to past covariates (implied by strict exogeneity of the covariates) and past pension knowledge (plausible if past pension knowledge is already included as a lagged dependent variable). Moreover, respondents get weekly interviews on many different topics, so it seems very unlikely that past recall error affects current answers.
The exact set of moments used in estimation depends on the exact nature of the assumptions on the nature of endogeneity of received_PO. The other control variables are assumed to be strictly exogenous (i.e., independent of the error terms in all time-periods). Moreover, to increase the efficiency of the estimator, moments in levels can be added assuming stationarity, following Blundell and Bond (Reference Blundell and Bond1998). We use tests on the validity of all or of a subset of moment assumptions to select an appropriate model.Footnote 14
5.1.2 Results
Table 2 presents four sets of GMM estimates of a dynamic model explaining the objective measure pen_lit. The first two specifications (‘2 lags’) assume that received_PO is not influenced by future values of pension knowledge but can be affected by current pension knowledge. The final two specifications (‘1 lag’) make the stronger assumption that reported pension overview receipt received_PO is not influenced by current pension knowledge (but can be influenced by pension knowledge in the past). Specifications 1 and 3 also use moments in levels (‘system GMM’), whereas specifications 2 and 4 only use moments in first differences (‘Diffs only’). Specification 3 is rejected by two of the four specification tests. The assumptions of the other specifications are not rejected by any of the tests. Note that specification 4 is not rejected by the data, although it assumes that there is no immediate effect of pension knowledge on the answer to the question whether someone received a uniform pension overview. If this assumption were indeed valid, then specification 4 provides evidence in favour of a causal effect of pension information on pension knowledge.
Table 2. GMM estimates of models for objective pension knowledge (pen_lit)
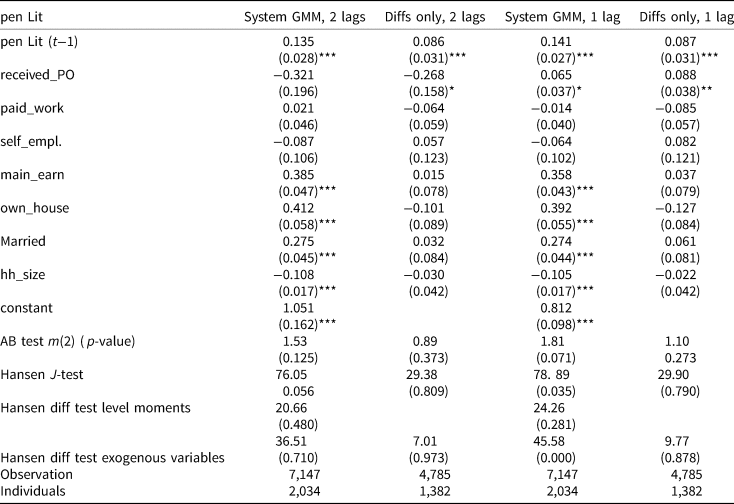
Notes: Time dummies included in all regressions but not presented. Two-step system GMM estimates with robust standard errors. Standard errors of parameter estimates and p-values of test statistics in parentheses. See main text for details on the four specifications.
*p < 0.1; **p < 0.05; ***p < 0.01.
All four models indicate that current pension knowledge depends upon last year's knowledge, although the size of this effect seems rather small (between 0.087 and 0.141). The specifications lead to very different conclusions concerning the influence of receiving a pension overview. According to the final two specifications (including specification 4 which is the preferred model according to the tests), receiving a pension statement has a small positive effect on pension knowledge that is significant at the 5% level according to specification 4. According to the first two specifications on the other hand (the preferred specifications from an economic plausibility point of view), this effect is not significant at the 5% level and the point estimate is even negative.
The effects of the other control variables sometimes differ from those in Table A1. According to the estimates using moments in differences only, the estimates are imprecise and none of them are significant. If moments in levels are used in addition (specifications 1 and 3), we find a positive relation between pension knowledge and home ownership, being the main earner in the household, and being married, and a negative relation with household size. None of the estimates suggest that there is a direct effect of labour market status on pension knowledge.
Table 3 presents the same results as Table 2 for models explaining the subjective measure of pension knowledge, feel_informed. The results are rather similar. The specifications using moments in levels are rejected by the specification tests, but the two specifications using moments in differences seem to be supported by the data. Specification 4 assumes there is no reverse causality (no effect of feeling informed on reporting having received a pension overview) and gives a significant and positive effect of receiving a pension statement on subjective pension knowledge. To interpret the size of the effect, note that feel_informed is measured on a scale from 1 to 6, with a mean of 3.76 and a standard deviation of 1.33. Even for this specification, the coefficient on receiving a pension statement therefore seems rather small: keeping everything else constant, receiving a pension overview increases the feeling of being informed by about one-ninth of a standard deviation.
Table 3. GMM estimates of models for subjective pension knowledge (feel_informed)
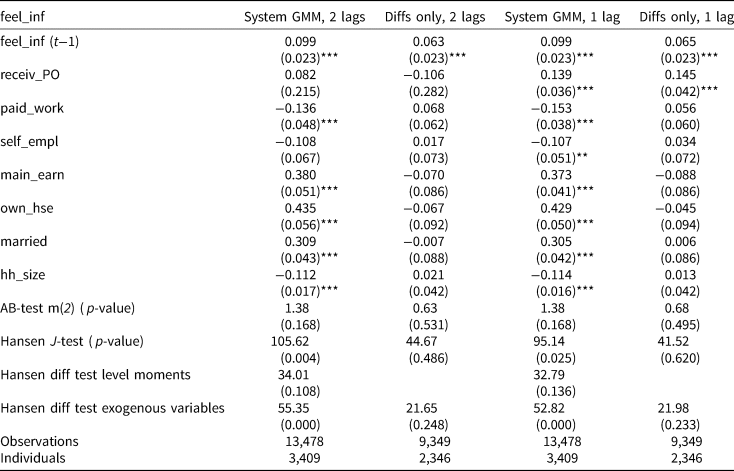
Notes: Time dummies included in all regressions but not presented. Two-step system GMM estimates with robust standard errors. Standard errors of parameter estimates and p-values of test statistics in parentheses. See main text for details on the four specifications.
*p < 0.1; **p < 0.05; ***p < 0.01.
The effects of home ownership, being the main earner, marital status and household size are in line with those in Table 2. According to some specifications, labour market status also has a direct effect (other than through pension overview receipt): workers, and particularly the self-employed, feel less informed than non-workers.
5.2 Models explaining active pension decision-making
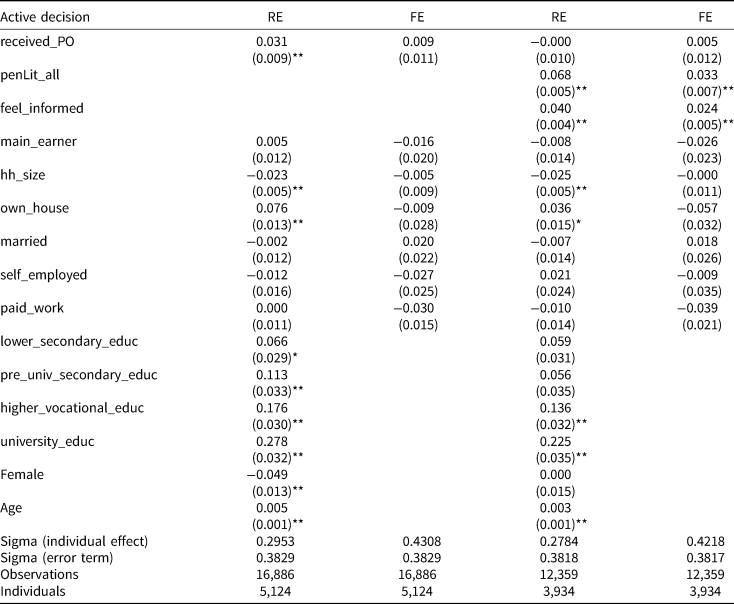
Table A3 in the Appendix presents the results of RE and FE linear probability models explaining the dummy variable for active pension decision-making, cf. Figure 1.Footnote 15 The coefficients on the objective and subjective indexes of pension knowledge are both positive and strongly significant according to the RE as well as the FE model. (In fact, the size of the coefficients is only somewhat larger if the other index is dropped from the equation.) Conscious decision-making is positively associated with pension knowledge, controlling for the other variables and for time persistent unobservables. Like before, we cannot claim that this necessarily reflects a causal effect – it might be that, for example, getting more involved in pensions due to some exogenous event not only leads to more active and conscious decision-making but also to an effort that increases pension knowledge. Note that the differences between FE and RE estimates are substantial – the RE estimates are about twice as large. This suggests that some time-persistent unobservable factors drive pension knowledge and conscious decision-making in the same way. Indeed, formal (Hausman) tests of the RE assumption that individual effects are not correlated with the pension knowledge regressors lead to the conclusion that the RE assumption is violated.
Keeping pension knowledge and other regressors constant, the effect of receiving a pension overview on active decision-making is essentially zero. This instrument of pension communication may therefore have an indirect effect by improving pension knowledge (Section 5.1), but there is no evidence that in addition, it would have a direct effect. In the FE model, none of the other control variables is significant. According to the RE estimates, there is no significant difference between men and women once we control for the two measures of pension literacy. Respondents with higher education, older respondents, and respondents in smaller households are more conscious decision makers than others. As before, these associations may reflect a correlation between these explanatory variables and time-persistent individual traits driving conscious decision-making.
5.2.1 Causal effects
We follow the same identification approach as in Section 5.1 to estimate the causal effect of pension knowledge and receiving a pension overview on conscious pension decision-making. FE are eliminated by taking first differences, and lagged values are used as instruments for pension knowledge and the dummy received_PO. We always use at least two lags to construct instruments for the lagged endogenous variables in the model.Footnote 16 The main identifying assumption is that pension knowledge and receiving a pension statement can be affected by (the unpredictable part of) past decisions, but not by current or future values of the same variables. Selected GMM estimates are presented in Table 4.Footnote 17 The first specification can be seen as a reduced form where active decision-making is directly regressed on receiving a pension statement dummy and other covariates, ignoring the information on pension knowledge. The other specifications introduce objective and/or subjective pension knowledge as a (potentially endogenous) explanatory variable. None of the specification tests reject any of the four selected specifications at the 5% level.
Table 4. GMM estimates of models for active pension decision-making

Notes: Time dummies included in all regressions but not presented. Two-step system GMM estimates with robust standard errors. Standard errors of parameter estimates and p-values of test statistics in parentheses.
*p < 0.1; **p < 0.05; ***p < 0.01.
The results clearly suggest that there is a positive effect of pension knowledge on our index of conscious pension decision-making. Both objectively and subjectively measured pension knowledge are significant at the 5% level, even if both are included at the same time (specification 2). An increase in the objective (subjective) score raises the probability of conscious decision-making by 13.0 (9.8) percentage points, keeping other factors constant.
On the other hand, in line with the results in Table 3, the effect of receiving a pension statement is much less clear. In the reduced form, the effect is positive but not significant. Only if we include the subjective but exclude the objective measure of pension knowledge, the parameter on receiving pension information becomes marginally significant (specification 4). If both measures of pension knowledge are kept constant, the estimated effect of receiving pension information is essentially zero (specification 2). This suggests that if sending a pension overview leads to more active pension planning, then this is fully mediated by pension knowledge.
5.2.2 Heterogeneous effects
Until now, we have assumed that the effects of receiving a pension overview and pension knowledge are the same for everyone in the sample. This may not be a valid assumption. In particular, in their analysis of financial literacy investment and its relation to pension asset returns, Lusardi et al. (Reference Lusardi, Michaud and Mitchell2017) emphasize the differences between respondents with low and high education levels. One reason for such differences in their US context is that the gains of financial literacy are probably much larger for the higher educated, since the low educated mainly rely on old age social security pensions where active decision-making is not such a big issue. A similar argument applies in the Netherlands, where low educated individuals depend much more than the higher educated on the public old age pension (AOW) which does not have any flexibility or any opportunity for choice. We therefore also estimated the main models in Tables 2–4 separately for lower and higher educated individuals.
The estimates of the models explaining subjective or objective pension knowledge do not provide any new insights – the results are similar for the two educational groups, and also similar to the results for the complete sample in Tables 2 and 3. Some models show a positive association between subjective pension literacy and receiving a pension overview, but if we use instruments that allow for recall bias (at least two periods lagged), there is no evidence of a causal effect of pension overview receipt on either subjective or objective pension knowledge for either educational group.Footnote 18
The main results for the models explaining active pension decision-making by education level are presented in Table 5.Footnote 19 Among the higher educated, 55.3% are active pension decision makers, compared to 41.5% among the lower educated. The top panel reproduces the results from Table 4. The second and third panel present the same estimates using the separate subsamples of lower and higher educated respondents. The estimates reveal a clear pattern: the effect of pension knowledge on active pension decision-making is much stronger for the higher than for the lower educated. This result is in line with the framework of the Elaboration Likelihood Model (Petty and Cacioppo, Reference Petty and Cacioppo1986) in which both involvement and ability are necessary conditions for conscious decision-making: The higher educated have more to gain from active decision-making and therefore more involved. If they also have sufficient pension knowledge, they will make conscious decisions. The lower educated often have less to gain and are not involved. Knowledge alone is not enough to turn them into active pension decision-makers.
Table 5. GMM estimates of models for active pension decision-making: joint and separate estimates for low and high education level – main coefficients only (cf. Table 4)
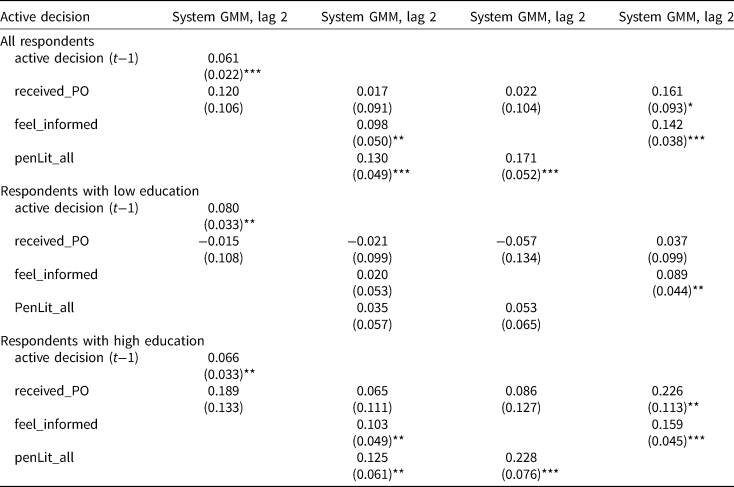
Notes: Time dummies included in all regressions but not presented. Two-step system GMM estimates with robust standard errors. Standard errors in parentheses.
*p < 0.1; **p < 0.05; ***p < 0.01.
6. Conclusions
Many countries spend a substantial effort and large amounts of money on pension communication, aimed at informing individuals and helping them to make better pension-related decisions. Studies on the effectiveness of these communication strategies are scarce. In this paper, we use variation in the provision of an annual pension overview to Dutch workers with an occupational pension to estimate the effect of providing information on pension knowledge and active pension planning. We exploit unique longitudinal data following a large sample of individuals over a long time-period and exploit the timing of events to identify the effects of interest. The empirical results suggest that providing an annual pension statement might have a small positive effect on pension knowledge. This result, however, is sensitive to the identifying assumptions. The second main finding is that pension knowledge has a positive causal effect on active pension decision-making. This finding is much more robust than the former. An analysis by educational group shows that it is mainly due to individuals with higher education levels, who have more to gain from active pension decision-making. Keeping pension knowledge constant, we do not find much evidence of a (direct) effect of providing pension information on active pension decision-making.
There is abundant evidence that (general) financial literacy has a positive effect on thinking about retirement in many countries (Lusardi and Mitchell, Reference Lusardi and Mitchell2011), including the Netherlands (Van Rooij et al., Reference Van Rooij, Lusardi and Alessie2012). Our finding that (specific) pension knowledge of pensions induces conscious pension decision-making is clearly in line with this. On the other hand, the literature on the effectiveness of various tools to improve financial and pension literacy is inconclusive (cf., e.g., Fernandes et al., Reference Fernandes, Lynch and Netemeyer2014; Lusardi et al., Reference Lusardi, Michaud and Mitchell2017). For the Dutch pension overview in particular, policy makers have already concluded that the content and size of this type of document must be geared more towards helping individuals instead of fulfilling the legal obligation to provide correct (and complete) information. Even then, however, the lack of pension awareness and conscious pension decision-making in many countries, irrespective of their pension systems and communication policies, suggest that information provision alone will not be enough to guarantee that individuals make pension-related decisions that are in their own best interest.
Lusardi et al. (Reference Lusardi, Michaud and Mitchell2017) and Clark et al. (Reference Clark, Morrill and Allen2012) emphasize the importance of timing: financial education is more effective when offered at the right time, e.g., when the worker has a new job or close to another important life event (marriage, divorce, children, etc.). Our current data do not provide information on when an individual received the pension overview, so that we cannot check whether timing plays a role in our context.
Eliminating opportunities for poor choices and designing a choice architecture that prevents inferior decisions for most individuals can be much more effective instruments to improve the quality of pension-related decisions without taking away individuals' own responsibility for an adequate pension. In the US context where occupational pension plans are often not mandatory, Benartzi and Thaler (Reference Benartzi and Thaler2013) emphasize the importance of availability (of an occupational plan), automatic enrolment (as the default, with an opt-out option), automatic investment (a default investment), and automatic escalation (higher investment if the salary increases). They argue in favour of specific products that account for what we know from behavioural economics, particularly so-called Save More Tomorrow plans, where individuals commit now to saving later, automatically increase their savings with every pay rise, and by default keep saving until reaching a pre-set limit or actively choose to opt out. In the Dutch context, such schemes might be relevant for the self-employed in particular, who do not have mandatory occupational pension savings. Another example in the Netherlands would be the default investment of pension savings in a defined contribution scheme in the decumulation phase. Since recently, risky investment is possible, with uncertain but probably higher annuities than in case of risk-free investment, the current default. Changing the default is likely to be much more effective than providing information on the possible options.
Acknowledgements
The authors would like to thank two anonymous reviewers, Andrea Weber, Eduard Ponds, and other participants of the 2018 Netspar International Pension Workshop for helpful suggestions and useful comments.
Appendix
See Tables A1–A3.
Table A1. Random- and fixed-effects models explaining the objective measures of pension literacy
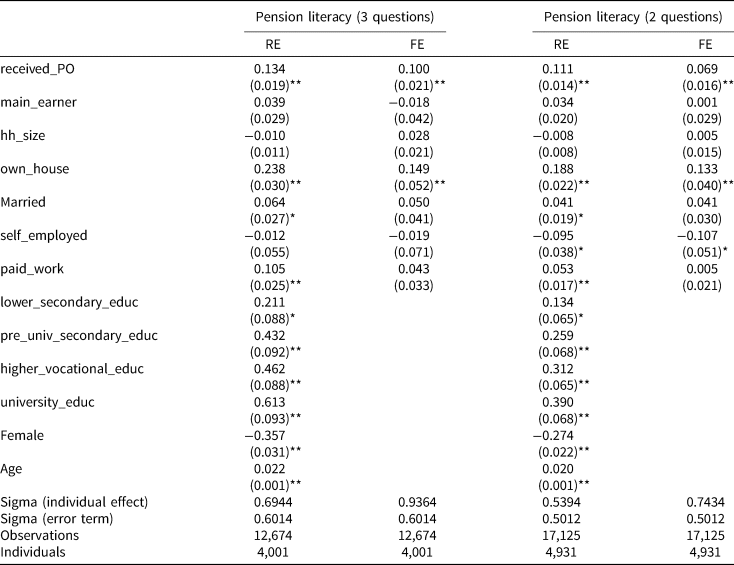
Table A2. Random- and fixed-effects models explaining subjective pension literacy
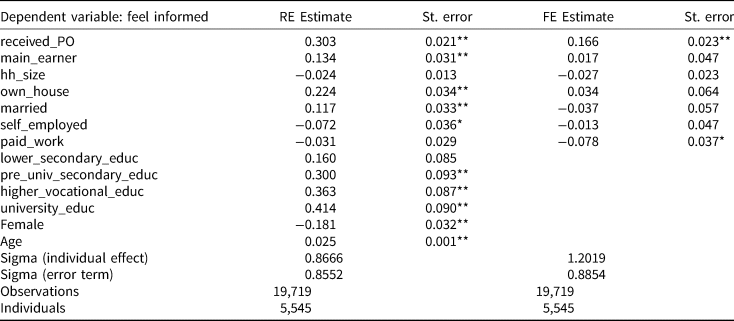
Table A3. Random- and fixed-effects models for active pension planning


 Open access