


1. Introduction
Rice is the most important food crop in the world, feeding more than half of the world population (FAO, 2008; Ansari et al., Reference Ansari, Shaheen, Bukhari and Husnain2015). More than 90 per cent of the rice in the world is produced and consumed in Asia, where 60 per cent of the population lives (Khush and Virk, Reference Khush and Virk2000; Singh et al., Reference Singh, Singh, Mishra, Singh, Sharma and Singh2015b). India is the second-largest rice producer in the world and rice contributes nearly 20 per cent of the total caloric energy and more than 20 per cent of the total protein per capita requirement in the country (Ward et al., Reference Ward, Ortega, Spielman, Singh and Magnan2013). It is estimated that 25 per cent more rice needs to be produced by 2030 to meet the demand of the increasing world population (Wani and Sah, Reference Wani and Sah2014). However, rice production is being severely affected by abiotic stress conditions in different environments and this is further aggravated by the changing climate. Within a crop cycle, rice faces various abiotic stresses such as submergence, drought, salinity and cold (Jena et al., Reference Jena, Bharathkumar, Reddy and Mohapatra2015).
These abiotic stresses greatly reduce productivity, resulting in severe economic losses for some of the poorest marginal communities that predominantly depend on rice cultivation for their livelihood. One solution to meet the challenges of abiotic stresses is the development and adoption of stress-tolerant rice varieties (STRVs). Developing stress-tolerant rice through breeding brings enormous value relative to investment and promises to be an effective approach for strengthening food security (Tester and Langridge, Reference Tester and Langridge2010). To increase yield potential under abiotic stress conditions, breeders at the International Rice Research Institute (IRRI) developed the submergence-tolerant variety Swarna-Sub1 (hereafter referred to as SS1) in 2009 and the drought-tolerant variety Shabhagi Dhan in 2010, which are suitable to conditions in India (Gregorio et al., Reference Gregorio, Islam, Vergara and Thirumeni2013).
Although abiotic STRVs have been released, their effectiveness depends on the extent of their adoption by farmers, specifically in areas affected by recurring climate change externalities. Numerous factors influence farmers' decisions to adopt or not to adopt a new STRV. These factors include information exposure, social connectedness, risk-taking capacity, perceived chances of risk (e.g. flooding, drought), market forces, government programs or policies, developmental efforts and others, besides varietal appeal such as stress tolerance and perceived yield gain (Ghimire et al., Reference Ghimire, Mehar and Mittal2012). The awareness of technology is a necessary condition for technology adoption, but often limited access to information acts as a major constraint (Diagne and Demont, Reference Diagne and Demont2007). The significance of access to information in technology adoption is widely documented in the existing literature (Marra et al., Reference Marra, Hubbell and Gerald2001; Matuschke and Qaim, Reference Matuschke and Qaim2009; Dandedjrohoun et al., Reference Dandedjrohoun, Diagne, Biaou, N'cho and Midingoyi2012; Kabunga et al., Reference Kabunga, Dubois and Qaim2012a, Reference Kabunga, Dubois and Qaim2012b; Genius et al., Reference Genius, Koundouri, Nauges and Tzouvelekas2014; Shiferaw et al., Reference Shiferaw, Kebede, Kassie and Fisher2015; Singh et al., Reference Singh, Singh and Kumar2015a). Several of those adoption studies assumed access to information equivalent to complete information on technologies (Neill and Lee, Reference Neill and Lee2001; Staal et al., Reference Staal, Baltenweck, Waithaka, DeWolff and Njoroge2002; Edmeades, Reference Edmeades and James2008; Kassie et al., Reference Kassie, Shiferaw and Geoffrey2011). Another group of studies on technology adoption also emphasized that, even though access to information or awareness is a necessary condition for technology adoption, it may not be sufficient in the case of knowledge-intensive technologies. In such a situation, information exposure may be complex and there is thus a need to account for different levels of information exposure (Kabunga et al., Reference Kabunga, Dubois and Qaim2012a). The quality of the information as well as its source have received renewed interest due to the potential of affordable last-mile access to information via modern technologies, including smartphones and other ICT platforms.
In this article, we hypothesize that the adoption of climate-smart varieties is an information-intensive process (please refer to appendix II in the online appendix) and requires a threshold level of information to make an informed choice, the absence of which leads to heuristic choices. As such, heuristic choices that are not well-informed lead to mounting dissatisfaction and faster dis-adoption of technologies. Given the adoption background of the STRVs, the present study analyzes the effect of information access on the adoption of submergence-tolerant rice variety ‘SS1’ and its impacts on rice yield and income in three eastern states of India: Assam, Odisha and West Bengal. The adoption decision was conceptualized as a sequential process passing through different stages of information. For example, in the first stage of information (access to information), the farmer may be exposed to a climate-smart variety; in the next stage (learning stage), the farmer invests in collecting additional information and thereby increases his/her knowledge, leading to sustainable adoption of the climate-smart variety.
2. Background and related literature
2.1 Abiotic stress and climate-smart varieties
In the face of changing climate, drought and submergence are two major abiotic stresses which significantly constrain rice production in India. Out of nearly 20 million hectares (Mha) of rainfed rice in India, about 14 Mha are prone to drought (Arora et al., Reference Arora, Bansal and Ward2015) and the value of rice production lost in drought years has been estimated to be as high as 36 per cent of the total value of rice production in eastern India, costing several hundred million dollars per year (Pandey et al., Reference Pandey, Wang, Bhandari, Johnson, Haefele and Hardy2012). On average, 10–12 Mha of rice area are flood affected every year, causing losses to human life, property, forests and crops (NRAA, 2013). Flash floods can occur at any stage of crop growth and can damage the crop completely. Consequently, rural poverty and food insecurity are persistent in those rainfed and flood-prone rice production areas. About 30 per cent of the 700 million people living in absolute poverty in Asia are from rainfed rice-growing areas of South Asia, and half of them live in India, Bangladesh and Nepal. They live in the rainfed areas that are prone to abiotic stresses (Ismail et al., Reference Ismail, Singh, Singh, Dar and Mackill2013).
Green revolution rice technologies have played a critical role in improving food security and reducing poverty in many developing Asian countries (Evenson and Gollin, Reference Evenson and Gollin2003; Hazell, Reference Hazell2010). In the early stage of the green revolution, many technologies were developed and disseminated to the irrigated and favorable rice environments. But they have largely avoided unfavorable growing environments such as areas affected by droughts, floods, salinity, soil toxicity and nutrient deficiencies, resulting in low and uncertain yields in eastern India (Khush, Reference Khush1990; Samal et al., Reference Samal, Pandey, Kumar and Barah2011).
To counteract flood risk, the IRRI developed SS1, a submergence-tolerant rice variety, through marker-assisted backcrossing of the Sub1 QTL (quantified trait locus) from Indian rice cultivar FR13A into the most popular Indian variety, Swarna (Neeraja et al., Reference Neeraja, Maghirang-Rodriguez, Pamplona, Heuer, Collard and Septiningsih2007; Septiningsih et al., Reference Septiningsih, Pamplona, Sanchez, Neeraja, Vergara, Heuer, Ismail and Mackill2009). SS1 can survive up to 14 days of full submergence and, under normal conditions, studies find no significant differences in agronomic performance, grain yield and grain quality between Swarna and SS1 (Sarkar et al., Reference Sarkar, Reddy, Sharma and Ismail2006; Neeraja et al., Reference Neeraja, Maghirang-Rodriguez, Pamplona, Heuer, Collard and Septiningsih2007). SS1, however, shows a twofold or higher yield advantage over Swarna after submergence for 10 days or more during the vegetative stage (Septiningsih et al., Reference Septiningsih, Pamplona, Sanchez, Neeraja, Vergara, Heuer, Ismail and Mackill2009). SS1 has been distributed in eastern India by IRRI under the Stress-Tolerant Rice for Africa and South Asia Project and its collaborators. Starting in 2010, seed distribution was significantly expanded when the National Food Security Mission included STRV in its eastern India programs.
2.2 Information, technology adoption and economic impacts
The agri-food system has gone through major changes in India, which makes agricultural knowledge and information intensive (Birthal et al., Reference Birthal, Kumar, Negi and Roy2015). Many new technologies were introduced rapidly and knowledge transfer in agriculture is generally not at the expected pace, especially in the case of small and marginal farmers (Raghu et al., Reference Raghu, Manaloor and Nambi2014). Several studies have shown that access to information or extension services significantly increased the probability of adoption of agricultural technologies such as improved varieties, which in turn increased crop yields (Matuschke et al., Reference Matuschke, Mishra and Qaim2007; Shiferaw et al., Reference Shiferaw, Kebede, Kassie and Fisher2015; Ainembabazi et al., Reference Ainembabazi, Asten, Vanlauwe, Ouma, Blomme, Birachi, Nguezet, Mignouna and Manyong2016; Wossen et al., Reference Wossen, Abdoulaye, Alene, Haile, Feleke, Olanrewaju and Manyong2017).
Varma (Reference Varma2018) analyzed the role of access to information in the adoption of System of Rice Intensification (SRI) technology in India, where 96 per cent of SRI adopters received information whereas only 56 per cent of SRI non-adopters received information. The role of information is critical, especially when a technology is new to an area; and a study done by Keil et al. (Reference Keil, D'Souza and McDonald2017) showed that access to extension service was significantly associated with the awareness and adoption of zero tillage technology in the Eastern Indo-Gangetic Plain. Although information on technology plays a vital role, having access alone will not influence adoption behavior, as the quality of the information will also influence behavior, especially in the case of knowledge-intensive technologies.
Yokouchi and Saito (Reference Yokouchi and Saito2016) found that about 20 per cent of farmers stopped growing new rice varieties in Africa due to the lack of appropriate information on the varietal characteristics and farming practices of the respective varieties. In recent years, farmers have expected to obtain information on weather forecasts and advisories for agricultural inputs, agronomic practices, pest management, markets and prices (Aker, Reference Aker2011). Farmers' exposure to risk and uncertainty is often aggravated by the lack of information about weather, inputs, farm management practices or market prices, which adversely affects crop production and income (Mittal, Reference Mittal2012; Mittal and Mehar, Reference Mittal and Mehar2012).
In addition to information related to new technologies, farmers value other supplementary information when making adoption decisions. There is a significant and positive association between market information and the adoption of new rice varieties in Pakistan, and a study highlighted the fact that farmers need up-to-date information regarding inputs, new technology, developed and released improved varieties, prices and new agronomic practices (Chandio and Yuansheng, Reference Chandio and Yuansheng2018). Apart from information access related to crop varieties, access to seasonal climate forecast information influenced planting/harvesting of the crop and the adoption of improved crop varieties in Africa and South Asia (Wood et al., Reference Wood, Jina, Jain, Kristjanson and DeFries2014). Studies by Aker (Reference Aker2011) and Mittal and Mehar (Reference Mittal and Mehar2015) indicated that access to market information had a positive influence on the adoption of new seed technologies, and increased crop productivity and the livelihood of the farmers. The major barriers in adopting drought-tolerant maize in eastern and southern Africa are the unavailability of improved seed, inadequate information and resources, and farmers' perceptions of variety attributes (Fisher et al., Reference Fisher, Abate, Lunduka, Asnake, Alemayehu and Madulu2015).
Besides access to information, the quality of and trust in the information are important criteria in adoption decisions. A study by Ward and Pede (Reference Ward and Pede2015) reveals that farmers' decisions to adopt hybrid rice technology are based on frequent interaction with peers about their learning and experience with those varieties, and they directly link the quality of and trust in the information. Information reach through formal agricultural extension was found to be slow. Strengthening agricultural extension services and improving the skill of extension officers in supplying good-quality information minimizes the risk in adoption due to lack of trust and incomplete information transfer (Beyene and Kassie, Reference Beyene and Kassie2015). Small farmers in various countries have indicated a willingness to pay for extension services that meet their needs (Gautam, Reference Gautam2000; Holloway and Ehui, Reference Holloway and Ehui2001), showing that information quality is central for technology adoption and dissemination.
The impact of information (or extension access) on agricultural productivity, income and household welfare was analyzed across different studies earlier (Owens et al., Reference Owens, Hoddinott and Kinsey2003; Dinar et al., Reference Dinar, Karagiannis and Tzouvelekas2007; Birthal et al., Reference Birthal, Kumar, Negi and Roy2015; Wossen et al., Reference Wossen, Abdoulaye, Alene, Haile, Feleke, Olanrewaju and Manyong2017). Some of the studies estimated direct impacts whereas few of them addressed impact through the technology adoption pathway. A study on agricultural extension programs for smallholder women farmers in Uganda showed that technology adoption leads to improved food security for farmers and better shock-coping methods (Pan et al., Reference Pan, Smith and Sulaiman2018). Birthal et al. (Reference Birthal, Kumar, Negi and Roy2015) estimated an enhancement of net return in farming by 12 per cent through information averaging across different cropping systems. Farmers who adopted stress-tolerant varieties could mitigate yield loss under stress conditions and reported an increase in rice yield of 15.5 per cent (Jie-hong et al., Reference Jie-hong, Li-qun and Yu2018). Khatri-Chhetri et al. (Reference Khatri-Chhetri, Aryal, Sapkota and Khurana2016) found a significant increase in the adoption of various climate-smart practices and technologies in target areas, and this resulted in substantial economic benefits for smallholder farmers.
This article contributes to adoption literature that addresses the role of information, particularly the importance of good quality information in driving technology adoption decisions. Although several studies exist on the role of information in the adoption of technology, few studies depart from equating information access to complete information. Among those few studies, our study simultaneously considered information content (as a quality indicator) along with information access as driving factors in adoption decisions. Second, we evaluated the adoption process in a stage-wise approach, distinguishing between informed choices and non-informed choices. Such informed choices lead to sustainable adoption, which gives policymakers insight into the pathway for better dissemination of technology using information platforms.
The remainder of the article is organized as follows. Section 3 briefly describes the study region and sampling procedure. Section 4 discusses the analytical approach to estimating the adoption of SS1 using a sequential logit framework, and then develops an empirical model to estimate the effect of information on STRV adoption. We present and discuss the main analytical results in section 5, consisting of the performance of submergence-tolerant rice varieties during normal and flood conditions, details on information on STRVs, the sequential adoption model and the projected impact of SS1 under different information scenarios. Section 6 concludes the study, drawing major findings and policy implications.
3. Study region and sampling
3.1 Study area
This study was conducted in three eastern Indian states: Assam, Odisha and West Bengal. Eastern India contributes nearly one-third of the country's total rice area and production. Table A1 in the online appendix illustrates the importance of the study area vis-à-vis the Indian rice scenario. The kharif (wet) season in these three states contributes one-fourth of the total rice area and production. As noted from table A1, approximately 30 per cent of the total rice area in these three states experienced flood in the 2015 kharif season.
3.2 Sampling and data
A primary survey was conducted in three eastern Indian states: Assam, Odisha and West Bengal. The flood-affected (pertaining to wet season, 2015) rice areas were identified using remote-sensing information (see figure A1 in the online appendix) and accordingly the list of villages was prepared. A total of 475 villages (155 in Assam and 160 each in Odisha and West Bengal) from 41 districts (19 in Assam, 13 in West Bengal and 9 in Odisha) were selected for this study. A census of all these villages was carried out and, from the census information, a list of all rice farmers was prepared. Ten rice farmers were randomly selected from each village. The final sample comprises 4,744 rice-farming households from three eastern states (see table A2, online appendix).
A comprehensive household questionnaire was developed using the Surveybe computer-assisted personal interview (CAPI) software, and data collection started immediately after the wet season harvest (December 2015 to April 2016). The questionnaire contains different modules pertaining to household and socioeconomic conditions, stress occurrence, SS1 adoption, incremental gain due to SS1 adoption, household spending and so forth.
Census data was collected from 4,744 households belonging to 475 villages (table A2). Because of some technical and logistical issues, a few sampled households/villages had to be excluded from the final analysis. The final sample used for the analysis contained data from 475 villages and 4,698 households. From the sampled households, it is evident that Odisha has a higher level of SS1 adoption (16.6 per cent) than West Bengal (4.2 per cent) and Assam (1.9 per cent).
4. Estimation procedure
4.1 Sequential adoption
The adoption decision on climate-smart varieties is a two-stage process: first is the acquisition of information on the variety and its advantages to farmers (access and learning) and second is the person adopting the variety (adoption). The learning stage comprises access to information on STRVs and passing through effective information transitions. Thus, the adoption decision is a sequential process as described in the decision tree (figure 1) and at each stage farmers evaluate future utility and make choices accordingly. For example, in the first stage of access to information, the farmer may be exposed to a climate-smart variety (with a probability of ${\pi _1}$ ) and, in the learning stage, the farmer makes an effort to collect additional information and thereby increase his/her knowledge on SS1 (${\pi _2}$
 proportion able to pass the effective information hurdle). Thus, in learning-stage information, farmers collect information pertaining to the net present value of the potential profit from adopting SS1, which leads to the adoption decision regarding SS1 (probability of ${\pi _3}$
 ). Evaluation of the perceived utility of information on STRVs depends on the individual's capacity and other socioeconomic as well as farm characteristics.
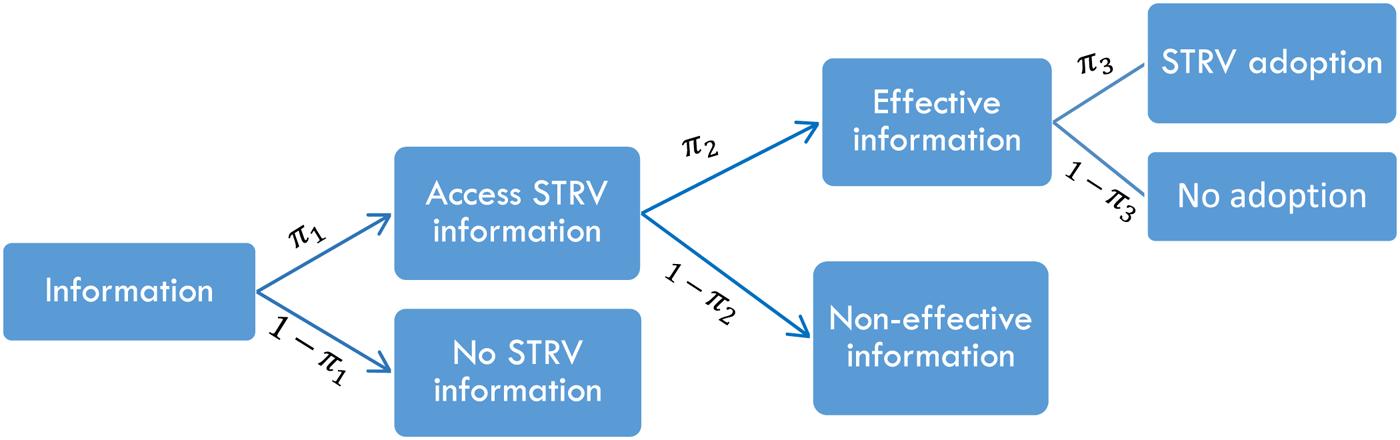
Figure 1. Sequential adoption decision process with effective information.
The sequential adoption decision process can be modeled using a utility framework (Dimara and Skuras, Reference Dimara and Skuras2003; Shiferaw et al., Reference Shiferaw, Kebede, Kassie and Fisher2015). The first-stage learning process and information acquisition at optimum level $( {{L^O}} )$ is an outcome of an underlying utility maximization problem, which depends on the farmer's socioeconomic and demographic factors and farm characteristics, as well as perceived incidence of risk. The farmer is aware $( {A_{L, i}^\ast } )$
 of the STRV if the level of information acquired is above the threshold level $( {{L^T}} )$
 (Saha et al., Reference Saha, Love and Schwart1994) That is,

where $\tau$ is a vector of parameters to be estimated and ${\varepsilon _L}$
 is the error term related to the first stage of the adoption process (learning and awareness). Since $A_{L, i}^\ast$
 is an unobservable latent variable, we observe whether the farmer is aware or not $( {A_{L, i}}) \;$
 such that

In the next stage, the producer evaluates the potential future utility of the stress-tolerant variety. We used the utility framework rather than a profit maximizing one as this climate-smart technology increases the farmer's utility by reducing the risk of abiotic stresses, which depends on climatic fluctuations. Farmer i adopts stress-tolerant variety SS1 if the utility derived from the new variety is more than the utility from the old variety $( {U_{S, i}} \gt {U_{O, i}})$ . The adoption decision on the new variety by the farmer $( {A_{S, i}})$
 is
is

where $\beta$ is a vector of parameters to be estimated and ${\epsilon _A}$
 is the error term related to the second stage of the adoption process (adoption decision). In practice, one would observe only the qualitative variable ${A_i}$
 , the final adoption of a stress-tolerant variety. But ${A_i}$
 involves two hurdles: first, the farmers pass through information screening, and those who pass this hurdle are the potential adopters; and second, those potential adopters evaluate the potential benefits (utility) of STRV technology (new variety) vis-à-vis their own cultivated variety (old variety). Thus, the final adoption of a stress-tolerant variety is a partial observation (Dimara and Skuras, Reference Dimara and Skuras2003), given as

${A_i} = 1$ will occur when the farmer has an optimum level of information that is more than threshold information $( {A_{L, i}} = 1)$
 and the farmer decides to cultivate SS1 $( {A_{S, i}} = 1)$
 . ${A_i} = 0$
 can occur if either the farmer has a below-optimum level of information that is less than threshold information $( {A_{L, i}} = 0)$
 or, even if the farmer has acquired more than the threshold level of information and is aware of the STRV $( {A_{L, i}} = 1)$
 , she/he willingly decides not to adopt SS1 $( {A_{S, i}} = 0)$
 . The information level that facilitates this adoption decision (either to cultivate or not) when ${A_{L, i}} = 1\;$
 is often termed effective information (Varma, Reference Varma2018). $\pi = {\pi _1} \times {\pi _2} \times {\pi _3}$
 is the probability of people making a decision based on the above-described sequential adoption process passing through different hurdles of information and utility/benefit evaluation.
4.2 Empirical model
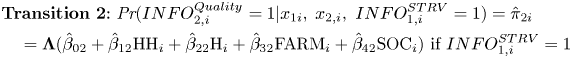
The effect of information on STRV adoption is decomposed into weighted sum of effects on odds of passing each stage (access to information $INFO_1^{STRV}$ , effective information $INFO_2^{Quality}$
 and adoption $ADOP{T_3}$
 ) with a sequential logit model. In this model, information quality is defined by considering both the content of the information and the source from which the person receives that information. A farmer may receive more than one content pertaining to the STRV, but one should be either information on SS1 or its seed, sourced from one or more trusted sources such as progressive farmers with prior STRV cultivation experience (Sp), NGOs involved in STRVs (Sn), institutionalized agricultural extension service providers (Se), seed dealers on seeds (Ss) or paddy traders on marketing (St). That is,

Thus, depending on information content, the trusted source may vary. For example, a formal agricultural extension service or university is a good source of information on STRV whereas seed dealers are a good source of information on seed availability, paddy traders are a good source for marketing of produce, and so on. The content should be a minimum of two pertaining to STRV and related information such as STRV seed availability, price and mitigating crop damage. All information that does not meet these two criteria is grouped as non-effective information.
Following Buis (Reference Buis2011, Reference Buis2015), the model assumes that the farmer is at risk of passing through each stage and had to pass through all lower stages. For example, if a farmer reaches stage 3 (adoption decision), she/he had to pass through two previous hurdles, $INFO_1^{STRV}$ and $INFO_2^{Quality}$
 . The model assumes that the person who adopted the STRV was ‘at risk’ of passing through the first two transitions, but the decisions at each stage are assumed to be independent. The sequential logit model is shown below:


The function $\boldsymbol{\Lambda}(.)$ denotes a standard logistic function $\left[{\Lambda (.) = \frac{{exp(.) }}{{1 + exp(.)}}} \right]$
 . The conditional probability that farmer i passes transition k is ${\hat{\pi }_{ki}}$
 , and ${\hat{\beta }_{mk}}$
 represents the association between the variable m (m includes household head (HH), household (H), farm (FARM) and social (SOC) characteristics of the farmer) and transition probability ${\hat{\pi }_k}$
 , and ${\hat{\beta }_{0k}}$
 is the constant for transition k. The model assumes that everybody is at risk in the first transition, that is, at the stage of the information on STRVs. The sequential logit model also models how the expected outcome differs between these individuals:

In this equation, x is the explanatory variable; $at\;ris{k_k}\;$ is the proportion of persons at risk of passing transition k; $varianc{e_k}$
 is the variance of the dependent variable for transition k, that is, $P{r_k}( {1 - P{r_k}} )$
 ; $gai{n_k}$
 is how much a person can expect to gain from passing transition k; and ${\beta _k}$
 is the effect of variable x on the log odds of passing transition k. Thus the total effect is a weighted sum of the effects on each transition, and a transition receives more weight when more people are at risk, and people can expect to gain much from passing that transition. It is important to note that neither does virtually everybody pass nor does virtually everybody fail that transition Buis (Reference Buis2011, Reference Buis2015).
5. Results and discussion
5.1 Descriptive statistics of the sample
5.1.1 Household characteristics
The important household characteristics are presented in table A3 in the online appendix. On average, 96 per cent of the sampled households have a male household head, and most of them are married. The average age of the household head is 50 years in both SS1 adopter and non-adopter groups. The average household size is 5 members across categories. On average, 14.6 per cent of the household heads are non-literate and 5.2 per cent are university graduates and above, whereas the remaining household heads finished either primary or secondary schooling. The household head's experience in rice farming is higher in the SS1-adopting households than in the non-adopting households. A significantly higher proportion of household heads (81 per cent) rely on farming in the SS1-adopting households than in non-adopting households (only 61 per cent). Consequently, the household income contribution from farming by SS1 adopters (43 per cent) is around 11 percentage points higher than for non-adopting households (32 per cent). The primary occupation of household heads, after farming, is non-agricultural labor (11.1 per cent) and self-employment (10.2 per cent). Overall, the SS1-adopting households are higher in households of other backward caste (OBC) and scheduled caste (SC) households vis-à-vis the general caste and scheduled tribe (ST) households.
5.1.2 Farm characteristics
SS1 adopters, on average, own 41 per cent more land (0.98 ha) than non-adopters (0.68 ha) as shown in table A4 (online appendix). But the operational landholding is higher than the owned land, indicating the prevalence of leased-in cultivation in the region. The land is primarily used for rice cultivation and the average number of rice varieties cultivated in the kharif season is three for SS1-adopting households and two for non-adopting households. It is surprising to see that more SS1 non-adopting households (68.8 per cent) reported that their agricultural land was affected by floods than did the SS1-adopting households (37.9 per cent). Similarly, the maximum famine days was found in SS1 non-adopting households (120 days per year) as compared with SS1-adopting households (30 days per years). Adopters have significantly higher access to information than non-adopters and they cultivate STRVs on more than 70 per cent of their land.
5.2 SS1 and its performance
5.2.1 SS1 yield under normal and submergence conditions
It is evident from table 1 that the number of SS1-cultivating households in the sample increased from 25 households in 2012 to 319 households in 2015. SS1 yield under normal conditions ranges from 3,595 kg/ha to 5,120 kg/ha across years. A range of 23.5 to 36.0 per cent of SS1-cultivating households reported flood occurrences and submergence of crops in different years. Few farmers reported that their paddy crop was affected by flood. Farmers obtained on average yield similar to normal yield during no submergence (97 per cent of normal yield). Overall, the yield trend clearly shows no negative impact of short-duration submergence (<7 days) on yield; rather, a higher yield gain is reported. At the same time, longer duration submergence affected the yield of SS1 in farm fields, but SS1 still produced approximately 3 tons per ha. As the number of days of submergence increased, yield started decreasing, which is in line with the findings of Singh et al. (Reference Singh, Mackill and Ismail2009) and Singh et al. (Reference Singh, Singh, Xalaxo, Verulkar, Yadav, Singh, Singh, Prasad, Kondayya, Rao, Rani, Anuradha, Suraynarayana, Sharma, Krishnamurthy, Sharma, Dwivedi, Singh, Singh, Nilanjay, Singh, Kumar, Chetia, Ahmad, Rai, Perraju, Pande, Singh, Mandal, Reddy, Singh, Katara, Marandi, Swain, Sarkar, Singh, Mohapatra, Padmawathi, Ram, Kathiresan, Paramsivam, Nadarajan, Thirumeni, Nagarajan, Singh, Vikram, Kumar, Septiningshih, Singh, Ismail, Mackill and Singh2016). Crop yield under crop submergence of more than 14 days also showed higher yield, which could be attributed to the extremely low reported occurrence of such floods and hence the sample size. One can speculate about higher yields during short-duration flood owing to the inflow of nutrients from upper fields in the event of a flood (i.e. water flows from upper fields to lower fields, carrying nutrients, thus working like fertigation), but further study is needed to support such a hypothesis. As the duration of flooding increases, this advantage is negated by poorer regeneration and/or mortality.
Table 1. SS1 yield under normal and submergence conditions

Notes: Numbers in parentheses are the standard deviation of the sample mean. Numbers in square brackets are the per cent of SS1-cultivating households that responded to the respective condition (e.g. either crop under normal conditions or under submergence).
Source: Household survey conducted by authors in 2015–2016.
5.3 STRV information (content, access and sources)
Information, not only access but also its content and source, plays a crucial role in disseminating a new technology or product. The content developed according to farmers' demand and preferences followed by channeling the information via a trusted source would be an ideal information package to influence the adoption behavior of farmers.
Adopters and non-adopters are clearly different in terms of access or exposure to information on STRVs (71.2 per cent of SS1 adopters versus 27.2 per cent of non-adopters had access to STRV information) (table 2). It is clear that information campaigns are vital for faster dissemination of STRVs.
Table 2. Source of information on stress-tolerant rice cultivation

Source: Household survey conducted by authors in 2015–2016.
We have classified the sources of information into two types: (i) households receiving information from a single source; and (ii) households receiving information from multiple sources. The dominating information source related to STRVs is through other fellow farmers across different adoption categories, followed by agricultural extension/officers in the single-source categories. SS1 adopters had more access to information and it is mainly through other farmers and the public agricultural extension system. Farmers often receive information from multiple sources – mainly the combination of informal and formal sources. Mass media (e.g. television) and paddy traders also play a vital role in disseminating information. To summarize, the most sought-after source of information for farmers is their peer group and often they obtain information from more than one source.
The information content accessed by farmers is mainly on seed, flood-tolerant variety, mitigating crop damage and output price (table 3). Farmers accessed the information as either one or a combination of two or more contents. The same content could be obtained from more than one source as well. The combination of information on seed (e.g. availability, seed rate, seed treatment) and flood tolerance plays a crucial role in SS1 adoption: nearly one-fourth of the adopting households received this package of information whereas only one-twelfth of the non-adopting households received this package of information. A similar trend is observed in village-level information flow and SS1 adoption. Another potential combination of multiple information is on seed and mitigation of crop damage.
Table 3. Type of information received on stress-tolerant rice cultivation

a Other information includes poor quality information that does not pertain to STRV. For example, the information such as general pest management, support schemes, credits, livestock and health is included in other information, which are not directly related to STRV, are classified as Other Information (poor quality information).
Source: Household survey conducted by authors in 2015–2016.
5.4 Sequential adoption of SS1
The probabilities of three stages of the adoption process due to information exposure are estimated using a sequential logit model. The transition probability of access to information is 51 per cent whereas the probability of passing an effective information stage is 43.4 per cent and final adoption is 24.7 per cent. That is based on the transitional conditional probability, among farmers having access to information on STRVs, that 48 per cent adopted SS1. The marginal effects of sequential logit model results are presented in table 4. In the first stage, the coefficient estimates showed a positive and significant effect of age, education, migration, credit availed and yield on access to information on STRVs (first transition). The probability of a university graduate farmer passing the first transition (that is, access to information on STRVs) is approximately 13 per cent higher than for a non-literate farmer. Anderson and Feder (Reference Anderson and Feder2003) highlight that the low literacy rates among small and marginal farmers imply that they are not able to take advantage of information available in electronic mass media such as written materials or the internet, which could potentially be used as an intervention to motivate farmers to adopt new technologies and production practices. Educated individuals process information about new technologies more quickly and effectively than uneducated individuals (Foster and Rosenzweig, Reference Foster and Rosenzweig2010). If any household member migrated for any seasonal work in the previous year, that person is more likely (4.1 per cent) to receive information on STRVs, and, for people who have availed themselves of credit, the probability is 7.3 per cent higher than for those who have not availed themselves of any institutional crop loan. The number of members in the household and number of varieties cultivated by the farmer are negatively associated with access to information on STRVs.
Table 4. Marginal effects of the sequential logit model on the effect of information on STRVs on SS1 adoption
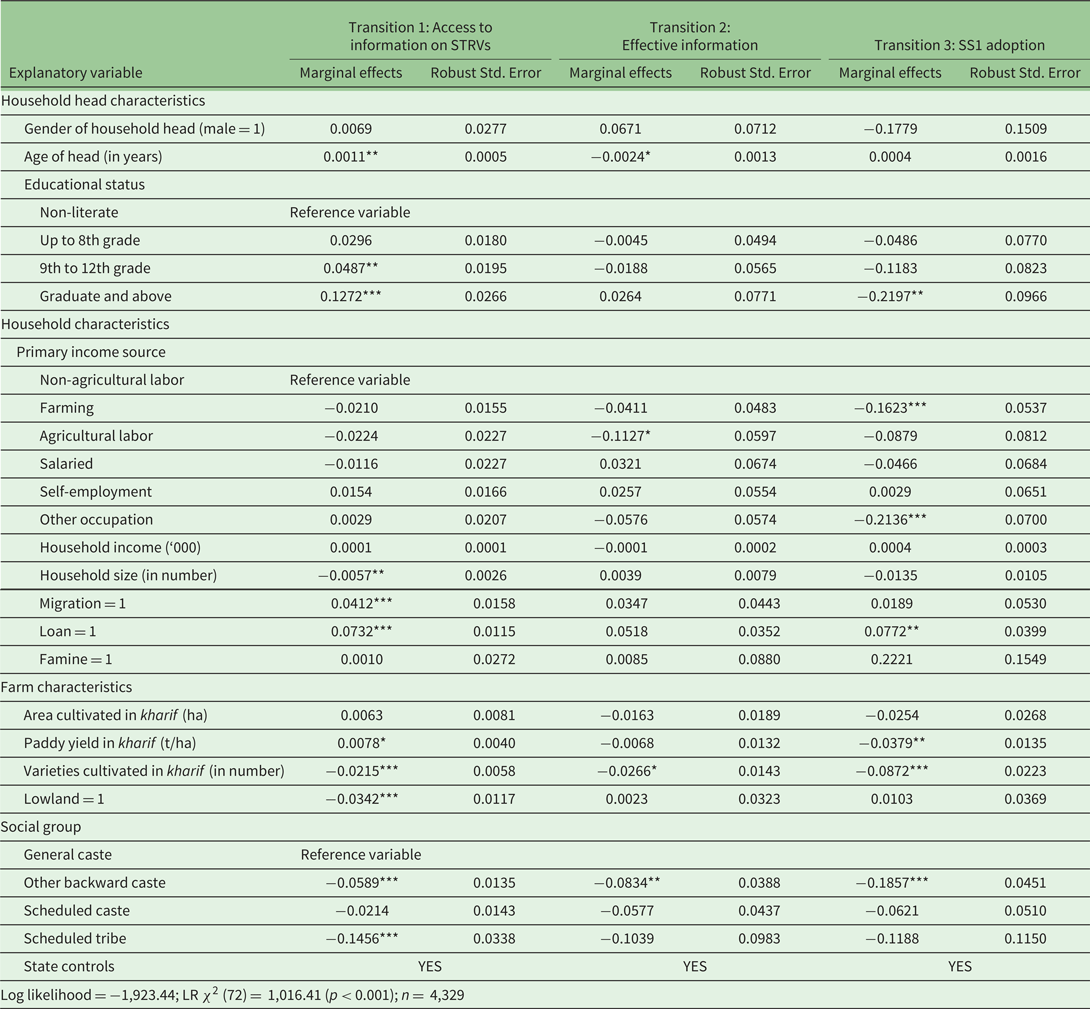
Note: *, **, *** Denotes statistically significant at 10 per cent, 5 per cent and 1 per cent levels of significance, respectively.
A farmer who cultivates only one variety has a 4.2 percentage-point-higher likelihood to access information on STRVs than a farmer who cultivates three varieties. Most likely, the latter might not be searching for information on varieties as this farmer has already had a few choices, whereas the former is a potential target for information on STRVs. The negative association of household size with access to information on STRVs seems a bit surprising. One would expect a positive association wherein the chances of exposure to information increase with household size as each member has his/her own information networks, making highly likely a wider network. But given that rural systems are confined within different social hierarchies, one would expect similar social networks and, in those contexts, the quality of the networks is more critical.
Age, primary income source, number of varieties and caste of the farmer significantly influence the second transition of passing information above the threshold level, qualifying it to a decision on adopting or not-adopting SS1. Younger farmers not belonging to the OBC made an effort to collect more information from multiple sources on STRVs than did older farmers belonging to the OBC. The probability of a 30-year-old farmer acquiring effective information is 7.2 percentage points higher than that of a 60-year-old farmer, whereas if the former belonged to the general caste and the latter to the OBC category, the probability of the 60-year-old OBC farmer passing the threshold information level decreased further by 15.5 percentage points.
The final transition, the adoption decision conditional on passing access and effective information stages, is influenced by level of education, caste, primary income source, current credit scenario, number of rice varieties cultivated and productivity. It is interesting to note that, by giving a non-literate and a graduate more than threshold information on STRVs, the chance of the non-literate farmer adopting SS1 is 22 per cent higher than for the farmer who is a university graduate. Although an initial bottleneck of cognitive delays in gathering and processing information was observed, less educated farmers are found to make positive decisions with reference to STRVs, probably because the perceived utility for them is much higher than for educated farmers who might have more risk-bearing capacity. Shiferaw et al. (Reference Shiferaw, Kebede, Kassie and Fisher2015) reported that the education level of the household members does not affect access to information because informal information access such as a social network is much stronger than the access to information from formal channels. Among the social caste groups, the OBC is significantly associated with a 23 per cent decrease in odds of adopting SS1 vis-à-vis the general caste group (18.5 per cent lower probability) if all other variables are at a similar level, whereas this is non-significant with half and three-fourths odds of adoption of SS1 for SCs and STs, respectively. The bias in the use of information by social identity was studied by Birthal et al. (Reference Birthal, Kumar, Negi and Roy2015) who found that small farmers have access to less information and depend on social networks for their information.
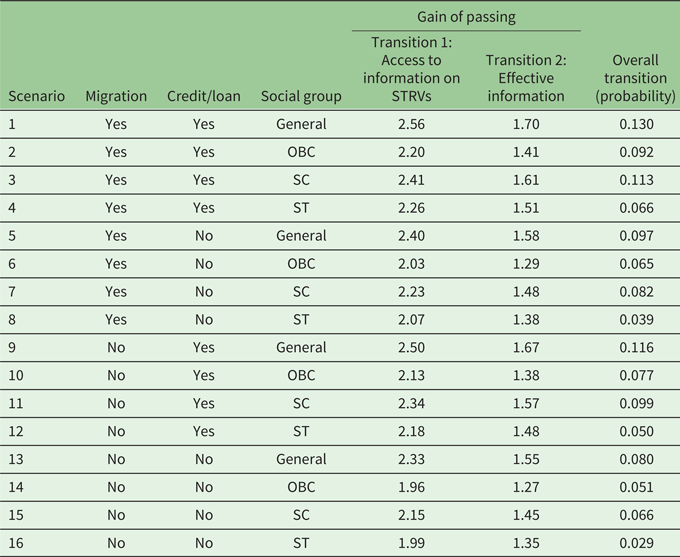
Table 5 presents the decomposition effects of education on adoption of SS1 in different scenarios. The last column (overall transition probability) indicates the total effect of education on SS1 adoption. For general caste farmers who have received credit and migrated for seasonal employment, the overall effect of education on the sequential adoption of STRVs is 13 per cent whereas it is 9.2, 11.3 and 6.6 per cent for the OBC, SC and ST groups, respectively. Within each social group, on average, a reduction of approximately 3 percentage points is observed if they did not take out credit, 1 to 1.5 percentage points if they did not migrate and around 5 percentage points if they did not take out credit and did not migrate. The column gain of passing indicates the level of education of those that pass minus the expected education of those that fail in different scenarios. For example, general caste farmers who have taken out credit and migrated for seasonal employment (on average secondary school-educated or above) are more likely to pass the access to STRV information stage than non-literate farmers, whereas the difference in education becomes narrower in the second stage of effective information. A similar trend of education is observed in all scenarios, indicating that the importance of education becomes weaker after each transition stage, as one must observe that passing each stage itself is an education for farmers.
Table 5. Decomposition effect of education on sequential adoption of SS1
5.5 Yield and income effects
5.5.1 Additional yield and income from SS1 cultivation
SS1 adoption is found to be scale neutral (table 6); average SS1 adoption area per household decreased over the years from 0.63 ha in 2010 to 0.41 ha in 2015. The average SS1 yield (computed by accounting for both normal and submergence conditions) ranges from 3,479 kg/ha to 4,422 kg/ha across the years. The yield obtained is in accordance with the results of Ismail et al. (Reference Ismail, Singh, Singh, Dar and Mackill2013). The average additional yield shown in table 6 is derived by comparing the yield of the variety that was cultivated in the same plot before adopting SS1 with the current yield from SS1 cultivation. The additional yield ranges from 13 to 23 per cent, with a last-four-year average increase of 18 per cent. Overall, from SS1 cultivation, the household gained an additional yield ranging from 527 to 1,023 kg/ha, amounting to an additional income of INR 5,127/ha to INR 9,019/ha (US$1 = INR 67.20 on 4 February 2017).
Table 6. Additional yield and income from SS1 cultivation

Notes:
a Average additional yield is the difference between the yield of SS1 and the yield of the variety cultivated before SS1 in the same plot.
Numbers in parentheses are the standard deviation of the sample mean.
Source: Household Survey conducted by authors in 2015–2016.
The treatment effect model, after controlling for potential counterfactuals using the propensity score matching (PSM) approach, also showed more pronounced adoption as well as its yield effects (for sensitivity analysis details, please refer to appendix III in the online appendix). The average treatment effect of access to information on SS1 adoption is estimated using PSM samples, which helps in reducing selection bias due to observed characteristics by establishing counterfactuals (Dahejia and Wahba, Reference Dahejia and Wahba2002). The PSM-based treatment effect showed 45 per cent more chance of adoption of SS1 for farmers having access to information on STRVs, whereas the yield increase by adopting SS1 is 16.4 per cent (546 kg/ha) and is presented in table 7.
Table 7. Average treatment effect (ATE) estimates for information access on SS1 adoption, and SS1 adoption on rice yield
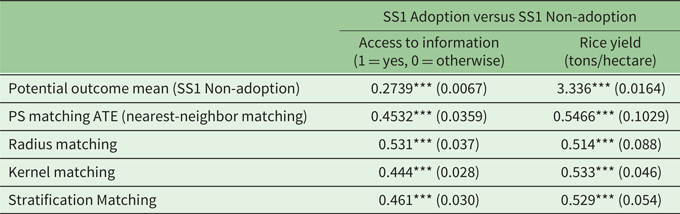
Notes: *** Denotes statistically significant at 1 per cent level of significance. Numbers in parentheses are the standard error.
Source: Household survey conducted by authors in 2015–2016.
5.5.2 Projected impact of SS1 adoption
The access to information on STRVs is strongly correlated with the adoption of SS1 or any other stress-tolerant variety. In this section, we estimate the projected impact of information reach on SS1 adoption, yield and income benefit. There are four scenarios based on the extent of information reach to flood-prone villages: the status quo defines the existing information reach; scenario I indicates that information on STRVs reaches 50 per cent of the flood-prone villages; scenario II indicates that information reaches 75 per cent of the flood-prone villages; and scenario III indicates that information reaches all the villages in the flood-prone areas in Odisha, West Bengal and Assam. We have used the conservative estimate of treatment effect of information on the adoption of information on STRVs (0.36) to estimate the projected impacts. If the information on STRVs reaches the flood-prone village, on average, 36 per cent of the rice farmers in that village are likely to adopt SS1, ceteris paribus (PS matching average treatment effect (ATE) and sequential logit model estimated an adoption of more than 45 per cent). Since we use the survey approach with random sampling of villages and farmers to obtain the total areas under SS1 in different scenarios, weights, or inflation factors, are required. The weights are constructed with two components: first, the inverse probability for a rice farmer being selected from the village census; second, the inverse probability for a village being selected among the list of villages within the state. The weight for rice farmer i of village j of state k can be written as:

where $\omega _{ij}^k$ is the weight for household i of village j of state k; $N_j^k$
 is the total number of rice-producing farm households in village j; $n_j^k$
 is the number of sample households of village j; ${M^k}$
 is the total number of rice-producing villages that are flood prone in state k; and ${m^k}$
 is the number of sample villages of state k. $N_j^k$
 is obtained from the village census and $n_j^k$
 and ${m^k}$
 are obtained from survey procedures. ${M^k}$
 is not available and hence is derived by dividing the total flood-prone rice area of the state obtained from the remote-sensing information by the average rice area at the village level. The additional yield at the village level for each scenario is derived from the average additional yield obtained at the household level multiplied by the estimated adoption rate of SS1 at the village level in each scenario. On average, the impact of the adoption of SS1 on rice yield is estimated at 0.42 t/ha.
Table 8 presents the projected estimates of information reach on SS1 adoption and income. In the current scenario, for which the information reached on average 30 per cent of the households in 285 villages (60 per cent of the sample villages), SS1 covers 14 per cent of the total flood-prone area in Odisha and nearly 3 per cent in West Bengal and Assam. On average, the coverage is 7 per cent. The average additional yield is estimated to be 1.28 million tons (Mt) worth US$110 million.Footnote 1 In scenario I, when information reaches 50 per cent of the rice farmers in the flood-prone area, the estimated additional annual yield is nearly 3 Mt with an additional income of US$235 million per year (an increase of 115 per cent from the status quo). If the information reaches everyone, the estimated adoption increases from 7 per cent in the current scenario to 41 per cent of the rice area under flood. Consequently, the additional yield increases from 1.28 to 6.25 Mt, with a change in income increase from US$110 million to US$501 million. In short, the impact of information is huge and efforts are required to take information reaching to the last mile.
Table 8. Information reach and impact on SS1adoption, yield and income

6. Conclusions
The study reveals that SS1 is a potential variety whose performance is significantly superior under submergence conditions. SS1 yield under a short duration of crop submergence is on a par with or higher than the yield obtained under normal conditions, whereas approximately 70 per cent of normal yield is obtained when the crop is submerged from 8 to 14 days. The additional yield and income obtained from SS1 cultivation improve household welfare.
Regression estimates highlight the importance of access to information on STRVs, which significantly influences SS1 adoption. A total of 71.2 per cent of SS1 adopters have access to information on STRVs compared to 27.0 per cent of non-SS1 adopters receiving any such information. Therefore, information flow and awareness creation play a critical role in the rapid dissemination of STRVs.
The projected impact of information on STRVs reaching all villages is estimated to surpass US$500 million per year in three eastern Indian states. Since SS1 performs well during short-duration submergence conditions, organized efforts are required to streamline the information flow and thereby increase the area under SS1 or similar submergence-tolerant varieties in flood-prone rice environments. Scale neutrality as well as no systematic exclusion of marginal communities from this technology, along with focused efforts by agricultural extension and information systems, could have a huge impact on small and marginal farmers. Over the years, we found that STRV adoption has become scale neutral, but adopters have significantly higher access to information. Because new technologies are being introduced rapidly and knowledge transfer in agriculture is generally on the wane, agricultural extension is likely to become an important source of knowledge and information for the younger generation of farmers. Sequential logit estimates showed that, for those farmers having access to information, the likelihood of adopting STRVs is much higher. Along with access to information, effective information (quality of information) will help to increase the adoption of SS1 by non-adopting households. The other important finding from the study shows that around 10 per cent of SS1 adopters did not cultivate SS1 in 2015, and 70 per cent of them reported unavailability of seed as the reason. Seed availability should be ensured at the local level where farmers need access to it, and government programs related to seed distribution can play a major and effective role in this regard.
Supplementary material
The supplementary material for this article can be found at https://doi.org/10.1017/S1355770X20000212
Acknowledgment
We thank Ishika Gupta for her support in data collection, Dr. Sreejesh and Nashir for their support in implementing the survey. The paper benefited from being presented at the 5th International Rice Congress (IRC), Singapore in 2018 and Climate Jamboree, New Delhi in 2018. This work was supported by the Bill and Melinda Gates Foundation through Rice Monitoring System - South Asia project (Grant No: OPP1118610). The usual disclaimer applies.


 Open access