Population Estimate, Habitat-Use and Activity Patterns of the Honey Badger in a Dry-Deciduous Forest of Central India
 Nilanjan Chatterjee
 Parag Nigam
 Bilal Habib
- Department of Animal Ecology and Conservation Biology, Wildlife Institute of India, Dehradun, India
Studies on carnivores are skewed toward larger species in India, limiting ecological information of the smaller ones. Basic ecological understanding like population density, distribution, habitat-use patterns of small carnivores is lacking. This inadequate knowledge has led to disagreement between conservation approaches in different landscapes. Honey badgers (Mellivora capensis) are cryptic carnivores distributed across large areas of Africa and Asia; however, fundamental ecological knowledge is scarce. The species is thought to exist at low population densities throughout its range. We used a large camera trap dataset from a tiger reserve in Maharashtra State, India to understand the population density, habitat preference, and diel activity pattern of the species. We applied an extension of the spatial count model for the estimation of population. Habitat preference analyses were carried out using generalized linear models and activity patterns were analyzed using kernel-density functions. The population density was estimated as 14.09 (95% CI 10–22.25) individuals per 100 km2. Habitat use revealed a positive association with forest cover and negative association with elevation. This may expose the species to other large carnivores in the habitat but honey badger activity pattern peaked at midnight retaining minimum temporal overlap with other large carnivores (e.g., tiger Panthera tigris, leopard Panthera pardus, and dhole Cuon alpinus) and moderate overlap with small carnivores (e.g., jungle cat Felis chaus, rusty-spotted cat Prionailurus rubiginosus). These behaviors, in turn, may facilitate the coexistence of species at such high density even with high carnivore density. We hope the findings of this study will fill the existing knowledge gap of this species and aid in guiding the conservation of the species in other landscapes and reserves.
Introduction
Mammalian carnivores are one of the most threatened among all biodiversity, experienced a major population decline and suffered the greatest contraction of their range (Ripple et al., 2014; Di Minin et al., 2016). Moreover, their low density, slow population growth rate, large area requirement has made them susceptible to habitat loss and fragmentation (Cardillo et al., 2004). Small carnivores though outnumber their larger cousins, studies on them are scarce and limited to few families. Out of 150 odd small carnivores, most of the populations (39%) are decreasing or unknown (37%) (http://www.iucn-scsg.org/). They are also known to occur across different habitat types-like forest, savanna, grassland, or human-modified landscapes and in different carnivore communities. As conservation efforts are mostly focused on charismatic large carnivores, it may be detrimental to meso or small carnivores. Hence, understanding species interaction and habitat preference is fundamental to direct conservation efforts to such small carnivores.
Honey badger Mellivora capensis is one of the largest (6–14 kg) mustelids and is distributed over Africa, Arabian Peninsula, West Asia, and the Indian subcontinent (Do Linh San et al., 2016). Owing to the wide distribution range, the species has been categorized as Least Concern in the International Union for Conservation of Nature red list of Threatened species (Do Linh San et al., 2016). However, despite its widespread distribution range, limited knowledge exists about its ecology except in southern Africa (Begg, 2001, Begg et al., 2003, Begg et al., 2016, Ramesh et al., 2017, Kheswa et al., 2018). In India, the species is relatively rare and is categorized as Scheduled-I in the Wildlife (Protection) Act, 1972 providing it with the highest level of protection. The species is known as a solitary forager and primarily prefers a carnivorous diet (Begg, 2001). Their fossorial behavior and nocturnal activity pattern (Gubbi et al., 2014), make them highly elusive in nature and difficult to encounter for a population estimation study. Owing to these limitations, so far there is only one study estimating population density in India (Gupta et al., 2012). In the Indian subcontinent, the species has been reported from diverse habitats like scrub and dry deciduous forest (Gubbi et al., 2014), and dry grassland (Mathur et al., 2011) and it shares its range with other carnivores of different body sizes and ecology (Do Linh San et al., 2016; Ramesh et al., 2017). However, niche segregation and interspecies' interactions are poorly understood. Radio-telemetry studies from Africa found strong resource-driven seasonal shifts in its activity pattern from diurnal to nocturnal (Begg et al., 2016). Similar ecological understanding is majorly lacking for populations from this sub-continent. Hence, there is a need for in-depth ecological insights from the species.
Reliable population estimates are an indispensable tool for species conservation and management policies (Williams et al., 2002). The focal species of this study, the honey badger, has no unique pattern, hence individual identification is not feasible. This poses a major challenge for robust population estimation of this species. Additionally, the species, being a carnivore, is at the top of the food pyramid and exists naturally at low densities. Hence, to overcome the challenges of low encounter and unidentifiability, we conducted our sampling with the help of camera traps. Camera traps have been demonstrated as one of the most efficient and non-invasive tools which are currently being used globally to document and study elusive wildlife species (Burton et al., 2015).
We used large scale camera trap data to understand population density, habitat use, and daily activity patterns of honey badger from Tadoba-Andheri Tiger Reserve in central India to develop a better understanding of its ecology. We analyzed habitat use pattern using generalized linear models. Along with that, we used a recently developed method, spatial presence-absence (SPA) approach (Ramsey et al., 2015) to estimate the population of this species. The method (Ramsey et al., 2015) have been reported to be effective for population estimation of individually unidentifiable species with higher accuracy (Chatterjee et al., 2020). We also investigated activity patterns of the honey badger and estimated temporal overlaps with other sympatric carnivores. As the species is known to occur in different habitats with varied activity pattern (Do Linh San et al., 2016), it is difficult to hypothesize about the habitat preference and temporal activity of the species. However, we expected the species to avoid competition (Schuette et al., 2013) with other large carnivores (e.g., tiger, Panthera tigris, leopard Panthera pardus, and dhole Cuon alpinus) by exhibiting minimal spatial and temporal overlap. Informed by this study, we aimed to generate critical information on the species ecology and fill the existing knowledge gap. We believe this information can assist in characterizing management policies and identify challenges for conservation of honey badger in the Indian subcontinent and be useful in understanding the occurrence pattern throughout the distribution range of the species.
Materials and Methods
Study Area
We conducted the study in Tadoba-Andhari Tiger Reserve (20°04′−28°025′N, 79°13′−79°33′E) located in Maharashtra State in Central India. The reserve, a part of the Deccan plateau is mostly undulating and hilly in the north and almost plain in the southern part (Paliwal and Mathur, 2014). The reserve spreads across an area of 1,700 km2. The climate is characterized by a hot and prolonged summer while winter is short and mild (Paliwal and Mathur, 2014). Annual average precipitation is 1,200 mm, received mainly from southwestern monsoons between June and September (Khawarey and Karnat, 1997).
The vegetation of the reserve has been classified as Southern Tropical Dry deciduous forest (Champion and Seth, 1968) dominated by bamboo (Dendrocalamus strictus) and teak (Tectona grandis). Camera-trapping exercises revealed the presence of more than 20 mammal species from the reserve (Habib et al., 2015). This includes four species of felids, tiger Panthera tigris, leopard Panthera pardus, jungle cat Felis chaus, rusty-spotted cat Prionailurus rubiginosus, one species of ursids, sloth bear Melursus ursinus, and two species of canids (dhole Cuon alpinus, jackal Canis aureus), one species of Mustelidae, the honey badger Mellivora capensis.
Field Methods
We conducted camera-trap surveys in the dry season from February 2016 and June 2016 to control the seasonal variability. We divided the whole study area into 2 km2 grids and deployed a pair of automated motion-triggered digital camera-traps at 397 locations across the core and buffer area of the tiger reserve (Figure 1). Sampling was carried out in the reserve in four different blocks with an average of 100 locations per block. Camera-traps were placed on both side of roads, animal trails, fire-lines facing each other, placed around 30–40 cm above the ground. Camera-trap placement at the trails optimizes capture of large as well as small carnivores (Chen et al., 2009, Johnson et al., 2009). Each station consisted of a pair of Cuddeback C1 or Cuddeback ambush (www.cuddeback.com) digital camera-trap placed facing each other at every location to maximize capture probabilities of small carnivores. Camera trap stations were active for 26–30 days to ensure close population structure (Kendall, 1999). Camera trap stations were checked once in every 15 days. As the research work was carried out with non-invasive methods, no approval from animal care and handling was not required. Fieldwork was carried out under the permit number D-22(8)/WL/Research/CT-722/ (12-13)/2934/2013 issued by the principal chief conservator of forests (Wildlife) office of Maharashtra State, India.
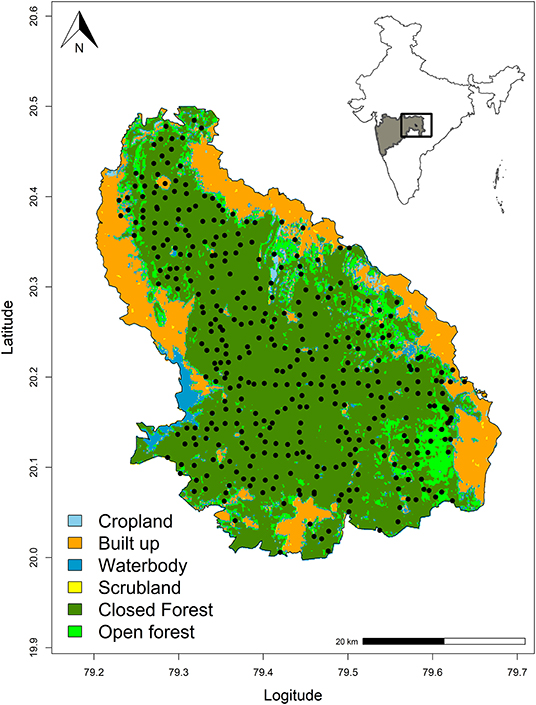
Figure 1. Study area showing camera trap locations in Tadoba-Andhari Tiger Reserve (TATR). Inset: Location of the study area in India. The map shows forested areas (in dark green) and villages (in yellow) within the boundary of TATR. Forest cover used in the map was obtained from Forest Survey of India (www.fsi.nic.in).
Density Estimates
Individual honey badgers are not identifiable from camera-trap photographs and marking individuals was not feasible given the low detectability and elusive nature of the species. To overcome these shortcomings, we used SPA (Ramsey et al., 2015), an extension of the spatial count model of Chandler and Royle (2013). Spatial count models the latent encounters of spatially referenced individuals with sampling devices using data augmentation and the Markov Chain Monte Carlo (MCMC) sampling in a Bayesian framework (Ramsey et al., 2015). Thus, it models the range of individuals with respect to capture locations and estimate population using that prior information of home-range. SPA models are structurally similar to spatial capture-recapture (SCR) models (Efford, 2004). Similar to SCR models, SPA models estimate N (population size) along with g0 (baseline encounter rate), and σ (scale/movement parameter related to home-range of the species). We assumed a half-normal detection function to model the probability of detection.
For each camera site, the detection or non-detection of the species was recorded for each 24 h sampling interval. The state-space (S) comprised of the sampled area and a buffer area surrounding that, large enough to include all individuals potentially exposed to sampling. To generate a buffer area in the state spaces in the SPA model, we estimated σ from a body-size and daily-movement distance equation (Garland, 1983). A vague uniform prior, U (−10,10), was placed on the logit of g0, whereas an informative prior was used for the home-range-scale parameter σ. The estimates of the home-range size of the species were estimated as 1–10 km2. To incorporate this, we used the equation given in Royle et al. (2011) and selected an informative prior of gamma (20,15) for sigma. We used 50,000 MCMC iterations (with the initial burning of 5,000) and the thinning rate of the chains was fixed as 1. Geweke diagnostic scores (Geweke, 1992) were used to test the convergence of the MCMC chains in the “coda” package (Plummer et al., 2006) in R 3.4 (R Development Core Team, 2017).
Habitat Use
We used generalized linear models with the Poisson link function to model honey badger habitat use with different environmental covariates and capture numbers of other carnivores at every camera trap site. We calculated total independent captures at every sampling site considering the 24-h sampling interval as one sampling occasion. We extracted values at each camera-trap sampling site from remotely sensed raster datasets using a buffer size of 50 m. Among the habitat covariates, land use/land cover and forest cover were categorical variables while the remaining covariates were continuous variables (Supplementary Table 1). Forest cover was classified into the following categories; very dense (cover >70%), moderately dense (cover 40–70%), open forest (cover 10–40%), scrub (cover <10%), and non-forest (www.fsi.nic.in). Similarly, land use/land cover was classified into built-up, agriculture, open forest, deciduous forest, and waterbody categories. These natural and anthropogenic covariates were incorporated to predict the species occurrence. Forest cover, NDVI provided the heterogeneity in vegetation and canopy while actual evapotranspiration was a surrogate for aridity and land-use-landcover was used to understand the heterogeneity in different habitats. Earlier studies of honey badger diet (Begg et al., 2016) from Kalahari found that the majority of the species diet consists of small mammals and reptiles (<100 g). Although we did not particularly survey for those species, we believe heterogeneous habitat with good forest cover will harbor a higher density of prey species. We transformed all covariates using z-transformation. All the analyses were carried out in R 3.6 (R Core Team, 2017). We used AIC (ΔAIC >2) criterion to choose the best-fit model and applied model averaging in case multiple models were satisfying the AIC criterion. Model averaging was carried out in “MuMIn” package (Barton and Barton, 2015) in R.
Daily Activity Pattern
We used non-parametric kernel-density functions (Ridout and Linkie, 2009) to determine daily activity periods of honey badgers and other sympatric carnivores from the camera-trap photo-captures. Independent capture events were used to calculate the density function. We considered two capture events independent if the time between consecutive photographs of one species from the same camera traps had a time interval of 30 min (O'Brien et al., 2003). We used the “overlap” package (Meredith and Ridout, 2014) in R 3.4 (R Development Core Team, 2017) to understand the temporal activity overlap of a honey badger with other sympatric carnivores. This method generates a coefficient of overlap between 0 and 1, indicating the complete temporal separation between two species at 0 and complete overlap at 1 (Ridout and Linkie, 2009). We considered Δ > 0.8 to be strong overlap and 0.5 < Δ <0.8 as moderate overlap (Lynam et al., 2013). We used the Δ4 estimator (Dhat4) for sample sizes >75 and the Δ1 estimator (Dhat1) for smaller sample sizes, < less than 50, following the recommendations provided by Meredith and Ridout (2014). We calculated 10,000 bootstraps for each species analyzed and generated 95% confidence intervals (CIs) for temporal overlap estimates following the recommendations given by Meredith and Ridout (2014).
Results
Total survey effort comprised of 9,828 trap nights from 397 camera-trap sites. We photographed 23 mammal species (Supplementary Table 2) during the camera-trap survey and obtained 206 captures of honey badgers in 102 camera traps. Out of the 206 captures, 22 captures had 2 individuals in 1 photograph and 1 instance had 3 individuals.
Density Estimates
We obtained density estimates of 14.1 (95% CI 10–22.25) individuals per 100 km2 using the SPA model. The baseline encounter rate (g–0) and home-range scale parameter (σ) was estimated to be 0.093 (95% CI 0.063–0.127) and 0.509 m (95% CI 0.401–0.631), respectively. Extrapolating the density estimates for the surveyed area, the population was estimated as 233 (95% CI 166–368) individuals (Figure 2).
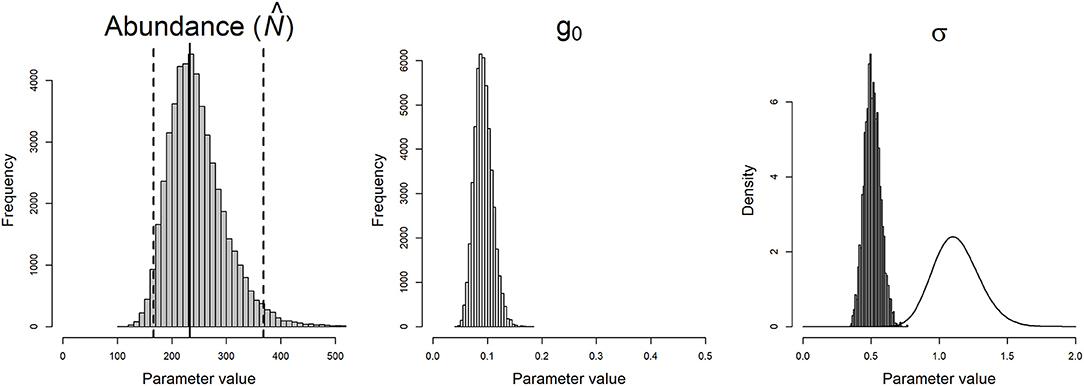
Figure 2. Posterior distributions of Honey badger abundance (), and the parameters of the half-normal detection function (detection probability g0, spatial-scale parameter σ) using the spatial presence-absence model applied to honey badger detections in cameras in the Tadoba-Andhari Tiger Reserve in central India, 2016. The solid line overlaid on the posterior distribution of σ is the prior gamma distribution (45,40) used for the species.
The Geweke diagnostic scores indicated convergence of all parameters of SPA models for honey badger as the z statistic values was <1.6. The z statistic values for SPA model of honey badger are given by, sigma = 0.047(0.519), g0 = 0.741(0.771), psi = 0.577(0.718), N = 0.528(0.701) (Supplementary Figure 3).
Habitat Use
We found forest cover (coefficient 0.28 ± 0.091, p = 0.002) and NDVI (coefficient 3.14 ± 0.96, p = 0.001) to be the most significant factor explaining honey badger habitat use (Tables 1, 2). Elevation was also related negatively and was a significant variable explaining habitat use (coefficient −0.19 ± 0.08, p = 0.02). Distance from water and distance from villages did not have a substantial effect on the habitat use of the species (Table 2, Figure 3). These associations of the species with these variables reflect affinity of the species toward dense forest areas of lower elevation.
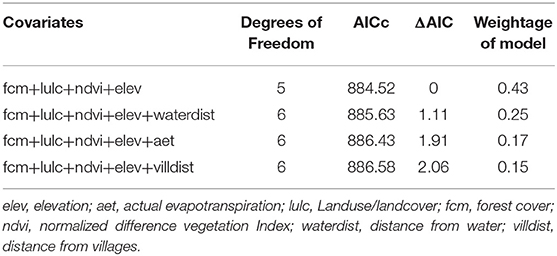
Table 1. Result of generalized linear models used to evaluate the habitat use pattern of honey badger based on remotely sensed habitat covariates extracted around camera trap sites.

Table 2. GLM coefficient with associated standard error values and p-values depicting habitat associations of honey badger with different environmental covariates.
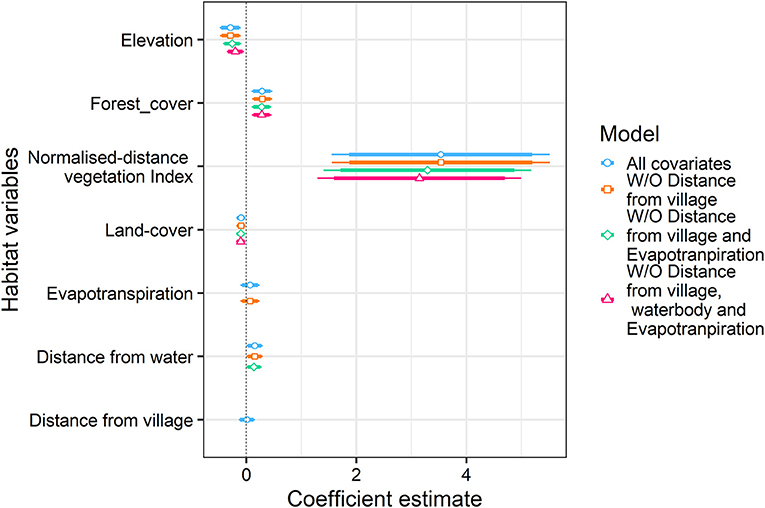
Figure 3. Scaled estimates of environmental covariates used in glm model to evaluate habitat-use are given for honey badger. Broad lines depict the 95% confidence interval of each habitat covariate, while the narrow lines represent 90% confidence interval.
We did not find any significant negative interaction based on the capture number of honey badger and other large and small carnivores (Supplementary Figures 4–6).
Diel Activity Patterns and Activity Overlap
We calculated temporal activity patterns and activity overlaps (Figure 4) for four species of felids (tiger, leopard, jungle cat, and rusty-spotted cat) (n = 1696), one canid (dhole) (n = 70), and one Mustelidae (honey badger) (n = 206). All the carnivores except dhole displayed very low activity between (0600 and 1,800 h) (Figure 4). Honey badgers showed an activity peak around midnight with <10% of the photographs between 0600 and 1,800 h. Honey badgers showed their highest daily activity overlap with other small carnivores, the jungle cat 0.75 (95% CI 0.67–0.83) and the rusty-spotted cat 0.73 (95% CI 0.61–0.85) (Figure 4). The lowest activity overlap of the honey badger was with dhole (0.35, 95% CI 0.26–0.45) as dholes exhibited a relatively diurnal activity peak. Tiger and leopard showed a bimodal activity pattern with two activity peaks around dawn (0500–0700 h) and dusk (1,700–2,000 h). However, the tiger showed a drop in the activity period between (0000–0030 h) but in the case of leopards, the period was less prominent. Except for honey badger, the other two small carnivores also engaged in this decline in activity period between (2,300–0300 h) (Figure 4). The results showed that honey badger minimizes encounters with other large carnivores temporally. This supported our hypothesis of niche segregation of honey badger with other large carnivores.
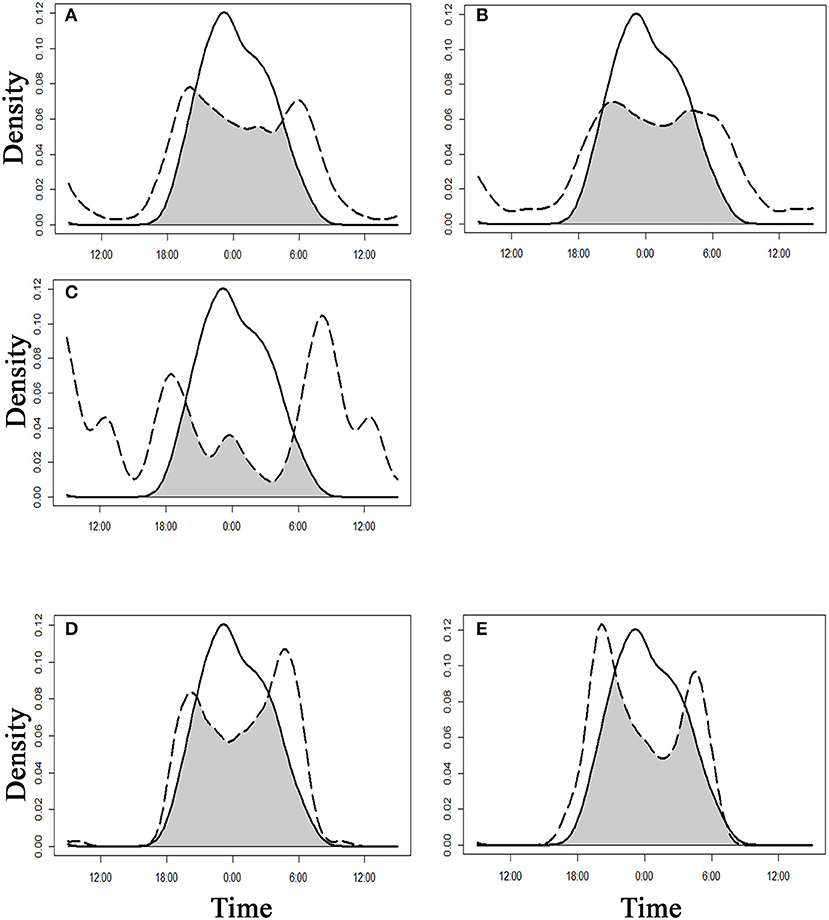
Figure 4. Overlap of activity patterns between sympatric carnivores in Tadoba-Andhari Tiger Reserve (TATR), central India, calculated using a kernel-density function. The activity overlap between paired predators is depicted in gray. The solid line represents the activity pattern of honey badger and the dotted line represents the activity of other carnivores. (A) tiger and honey badger, (B) leopard and honey badger, (C) dhole and honey badger, (D) jungle cat and honey badger, (E) rusty-spotted cat and honey badger.
Discussion
Our study provides the first density estimates of honey badger from the central Indian landscape. Habitat preference pattern of the species revealed an association with the forested landscape and lower elevation. Honey badger activity pattern showed maximum activity at midnight avoiding other large predators. Combination of all these behavioral traits may have resulted in a high density of honey badger from this protected area.
Density Estimates
The only density estimate of this species from the Indian subcontinent was available from Sariska Tiger Reserve (Gupta et al., 2012) based on repeated presence-absence model (Royle and Nichols, 2003). The study estimated summer and winter densities as 5.48 ± 4.33 individuals per 100 km2 and 6.43 ± 2.79 individuals per 100 km2, respectively (Gupta et al., 2012). Another study on small nocturnal carnivores from Serengeti National Park (Waser, 1980) estimated the density of honey badger around <10 individual per 100 km2 from transect counts. Our density estimates of 14.1 ± 3.15 individuals per 100 km2 was the highest among these studies. This could be attributed to the area devoid of any anthropogenic disturbance, higher productivity of the area compared with the other study areas and also temporal segregation of honey badger from the activity period of other large carnivores. Moreover, the study site is a tiger reserve and has less human presence which may lead to lower disease prevalence ensuring higher survival probability. The sigma parameter from the SPA was estimated as 0.509 m (95% CI 0.401–0.631 m) which was much lower from the daily movement parameter estimated from Africa (Begg et al., 2016). The difference in analytical procedures (spatial presence-absence vs. radio-telemetry), however, hindered direct comparison of the parameter estimates. Still, our study used a robust methodology with a recently developed framework incorporating spatial information to estimate the population.
As honey badgers are not individually identifiable and are of small size, it is challenging to use their sex or age-class unambiguously as a covariate in the capture-recapture model. Moreover, the extended period of the dependence of cubs on mothers (Begg, 2001) made group identification more challenging from photo captures. Also, a precise estimate of the home-range of the species is required as a prior for the movement parameter in the SPA model (Ramsey et al., 2015). Parameters derived from further studies on movement pattern and home-range of the species may aid in more precision in the estimated parameters.
Habitat Use
In our study, we found that habitat use of honey badger was affected by the heterogeneity in vegetation structure. Also, the species preferred lower elevation indicating usage of the valley floors rather than cliffs and plateau-tops. This probably reflects the burrowing habit (Begg et al., 2003) of the species as lowland plain areas would be more suitable for burrows. Habitat use studies from Africa (Kheswa et al., 2018) found the distance from vegetation and dominance of plantation trees as the most significant indicator for the species occupancy. The current study also indicated the positive relationship between forest cover and species capture but the distance to water was not found to be significant in this study. This can be attributed to the differential availability of water in these two landscapes. Low-effect size between the capture numbers of the honey badger and other carnivore reflect that there is no spatial segregation in the area use. This finding was in contrast to the studies from Africa, where the species detection was negatively affected by the presence of leopard (Kheswa et al., 2018).
Activity Pattern
This is the first study of the activity pattern of the species from the Indian subcontinent. We found the activity pattern of Honey badger was significantly different from the other carnivores present in the reserve. This finding supported our hypothesis that the species would avoid other large carnivores to minimize agonistic interactions. The finding also corroborates the affinity of the species toward densely forested areas as that mechanism can reduce interference competition. Similar patterns have also been reported from Sariska tiger reserve (Nigam et al., 2018) where the activity peak was at 00:00 h (95% CI 22:56–01:03) and Cauvery Wildlife Sanctuary (Gubbi et al., 2014). This nocturnal activity pattern was different from studies in Africa (Begg et al., 2016). The pattern may arise because of the different carnivore community present in these areas. Studies from Africa (Ramesh et al., 2017; Allen et al., 2018) reported high temporal overlap between the honey badger, spotted hyaena and leopard whereas our study reported high temporal overlap of the honey badger with only small cat species and avoidance from large carnivores (tiger, leopard, and dhole). This can be attributed to the difference in the carnivore community in our study area which results in interspecific interaction among those species shaping the particular activity pattern. It also shows the different mechanism (e.g., spatial in Africa, temporal in this study) used by the species to avoid large carnivore. Further, studies are required to ascertain the principal driver behind the difference in activity between these two populations. Future studies should also cover multiple seasons to ascertain the alteration in the annual activity pattern of the species.
Caveats and Limitations
Similar to other field studies, our study had some limitations. We carried out the camera-trapping exercise in the dry season whereas camera-trapping in monsoon season would reveal any differences in the activity pattern as reported from studies from Africa. Also, camera traps were deployed on trails, and roads to maximize detection of other carnivores along with this species. As the focal species is a burrower, efforts aimed to maximize detection of the honey badger in camera traps would require a different strategy. Micro-scale habitat variables collected from the sampling sites can also be incorporated along with the remotely sensed environmental covariates in habitat preference analysis. Although, we used the recently developed model with proper assumptions but applying the model for multiple years along with simulation studies may reveal further insights of the species demography.
Conservation Implications
Although distributed widely, in-depth ecological understanding of honey badger is still lacking from most of its range. We hope our habitat-use analysis and population density estimates would add to the existing knowledge for better management and conservation. Habitat preference analysis using a regression framework has identified dense forest cover and well-vegetated areas as key factors of the species' niche. Hence, habitat fragmentation and land-use change would affect the species occupancy and survival adversely. Also, affinity toward pristine habitat makes the species more prone to interact with other large carnivores (e.g., tiger, dhole). This can lead to lower survival rate although we postulate that such interactions are minimized by honey badger by shifting to more nocturnal activity. Unlike the African population, the species in the Indian subcontinent is not known to have a negative interaction with the beekeepers and hardly any raiding of poultry farms was observed. The species' range is also majorly understudied in the Indian subcontinent and it has been hardly encountered beyond protected areas in India. Knowledge of the existence of the species outside protected area would reveal the tolerance level of the species in modified habitats and human-dominated landscapes. The difference in ecology between the African and Indian population needs to be further quantified based on the habitat, resource and species interaction. Nonetheless, there is almost no information available about food-habits of the species and that can provide a critical link between the spatio-temporal niche of the species. Future studies should focus on diet, movement, sociality and home-range use of the species to generate an in-depth understanding of the ecology of this population.
Data Availability Statement
The raw data supporting the conclusions of this article will be made available by the authors, without undue reservation.
Ethics Statement
This animal study was carried out under the permit number D-22(8)/WL/Research/CT-722/(12-13)/2934/2013 issued by the principal chief conservator of forests (Wildlife) office of Maharashtra state.
Author Contributions
BH and NC conceived the study. NC collected all data, ran the analysis, and wrote the first draft of the manuscript. BH and PN supervised the project and edited the final versions of the manuscript. All authors contributed to the article and approved the submitted version.
Funding
The work was carried out in a long-term monitoring project funded by Maharashtra Forest Department and National Tiger Conservation Authority.
Conflict of Interest
The authors declare that the research was conducted in the absence of any commercial or financial relationships that could be construed as a potential conflict of interest.
Acknowledgments
We would like to thank the Forest Department of Maharashtra and National Tiger Conservation Authority for the financial and logistic support during the survey and for permits to conduct long-term monitoring work in Tadoba-Andhari Tiger Reserve in Maharashtra. We acknowledge all the volunteers and forest staff for their support during the work in Maharashtra. We thank Madhura Davate and Anil Dashahre for their co-operation and assistance in field-work.
Supplementary Material
The Supplementary Material for this article can be found online at: https://www.frontiersin.org/articles/10.3389/fevo.2020.585256/full#supplementary-material
References
Allen, M. L., Peterson, B., and Krofel, M. (2018). No respect for apex carnivores: distribution and activity patterns of honey badgers in the Serengeti. Mamm. Biol. 89, 90–94. doi: 10.1016/j.mambio.2018.01.001
Barton, K., and Barton, M. K. (2015). MuMIn: Multi-Model Inference. R package version 1.18. Available online at: https://CRAN.R-project.org/package=MuMIn
Begg, C. M. (2001). Feeding cology and social organization of honey badgers Mellivora capensis, in the southern Kalahari (Ph.D. thesis), University of Pretoria, South Africa.
Begg, C. M., Begg, K. S., Do Linh San, E., du Toit, J. T., and Mills, M. G. L. (2016). “Sexual and seasonal variation in the activity patterns and time budget of honey badgers in an arid environment,” In Badgers: Systematics, Biology, Conservation and Research Techniques, eds G. Proulx and E. Do Linh San (Sherwood Park, AB: Alpha Wildlife Publications), 161–192.
Begg, C. M., Begg, K. S., Du Toit, J. T., and Mills, M. G. L. (2003). Scent-marking behaviour of the honey badger, Mellivora capensis (Mustelidae), in the southern Kalahari. Anim. Behav. 66, 917–929. doi: 10.1006/anbe.2003.2223
Burton, A. C., Neilson, E., Moreira, D., Ladle, A., Steenweg, R., Fisher, J. T., et al. (2015). Wildlife camera trapping: a review and recommendations for linking surveys to ecological processes. J. Appl. Ecol. 52, 675–685. doi: 10.1111/1365-2664.12432
Cardillo, M., Purvis, A., Sechrest, W., Gittleman, J. L., Bielby, J., and Mace, G. M. (2004). Human population density and extinction risk in the world's carnivores. PLoS Biol. 2:e197. doi: 10.1371/journal.pbio.0020197
Champion, S. H., and Seth, S. K. (1968). A Revised Survey of the Forest Types of India. Delhi: Manager of Publications.
Chandler, R. B., and Royle, J. A. (2013). Spatially explicit models for inference about density in unmarked or partially marked populations. Ann. Appl. Stat. 7, 936–954. doi: 10.1214/12-AOAS610
Chatterjee, N., Nigam, P., and Habib, B. (2020). Population density and habitat use of two sympatric small cats in a central Indian reserve. PLoS ONE 15:e0233569. doi: 10.1371/journal.pone.0233569
Chen, M., Tewes, M., Pei, K., and Grassman, L. I. (2009). Activity patterns and habitat use of sympatric small carnivores in southern Taiwan. Mammalia 73, 20–26. doi: 10.1515/MAMM.2009.006
Di Minin, E., Slotow, R., Luke, T. B. Hunter, Federico, Montesino Pouzols, Tuuli, Toivonen, and Peter, H. Verburg (2016). Global priorities for national carnivore conservation under land use change. Sci. Rep. 6, 1–9. doi: 10.1038/srep23814
Do Linh San, E., Begg, C., Begg, K., and Abramov, A. V. (2016). Mellivora capensis. The IUCN Red List of Threatened Species 2016: e.T41629A45210107. doi: 10.2305/IUCN.UK.2016-1.RLTS.T41629A45210107.en
Efford, M. (2004). Density estimation in live-trapping studies. Oikos 106, 598–610. doi: 10.1111/j.0030-1299.2004.13043.x
Garland, T. Jr. (1983). Scaling the ecological cost of transport to body mass in terrestrial mammals. Am. Nat. 121, 571–587. doi: 10.1086/284084
Geweke, J. (1992). “Evaluating the accuracy of sampling-based approaches to the calculation of posterior moments,” in Bayesian Statistics, Vol. 4, eds J. M. Bernardo, J. O. Berger, A. P. Dawid, and A. F. M. Smith (Oxford: Oxford University Press), 169–193.
Gubbi, S., Reddy, V., Nagashettihalli, H., Bhat, R., and Madhusudan, M. D. (2014). Photographic records of the Ratel Mellivora capensis from the southern Indian state of Karnataka. Small Carnivore Conserv. 50, 42–44.
Gupta, S., Mondal, K., Sankar, K., and Qureshi, Q. (2012). Abundance and habitat suitability model for Ratel (Mellivora capensis) in Sariska Tiger Reserve, Western India. Wildl. Biol. Pract. 8, 13–22. doi: 10.2461/wbp.2012.8.2
Habib, B., Nigam, P., Chatterjee, N., Madhura, D., Dashahre, A., Garad, G. P., et al. (2015). Status of Tigers, Co-Predator and Prey in Tadoba Andhari Tiger Reserve (TATR) 2015. Pp. 62.
Johnson, A., Vongkhamheng, C., and Saithongdam, T. (2009). The diversity, status and conservation of small carnivores in a montane tropical forest in northern Laos. Oryx 43, 626–633. doi: 10.1017/S0030605309990238
Kendall, W. L. (1999). Robustness of closed capture–recapture methods to violations of the closure assumption. Ecology 80, 2517–2525. doi: 10.1890/0012-9658(1999)080[2517:ROCCRM]2.0.CO
Khawarey, K. N., and Karnat, M. (1997). Management Plan for Tadoba-Andhari Tiger Reserve (Tadoba National Park and Andhari Wildlife Sanctuary), Plan Period 1997-98 to 2006-07. Chandrapur, Deputy Conservator of Forest, Tadoba National Park, Government of Maharashtra
Kheswa, E. Z., Ramesh, T., Kalle, R., and Downs, C. T. (2018). Habitat use by honey badgers and the influence of predators in iSimangaliso Wetland Park, South Africa. Mamm. Biol. 90, 22–29. doi: 10.1016/j.mambio.2018.01.009
Lynam, A. J., Jenks, K. E., Tantipisanuh, N., Chutipong, W., Ngoprasert, D., Gale, G. A., et al. (2013). Terrestrial activity patterns of wild cats from camera-trapping. Raffles Bull. Zool. 61, 407–415.
Mathur, P. K., Kumar, H., Lehmkuhl, J. F., Tripathi, A., Sawarkar, V. B., and De, R. (2011). Mammal indicator species for protected areas and managed forests in a landscape conservation area of northern India. Biodivers. Conserv. 20, 1–17. doi: 10.1007/s10531-010-9851-8
Meredith, M., and Ridout, M. (2014). Overlap: Estimates of Coefficient of Overlapping for Animal Activity Patterns. R package version 0.2,4. Available onlinea at: https://CRAN.R-project.org/package=overlap
Nigam, P., Habib, B., Sankar, K., Qureshi, Q., Mandal, D., and Sengupta, D., et al. (2018) Monitoring of Re-introduced Tigers (Panthera tigris tigris) Sariska Tiger Reserve Rajasthan – Phase II. Technical Report No. 2019/08, Wildlife Institute of India Rajasthan Forest Department, Pp. 111.
O'Brien, T. G., Kinnaird, M. F., and Wibisono, H. T. (2003). Crouching tigers, hidden prey: Sumatran tiger and prey populations in a tropical forest landscape. Anim. Conserv. 6, 131–139. doi: 10.1017/S1367943003003172
Paliwal, A., and Mathur, V. B. (2014). Spatial pattern analysis for quantification of landscape structure of Tadoba-Andhari Tiger Reserve, Central India. J. For. Res. 25, 185–192. doi: 10.1007/s11676-014-0444-3
Plummer, M., Best, N., Cowles, K., and Vines, K. (2006). CODA: convergence diagnosis and output analysis for MCMC. R. News 6, 7–11.
R Core Team (2017). R: A Language and Environment for Statistical Computing. Vienna: R foundation for statistical computing. Available online at: http://www.R-project.org
Ramesh, T., Kalle, R., and Downs, C. T. (2017). Staying safe from top predators: patterns of co-occurrence and inter-predator interactions. Behav. Ecol. Sociobiol. 71:41. doi: 10.1007/s00265-017-2271-y
Ramsey, D. S., Caley, P. A., and Robley, A. (2015). Estimating population density from presence–absence data using a spatially explicit model. J. Wildl. Manage. 79, 491–499. doi: 10.1002/jwmg.851
Ridout, M. S., and Linkie, M. (2009). Estimating overlap of daily activity patterns from camera trap data. J. Agric. Biol. Environ. Stat. 14, 322–337. doi: 10.1198/jabes.2009.08038
Ripple, W. J., Estes, J. A., Beschta, R. L., Wilmers, C. C., Ritchie, E. G., Hebblewhite, M., et al. (2014). Status and ecological effects of the world's largest carnivores. Science 343:1241484. doi: 10.1126/science.1241484
Royle, J. A., Kery, M., and Guelat, J. (2011). Spatial capture-recapture models for search-encounter data. Methods Ecol. Evol. 2, 602–611. doi: 10.1111/j.2041-210X.2011.00116.x
Royle, J. A., and Nichols, J. D. (2003). Estimating abundance from repeated presence–absence data or point counts. Ecology 84, 777–790. doi: 10.1890/0012-9658(2003)084[0777:EAFRPA]2.0.CO;2
Schuette, P., Wagner, A. P., Wagner, M. E., and Creel, S. (2013). Occupancy patterns and niche partitioning within a diverse carnivore community exposed to anthropogenic pressures. Biol. Conserv. 158, 301–312. doi: 10.1016/j.biocon.2012.08.008
Waser, P. M. (1980). Small nocturnal carnivores: ecological studies in the Serengeti. Afr. J. Ecol. 18, 167–185. doi: 10.1111/j.1365-2028.1980.tb00640.x
Keywords: camera-trapping, competitive exclusion, dial activity pattern, Melivora capensis, small carnivores, spatial capture-recapture models, Tadoba-Andhari Tiger Reserve
Citation: Chatterjee N, Nigam P and Habib B (2020) Population Estimate, Habitat-Use and Activity Patterns of the Honey Badger in a Dry-Deciduous Forest of Central India. Front. Ecol. Evol. 8:585256. doi: 10.3389/fevo.2020.585256
Received: 20 July 2020; Accepted: 01 December 2020;
Published: 23 December 2020.
Edited by:
Elise Huchard, UMR5554 Institut des Sciences de l'Evolution de Montpellier (ISEM), FranceReviewed by:
Colleen T. Downs, University of KwaZulu-Natal, South AfricaChris Newman, University of Oxford, United Kingdom
Copyright © 2020 Chatterjee, Nigam and Habib. This is an open-access article distributed under the terms of the Creative Commons Attribution License (CC BY). The use, distribution or reproduction in other forums is permitted, provided the original author(s) and the copyright owner(s) are credited and that the original publication in this journal is cited, in accordance with accepted academic practice. No use, distribution or reproduction is permitted which does not comply with these terms.
*Correspondence: Bilal Habib, bh@wii.gov.in