

Abstract
Objective. There is an unmet need to develop seizure detection algorithms from brain regions outside the epileptogenic cortex. The study aimed to demonstrate the feasibility of classifying seizures and interictal states from local field potentials (LFPs) recorded from the human thalamus—a subcortical region remote to the epileptogenic cortex. We tested the hypothesis that spectral and entropy-based features extracted from LFPs recorded from the anterior nucleus of the thalamus (ANT) can distinguish its state of ictal recruitment from other interictal states (including awake, sleep). Approach. Two supervised machine learning tools (random forest and the random kitchen sink) were used to evaluate the performance of spectral (discrete wavelet transform—DWT), and time-domain (multiscale entropy—MSE) features in classifying seizures from interictal states in patients undergoing stereo-electroencephalography (EEG) evaluation for epilepsy surgery. Under the supervision of IRB, field potentials were recorded from the ANT in consenting adults with drug-resistant temporal lobe epilepsy. Seizures were confirmed in the ANT using line-length and visual inspection. Wilcoxon rank-sum method was used to test the differences in spectral patterns between seizure and interictal (awake and sleep) states. Main results. 79 seizures (10 patients) and 158 segments (approx. 4 h) of interictal stereo-EEG data were analyzed. The mean seizure detection latencies with line length in the ANT varied between seizure types (range 5–34 s). However, the DWT and MSE in the ANT showed significant changes for all seizure types within the first 20 s after seizure onset. The random forest (accuracy 93.9% and false-positive 4.6%) and the random kitchen sink (accuracy 97.3% and false-positive 1.8%) classified seizures and interictal states. Significance. These results suggest that features extracted from the thalamic LFPs can be trained to detect seizures that can be used for monitoring seizure counts and for closed-loop seizure abortive interventions.
Export citation and abstract BibTeX RIS
Abbreviations
| ASD | anti-seizure drugs |
| DWT | discrete wavelet transfer |
| EI | epileptogenecity index |
| ES | electrographic seizures |
| FAS | focal onset aware seizures |
| FBTCS | focal to bilateral tonic-clonic seizures |
| FIAS | focal onset seizures with impaired awareness |
| LL | line length |
| MSE | multiscale entropy |
| RF | random forest |
| RKS | random kitchen sink |
| RWE | relative wavelet energy |
| SOZ | seizure onset zone |
| SEEG | stereo-electroencephalography |
| TLE | temporal lobe epilepsy |
| UEO | unequivocal electrographic onset |
1. Introduction
The development of automated, reliable seizure detectors is necessary for clinical and research purposes for multiple reasons. First, an electronic seizure detector can be used to provide feedback for therapy delivery (i.e. closed-loop electrical stimulation like the responsive neurostimulator—RNS) or can trigger an alarm to notify a caregiver [1–3]. Second, automated detectors allow quantifying seizures and circadian patterns for an electronic seizure diary that can be used to tailor therapy [4]. Third, in research, large scale automation of seizure counts can accelerate drug development and evaluate therapy responses [5, 6]. Given these translational significances, there is a continuous development of algorithms based on either machine learning or deep learning. Although the biosignal input for seizure detection has ranged from heart rate to muscle activity or scalp EEG [7–9], the intracranial EEG, due to its higher signal to noise ratio, has the highest reliability and is often used in neuromodulation therapies [10]. The developmental pipeline for seizure detection algorithms with intracranial EEG includes feature extraction from the local field potentials (LFP) recorded from the seizure onset zone, followed by training and testing. Therefore, most seizure detection algorithms are based on LFP recordings from the seizure onset zone [11]. Unfortunately, in clinical practice, the localization of seizure onset is not always possible. Treatment options like surgical resection or ablation or neuromodulation (like the RNS system) are not applicable in this cohort due to the inability to localize the seizure generation sites. Hence, mortality is higher in nonlocalizable epilepsies [12]. A preferred option in such patients has been the deep brain stimulation (DBS), which currently operates as an open-loop device where stimulation parameters are pre-programmed to occur throughout the day and are not responsive to changes in the patient's seizures [13, 14]. Indeed, optogenetic inhibition of the thalamus disrupted seizure genesis in a preclinical model of post-stroke epilepsy [15], thereby suggesting that cortical seizures can be disrupted remotely by modulating the thalamus. Thus, there is an unmet need to innovate seizure detection from brain regions outside the seizure foci like the thalamus as that would pave the way for developing thalamic closed-loop therapies. We respond to this clinical need by demonstrating the feasibility of identifying electrophysiological signatures of seizures from the human thalamus—a subcortical region that is remote to the cortical seizure onset sites.
The thalamus is not a unitary structure but a conglomeration of subnuclei, each with diverse reciprocal connectivity and functions [16]. Numerous animal studies have demonstrated that—a) recurrent limbic seizures and spikes facilitated the remodeling of the thalamocortical networks [17]; b) thalamic neuronal firings are increased with the initiation of limbic seizures [18]; and c) chemical, lesional or optogenetic deactivation of thalamic subnuclei interrupted cortical seizures [15, 19, 20]. For example, the anterior nucleus of the thalamus (ANT) mediates cortical–subcortical interactions between the limbic system and the brainstem [21]. These pathways are associated with a bihemispheric propagation of convulsive seizures. The thalamocortical neural activity also regulates wakefulness, sleep, consciousness, and synchronization of intracortical networks [22–25]. Prior studies have demonstrated that states of vigilance (SOV) can be distinguished using entropy or time–frequency (spectral) decomposition of EEG signals [26, 27]. Based on the aforementioned evidence, we tested the hypothesis that spectral and entropy-based features extracted from LFPs from the ANT can distinguish its state of ictal recruitment from other interictal states (including awake, sleep). We used two supervised machine learning approaches (random forest and the random kitchen sink) to evaluate the performance of spectral and temporal features in classifying ictal from interictal states in patients undergoing stereo-electroencephalography (SEEG) evaluation for epilepsy surgery.
2. Methods
2.1. Study participants, inclusion criteria, and ethics
Seizures (N = 79 from 10 patients) and interictal SEEG data (N = 158 segments, i.e. 79 × 2 states from sleep and awake) were obtained from patients with drug-resistant temporal lobe epilepsy (TLE) who have undergone SEEG exploration for epilepsy surgery. The demographic details of the study participants are detailed in (table 1). The Institutional Review Board of the University of Alabama at Birmingham approved the study for recording LFPs from the thalamus during SEEG exploration (IRB-170323005). Before the surgery, informed consent detailing the thalamic implantation for research was obtained from the participants. The multi-step consenting process has been described in detail in a previous study [28]. To mitigate the risk of increased complications from an additional depth electrode placement for research purposes only, the surgeon modified the trajectory of a clinically indicated multi-contact depth electrode to sample LFPs from the insular operculum region (superficial contacts) and the ANT (deeper contacts) (figure 1(A)). Only one ANT was sampled per participant. The rationale for selecting the ANT was based on its—a) structural connectivity with the limbic network [21]; b) preclinical and clinical studies demonstrating recruitment of ANT in TLE [18, 29]; and c) the potentials of translating the knowledge gained in the study towards the development of a closed-loop DBS therapy. Only patients with confirmed electrode localization in the ANT were included in the study

Figure 1. (A): The trajectory of the Anterior nucleus of thalamus (ANT) implantation that followed through precentral gyrus (I), pars opercularis frontalis (II), insula (III), putamen (IV), and ANT (V). LeadDBSv2 was used to reconstruct the target location of the thalamic electrodes, while the trajectories were reconstructed, and the cortical contacts were identified using iElectrodes. (B): Line length (LL) detection of seizures in the ANT. First, the unequivocal electrographic onset was identified by the clinician in the seizure onset channel (SOZ). The LL detected seizure in the ANT was subsequently confirmed with a visual inspection. (C)–(I): Temporal changes in the discrete wavelet transform relative wavelet energy (DWT-RWE) and multiscale entropy (MSE) across the first 40 s of seizure and interictal awake and sleep epochs in the ANT. Statistically this power spectral change during the seizure was compared with the baseline sEEG activity using Wilcoxon rank sum test and corrected for multiple comparisons using false discovery rate (FDR) method. (C), (D), (E) and (F) summarize the significant spectral power changes (increases: black asterisks and decreases: white asterisks) during various ictal states i.e. electrographic seizures (ES: zmin < −4.1, zmax > 3.9, Pfdr' s < 7.2 × 10⁻⁵), Focal Aware Seizures (FAS: zmin < −4, zmax > 4, Pfdr' s < 5.7 × 10⁻⁵), Focal Impaired Awareness Seizures (FIAS: zmin < −3.9, zmax > 4.2, Pfdr' s < 8 × 10⁻⁵) and Focal to Bilateral Tonic Clonic Seizures (FBTCS: zmin < −4.1, zmax > 4, Pfdr' s < 5.9 × 10⁻⁵). Increase in spectral power was noted between 4–32 Hz while decrease was noted majorly in 1–2 Hz and 32–64 Hz for all the 4 seizure types. G and H summarize the significant spectral power changes during various physiological interictal states i.e. awake and sleep. I summarizes the temporal changes in MSE during seizures and interictal period (ES: z > 4.1 Pfdr' s < 2.1 × 10⁻⁷, FAS: z > 4.3, Pfdr' s < 4.9 × 10⁻¹², FIAS: z > 4.1, Pfdr' s < 2 × 10⁻¹⁴, FBTCS: z > 4.1, Pfdr' s < 4.1 × 10⁻⁶).
Download figure:
Standard image High-resolution imageTable 1. Clinical characteristics of the study participants.
| Demographics | N = 10 |
|---|---|
| • Age (years) | 42.8 ± 13.9 |
| • Gender | M = 4 |
| • Details of recording | |
| Number of electrodes | 151 (R106, L45) |
| ANT implant laterality (R:L) | 7:3 |
| • Disease burden measures | |
| Age at Onset(years) | 24.9 ± 19.1 |
| Duration of Epilepsy (years) | 17.9 ± 12.4 |
| Frequency of focal seizures (/month) | 12 ± 8 (range: 2–30) |
| FBTCS (Present:Absent) | 8:2 |
| • MRI (Abnormal:Normal) | 5:5 |
| • PET abnormality (Abnormal:Normal) | 7:3 |
| • ANT implant laterality (R:L) | 7:3 |
FBTCS: focal to bilateral tonic clonic seizures; PET: Positron emission tomography; ANT: anterior nucleus of thalamus
2.2. SEEG recording
Robotic assistance (ROSA device, Medtech, Syracuse, NY) was used to plan optimal and safe trajectories for SEEG multi-contact electrode implantation (12–16 contacts per depth electrode, 2 mm contact length, 0.8 mm contact diameter, 1.5 mm inter-contact distance, PMT® Corporation, Chanhassen, MN). Intracranial video-EEG was recorded using Natus Quantum (Natus Medical Incorporated, Pleasanton, CA, sampling rate 2048 Hz) (figure 1). Signals were referenced to a common extracranial electrode placed posteriorly in the occiput near the hairline.
2.3. Reconstruction of depth electrodes into the brain
The pipeline and the accuracy of targeting thalamic subnuclei during SEEG have been reported in great detail previously by our group [28]. Electrode contacts in the ANT were localized using Lead-DBS v2 software [30] and the cortical contacts using iElectrodes [31]. Preoperative MRI and postoperative CT scans were linearly co-registered using Advanced Normalization Tools followed by refinement with brain shift correction to improve the registration of subcortical structures Jenkinson [32]. Both the images were normalized to ICBM 2009b NLIN asymmetric space using the symmetric diffeomorphic image registration. The cortical regions of all the implanted SEEG contacts were confirmed with AAL2 atlas [33], and the thalamic nuclei were identified using the mean histological thalamic Morel's atlas (figures 1(A) and (B)) [34]. The trajectory of the ANT implantation passed through the precentral gyrus, pars opercularis frontalis, insula, and putamen before ending in the ANT (figure 1(A)) [28].
2.4. Identification of interictal epochs and seizures in the seizure onset zone and thalamus
Seizure onset and offset in the cortex were annotated by a board-certified epileptologist (SP). Seizure onset was defined as the earliest occurrence of rhythmic or repetitive spikes in the cortex that was distinctive from the background activity, and that evolved in frequency and morphology (figure 2). The EEG onset of the seizure in the cortex was marked as 'unequivocal EEG onset' (UEO). SEEG segments were clipped to include 10 min before the UEO and 10 min post-termination of the seizure. Seizures were classified into focal aware seizures (FAS), focal impaired awareness seizures (FIAS), and focal to bilateral tonic-clonic seizures (FBTCS) [35]. A seizure was classified as electrographic seizures (ES) when it lacked any clinical correlate, and the ictal EEG pattern lasted longer than 10 s. A minimum of three seizures selected randomly among each seizure type (ES, FAS, FIAS, FBTCS) per patient, and overall 3–10 seizures per patient were included for analyses in the study. Multiple epochs of 5–10 min duration of interictal SEEG were selected and labeled as 'interictal state.' State of vigilance (SOV: sleep or awake) for the interictal epochs were determined based on video and visual SEEG inspection. No effort was made to classify sleep stages as the study was aimed to distinguish the thalamic ictal from interictal states. Similarly, no effort was made to determine the presence (or absence) of epileptiform spikes in the interictal epoch as the study was focused on determining the interictal state independent of presence (or absence) of a spike.

Figure 2. Example of a stereo-EEG recording from a patient with left medial temporal lobe epilepsy. The seizure onset (time 0 s) was characterized by low amplitude fast activity observed in the anterior and posterior hippocampus (AHIP, PHIP). At the same time rhythmic spiking was observed in the amygdala (AMY), orbitofrontal (OF) and insula (INS). Note the rhythmic spiking in the anterior nucleus of thalamus (ANT) that evolved with the progression of the seizure.
Download figure:
Standard image High-resolution image2.5. Seizure detection algorithm
Line length (LL) was used to detect the ictal activity objectively [36] (figure 1(B)). The LL feature was derived as a simplification of the running fractal dimension of a signal. It measures the length of the signal in a particular window and compares it to a threshold. The length of the signal is dependent on the amplitude and frequency of the signal, making this feature highly suitable to sense changes in amplitude and/or frequency that typically occur during seizures. The change in LL during the peri-ictal period was considered significant when the measured LL in that segment was greater than 2SD compared to the mean of a 3 min baseline segment for at least 10 s. Preprocessing steps involved detrending within 2 s, removing DC-drift (detrend), reconfiguring into a bipolar montage by linking adjacent contacts from the proximal to distal part of the electrode, and removing 60 Hz line noise with a notch filter (2nd order Butterworth zero phase shift filter—designfilt and filtfilt). Subsequently, the LL was calculated on this preprocessed data over 0.25 s windows with 50% overlap as shifting windows, and the resultant LL data was smoothed using the Matlab function 'movmean' over 2 s windows. The LL was calculated for each segment with m samples using the following formula:
Where n is the number of sample points within 0.25 s, and the xj is the sample point.
When LL detections were discontinuous,multiple close lying LL detections (<5 s between detections) were considered as a single seizure event. The algorithm detected 'seizure length' was the duration between LL detected onset (increased distance between preonset to onset) and LL detected offset (increased distance between termination and post-termination) (supplementary methods (available online at https://stacks.iop.org/JNE/17/066004/mmedia)).
The electrophysiological features of ANT involvement during a seizure are not well described. Thus, we have adopted a manual offline seizure detection approach based on LL features described above. LL was performed on all the cortical channels demonstrating visually determined UEO and early seizure spread in the cortex. Seizures in ANT were reported as 'not detected (ND)' when the specified changes in LL as described above, were absent in the first 120s after LL detected seizure in the cortex (LL UEO).
2.6. Power-spectral evaluation of the field potentials recorded from the ANT
Two methods were used to measure the ictal changes of the thalamogram, (1) calculate the power-spectra with discrete wavelet technique with relative wavelet energy (DWT-RWE) and (2) multiscale spectral entropy (MSE) [26, 37, 38]. The time-frequency decomposition of field potentials was performed with the DWT—'db4', RWE, 6 levels. The DWT provides a non-redundant, highly efficient wavelet representation and direct estimation of local energies at the different relevant scales. The motivation for selecting DWT is based on prior studies suggesting this method can be an optimal tool for online seizure detection that can be translated into the implantable neural prosthesis [11, 39, 40]. The DWT-RWE was calculated on 4 s windows, with 3 s overlap, for 1–2 Hz, 2–4 Hz, 4–8 Hz, 8–16 Hz, 16–32 Hz, and 32–64 Hz from awake, sleep and seizure segments of the thalamic signal.
We calculated MSE to characterize the temporal predictability of a time series across several time scales in the thalamus, serving as an index of its capacity for processing information. Estimation of MSE was done in a windowed manner on short epochs of 4 s each, with 75% overlap after downsampling data to 200 Hz according to the original implementation of the algorithm and averaging across the 10 scales to indicate the mean MSE (https://archive.physionet.org/physiotools/mse/tutorials) [41].
We estimated MSE for one-dimensional discrete time series (x) by constructing consecutive coarse-grained time series, determined by the scale factor, τ, according to equations (2) and (3),
where τ is the scaling factor, 1 ⩽ j ⩽ N/τ
where  , r is a coefficient of tolerance, m is the pattern length and N is the length of the data. Costa et al have shown that MSE had better statistical validity for m = 1 or 2 and r being between 0.1 and 0.25 [41]. In the present study we used m = 2, r = 0.15, 1 < τ ⩽ 10.
MSE was calculated across the length of the ANT SEEG signal on moving window epochs (awake, sleep, and seizure segments) like DWT analysis.
2.7. Machine learning with random forest (RF) and random kitchen sink (RKS)
Seizures can induce changes in behavioral states (like arousal or altered vigilance) that can increase power at narrow frequency bands. To evaluate if the temporal and spectral features (MSE and DWT-RWE) can distinguish the thalamic ictal state from other interictal states of vigilance (awake and sleep), we used two machine learning algorithms—random forest (RF) and random kitchen sink (RKS) [42, 43]. The two classifiers RF and RKS are both suited for testing linear and nonlinear associations between the predictors and the response variables. One of the main reasons for choosing these algorithms is the nonlinear nature of brain dynamics [44, 45]. Evidence also states that linear methods are more suited for limited data and limited knowledge about the data available, while nonlinear methods are suitable to find a potentially more complex structure in large amounts of data. Specifically, when the source of the data to be classified is not well understood, it is preferred to use methods that are good at finding nonlinear transformations of the data [46]. In the current scenario, the recordings from the anterior nucleus of the thalamus and their electrophysiological behavior in human beings are being tested for the first time in SEEG. Also, in the future, when these methods are to be considered for building robust brain–computer interfaces for neuromodulation, the large data sets would be required to be trained using efficient models for implementation. The current nonlinear random RF models have a reliably higher accuracy among other algorithms, run efficiently on large databases, give estimates of what variables are important in the classification, has methods for balancing error in class population unbalanced data sets witnessed in real-time data evaluation, and can finally be extended to unlabeled data, leading to unsupervised clustering on new data sets (https://www.stat.berkeley.edu/~breiman/RandomForests/cc_home.htm). We further used the nonlinear RKS model as a validation tool, which by selecting many random non-linearities, can achieve the same accuracy in significantly less training time, a feature that can be exploited in real-time detections [43].
Seven features, namely: DWT-RWE in six frequency bands and the average of the first 10 scales of the MSE of awake, sleep, and 20 s of seizure segments (each seizure provided 16 data points) from the ANT were used as predictive features for RF and RKS machine learning algorithms. The seizure class contained 373 data points, and the interictal class had 2850 data points (approximately 4 h of data), each being represented by 7 features. The data was unbalanced, and hence the smaller data was split in 80%:20% for training and testing data. 300 data points were chosen at random for training, and 73 data points were chosen for testing purposes from each class. The RF classification technique was applied using all the features to calculate the accuracy, precision (positive predictive value), and recall (sensitivity) values. To ensure that training and testing were done in an unbiased manner, the process was repeated 500 times by choosing the training and test samples randomly during each iteration, and the average values of the accuracy, precision, and recall were used. The entire procedure used 5, 10, 15, and 20 decision trees, and four sets of results were presented that indicated that we have an improved classification with an increasing number of decision trees [47]. During the construction of the trees, Gini impurity was used to make decision about which variable to split at each node. For each feature, the sum of the Gini decrease across every tree in the forest is accumulated every time that feature is chosen to split a node. The sum is divided by the number of trees in the forest to give an average called the permutation feature importance.
As a validation of the results of the RF prediction model, we tested the same features using RKS learning. The RKS method involved a nonlinear mapping of the features on to a higher dimensional space and enabled the features to become linearly separable in the higher dimension. The feature mapping was done using a real Gaussian function as the radial basis function (RBF) kernel. This, in combination with a regularized least square algorithm for regression, allowed us to obtain a simple classifier that can be used for real-time applications. Similar to RF analysis, RKS was used to classify the given samples into two classes: seizure and interictal states (awake and sleep). RKS classification technique was applied using all the features to calculate the accuracy, precision (positive predictive value), and recall (sensitivity) values. The seven features (DWT-RWE in 6 bands and the average of the first 10 scales of MSE) of each data point were transformed into a 100 dimension feature space using random feature mapping. The mapping function performed both cosine and sine transformations on each data point, thus effectively converting each data point from a seven dimension vector into a 200-dimensional vector. Using the data in the new feature space, regression analysis, and regularized least square (RLS) loss function based classification was performed using an RBF based Gaussian kernel classifier with a hold-out cross-validation. The random mapping and the classification analysis was done using grand unified regularized least squares (GURLS) [48]. Similar to RF, the RKS was repeated 500 times by choosing the training and test samples randomly during each iteration, and the average values of the accuracy, precision, and recall were reported.
2.8. Statistical analysis
Since DWT-RWE showed non-normal distribution, we used the Wilcoxon rank-sum (WRS) method to test how the ictal spectral patterns differed (i.e. increase or decrease in DWT-RWE) from interictal (awake and sleep) state [49]. Five DWT-RWE samples of moving windows of 4 s length, with 4 s overlap, were input into the WRS test to form a time-related spectral power distribution subset from the seizures with ANT recruitment separated by seizure types for every frequency band. These subset distributions were compared to awake and sleep interictal distribution with the Wilcoxon test, and false discovery rate (FDR) correction was applied to the resulting p values [50].
3. Results
3.1. Safety and accuracy of thalamic implantation
Out of the 13 patients that had thalamic implants, 10 had accurate localization (77%) in the ANT and were included for subsequent analysis (table 1). None of the patients had any ischemia or hemorrhage in the subcortical regions, as evident from the CT brain performed after the explanation of the depth electrodes. The details of the accuracy and safety of research thalamic implantation at our center have been reported elsewhere [28].
3.2. Seizure types and their localization
Seventy-nine seizures from 10 subjects were analyzed in this study. Based on the clinical consensus among the epileptologists, the seizure onset zone was determined to be medial temporal (2), temporal pole (1), and temporal plus (2), with the plus representing additional seizure foci (orbitofrontal or insula) outside the medial temporal region. Five patients had multifocal epilepsies with seizure foci in bilateral medial temporal regions (2), medial temporal and parietal, or insular and superior temporal gyri (2). The distribution of seizure types was: ES (26), FAS (18), FIAS (29), and FBTCS (6).
3.3. Line length (LL) detection latencies and spectral changes of seizures in the ANT
The detection latencies of the seizures at the seizure onset zone channels were earlier (latency: 4.57 ± 10.28 s, range: −3.97–63.79 s) than in the ANT (latency: 16.89 ± 21.18 s, range: −0.99–92.98 s). The mean detection latencies in the ANT varied between seizure types: FAS (34 s), FIAS (12.04 s), and FBTCS (5 s).
Following seizure onset, the first 20 s in the ANT showed a progressive increase in spectral power in lower frequencies (4–16 Hz) for all seizure types (figure 1(C)). In addition, FIAS and FBTCS showed a sustained increase in 32–64 Hz. The peak changes in theta band (4–8 Hz) were seen around 26–31 s after seizure onset in the cortex. Also, we observed a decrease in MSE, implying that the degree of randomness of the thalamic neural activity reduced during the time of the seizures. The changes were noted for all types of seizures (ES, FAS, FIAS, and FBTCS).
3.4. Electrophysiological signatures of the thalamic ictal state are distinct from interictal states
Both RF and RKS were able to parse the thalamic seizure state from interictal states. For RF, the precision (positive predictive value) and recall (sensitivity) was 93.9% and 93.8%, respectively. For RKS, the precision and recall were 97.3% and 97.6%, respectively. In figure 3, the average values of the confusion matrices, and performance metrics that were performed over 500 iterations for both RF and RKS were highlighted. The performance was reliable across the 500 iterations for both RF and RKS with a narrow variation in the range of performance (accuracy of RF: 87%–99% and RKS: 84%–100%) (other performance measures are summarized in figures 4(A) and (B)). Permutation feature importance was done for the RF model in order to verify if the seven features (DWT-RWE and MSE) were relevant for the classification (figure 3(A)). We observed that all the features were relevant, with the theta and beta frequency bandwidths having the highest permutation importance. For the RKS model, the features were transformed by the nonlinear RBF kernel function, and the internally transformed features were used for classification. Since a nonlinear transformation was being performed, the feature relevance analysis was non-trivial in the transformed domain and was beyond the scope of this paper. To evaluate the significant differences between the features, we used univariate ANOVA that showed that all predictors differed significantly from each other except MSE and L2-4 spectral features (figure 3(B)).
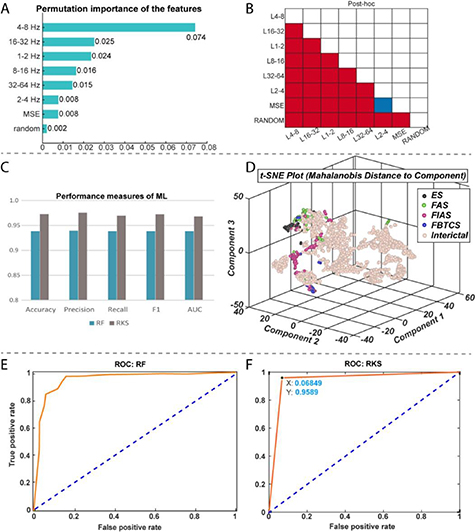
Figure 3. Performance measures of random forest (RF) and random kitchen sink (RKS) in classifying seizures and interictal states (awake and sleep) from electrophysiological recordings in the anterior nucleus of thalamus. (A): The bar plot depicts the permutation importance of the seven features (spectral power in six different frequencies and multiscale entropy (MSE) for RF classifier. Note the theta and beta frequency bandwidths had the highest permutation importance. (B): Results from a univariate ANOVA that showed all the seven features differed significantly from each other for RKS classifier except MSE and L2-4 spectral features. (C): RF had an accuracy of 93.9% and a precision of 93.9%. RKS has a higher accuracy (97.3%) and precision (97.6%). (D): A nonlinear dimensionality reduction using t-distributed stochastic neighbor embedding (t-SNE) showed that ictal (colored dots) spectral and MSE clusters were distinct from that of the interictal (beige dots). We also noted clustering within the ictal data and these distinct clusters (different colored dots) were because of the different seizure types (black—ES, green—FAS, red—FIAS and blue—FBTCS). Graphs (E) and (F) represent receiver operating characteristic curves (ROC) of performance of RF and RKS respectively. Both ROC curves show good separation with RF having an AUC of 0.94 and RKS with an AUC of 0.96.
Download figure:
Standard image High-resolution image
Figure 4. Performance (minimum and maximum) of the random forest (RF) and random kitchen sink (RKS) classifiers across the 500 iterations are enumerated. AC—accuracy; Pr—precision; Sn—sensitivity; F—f measure; FP—false-positive; FN—false-negative; TN—true-negative; TP—true-positive.
Download figure:
Standard image High-resolution image
After establishing the relevance of the seven features in classifying seizures and the interictal data, the seven-dimensional data was visualized as a two-dimensional map using t-distributed stochastic neighbor embedding (t-SNE) algorithm. The 2-D map of the features was plotted using t-SNE with Mahalanobis distance metric (figure 3(D)). It can be observed that the DWT-RWE and MSE clusters during seizures were distinct from the interictal DWT-RWE and MSE, thus strengthening the probability of correct classification of thalamic states as seizure or inter-ictal. The ictal clusters were further noted to be sub-grouped based on the seizure types, i.e. ES, FAS, FIAS, and FBTCS, segregated into the distinct color clusters in the t-SNE plot (figure 3(D)). The receiver operating characteristic (ROC) curves show that both RF and RKS can discriminate the interictal and the ictal states very well (AUC of RF: 0.94 and RKS: 0.96) (figures 3(E) and (F)).
Overall, these results demonstrate that features extracted in the time and spectral domain from the thalamic LFPs can be used to classify seizures and interictal states in focal epilepsy.
4. Discussion
For the past two decades, there has been a significant increase in efforts developing seizure detection classifiers, nearly all of which were recordings from the cortical structures. However, localizing seizure focus can be challenging in non-lesional epilepsies. Increasingly focal epilepsy is conceptualized as a network disorder where seizure genesis can involve coordinated neural activity within a distributed network of structures [51]. Hence, subcortical structures like the thalamus that are interconnected to diverse cortical regions can be targeted to detect seizures and modulate the seizure onset network remotely. Rapid propagation of seizure activity to noncontiguous regions involves subcortical structures like the thalamus. Thus, the thalamus can be targeted as a 'choke point' to disrupt seizure evolution and generalization [52]. Generalized seizures carry the maximum risk of morbidity and mortality. However, to develop thalamic responsive therapies, the first step is to detect seizures using electrophysiological readouts.
Current thalamic DBS therapy administers periodic stimulation and has been approved by the U.S. Food and Drug Administration (FDA) as an add-on therapy for drug-resistant epilepsy in 2017. In contrast, the closed-loop neuromodulation RNS system was already in clinical use for the past five years (approved in 2012). RNS, unlike DBS, delivers stimulation in response to an incipient seizure detected in the seizure focus. Thus, localization of seizure focus is a prerequisite and hence may not be an option in nonlocalizable or regional seizure onset epilepsies. In addition, the chronic periodic high-frequency stimulation of thalamic DBS may interrupt the physiological processes involved in sleep and cognition. Preliminary attempts at closing this loop where RNS system implantation involving the ANT have shown promising results, with patients not reporting the untowardly adverse effects on mood, memory, or behavior as reported in long-term DBS therapy [53]. However, for effective detection of seizures in the thalamus, the brain–computer interface like the RNS detection system should rely on more accurate detection algorithms. Hence in this study, we have demonstrated how machine learning classifiers can segregate frequency-specific power spectral changes in the thalamus as seizures evolve from the interictal baseline.
Machine learning algorithms have been at the forefront as they provided higher accuracy in detecting seizures while minimizing the false positive rate. Using supervised machine learning tools, we demonstrated the feasibility of classifying seizures and interictal states from LFP recordings from the ANT. The performance metrics for the learning algorithms were comparable to the existing seizure classifiers [11, 54], although the notable finding in our study was the demonstration of seizure detection outside the seizure onset region. Currently, detection algorithms from non-brain signals continue to have a poor sensitivity ranging between 57%–64% for wearable electrocardiography (ECG) and 33% for wearable photoplethysmography sensors monitoring pulse rate variability [55, 56]. Among the brain-signals, multi-channel scalp EEG data classifiers have performed better with an average accuracy of 99.32%, the sensitivity of 99.41%, and specificity of 95.25% [9, 10]. Most scalp EEG based detection studies had sensitivity between 83%–96%, accuracy between 84%–100%, and false detection rate of as low as 0.15–0.17 events h−1[ 10, 11]. Most invasive EEG studies implementing classifiers to detect seizures from the seizure onset zone had sensitivity between 86%–100%, accuracy between 70% and 100%, and false detection rate of as low as 0 events h−1[ 11, 54]. Comparable to these, our thalamic based detections performed relatively well in detecting seizures among both the random forest (sensitivity 92.8%, accuracy 92% and false-positive 7.03) and random kitchen sink classifiers (sensitivity 94.3%, accuracy 95% and false-positive 4.14).
4.1. The emergence of theta rhythm in the ANT during seizures
Although multiple spectral changes characterized the thalamic ictal state, the emergence of theta band was significantly prominent and sustained for seizures that remained focal. Our findings are in agreement with recent studies that demonstrated increased power in lower frequencies in the ANT at the seizure onset [57]. Vertes et al demonstrated the presence of rhythmic burst firing of neurons in the ANT that was synchronous with hippocampal theta rhythm, and the rhythm resonated within the Papez circuit (including medial septum hippocampus and ANT) [58]. Prior studies have demonstrated that theta rhythm is associated with increased seizure threshold, is anti ictogenic, and synchronization in theta rhythm can ameliorate epileptic discharges [59, 60]. Further work is necessary to establish the role of theta rhythm in seizure propagation.
4.2. Clinical implication of developing thalamic seizure detector
With the increase in multifocal and difficult-to-localize epilepsies, there is a need to develop effective neuromodulation therapies as surgical resection is often unavailable. The ANT mediates cortical-subcortical interactions between the limbic system and the brainstem. These pathways are associated with a generalization or bihemispheric propagation of convulsive seizures [61]. Thus the thalamic hub is an attractive 'choke point' for modulating the distributed epileptogenic network and disrupting the seizure genesis [62, 63]. Indeed stimulation of the ANT confirmed modulation of the limbic system. Furthermore, recent case studies highlighted the feasibility of the RNS system in modulating the thalamocortical nodes during seizures [53, 64]. Our work is a step forward in identifying reliable seizure markers in the thalamus. The ability to predict seizure types at the onset might allow developing stimulation parameters that are specific for seizure types.
4.3. Limitations of machine learning model
In the present study, the data was trained on seizure clippings as discrete events, and the event detection was considered as a classifier and not as a prediction. Future studies should validate the findings on continuous extended periods of EEG recordings from the thalamic subnuclei to affirm that such algorithms can be implemented in real-time usage. Secondly, the features used for machine learning were limited to entropy and spectral measures. Other features like the synchronization patterns between the seizure onset zone and the thalamus are likely to influence the detection rate of seizures. Lastly, we noted that these machine learning tools were time expensive, where our data sets were trained and tested over hours. For neuromodulation based on online event detection, the algorithms need to perform faster while retaining the higher accuracy and sensitivity.
5. Conclusion
For closed-loop neuromodulation therapies, seizure detection algorithms are often developed by extracting features from the LFPs recorded from the seizure onset zone. In the present proof-of-concept study, we demonstrated that focal onset seizures could be detected in the thalamus- a subcortical structure that is outside the epileptogenic cortex. Using two supervised machine learning algorithms, we demonstrated the feasibility of classifying seizures from other interictal states of vigilance (awake, sleep) with higher accuracy (RF = 92%; RKS = 95%) and sensitivity (RF = 92.8%; RKS = 94.3%). Overall, these results suggest that field potentials recorded from ANT can be potential biomarkers for classifying states that can be targeted for intervention.
Acknowledgments
ET, GC, and SP would like to acknowledge the continuous support from the USA National Science Foundation Grant (NSF RII-2 FEC OIA-1632891). SP and GC would also like to acknowledge support from NIH (1RF1MH117155-01). We would like to thank Diana Pizarro and Auriana Irannejad for helping in data organization.
Conflict of interest
SP has served as a paid consultant for NeuroPace©, Inc. but declares no targeted funding or compensation for this study. None of the authors share any competing interests.