Impacts of China's Emissions Trading Scheme on the National and Hong Kong Economies: A Dynamic Computable General Equilibrium Analysis
 Yue Wang
 Niven Winchester2,3
  Kyung-Min Nam
- 1New Zealand Forest Research Institute (Scion), Rotorua, New Zealand
- 2School of Economics, Auckland University of Technology, Auckland, New Zealand
- 3Motu Economic and Public Policy Research, Wellington, New Zealand
- 4Department of Urban Planning and Design, The University of Hong Kong, Hong Kong, China
In this study, we estimate the economic impacts of China's official carbon-mitigation targets, in connection with Hong Kong's potential participation in a proposed national emissions trading scheme. We find that moderate intensity-reduction targets emulating China's pledged Paris Agreement commitment would incur much larger policy-compliance costs in Hong Kong (0.1–2.5% of baseline gross domestic product) than in Mainland China (0.1–0.7%) in each of the modeled years 2021 to 2030 when each economy operates its own independent carbon market. By comparison, an integrated carbon market enables Hong Kong to achieve the same reduction goal at up to 78% lower costs compared to an independent market, and this is achieved without significantly affecting the Mainland's economy. These savings in compliance costs for Hong Kong are greater when pre-integration local carbon prices in both economies are subject to a larger gap. Effectively, the cheaper pre-integration carbon prices in the Mainland indirectly subsidize the Hong Kong economy in the initial years of the integration scenario, buffering the policy shock. In sum, an integrated carbon market in China would improve overall efficiency at the national level, but the benefits are biased toward Hong Kong. This finding suggests that it is in the city's interest to play a more active role in cross-border collaboration on climate mitigation and emissions trading.
JEL classification: C68, Q42, Q52, Q54
Introduction
China is the world's largest greenhouse gas (GHG) emitter, accounting for over a quarter of global carbon emissions, and it has joined the global mitigation effort. In 2011, China first introduced a nationwide voluntary target of 17% carbon-intensity reduction as part of its 12th Five Year Plan (2011–2015); the 13th Five Year Plan (2016–2020) formalized an 18% carbon-intensity reduction during the 5-years period as a legally binding target. In keeping with these domestic policy goals, China pledged its commitment to the Paris Agreement and declared a nationally determined contribution (NDC) of a 60–65% carbon-intensity reduction by 2030 from the 2005 level. Among the major policy instruments introduced to achieve this goal is an emissions trading scheme (ETS). China has tested eight province/prefecture-level ETS pilots since June 2013 and plans to make a gradual transition to a single, integrated national carbon market starting in 2020 (ICAP, 2020).
Hong Kong is a Special Administrative Region of China, endowed with substantial degrees of political and economic autonomy under the “one country two systems” principle. As such, it sets its own mitigation targets with independent implementation mechanisms. In accordance with China's NDC, Hong Kong aims to achieve a 65–70% carbon-intensity reduction (comparable to a 26–36% emissions abatement) by 2030 from the 2005 level (Environment Bureau, 2017). In its mitigation policy, Hong Kong's government has emphasized the local power sector, which alone accounts for over two-thirds of the city's GHG emissions. Conventional command-and-control regulatory measures have been used to implement a gradual phase-out of the existing coal-fired power plants and promote renewable energy sources, aiming at the latter's combined market share of 3% or higher by 2030 (Environment Bureau, 2017).
One challenge Hong Kong confronts is that its tiny local carbon market and oligopolized power-sector structure leave little room for the operation of an independent ETS. Sole dependence on conventional regulatory measures vs. market-based policy instruments like ETS is costly, as such measures require high information cost for monitoring and discourage ingenious abatement options (Eden et al., 2018; Ma et al., 2019). Of the two most widely employed market-based instruments for mitigation purposes, emissions trading is theoretically more efficient than a carbon tax, as the former is less distortionary in market allocations and entails lower uncertainty in emission pathways (Jacoby and Ellerman, 2004; Burniaux et al., 2009; Carl and Fedor, 2016). In this context, Hong Kong's participation in China's national ETS is the most likely and feasible scenario for bringing a market-based mechanism to the city. An integrated carbon market would in principle help Hong Kong achieve its official mitigation targets at lower costs, and because of its small size, the move would not add significant pressure on the national system. Despite the potential benefit, the possibility of an integrated carbon market has not yet received sufficient public and academic attention due in large part to the political and administrative complexity of harmonizing the two different systems (Central Policy Unit, 2017). This study is motivated to fill this gap.
In this study, we examine the following two questions, using a single analytic framework. One is what impacts will China's proposed carbon mitigation targets bring to national and local economies if Mainland China and Hong Kong operate independent carbon markets; the other is how Hong Kong's full integration into China's national ETS will affect regulatory costs and their distribution across regions and sectors. The study's academic merit is to focus on “what-ifs” of the integration of Hong Kong's ETS into the national carbon market, which no study has yet explored, despite the potential policy importance. We develop and apply a multi-region, multi-sector, dynamic computable general equilibrium (CGE) model, which we use to simulate detailed economic and energy market conditions under various policy scenarios. Details on our method are given in Section Methodology after a review of relevant literature in Section Background. We discuss the key results and findings in Sections Results and Discussion, and conclude in Section Conclusion.
Background
Carbon Mitigation in China and Cross-Border Collaboration With Hong Kong
China has made increased efforts to mitigate carbon emissions since it first introduced an intensity-reduction target as part of its 12th Five Year Plan (2011–2015). The primary policy instruments to achieve the target include the national ETS, as well as conventional command and control measures (Springer et al., 2019). Before transitioning to an integrated national carbon market, China launched eight ETS pilots in Hubei, Guangdong, Beijing, Shanghai, Shenzhen, Tianjin, Chongqing, and Fujian between 2013 and 2016. The main purpose of the ETS pilots was to obtain experience in designing and operating a national carbon market, and each pilot was a unique experiment in terms of sectoral coverage and operational mechanisms (Zheng et al., 2019; Wen et al., 2020). In December 2017, China announced the transition to a national system, with provisions for its incremental development, starting with the electricity industry. As of August 2020, eight ETS pilots were still operating independently, and it is apparent that a complete transition to a single national market will take quite a long while given the administrative and technical challenges (Dong et al., 2019).
Hong Kong sets carbon mitigation goals comparable to the national targets, but China's national ETS does not include Hong Kong, out of respect for the one-country-two-systems principle. In Hong Kong, operating a local ETS has never been a serious policy agenda item, given its electricity-dominant emissions composition and oligopolized market structure (Chiang et al., 2015; Huang et al., 2019). In 2017, for example, Hong Kong's local GHG emissions were 41 MtCO2e (around 0.4% of China's) and nearly two-thirds of the emissions were from the power generation sector alone, followed by the transportation sector, which accounted for 18% (Electrical and Mechanical Services Department, 2019; International Energy Agency, 2020). In 2015, locally generated output from coal (48%) and natural gas (27%) thermal power plants fulfilled three-quarters of the local electricity demand, and most of the remaining 25% of demand was met by electricity imported from Guangdong-based nuclear power plants (Environment Bureau, 2017). At present, Hong Kong's local power sector is operated by two private firms: China Light and Power, capturing three-quarters of the market share, and Hong Kong Electric, delivering the remaining quarter. This market structure makes it hard to imagine an independent local carbon market in Hong Kong, which explains the city's dependence largely on conventional command-and-control regulatory measures for climate mitigation.
Increased regional cooperation over environmental regulations in the Pearl River Delta (PRD) would clearly open up the possibility of a market-based mechanism being introduced to Hong Kong via its participation in the national ETS (Yan et al., 2020). A regional pollutant emissions trading pilot scheme for thermal power plants in the PRD, jointly implemented by the governments of Guangdong Province and Hong Kong since 2007, offers insights into how an integrated carbon ETS might operate (Legislative Council, 2018). This scheme regulates eligible PRD thermal power plants with 100 MW or larger capacity and covers three main air pollutants—sulfur dioxide, nitrogen oxides, and particulate matter. In accordance with mutually agreed long-term regional abatement targets and technical standards, both governments have imposed emission caps and monitored plant-level performance while allowing intra-regional emissions trading.
Other examples of cross-border collaboration on environmental policies include the PRD air-quality monitoring system and the Cleaner Production Partnership Program (CPPP). The PRD air-quality monitoring system, which has been in operation since 2005, set an early milestone for regional level concerted action against pollution in China (Nam, 2020). At present, a total of 23 dedicated air-quality monitoring stations in Guangdong, Hong Kong, and Macau are linked to a monitoring network for real-time data sharing, and the three governments collaborate on regional air-quality improvement targets and joint compliance assessment on an annual basis (Guangdong Provincial Environmental Monitoring Centre et al., 2019). The CPPP, which has been implemented since 2008, is a public grant program intended to reduce cross-jurisdictional negative externalities within the PRD region. Through the Program, Hong Kong-invested factories operating in either Hong Kong or Guangdong can receive public grants to subsidize adoption of clean energy technologies and practices (Hong Kong Productivity Council, 2020). All these existing regional cooperation models seem to be stepping stones to an extended national ETS.
Impacts of National ETS on China's Economy
A substantial body of literature examines the potential economic impacts of China's national ETS. A group of studies (Fan et al., 2016; Zhang et al., 2016; Dai et al., 2018; Yu et al., 2018; Cao et al., 2019; Ma et al., 2019) examine the impacts of the national ETS, mostly in comparison with those of other policy instruments, such as renewable portfolio standards and carbon tax. Others (Bi et al., 2019; Pang and Timilsina, 2019) explore efficient mitigation strategies to meet China's long-term NDCs, including permit allocation methods and future emissions reduction schedules.
Many of these impact studies take a CGE approach, which is a powerful analytical strategy for exploring counterfactual scenarios, and the key results of major CGE studies on China ETS are summarized in Table 1. Overall, the ETS-based compliance costs required to meet the Paris Agreement targets are estimated to be 0.1–7.6% of China's baseline gross domestic product (GDP) for each year between the initial year of operation assumed and 2030. A critical comparison of the studies is difficult given the difference in detailed model structure, baseline emissions schedule, and policy constraints. The studies also show that meeting these targets creates a significant change in China's energy demand structure, as well. In particular, the use of coal, having a high emission factor, is estimated to decline by up to 48% during the modeled period, causing a strong shock to the electricity sector and energy-intensive industries.
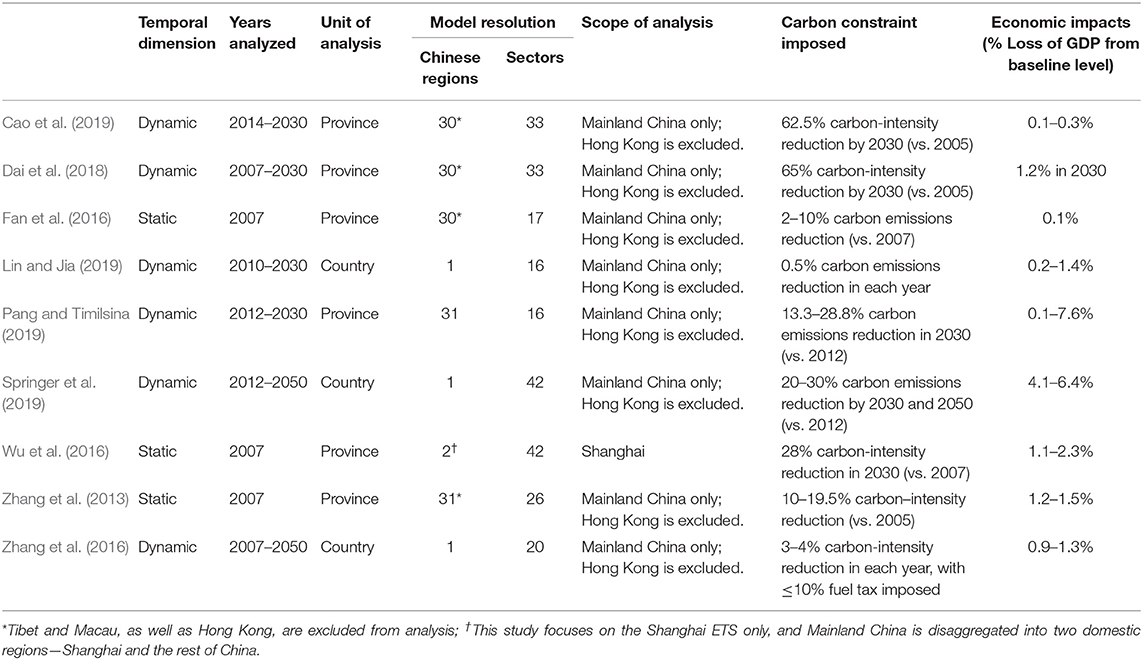
Table 1. CGE Studies on China's ETS.
None of the studies mentioned above, however, include Hong Kong in their analysis, given that the existing plan for China's national ETS does not cover Hong Kong. The same is the case for local studies focusing on Hong Kong's carbon mitigation, whose discussion is limited to existing policy instruments neglecting a national ETS scenario (e.g., Leung et al., 2009; Yam and Leung, 2013; Lo and Francesch-Huidobro, 2017; Huang et al., 2019). These studies examining the efficiency of policy measures and compliance options available to meet Hong Kong's GHG mitigation goals leave room for improvement in two respects. The first is attention to a potential local carbon market linked to Mainland China in Hong Kong's context. This is a highly plausible scenario, given the increased cross-border collaboration for environmental regulations in the PRD region, but it is ignored in these studies. Hong Kong, in particular, has an economic incentive to reduce policy-compliance costs with a market-based instrument, which lacks feasibility in the absence of regional collaboration. The second is a methodological limitation. The static, partial equilibrium approach adopted by these studies, such as optimization based on linear programming, lacks consideration of cross-sectoral linkage and cumulative effects over time, and is thus subject to potential under/overestimation in impact assessment. A more comprehensive analysis requires a dynamic framework, comparable to those adopted in the CGE studies of China's national ETS, discussed above.
Methodology
Mainland China-Hong Kong Energy Model1
For our analysis, we develop and apply a multi-region, recursive-dynamic CGE model, titled the Mainland China-Hong Kong Energy Economic Model (CHEEM)2. CHEEM includes six regions in total, where Mainland China and Hong Kong represent two separate regions, and 16 production sectors (Table 2). The social accounting matrix for the model is constructed from the Global Trade Analysis Project version 9 (GTAP9) dataset for 2011 (Aguiar et al., 2016), and physical accounts associated with carbon emissions and energy demand are developed from multiple sources, including the GTAP-Power database (Peters, 2016), the Multi-resolution Emissions Inventory for China version 1.3 (Center for Earth System Science, 2020), and the International Energy Agency database (International Energy Agency, 2020). CHEEM adopts standard behavioral assumptions for economic agents—consumers and firms maximize utility and profit, respectively—and imposes conventional closure rules for an equilibrium, such as market clearance, zero profit, and income balance (Rutherford, 1995; Chen et al., 2017).
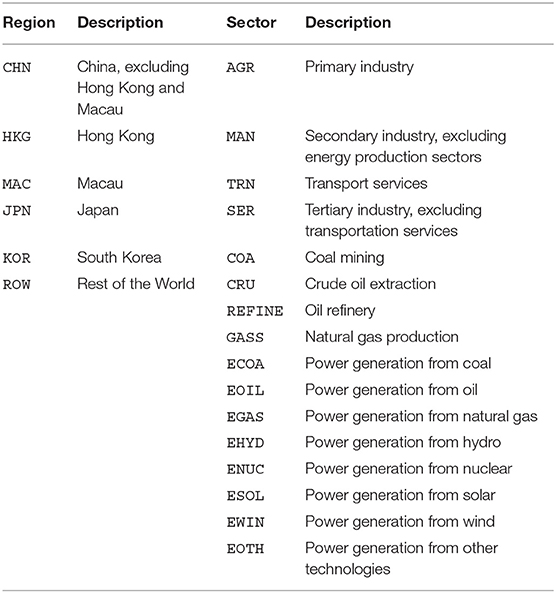
Table 2. Regional and sectoral aggregations in CHEEM.
CHEEM has a hierarchical structure of constant elasticity of substitution (CES) production nests (Figure 1). While intermediate inputs for each sector are subject to the Leontief structure (INT nest), which is a special case of the CES function, there are substitutions between production factors and energy inputs (EVA nest) whose magnitude is determined by their relative prices and elasticities. Local goods and foreign imports are differentiated and treated as imperfect substitutes with Armington elasticities, which recognizes that identical products sourced in different countries or regions are not perfect substitutes. For the electricity sector, we consider three thermal generation options by fuel type (coal, oil, and gas) and five non-fossil generation technologies (hydro, nuclear, solar, wind, and other). Electricity output from these eight generation options is treated as a perfect substitute.
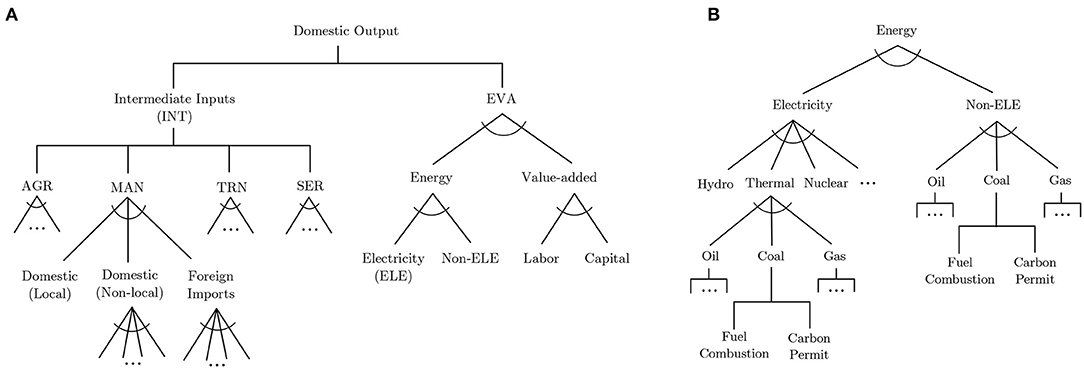
Figure 1. Brief structure of CHEEM: (A) non-energy production nest; (B) electricity production nest.
CHEEM is modeled to treat carbon permits as a production input so that it can comply with a given carbon constraint. Use of fossil energy inevitably produces carbon emissions, and the emissions can be offset with carbon permits, ensuring the exact corresponding amount of emissions. In the model, a Leontief structure is applied to fossil energy use and carbon emissions (i.e., a fixed emission factor for a unit energy use by fuel type, sector, and region), and each sector using fossil energy for production must purchase carbon permits in proportion to its carbon emissions to ensure its target production level. In this sense, the value and cost associated with carbon emissions are assessed in terms of shadow price—marginal cost required to comply with a unit constraint or marginal benefit achievable with the relaxation of a unit constraint (see Section “Carbon-pricing Structure” in Appendix). Such a carbon price exists only when a carbon constraint is imposed in the form of an emission cap, while the cost of emitting carbon is zero in the absence of a cap (Nam et al., 2014). We model CHEEM in such a way that either economy-wide or sector-specific caps can be applied and carbon permits within a given carbon market are freely tradable across sectors.
Scenarios
For counterfactual analysis, we developed five scenarios—one reference case scenario and four policy case scenarios (Table 3). The reference scenario (BAU) is a business-as-usual case where historic economic trends are extended with the assumption of current legislation into the future until 2030. CHEEM's dynamic structure is calibrated to simulate under BAU baseline gross domestic product (GDP) and carbon emissions, constructed from multiple sources. Regarding baseline GDP levels, we use historic GDP data from the World Bank (2020) for the pre-2020 period, while assuming annual mean growth rates of 5% and 1.5% for Mainland China and Hong Kong, respectively, for the future period. The growth rates chosen for the future period are relatively conservative, compared with 5–7% used for China in existing studies (e.g., Wang and Zhou, 2016; Zhang et al., 2016; Cao et al., 2019) and 2.5–3% used for Hong Kong in local public policy documents (e.g., Legislative Council, 2014). This is to reflect the global economic downturn caused by the COVID-19 pandemic, which likely will last at least until 2022 with an estimated effect of up to −5% on China's and Hong Kong's economies (International Monetary Fund, 2020).
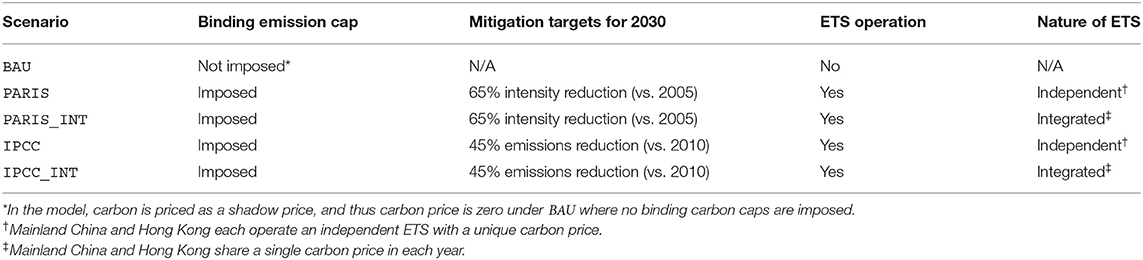
Table 3. Scenarios for model simulation.
Our baseline carbon dioxide (CO2) emissions inventories are developed using the Eclipse-V5a-CLE-Base scenario for the GAINS-ASIA model as the base (International Institute for Applied Systems Analysis, 2018) and historic inventory data from the Center for Earth System Science (2020), the International Energy Agency (2020), and the Environment Bureau (2020) for further adjustments (Figure 2). The GTAP9 database provides refence CO2 emissions data for 2011, and CHEEM's recursive dynamic structure extends this snapshot for later years, using endogenously determined sectoral energy use for each year and a set of fuel-specific emission factors. The built-in emission factors given in GTAP9 are adjusted for other simulation years using the International Energy Agency (2020) data, and the model is further calibrated to simulate the baseline CO2 emissions under the BAU scenario (see Appendix for further details).
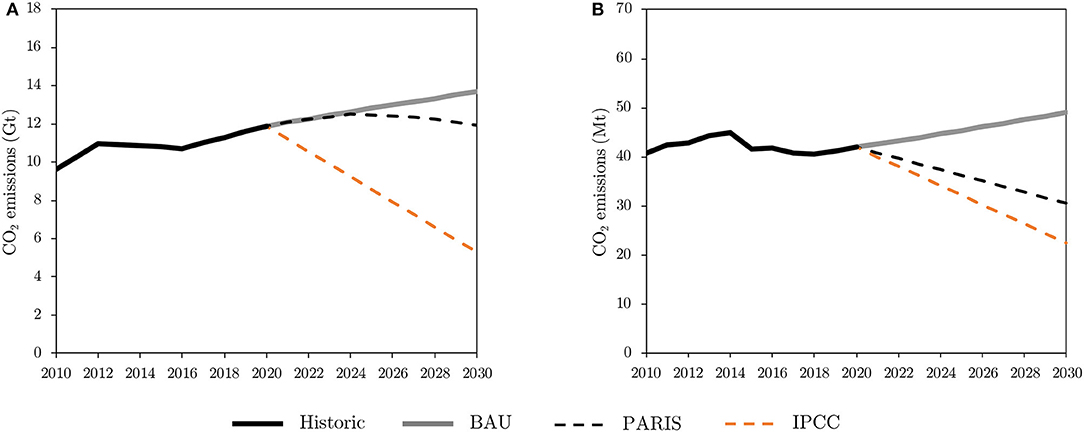
Figure 2. Emission schedule under each scenario: (A) Mainland China; (B) Hong Kong.
The four policy case scenarios posit the operation of ETS in Mainland China and Hong Kong under binding emission caps. Two of them (PARIS and PARIS_INT) assume that both Mainland China and Hong Kong achieve their official carbon-intensity reduction targets for 2030, benchmarked to China's NDCs in accordance with the Paris Agreement. Under the PARIS scenario, both Mainland China and Hong Kong Are set to independently operate an ETS covering all production sectors while both parties jointly operate a single, integrated ETS under PARIS_INT. The other two policy scenarios (IPCC and IPCC_INT) impose more stringent mitigation targets, consistent with those required to achieve the 1.5°C target proposed by the International Panel on Climate Change (Intergovernmental Panel on Climate Change, 2018). Under a representative concentration pathway scenario, the target—limiting global warming to 1.5°C above the pre-industrial levels by the end of this century—translates into around 45% reduction in absolute carbon emissions by 2030 from the 2010 level (ibid.). Similar to the previous match, IPCC assumes independent ETSs in the Mainland and Hong Kong, respectively, while IPCC_INT assumes a single, integrated carbon market.
Results
Impacts of ETS Under Moderate Mitigation Targets
As explained earlier, CHEEM treats carbon emissions as a production input required for fossil energy use, and an emission cap functions as a resource constraint. When an emission cap is imposed, firms respond in two directions: switching to less carbon-intensive fuels or cutting energy use. Both responses—forced use of pricier energy inputs or reduced energy consumption—result in a drop in economic output, and the net economic loss can be understood as a cost required to comply with the mitigation target.
When relatively moderate mitigation targets (those described in the PARIS scenario) are imposed, policy compliance costs measured in GDP loss from the baseline levels are estimated to be 0.1–0.7% for Mainland China and 0.1–2.5% for Hong Kong in each year between 2021 and 2030 (Table 4). Under this scenario, compliance costs are much lower in Mainland China, as its greater economic growth translates a comparable intensity-based reduction target into a much less stringent absolute emissions reduction. In the Mainland, the improvement in carbon intensity—carbon emissions per unit GDP—is driven by high GDP growth, rather than absolute emissions reduction, and thus lower carbon intensity may still allow an increase in absolute carbon emissions; in contrast, advanced economies like Hong Kong must cut absolute carbon emissions to reduce carbon intensity, given their low GDP growth rates (Nam et al., 2013). Such a difference in the relative stringency of the carbon constraint is also demonstrated by higher carbon prices in Hong Kong—US$62/tCO2 to US$738/tCO2, compared with US$6/tCO2 to US$67/tCO2 for Mainland (Table 5)3. In each economy, compliance costs rise within the period, as the relative stringency of the carbon constraints—measured in percentage emissions reduction from the baseline levels—increases over time: the stringency in Mainland (or Hong Kong) gradually increases from 0.1% (or 4.3%) reduction in 2021 to 12.9% (or 37.9%) in 2030. Carbon prices in each economy thus show a similar time trend.
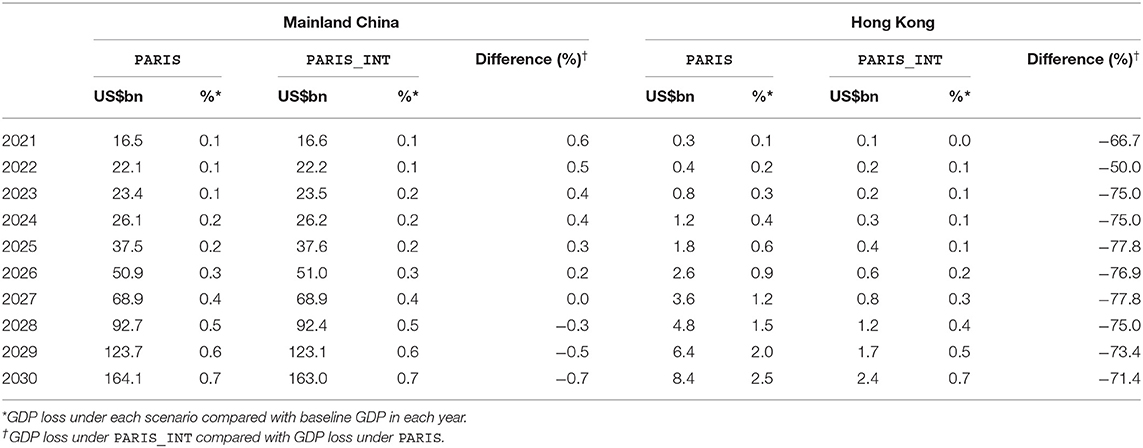
Table 4. GDP loss under moderate mitigation targets (vs. BAU levels).
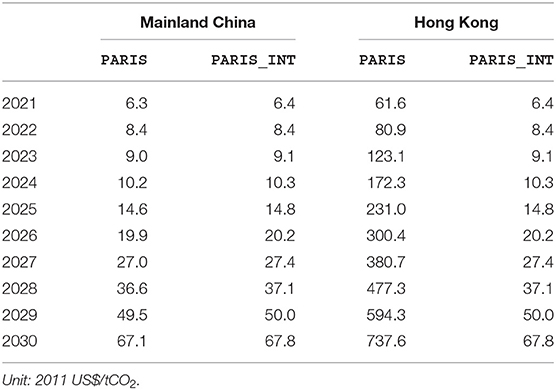
Table 5. Carbon prices under moderate mitigation targets.
Policy compliance costs in Hong Kong are reduced substantially under the PARIS_INT scenario. In each year between 2021 and 2030, Hong Kong is estimated to save up to US$6 billion in policy compliance costs if carbon markets in Mainland China and Hong Kong are integrated. The saved amount is 50–78% of the compliance costs required to meet the same mitigation targets given in the PARIS scenario. Improved efficiency under the PARIS_INT reflects increased room for less costly compliance options with ETS. An integrated carbon market offers one more compliance option for Hong Kong-based firms, in addition to fuel switching and less use of energy: purchasing carbon permits from Mainland firms, which helps Hong Kong maintain relatively high local output levels without additional capital investment. Emissions trading, as well as fuel switching, is less costly than reducing energy use, having direct effects on economic output, if carbon/input prices remain at reasonable levels. Under the PARIS_INT scenario, the local carbon price in Hong Kong is reduced to US$6.4/tCO2–US$68/tCO2 from US$62/tCO2–US$738/tCO2, making emissions trading a reasonable compliance option. Accordingly, under the PARIS_INT scenario, Hong Kong-based firms can consider two relatively cost-effective compliance options (fuel switching and emissions trading) instead of just one, and this helps Hong Kong achieve an identical carbon reduction goal at much lower costs.
In contrast to Hong Kong, the effects of the integrated carbon market on Mainland China are marginal. When the results under the PARIS_INT scenario are compared with those under the PARIS scenario, the difference ranges between a compliance cost saving of US$1.1 billion and a cost increase of US$0.1 billion or between −0.7% and 0.6% of the compliance costs. These relatively limited effects on the Mainland economy are due to Hong Kong's small carbon markets: in 2017, for example, total carbon emissions in Hong Kong were fewer than 0.4% of the Mainland's. In fact, the local carbon price of US$6.3–US$67.1 presents only a marginal difference (US$6.4–US$67.8) when Hong Kong is added to China's national ETS. As well as their low magnitude, the direction of the effects on Mainland is not certain, as it is determined by the interplay between increased resources from carbon permit sales—which can be used for other production—and increased pressure for fuel switching and energy consumption cuts due to reduced emissions allowances. The net effects of integrated carbon markets on the Mainland economy are negative—though marginal—during earlier periods where carbon constraints are relatively less stringent and thus carbon prices are relatively low, while they are positive in 2028 and afterwards.
Carbon regulations hit the electricity sector more strongly than other sectors (Figure 3). In Mainland China, the electricity sector accounts for more than 71% of the total carbon emissions mitigated under the PARIS scenario with an increasing trend over time, and the share further increases to 78% or higher under the PARIS_INT scenario. A strong shock to the electricity sector is primarily due to the sector's high coal intensity and large contribution to local carbon emissions. These two factors combined suggest high mitigation potential attainable at relatively low costs through the adoption of alternative low-carbon or carbon-free generation technologies, such as gas-fired thermal generation and renewables. A similar result applies to Hong Kong as well. The carbon mitigation targets given in the PARIS scenario constrain the local power sector, accounting for more than 86% of the total emissions reduction, far exceeding any other sector. Under the PARIS_INT scenario, the share goes up to 98%, but the absolute size of the mitigated carbon emissions is much smaller, at less than one-fifth of the mitigation potential under the PARIS scenario. As explained, the shock to Hong Kong's economy is much weaker under the PARIS_INT scenario since lower carbon prices in an integrated carbon market incentivize Hong Kong-based firms to maintain relatively high production levels through an imported emission quota.
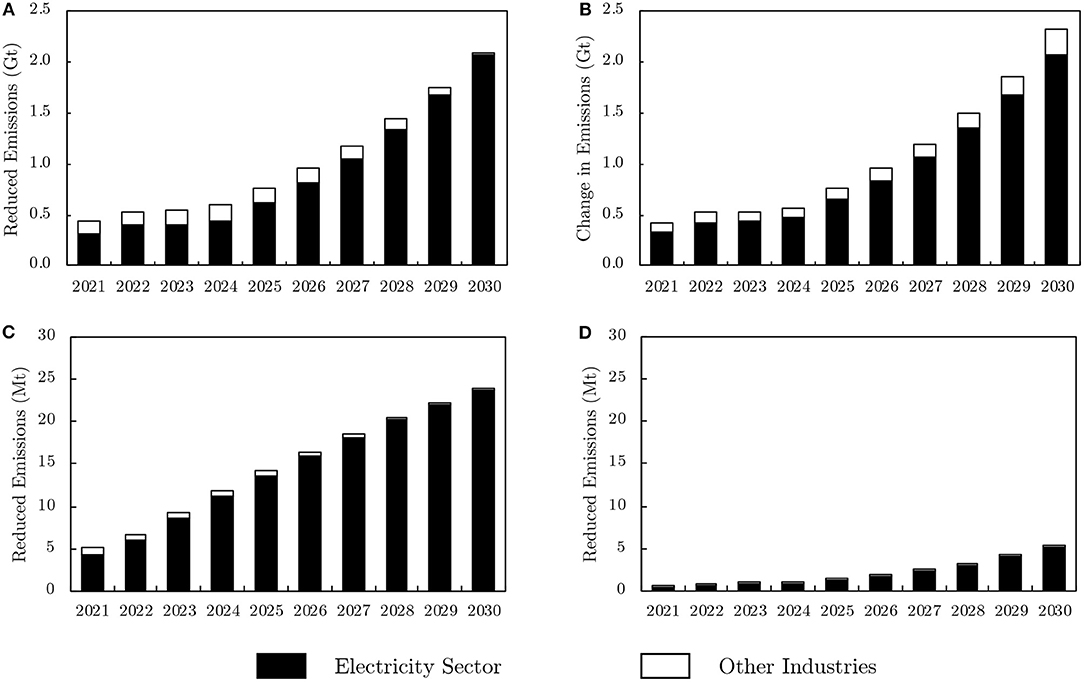
Figure 3. Carbon mitigation under moderate mitigation scenarios (vs. BAU Levels): (A) China, PARIS; (B) China, PARIS_INT; (C) Hong Kong, PARIS; (D) Hong Kong, PARIS_INT.
A strong shock to the local power sector necessarily leads to a significant change in local electricity output mix (Figure 4). In both Mainland and Hong Kong, the coal-based thermal generation segment, with higher emission factors than other generation options, shows the highest sensitivity. Under the PARIS scenario, total electricity generation output in the Mainland gradually increases from 9.5 PWh in 2020 to 11.3 PWh in 2027 and then stabilizes at 11.0 PWh by 2030. During the period, the absolute output from coal thermal plants (8.0 PWh to 9.2 PWh) is stable at around the 2020 level, but its share gradually declines over time from 84.1% in 2020 to 75.9% in 2030. The reduced role of coal in power generation creates greater room for renewables (wind and solar), whose joint share increases from 2.2% in 2020 to 8.4% in 2030. The same pattern in local electricity production holds for the Mainland under PARIS_INT scenario, as Hong Kong's tiny carbon markets have negligible impacts on the national level.
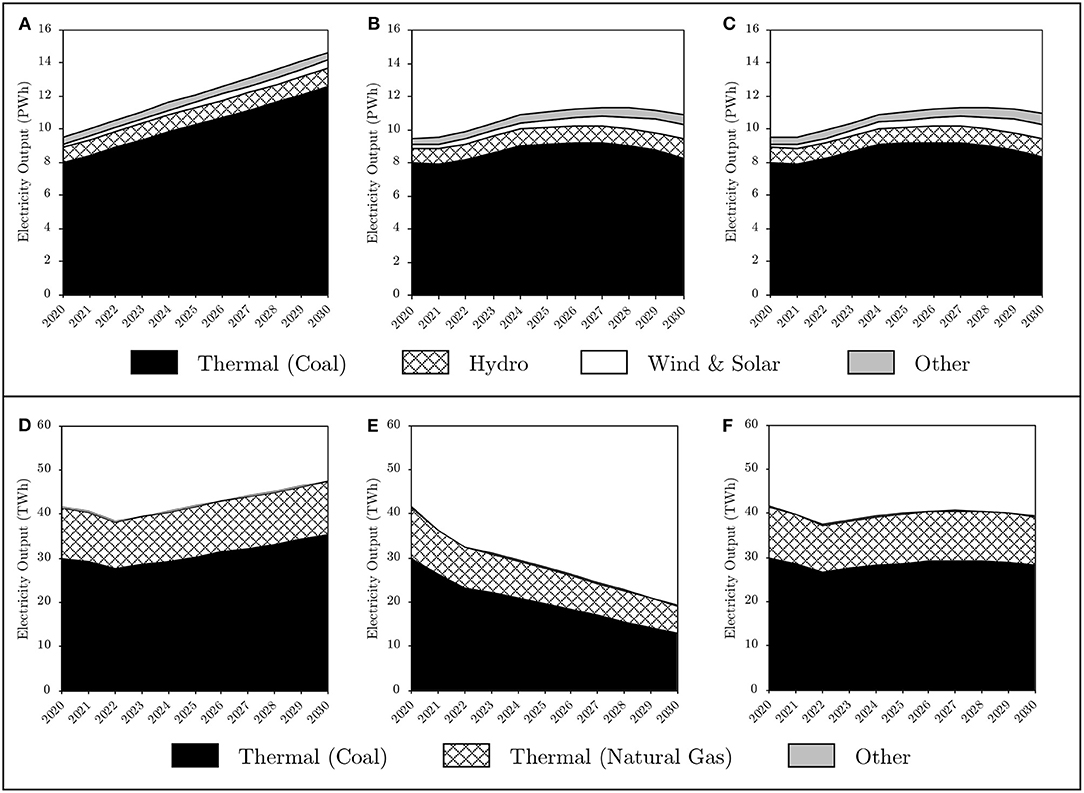
Figure 4. Local electricity output mix under moderate mitigation scenarios: (A) China, BAU; (B) China, PARIS; (C) China, PARIS_INT; (D) Hong Kong, BAU; (E) Hong Kong, PARIS; (F) Hong Kong, PARIS_INT.
Impacts on Hong Kong's electricity industry are more dramatic. Under the PARIS scenario, total local electricity output is monotonically reduced by 53% between 2020 and 2030, from 41.8 TWh to 19.4 TWh. During the same period, coal-fired thermal generation declines by 57% from 30.1 TWh to 13.0 TWh, with a moderately reduced output share from 72% to 67%. Gas-fired thermal generation also declines but to a lesser extent: by 46%, from 11.5 TWh to 6.2 TWh. The share of other generation technologies remains negligible without presenting any significant change. This picture, however, does not hold under the PARIS_INT scenario. Total local electricity output is maintained at around the 2020 level till 2030, presenting a narrow band of deviation between 37.5 TWh and 41.8 TWh. The output share of coal and gas thermal plants also remains constant throughout the period. The key driver of stable local electricity output is lower carbon prices under the PARIS_INT scenario, which incentivizes compliance via purchasing carbon permits, over mitigation through fuel switching or less energy use. That is, an integrated carbon market helps Hong Kong's electricity sector buffer a drastic shock to local power supply and its technological composition.
Impacts of ETS Under Stringent Mitigation Targets
When more stringent IPCC scenario mitigation targets are imposed, policy compliance costs increase to 0.5–24% of baseline GDP for Mainland China and 0.2–10% for Hong Kong in each year between 2020 and 2030 (Table 6). Higher compliance costs in the Mainland are associated with the relative stringency of the mitigation targets in comparison with the BAU emission levels for each economy and its cumulative effects over time. The targets positing an identical percentage reduction from the 2010 emission levels are in practice more stringent (and thus more costly) to Mainland China given its more rapid baseline emission growth. In fact, annual abatement required under the IPCC targets is 7–61% of the baseline emissions for the Mainland and 6–54% for Hong Kong, and this gap in regulatory stringency incurs greater annual GDP loss to the Mainland. In a dynamic setting, lost income at one time point reduces savings and investment for future growth, and affects the economy for a long time in a cumulative manner. Such cumulative effects are greater in faster growing economies, and function as a shock amplifier by extending the initial gap in GDP loss between the Mainland and Hong Kong over time (Nam et al., 2019).

Table 6. GDP loss under stringent mitigation targets (vs. BAU levels).
The impact of an integrated carbon market on the economy is much greater in Hong Kong than in the Mainland. Under the IPCC_INT scenario, Hong Kong can save 4–33% of compliance costs each year between 2021 and 2030, with a declining trend over time. Lower carbon prices primarily account for the cost savings (Table 7). Under the IPCC scenario, unit carbon emissions in Hong Kong cost US$82/tCO2–US$2,244/tCO2, but the operation of an integrated carbon market (IPCC_INT) drives the prices down to US$24/tCO2–US$1,579/tCO2. Accordingly, Hong Kong-based firms have greater incentives to purchase carbon permits under the IPCC_INT scenario, helping maintain higher local output levels and thus reducing policy-compliance costs measured in GDP loss. The declining trend in the IPCC-relative cost savings (from 33% in 2021 to 4% in 2030) is due to the narrowing gap in carbon prices under both scenarios. In 2021, for example, the carbon price of US$24/tCO2 under IPCC_INT is less than a third of the price under IPCC (US$82/tCO2), but in 2030, the gap is greatly reduced and the former (US$1,579/tCO2) exceeds 70% of the latter (US$2,244/tCO2). A narrower gap in carbon prices under the two scenarios necessarily translates into smaller economic effects.
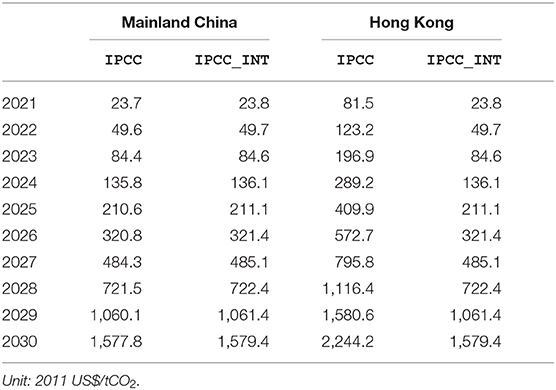
Table 7. Carbon prices under stringent mitigation targets.
In contrast to Hong Kong, in Mainland China the economic impacts of an integrated carbon market under the stringent targets are negligible. In each year between 2021 and 2030, compliance costs under IPCC_INT show only a marginal change (−0.05% to 0.06%) from those under IPCC. Again, such limited effects of an integrated carbon market are because Hong Kong's carbon market is too small to create any significant change in the Mainland's carbon market. In fact, local carbon prices in the Mainland remain almost the same under the two scenarios (US$24/tCO2–US$1,579/tCO2 under IPCC_INT, compared with US$24/tCO2–US$1,578/tCO2 under IPCC). The net effects, though marginal, can be either positive or negative: compliance costs under IPCC_INT are slightly higher than those under IPCC until 2025, but the opposite is true after 2025. As explained above, the net effects of an integrated carbon market on the Mainland's economy depend on the interplay between the two opposing forces—increased resources for production from carbon permit sales and increasingly less room for carbon emissions after permit sales. In earlier periods, when carbon prices are relatively low, the latter dominates the former, while the former dominates the latter in later periods, when carbon prices are relatively high.
Carbon regulations penalize the electricity sector most, but they also significantly affect other emission-intensive industries when the mitigation potential of the electricity sector is exhausted (Figure 5). In the Mainland, the electricity sector accounts for a dominant share of the total carbon emissions abated under both IPCC and IPCC_INT scenarios, but the share gradually declines over time from 87% in 2021 to 57% in 2030. In contrast, the share of the secondary industry grows over time from 4% in 2021 to 32% in 2030, increasingly replacing the role of the electricity sector. This transition is because the electricity sector's mitigation capacity is depleted with a complete phase out of coal-fired thermal power plants by 2030. Compliance with the stringent targets requires additional abatement from other carbon-intensive sectors, such as manufacturing, once the electricity sector fails to offer further room for mitigation. This situation, however, does not apply to Hong Kong, where almost all emission cuts under both stringent mitigation target scenarios are from the electricity sector alone (over 92% of the total emissions abated under IPCC and over 97% under IPCC_INT). Dependence on the electricity sector is slightly higher with an integrated carbon market in operation, as the imported emission quota offers some buffer for its mitigation potential.
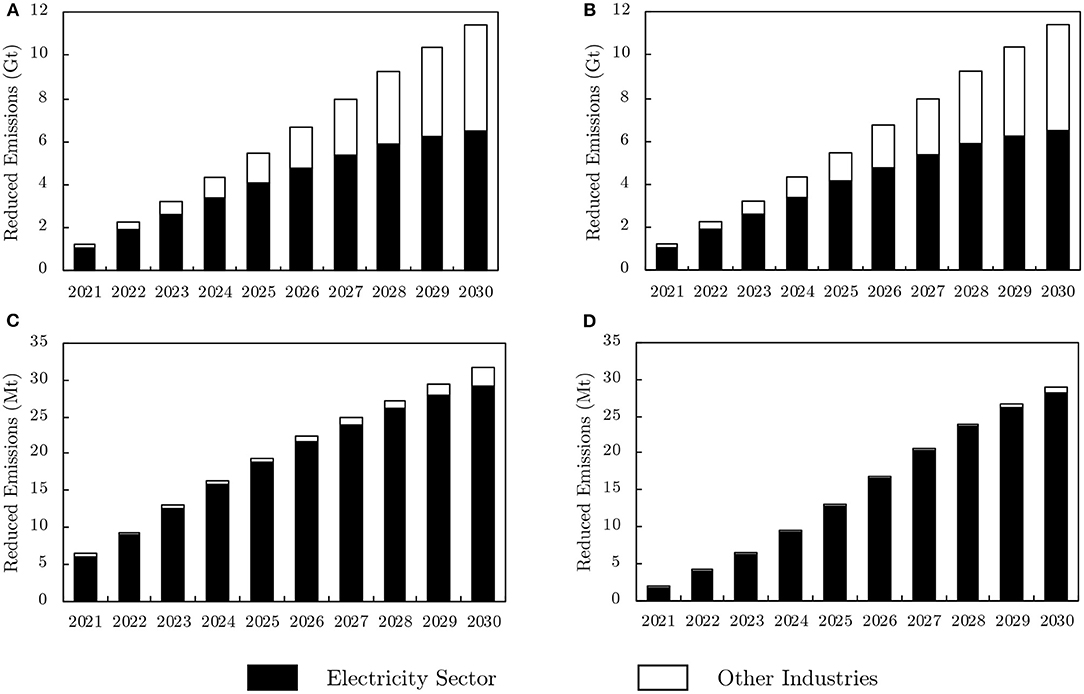
Figure 5. Carbon mitigation under stringent mitigation scenarios (vs. BAU Levels): (A) China, IPCC; (B) China, IPCC_INT; (C) Hong Kong, IPCC; (D) Hong Kong, IPCC_INT.
Complying with stringent mitigation targets drastically changes the electricity output mix in both economies (Figure 6). In Mainland China, total electricity output under the IPCC and IPCC_INT scenarios drops steeply from 9.5 PWh in 2020 to 3.0 PWh in 2030, which is below two-thirds of the 2010 level. In particular, coal-based thermal generation completely phases out of the local power sector by 2030, creating increased room for renewables. In particular, wind-based power generation grows more than sevenfold during the period, accounting for roughly half the local electricity output in 2030. However, electricity output from other generation technologies remains stable, and fails to play a significant role in moderating the supply shock.
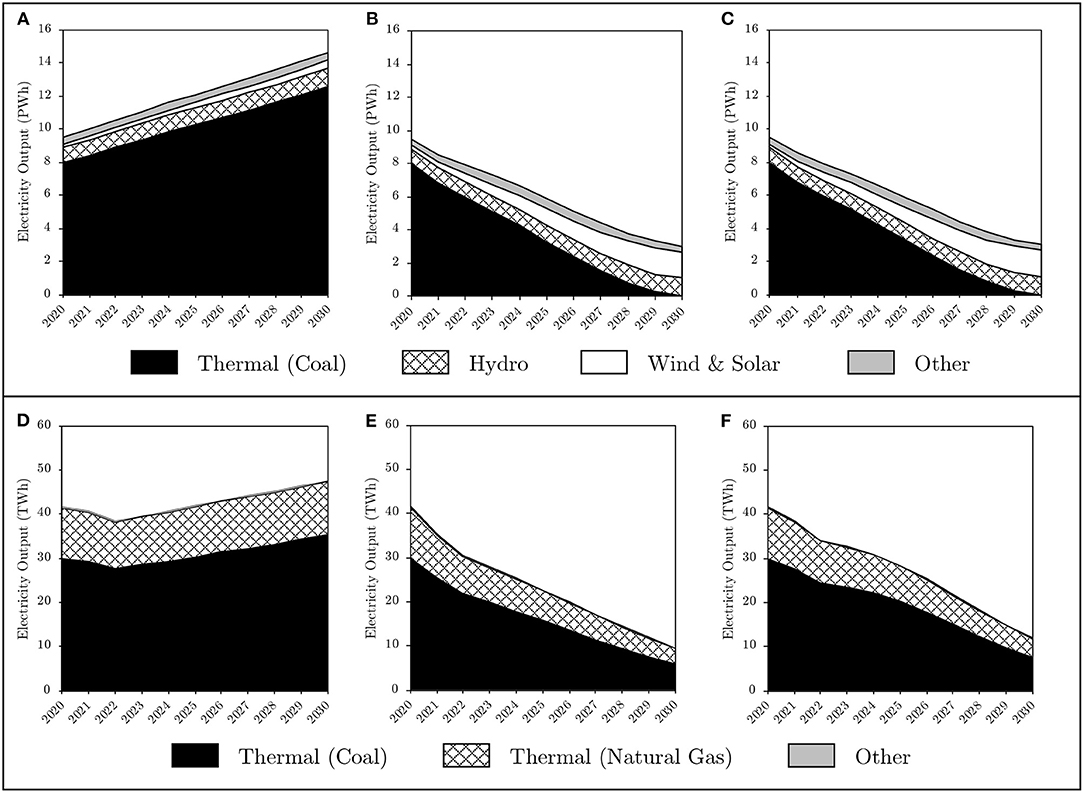
Figure 6. Local electricity output mix under stringent mitigation scenarios: (A) China, BAU; (B) China, IPCC; (C) China, IPCC_INT; (D) Hong Kong, BAU; (E) Hong Kong, IPCC; (F) Hong Kong, IPCC_INT.
In Hong Kong, total power output under the IPCC scenario also falls sharply, from 41.8 TWh in 2020 to 9.6 TWh in 2030. Coal-fired thermal generation output declines by 80% during the same period, but its local output share—though gradually declining over time from 72% in 2020—remains dominant (62%) even in 2030. Gas-fired thermal generation output is also reduced by 70% during the same period, but its output share rather increases from 28% to 36%; for gas-based thermal generation output with a lower emission factor declines at a slower rate than coal thermal generation output. The share of other generation technologies is negligible. An integrated carbon market substantially mitigates the local electricity supply shock. Locally generated electricity output is greater by 9–27% under IPCC_INT scenario, compared with output under IPCC scenario, and the split between coal and gas thermal plants in the output mix roughly remains constant until 2030.
Discussion
Impacts of Independent Carbon Markets in Mainland China and Hong Kong
Among the four counterfactual policy-case scenarios, the PARIS scenario, built on China's NDC in accordance with the Paris Agreement and Hong Kong's official mitigation goals, describes the most probable case in the near future. Under the scenario assuming no cross-border emissions trading, estimated compliance costs in each year between 2021 and 2030 are US$0.3 billion to US$8.4 billion (0.1–2.5% of baseline GDP) in Hong Kong and US$17 billion to US$164 billion (0.1–0.7% of baseline GDP) in the Mainland. The relative costs are much greater in Hong Kong than in the Mainland, as an identical percentage reduction in carbon intensity requires a more stringent emissions abatement in a slow-growing economy. The relative stringency of carbon control is also evinced by higher local carbon prices in Hong Kong (US$62/tCO2–US$738/tCO2), which are up to 11 times those of the Mainland (US$6.3/tCO2–US$67/tCO2). This gap introduces a much stronger shock to the local electricity output mix in Hong Kong, whose local electricity output in 2030 falls to below half the 2020 level, than in the Mainland, whose 2030 output remains 16% above the 2020 level. In both economies, coal-based thermal generation accounts for the largest share of the mitigated emissions from the baseline levels.
The more stringent, but less probable, mitigation targets given in the IPCC scenario require much greater policy-compliance costs and introduce a more drastic change in local energy supply in both economies. Under this scenario, GDP loss reaches up to 24% of the baseline level in the Mainland and up to 10% in Hong Kong. Comparable emissions-based mitigation targets lead to a larger cost in the Mainland than in Hong Kong, as more rapid economic growth in the former increases the gap between baseline emissions and given absolute emission caps in a greater magnitude. The shock to the local power sector is huge and hits coal thermal plants more strongly than other generation technologies, cutting local electricity output to below a third of the 2020 level in both economies.
Unfortunately, there are very few studies whose results can be directly compared with ours. Two Mainland-focused impact studies by Cao et al. (2019) and Dai et al. (2018) are close to ours in that they test similar emissions caps to those described in our PARIS scenario within a CGE context. Our estimates (e.g., 0.7% of GDP in 2030) are located within the range of their estimates (0.3–1.2%), but a parallel comparison is hard given the different model structure. In Hong Kong's case, we fail to find any serious academic studies examining the potential impacts of its potential carbon market.
Impacts of Integrated Carbon Markets
The integration of the two local carbon markets allows Hong Kong to achieve identical mitigation goals at much lower costs, while its impact on the Mainland is negligible. Under the PARIS_INT scenario, Hong Kong can reduce compliance costs by 50% to 78%, thanks to a huge drop in local carbon prices (vs. the PARIS scenario)—lower carbon prices incentivize more Hong Kong-based firms to maintain relatively high economic output levels by importing an emission quota from the Mainland. Similarly, an integrated carbon market significantly reduces the magnitude of the shock to Hong Kong's electricity output mix, helping maintain roughly the 2020 output level until 2030 without any drastic change. In contrast, carbon prices to Mainland-based firms remain almost the same under both PARIS and PARIS_INT scenarios; thus, the integrated carbon market does not have significant impacts on the Mainland's economy. That is, Hong Kong can greatly benefit from an integrated carbon market, in terms of policy-compliance costs, without burdening China's national economy. Similar to the moderate target case, an integrated carbon market substantially benefits Hong Kong while having only marginal impacts on the Mainland. Under the IPCC_INT scenario, for example, Hong Kong is estimated to save up to a third of the policy-compliance costs expected under the IPCC scenario. This cost saving (4–33%) is significant but smaller than the moderate mitigation target case (50–78%), as the relative difference in carbon prices under IPCC and IPCC_INT (US$82/tCO2–US$2,244/tCO2 vs. US$24/tCO2–US$1,579/tCO2) is much smaller than that under PARIS and PARIS_INT (US$62/tCO2–US$738/tCO2 vs. US$6/tCO2–US$68/tCO2).
Conclusion
In this study, we examine the potential economic impacts of China's national ETS and Hong Kong's participation in it under two sets of mitigation scenarios. In the absence of cross-border emissions trading, complying with the moderate mitigation targets described in the PARIS scenario is estimated to cost up to 2.5% and 0.7% of baseline GDP in Hong Kong and Mainland China, respectively.
The integration of the two independent carbon markets, however, allows Hong Kong to achieve the same mitigation goals at much lower costs, while its impact on the Mainland is negligible. Under the PARIS_INT scenario, Hong Kong can save over half the compliance costs with a huge drop in local carbon prices, as it helps Hong Kong-based firms to maintain relatively high economic output levels through carbon-permit purchase. In contrast, carbon prices to Mainland-based firms remain almost the same regardless of emissions trading across the border.
The more stringent mitigation target given in the IPCC scenario requires much greater policy-compliance costs and introduces a more drastic change in local energy supply in both the Mainland and Hong Kong. Under this scenario, GDP loss reaches up to 24% of the baseline level in the Mainland and up to 10% in Hong Kong.
Similar to the moderate target case, an integrated carbon market substantially benefits Hong Kong while having only marginal impacts on the Mainland. Under the IPCC_INT scenario, for example, Hong Kong is estimated to save up to a third of the policy-compliance costs expected under the IPCC scenario. This cost saving is significant but is smaller than the moderate mitigation target case, as carbon-price differentials arising from cross-border emissions trading are much narrower under the IPCC scenario which imposes comparably stringent mitigation targets on both Hong Kong and the Mainland.
In sum, we find that Hong Kong's participation in China's national ETS will bring substantial efficiency improvement to the former without burdening the Mainland's economy. Our simulation results demonstrate that the effects of an integrated carbon market tend to be greater when carbon mitigation targets in each economy present greater disparity in relative stringency and thus in the costs of unit emission: the effects of an integrated carbon market on Hong Kong are much larger in relative terms under the PARIS scenario than under the IPCC scenario. This aspect may be another reason to pay attention to Hong Kong's participation in the national ETS, as the PARIS scenario represents the current official mitigation targets while the IPCC scenario sets more stringent but less realistic policy goals given the magnitude of their shock to the economy. Given the imbalance in the benefits from an integrated carbon market, making the idea happen requires Hong Kong to play a more active role in lobbying for carbon market integration. It is in Hong Kong's interest, more than the Mainland's, to convince national policy makers of the economic and environmental rationale of extending China's proposed national ETS initiative to include Hong Kong.
Data Availability Statement
The data analyzed in this study is subject to the following licenses/restrictions: The basic social accounting matrix for the CGE model is built on a commercial data set (GTAP9). Requests to access these datasets should be directed to https://www.gtap.agecon.purdue.edu/databases/default.asp.
Author Contributions
KN conceived, designed, and led the research. YW and NW collected data, programmed the model, and conducted analysis. KN, YW, and CW wrote the paper and contributed to the interpretation of the findings. All authors contributed to the article and approved the submitted version.
Funding
This study was supported by the Hong Kong University (HKU) Seed Fund for Basic Research (201811159101) and the HKU Faculty of Architecture internal research grant.
Conflict of Interest
The authors declare that the research was conducted in the absence of any commercial or financial relationships that could be construed as a potential conflict of interest.
Supplementary Material
The Supplementary Material for this article can be found online at: https://www.frontiersin.org/articles/10.3389/fenvs.2020.599231/full#supplementary-material
Footnotes
1. ^We provide further methodological details in the Appendix section.
2. ^A recursive dynamic model assumes “myopic” expectation, where economic agents optimize their decisions in each year for that particular year only, in contrast to a forward-looking dynamic model assuming foresights into the future (Babiker et al., 2009).
3. ^Throughout this study, we use the constant 2011 US dollar unless otherwise indicated.
References
Aguiar, A., Narayanan, B., and McDougall, R. (2016). An overview of the GTAP 9 data base. J. Glob. Econ. Anal. 1, 181–208. doi: 10.21642/JGEA.010103AF
Babiker, M., Gurgel, A., Paltsev, S., and Reilly, J. (2009) Forward-looking versus recursive-dynamic modeling in climate policy analysis: a comparison. Econ. Model. 26, 1341–1354. doi: 10.1016/j.econmod.2009.06.009
Bi, H., Xiao, H., and Sun, K. (2019). The impact of carbon market and carbon tax on green growth pathway in China: a dynamic CGE model approach. Emerg. Mark. Finance Trade. 55, 1312–1325. doi: 10.1080/1540496X.2018.1505609
Burniaux, J.-M., Château, J., Dellink, R., Duval, R., and Jamet, S. (2009). The Economics of Climate Change Mitigation: How to Build the Necessary Global Action in a Cost-Effective Manner. Paris: Organisation for Economic Cooperation and Development.
Cao, J., Ho, M. S., Jorgenson, D. W., and Nielsen, C. P. (2019). China's emissions trading system and an ETS-carbon tax hybrid. Energy Econ. 81, 741–753. doi: 10.1016/j.eneco.2019.04.029
Carl, J., and Fedor, D. (2016). Tracking global carbon revenues: a survey of carbon taxes versus cap-and-trade in the real world. Energy Policy 96:23. doi: 10.1016/j.enpol.2016.05.023
Center for Earth System Science Tsinghua University. (2020). Multi-Resolution Emissions Inventory for China (MEIC) Version 1.3. Available online at: http://meicmodel.org/cloud/job/emissionsheet0 (accessed August 1, 2020).
Central Policy Unit (2017). A Study on Emissions Trading in the Mainland: Options for Hong Kong. Hong Kong: Hong Kong Productivity Council.
Chen, H., Paltsev, S., Reilly, J., Morris, J., Karplus, V., Gurgel, A., et al. (2017). The MIT Economic Projection and Policy Analysis (EPPA) Model: Version 5. Cambridge, MA: MIT Joint Program on the Science and Policy of Global Change.
Chiang, Y. H., Li, J., Zhou, L., Wong, F. K. W., and Lam, P. T. I. (2015). The nexus among employment opportunities, life-cycle costs, and carbon emissions: a case study of sustainable building maintenance in Hong Kong. J. Cleaner Prod. 109, 326–335. doi: 10.1016/j.jclepro.2014.07.069
Dai, H., Xie, Y., Liu, J., and AMasui, T. (2018). Aligning renewable energy targets with carbon emissions trading to achieve China's INDCs: a general equilibrium assessment. Renew. Sust. Energ. Rev. 82, 4121–4131. doi: 10.1016/j.rser.2017.10.061
Dong, F., Dai, Y., Zhang, S., Zhang, X., and Long, R. (2019) Can a carbon emission trading scheme generate the porter effect? Evidence from pilot areas in China. Sci. Tot. Environ. 653, 565–577. doi: 10.1016/j.scitotenv.2018.10.395
Eden, A., Unger, C., Acworth, W., Wilkening, K., and Haug, C. (2018). Benefits of Emissions Trading-Taking Stock of the Impacts of Emissions Trading Systems Worldwide. Available online at: https://icapcarbonaction.com/en/?option=com_attach&task=download&id=575 (accessed July 10, 2020).
Electrical and Mechanical Services Department (2019). Hong Kong, SAR. Hong Kong Energy End-Use Data 2019. Hong Kong: EMSD.
Environment Bureau Hong Kong SAR. (2017). Hong Kong's Climate Action Plan 2030+. Available online at: https://www.enb.gov.hk/sites/default/files/pdf/ClimateActionPlanEng.pdf (accessed July 10, 2020).
Environment Bureau Hong Kong SAR. (2020). Climate Change and Carbon Emissions in Hong Kong. https://www.legco.gov.hk/research-publications/english/1920issh20-climate-change-and-carbon-emissions-in-hong-kong-20200302-e.pdf (accessed August 17, 2020).
Fan, Y., Wu, J., Xia, Y., and Liu, J. (2016). How will a nationwide carbon market affect regional economies and efficiency of CO2 emission reduction in China? China Econ. Rev. 38, 151–166. doi: 10.1016/j.chieco.2015.12.011
Guangdong Provincial Environmental Monitoring Centre Environmental Protection Department, Environmental Protection Bureau, and Meteorological and Geophysical Bureau. (2019). Guangdong-Hong Kong-Macao Pearl River Delta Regional Air Quality Monitoring Network: A Report of Monitoring Results in 2018. Hong Kong: Environmental Protection Department, Government of the Hong Kong SAR.
Hong Kong Productivity Council (2020). Cleaner Production Partnership Programme. Available online at: https://www.cleanerproduction.hk/ (accessed August 01, 2020).
Huang, R., Lv, G., Chen, M., and Zhu, Z. (2019). CO2 emissions embodied in trade: evidence for Hong Kong, SAR. J. Clean. Prod. 239:117918. doi: 10.1016/j.jclepro.2019.117918
ICAP (2020). China National ETS. Available online at: https://icapcarbonaction.com/en/?option=com_etsmap&task=export&format=pdf&layout=list&systems%5B%5D=55 (accessed July 10, 2020).
Intergovernmental Panel on Climate Change. (2018). Global Warming of 1.5°C. Available online at: https://www.ipcc.ch/site/assets/uploads/sites/2/2019/06/SR15_Full_Report_High_Res.pdf (accessed August 1, 2020).
International Energy Agency (2020). Data and Statistics. Available online at: https://www.iea.org/data-and-statistics (accessed August 1, 2020).
International Institute for Applied Systems Analysis (2018). Greenhouse Gas and Air Pollution Interactions and Synergies (GAINS) for East Asia. Available online at: https://gains.iiasa.ac.at/gains/EAN/index.login?logout=1&switch_version=v0 (accessed July 09, 2020).
International Monetary Fund (2020). Hong Kong's Economy at a Glance. Available online at: https://www.imf.org/en/Countries/HKG (accessed July 03, 2020).
Jacoby, H. D., and Ellerman, A. D. (2004). The safety valve and climate policy. Energy Policy 32, 481–491. doi: 10.1016/S0301-4215(03)00150-2
Legislative Council Hong Kong SAR. (2014). Executive Summary FC47/13-14. Available online at: https://www.legco.gov.hk/yr13-14/english/fc/fc/papers/fcfc-47-e.pdf (accessed July 04, 2020).
Legislative Council Hong Kong SAR. (2018). Cap. 311 Air Pollution Control Ordinance. Available online at: https://www.elegislation.gov.hk/hk/cap311!en?p2=1&p5=1 (accessed July 04, 2020).
Leung, D. Y. C., Yung, D., Ng, A., Leung, M. K. H., and Chan, A. (2009). An overview of emissions trading and its prospects in Hong Kong. Environ. Sci. Policy12, 92–101. doi: 10.1016/j.envsci.2008.09.002
Lin, B., and Jia, Z. (2019). What will China's carbon emission trading market affect with only electricity sector involvement? A CGE based study. Energy Econ. 78, 301–311. doi: 10.1016/j.eneco.2018.11.030
Lo, A. Y., and Francesch-Huidobro, M. (2017). Governing climate change in Hong Kong: prospects for market mechanisms in the context of emissions trading in China. Asia Pac. Viewp. 58, 379–387. doi: 10.1111/apv.12166
Ma, X., Wang, H., and Wei, W. (2019). The role of emissions trading mechanisms and technological progress in achieving China's regional clean air target: a CGE analysis. Appl. Econ. 51, 155–169. doi: 10.1080/00036846.2018.1494807
Nam, K.-M. (2020). “Environmental challenges in Chinese mega-city regions: Focusing on air quality management,” in Mega-City Region Development in China, eds. A. G. O. Yeh, G. C. S. Lin, and F. F. Yang (Abingdon: Routledge Press), 204–225. doi: 10.4324/9780429264511-13
Nam, K.-M., Waugh, C. J., Paltsev, S., Reilly, J. M., and Karplus, V. J. (2013). Climate co-benefits of tighter SO2 and NOx regulations in China. Glob. Environ. Change. 23, 1648–1661. doi: 10.1016/j.gloenvcha.2013.09.003
Nam, K.-M., Waugh, C. J., Paltsev, S., Reilly, J. M., and Karplus, V. J. (2014). Synergy between pollution control and climate policy: comparing China and the United States. Energy Econ. 46, 186–201. doi: 10.1016/j.eneco.2014.08.013
Nam, K.-M., Zhang, X., Zhong, M., Saikawa, E., and Zhang, X. (2019). Health effects of ozone and particulate matter pollution in China: a province-level CGE analysis. Ann. Reg. Sci. 63, 269–293. doi: 10.1007/s00168-019-00924-z
Pang, J., and Timilsina, G. (2019). Implications for Provincial Economies of Meeting China's NDC Through an Emission Trading Scheme - A Regional CGE Modeling Analysis. Available online at: https://papers.ssrn.com/sol3/papers.cfm?abstract_id=3430520 (accessed July 05, 2020).
Peters, J. C. (2016). The GTAP-power data base: disaggregating the electricity sector in the GTAP data base. J. Glob. Econ. Anal. 1, 209–250. doi: 10.21642/JGEA.010104AF
Rutherford, T. F. (1995). Extension of GAMS for complementarity problems arising in applied economic analysis. J. Econ. Dyn. Control 19, 1299–1324. doi: 10.1016/0165-1889(94)00831-2
Springer, C., Evans, S., Lin, J., and Roland-Holst, D. (2019). Low carbon growth in China: the role of emissions trading in a transitioning economy. Appl. Energy 235, 1118–1125. doi: 10.1016/j.apenergy.2018.11.046
Wang, X., and Zhou, Y. (2016). “Forecasting China's economic growth by 2020 and 2030,” in China's New Sources of Economic Growth: Reform, Resources and Climate Change, eds. L. Song, R. Garnaut, C. Fang and L. Johnston (Canberra, Australia: ANU Press), 65–87.
Wen, Y., Hu, P., Li, J., Liu, Q., Shi, L., and Ewing, J. (2020) Does China's carbon emissions trading scheme really work? A case study of the hubei pilot. J. Cleaner Prod. 277:124151. doi: 10.1016/j.jclepro.2020.124151.
World Bank (2020). World Development Indicators. Available online at: https://databank.worldbank.org/source/world-development-indicators (accessed August 1, 2020).
Wu, R., Dai, H., Geng, Y., Xie, Y., Masui, T., and Tian, X. (2016). Achieving China's INDC through carbon cap-and-trade: insights from Shanghai. Appl. Energy. 184, 1114–1122. doi: 10.1016/j.apenergy.2016.06.011
Yam, R. C. M., and Leung, W. H. (2013). Emissions trading in Hong Kong and the Pearl river delta region-a modeling approach to trade decisions in Hong Kong's electricity industry. Environ. Sci. Policy. 31, 1–12. doi: 10.1016/j.envsci.2013.03.010
Yan, Y., Zhang, X., Zhang, J., and Li, K. (2020) Emissions trading system (ETS) implementation its collaborative governance effects on air pollution: the China story. Energy Policy 138:111282. doi: 10.1016/j.enpol.2020.111282
Yu, Z., Geng, Y., Dai, H., Wu, R., Liu, Z., Tian, X., and Bleischwitz, R. (2018). A general equilibrium analysis on the impacts of regional and sectoral emission allowance allocation at carbon trading market. J. Clean. Prod. 192, 421–432. doi: 10.1016/j.jclepro.2018.05.006
Zhang, D., Rausch, S., Karplus, V. J., and Zhang, X. (2013). Quantifying regional economic impacts of CO2 intensity targets in China. Energy Econ. 40, 687–701. doi: 10.1016/j.eneco.2013.08.018
Zhang, X., Karplus, V. J., Qi, T., Zhang, D., and He, J. (2016). Carbon emissions in China: How far can new efforts bend the curve? Energy Econ. 54, 388–395. doi: 10.1016/j.eneco.2015.12.002
Keywords: emission trading scheme, climate change, China, Hong Kong, computable general equilibrium
Citation: Wang Y, Winchester N, Webster CJ and Nam K-M (2020) Impacts of China's Emissions Trading Scheme on the National and Hong Kong Economies: A Dynamic Computable General Equilibrium Analysis. Front. Environ. Sci. 8:599231. doi: 10.3389/fenvs.2020.599231
Received: 26 August 2020; Accepted: 30 November 2020;
Published: 22 December 2020.
Edited by:
Philippe Roudier, Agence française de développement (AFD), FranceCopyright © 2020 Wang, Winchester, Webster and Nam. This is an open-access article distributed under the terms of the Creative Commons Attribution License (CC BY). The use, distribution or reproduction in other forums is permitted, provided the original author(s) and the copyright owner(s) are credited and that the original publication in this journal is cited, in accordance with accepted academic practice. No use, distribution or reproduction is permitted which does not comply with these terms.
*Correspondence: Kyung-Min Nam, kmnam@hku.hk orcid.org/0000-0002-4579-4815