


Abstract
South Africa is mainly dominated by savanna and grasslands ecosystems which have been previously reported to be acidic and nutrient deficient, specifically with regard to phosphorus (P) and nitrogen (N). Mucuna pruriens (L.) DC, commonly known as velvet bean, is an indigenous legume in most African countries and has been reported to withstand these adverse soil conditions. The legume is used in many countries of the world for their medicinal value as well as for soil fertilization purposes. Although there are reports on M. pruriens growth and establishment in nutrient stressed ecosystems, no investigation has been conducted on M. pruriens symbiotic interactions, N source preference and associated growth carbon costs when subjected to P deficiency. In this study, we determined the impact of microbial symbionts on N nutrition and growth carbon costs of M. pruriens under P deficiency.
Microbe inoculation soils were collected from four geographical distinct KwaZulu-Natal locations. Thereafter, seeds were germinated in these natural soils and in early stages of nodule development, then seedlings were transferred in sterile quartz sand and supplied with Long Ashton nutrient media with varying P concentrations.
The 16S RNA sequence results revealed that M. pruriens was nodulated by Burkholderia sp., Paenibacillus sp. and Bacillus irrespective of P concentrations. Even though P deficiency resulted in decreased overall biomass/growth, the root biomass, nodule number and carbon costs increased. In addition, low P supplied saplings showed the highest arbuscular mycorrhiza fungi percentage root colonization. In M. pruriens, nitrogen derived from atmosphere had a positive correlation with P level and the saplings had a dual reliance on atmospheric derived N and soil derived N with increased reliance on soil N in low P supplied plants. Therefore, M. pruriens exhibited different morphological and microbial symbiosis when subjected to P deficiency.
摘要
南非主要以热带稀树草原和草原生态系统为主,这些生态系统具有酸性和营养缺乏的属性,特别是磷和氮素的缺乏。刺毛黎豆(Mucuna pruriens)是在大多数非洲国家广泛存在的一种本土豆科植物,该 植物可以抵御这些不利的土壤条件。豆科植物在世界上许多国家具有药用价值,也被用于土壤施肥。尽管已有文献记载了在营养胁迫生态系统中刺毛黎豆的生长和建植,但尚未对其在磷缺乏条件下的共生互作、氮源偏好和与生长相关的碳成本进行研究。在本研究中,我们确定了微生物共生体对磷缺乏条件下的刺毛黎豆氮营养和生长相关的碳成本的影响。我们从4个不同的地理位置采集微生物接种土壤,然后将种子在这些天然土壤中发芽,在根瘤发育的早期,将幼苗转移到无菌石英砂中,并提供不同磷 浓度的营养培养基。16S RNA序列结果显示,在不考虑磷浓度的情况下,Burkholderia sp., Paenibacillus sp.和Bacillus 均有分枝。尽管磷缺乏导致总生物量/生长下降,但根系生物量、根瘤数量和碳成本增加。低磷供给的幼树丛枝菌根真菌根系定殖率最高。刺毛黎豆中,大气中的氮与磷水平呈正相关关系,幼树对大气氮素和土壤氮素具有双重依赖,低磷植株对土壤氮素的依赖程度增加。因此,在磷缺乏的情况下,刺毛黎豆表现出不同的形态和微生物共生关系。
INTRODUCTION
South African savanna and grassland ecosystems are characterized by their high species richness and diversity alongside with an elevated level of endemism (Sankaran et al. 2004). These ecosystems may support a variety of vegetation, however vegetation development may be hindered due to these ecosystems acidic and nutrient-poor soil status, specifically with regard to phosphorus (P) and nitrogen (N) nutrients (Goldblatt and Manning 2000; Kuger 1983). Soil acidity, along with P and N deficiencies, has been previously reported to negatively affect plant development and functioning (Ward et al. 2011). Soil acidity solely represents a major threat to sustainable agriculture (Wortman and Lovell 2014). This becomes a problem since been estimated that over 40% of the world’s arable soil is classified as acidic (Robinson et al. 2012). Most acidic soils are abundant in cations such as iron (Fe+) and aluminium (Al3+) which bind with P, resulting to insoluble P forms that cannot be assimilated by plants (Robinson et al. 2012). For instance, the Cape fynbos soils have been reported to contain 58%–77% soil P, however this P is inaccessible to plants as it is bound by cations (Goldblatt and Manning 2000; Kuger 1983). The same can be said for other Mediterranean-type ecosystems (Sumner et al. 1986; Tang et al. 2003).
P is a vital element for plant growth. In particular, legumes tend to require more than two-thirds of P additionally compared with non-legume species (Liu et al. 2018). Legumes high P requirement are related to the biological N2 fixation (BNF) and it is the site where BNF takes place known as nodules, where this high amount of P is in demand (Aranjuelo et al. 2014). P in legumes contributes to the regulation of bioenergetic processes that are required for optimal BNF and growth (Le Roux et al. 2008). This process requires high P concentrations as ATP for sufficient nodulation, BNF and growth (Bohlool et al. 1992).
Legumes have evolved physiological and morphological adaptations to increase P assimilation and conservation, allowing them to thrive in P deficient soils (Valdés-López and Hernández 2008). Morphological alterations include modification of root growth by promoting lateral root growth, increasing root hairs and cluster root formation. These are means to increases root surface area to enhance soil P uptake (Lamont et al. 2015; Mitran et al. 2018). Physiological strategies include conserving and regulating P homeostasis to maintain BNF (Dinkelaker et al. 1995; Keerthisinghe et al. 1998; Magadlela et al. 2014, 2015, 2016; Neumann and Martinoia 2002; Watt and Evans 1999).
During P deficiency legumes reduce their participation in the reduction and uptake of atmospheric N2 and switch to soil N to reserve energy (Magadlela et al. 2016). In nutrient-poor ecosystems such as grassland and savanna ecosystems with variable plant mixtures, competition for nutrients may increase as plants rely on limited nutrient sources (Sankaran et al. 2004). It is well documented that legume plants can regulated their N:P ratio by allocating resources away from the acquisition of the available nutrient towards acquisition of the limited one to bring the supply of nutrients close to the plant’s demand (Maistry et al. 2014; Míguez-Montero et al. 2019). Bloom et al. (1985) proposed the multiple resource limitation, that assumes that the resource limitation of plant growth does not only depend on the most limiting resource at a time. This way, in the case of legumes, scarcity of P instead of N, would limit plant growth and hence, the plant should adjust its allocation of resources towards acquisition of P, resulting in N and P equally limiting plant growth (Maistry et al. 2014; Vitousek et al. 2010). Legumes have evolved to form symbiotic interactions with soil microbes for purposes of enhancing soil P assimilation. Among these microbes are arbuscular mycorrhiza (AM) fungi (Berruti et al. 2016). AM fungi-legume plant symbiosis contribute to increased assimilation efficiency and solubilization of soil P resulting in improved N2 fixation reducing competition for soil N (de Vries et al. 2012). The AM associated to the legume extends its hyphae from the plant into the neighbouring soil, promoting a network of mycelium that explores a volume of soil twice as much of what the plant would access without the AM partner (Raven and Edwards 2001; Smith and Read 2008). The key role of the AM is to bring nutrients, mainly phosphorus (P), to the plant from beyond the depletion area of the roots (Jansa et al. 2011; Kiers et al. 2011). In turn, the plant grants their microbial symbionts with around 20% of the carbon (C) fix in the photosynthesis (Kaschuk et al. 2009; Slavíková et al. 2016). In this process, plants might need to compensate for the C needs of their partners by increasing CO2 assimilation, or indirectly via the nutrients received from the enhanced root systems due to the hyphae (Kaschuk et al. 2009; Řezáčová et al. 2017).
Despite the fact all this knowledge on the functioning of the symbiosis, there are still aspects that are unknown. The trades off between legumes, rhizobia and AM fungus have been described in several studies (Larimer et al. 2014; Mortimer et al. 2008; van der Heijden et al. 2016). However, the interaction of the two symbionts may also reduce plant growth (Ballhorn et al. 2016; Mortimer et al. 2009) and the upregulations is still under investigation (Morcillo et al. 2019). Saia et al. (2014) described how the AM fungus enhanced BNF and total plant biomass when the plant was drought stressed, but not under sufficient water supply. Thus, there is a need for more empirical studies relating the interaction of the tripartite symbiosis in regards the nutrient availability in the soils.
The aim of this study was to assess the microbial complexity in four soils of KwaZulu-Natal and how they modulate plant performance of Mucuna pruriens. We evaluated the implication of soil microorganism under P deficiency. It was hypothesized that M. pruriens grown under low P availability, increases its general performance in the presence of soil bacteria they establish symbiosis with. In addition, low P availability modifies the sources of N used by the plant, shifting to the less energy consuming ones.
MATERIALS AND METHODS
Inoculum soil collection sites
Soil samples used for germination and plant microbe inoculations were obtained from four distinct geographic locations in KwaZulu-Natal province, South Africa, covering grassland and savannah ecosystems. The sites were Bergville (28°34′14″ S, 29°4′17″ E), Ashburton (29°38′55″ S, 30°26′42″ E), Izingolweni (30°43′32″ S, 30°6′10″ E) and Hluhluwe (28°0′58″ S, 32°12′4″ E). From each site, 10 soil samples were obtained at a depth of approximately 0–30 cm, 2 m apart. All soil samples were mixed as a compound sample to increase the soil microbial diversity and to obtain a better representation of the soil microbial composition. Samples were taken to the laboratory on the day and used immediately for plant growth.
Soil nutrient and AM fungi analysis
Five 50 g soil samples from each site were analysed for soil nutrition and chemistry at the KZN Department of Agriculture and Rural Development’s Analytical Services Unit Cedara, South Africa. AM fungal spore analysis for the soil samples (250–300 g) was conducted at the Mycoroot (Pty) Ltd., Rhodes University, South Africa. The method used for this analysis was the wet sieving and decanting technique which was followed by sucrose centrifugation and filtration. The spores were observed via a microscope (Smith and Dickson 1991).
As described by Matiwane et al. (2019), the geochemical and microbe analysis revealed that the KZN soils varied in macronutrient concentrations, relative acidity and microflora. Bergville soils had a significantly higher P concentration compared with the other soils, while soil N concentrations showed no significant differences between the soils (Supplementary Table S1). All the sites had acidic soils, with Bergville having the lowest pH and total cations (Supplementary Table S1). AM fungi spore count per 100 g of soil was relatively low in the four soils. The average spore count ranged between 5.20 and 15.80 per 100 g of soil (Supplementary Table S1).
Seed germination and growth conditions
Mucuna pruriens seeds were obtained from a commercial supplier, AGT foods Africa, Marji Mizuri Farm, Ingomankulu, KwaZulu-Natal, South Africa. The experiment was carried out at the University of KwaZulu-Natal Botanical Gardens, Pietermaritzburg campus, South Africa, greenhouse G12. The day and night time temperatures ranged from 30 to 35 °C and 12 to 14 °C, respectively. The daily average humidity was 75% and the irradiance was ca. 35% of full sunlight (415.6 µmol m−2 s−1).
Before germinating, seed were surface sterilized by immersion in sodium hypochlorite (3.5%) followed by 10 consecutive rinses in sterile water. Seed were germinated in planting 15 cm radius pots with the natural soils collected from the four distinct geographic locations in KwaZulu Natal. One single seedling was allowed to grow per pot. As the aim of the study was to analyse the complexity of the microbial communities in four soils of the KwaZulu-Natal region, and how those communities influence the plant performance under low levels of P, no uninoculated control treatments were established and plants inoculated with four soils were compared. Irrigation of M. pruriens seeds pre-germination took place daily and thereafter irrigation took place after every second or third day, depending on the environmental or ambient temperature. Pots were maintained at 50% soil field capacity, resembling the growing conditions of the species in spring in their natural habitats. Field capacity was estimated prior to the experiment by placing a saturated known amount of soil in a pot covered by thin plastic film that was allowed to drain overnight. After that, the soil was weighed. The same soil sample was oven-dried at 72 °C till constant weight. One hundred percent field capacity was estimated as the water held by the soil and subsequently calculated water held at 70% and 35% field capacity (Ogbaga et al. 2014). Four random tensiometers were placed in pots of each of the treatments to measure soil field capacity in the pots daily (Pérez-Fernández et al. 2019). Forty days after seed germination, seedlings were harvested and nodulated seedlings were transferred to sterile quartz sand in 19 cm diameter and 30 cm length pots, and allowed to grow for 120 days before final harvest.
The sterile sand transferred nodulated seedlings were irrigated once a week with Long Ashton nutrient solution (Hewitt 1966) and watered with distilled sterile H2O in between. Long Ashton nutrient solution contained MgSO4·7H2O, K2SO4, CaCl2·2H2O, NA2HPO4·12H2O, H3BO3, MnSO4·4H2O, ZnSO4·7H2O, CuSO4·5H2O, Na2MoO4·2H2O and NH4NO3. The NA2HPO4·12H2O was modified to 200 µmol L-1 as high P, 40 µmol L-1 as intermediate P and 0.1 µmol L-1 as low P. The low P concentrations were adjusted according to KwaZulu-Natal grassland and savannah ecosystems P nutrient previously analysed in each of the four soils used for the germination experiment. This experiment was a random block design experiment with 20 replicates per treatment.
Bacterial extraction and identification
This was done following the protocol by Rodrígues-Echeverria et al. (2003), where during final harvest (120 days) all fresh nodules regardless of weight or size were detached from roots of five saplings randomly chosen. Subsequently, the nodules were sterilized with 70% (v/v) ethanol for 30 s and further subjected to 3.5% (v/v) sodium hypochlorite solution for 3 min. Thereafter, the nodules were rinsed 10 times with distilled sterile water. Then stored in the fridge at 4 °C, in airtight vials that contained cotton wool and silica gel.
Nitrogen-fixing bacteria were isolated from the stored nodules and grown in sterile Petri dishes with yeast mannitol agar (YMA), incubated at 28 °C. A portion of the 16S rDNA gene was amplified for all the pure bacterial colonies through polymerase chain reaction (PCR) using these sets of primers: 27F (5′ AGA GTT TGA TCC TGG CTC AG 3′) and 1492R (5′ GGT TAC CTT GTT ACG ACT T3′). PCR cycle conditions consisted of initial denaturation at 94 °C for 5 min, 30 cycles of denaturation at 94 °C for 30 s, annealing at 55 °C for 30 s, extension at 72 °C for 2 min and a final elongation step of 72 °C for 10 min. The PCR reaction volumes (for a total of 25 µL) were 11 µL sterile distilled water, 12.5 µL TAKARA-EmeraldAmpGT PCR Master Mix (Separations, South Africa), 1 µL colony, 0.25 µL forward primer and 0.25 µL reverse primer. The results were viewed with gel electrophoresis (1% agarose gel using TAE buffer). The PCR products were sent for sequencing at the Central Analytical Facilities at Stellenbosch University, South Africa. The resulting sequences were edited and subjected to BLASTN searches for identification (National Center for Biotechnology Information, NCBI (https://www.ncbi.nlm.nih.gov).
N and P analysis
During final harvest (120 days) 10 M. pruriens saplings were separated into the different plant organs (leaves, stem, roots and nodules), thereafter oven-dried at 42 °C till constant weight. The dried plant material was ground to a fine powder using a pestle and mortar with liquid N. ‘Analysis of P, N and C concentrations as well as δ 15N were conducted on total plant material. Samples were sent at a commercial laboratory, and analyses were performed using inductively coupled plasma mass spectrometry (ICP-MS) and a LECO-nitrogen analyser (Central Analytical Facilities, Stellenbosch University, and the Archaeometry Department, University of Cape Town, both in South Africa).’
Growth calculations
Root:shoot ratio (R:S)
Root to shoot values were obtained from calculating the root dry weight per shoot dry weight of the plant (Ågren and Franklin 2003):
W is the dry weight of the plant.
The relative growth rate (RGR) was calculated according to Ågren and Franklin (2003):
W1 and W2 are the dry weights accumulated from the initial harvest to final harvest, respectively, and t is the time for plant growth (120 days)
Carbon construction cost (Cw)
Carbon cost was obtained from the formula used by Mortimer et al. (2005) which was derived from Peng et al. (1993) as follows:
where Cw is the tissues’ total carbon construction cost [mmol C g−1 dry weight (DW)], C is the total concentration of carbon (mmol C g−1), k is the reduction state of N substrate (for NH3 = −3) and N is the total organic nitrogen content of the tissue (g DW−1) as described by Williams et al. (1987). The numerical value 14 is the atomic mass of nitrogen, 180 is a conversion factor from moles to grams of glucose, the number of electrons in a glucose molecule i.e. available is 24, 0.89 is an estimate of growth efficiency (Williams et al. 1987) and the fraction 6000/180 is a constant conversion factor from g−1 DW to mmol C g−1 DW for glucose.
Specific N/P absorption rate (SNAR/SPAR)
Total N and P accumulated by the plant via the roots were used to calculate the SNAR (mg N g−1 root DW day−1) and SPAR (mg P g−1 root DW day−1):
L and M represent the total N and P contents in the plant, respectively. t is the duration of plant growth (120 days) and R is the root dry weight, as described in Nielsen et al. (2001).
Specific N/P utilization rate (SNUR/SPUR)
The overall N and P acquired by the plant during its growth period was used to calculate the SNUR (g DW mg−1 N day−1) and SPUR (g DW mg−1 P day−1), respectively:
W is the plant’s dry weight while L and M represent the total N and P contents in the plant, respectively. t is the duration of plant growth (120 days) (Nielsen et al. 2001)
Calculation of percentage N derived from the atmosphere (%NDFA)
%NDFA was calculated according to Shearer and Kohl (1986) as δ = 1000(Rsample/Rstandard), where R is the molar ratio of 15N and 14N of the samples and standards.
where β value represents the δ 15N natural abundance of the N derived from BNF of P. sativum, grown in a N-free culture. The β value of M. pruriens for this study was −2.58%.
AM fungi colonization
Five roots with intact nodules from each treatment were stored in glass vials containing 50% ethanol for AM fungi root colonization percentage analysis. This analysis was done according to the methods described by Smith and Dickson (1991), where roots with nodules were cleared with 10% (g/v) potassium hydroxide (KOH) and stained with lactoglycerol trypan blue. Microscopic evaluations of colonization structures and percentage colonization were performed using the modified gridline intersect method (Smith and Dickson 1991).
Statistical analysis
The effects of varying P concentrations (200, 40 and 0.1 µmol L-1) in M. pruriens P/N concentrations, specific P/N absorption rates, specific P/N utilization rates, N2 fixation, growth rates, biomass and AM fungi colonization were evaluated with a one-way analysis of variance (IBM SPSS Statistics 25). In cases where the data were not normally distributed, a Kruskal–Wallis test was performed and where the variances were not homogenous, a Welch test was performed along with a Tamhane T2 post hoc to determine differences within treatments. We also did a multiple correlation analysis of rhizobia quantity, rhizobia diversity and AMF colonization with all plant growth and nutrient indexes to illustrate the role of microorganisms in plant performance. Finally, we conducted a principal component analysis (PCA) to understand what variables have the strongest explanation power in defining plant growth.
RESULTS
Bacterial identification
The 16S ribosomal RNA gene partial sequence amplified from pure cultures revealed that M. pruriens housed bacterial species in the genera Burkholderia, Bacillus, Cohnella, Paenibacillus and Mycobacteria (Table 1). However, most of the sequences identified were from the genus Bacillus (Table 1). Different strains from the genus Burkholderia were observed in all soils irrespective of varying P concentration, while Bacillus cereus was observed in intermediate and low P grown plants (Table 1). Other Bacillus sp. namely B. megaterium and B. aryabhattai were also housed in nodules of intermediate and low P treated plants, while high P supplied saplings were nodulated by Paenibacillus sp. (Table 1). Also, low P supplied plant nodules housed bacteria from other genera such as Mycobacterium sp. and Cohnella sp. (Table 1). Paenibacillus and Mycobacterium were only observed in nodules from plants grown at high P.
16S ribosomal RNA gene partial sequence amplified from pure cultures in M. pruriens germinated in KZN grassland and savanna soils thereafter grown in sterile sand supplied with Long Ashton nutrient media adjusted to high, intermediate and low P
| Treatment | Taxonomic assignment | Similarity (%) | Accession no. |
|---|---|---|---|
| High P | Paenibacillus sp. | 86.32 | MH337963.1 |
| Paenibacillus sp | 89.73 | LT223571.1 | |
| Mycobacterium sp. | 98.72 | MK875943.1 | |
| Burkholderia sp. | 85.23 | MK373654.1 | |
| Intermediate P | Bacillus megaterium | 99.67 | CP032527.2 |
| Bacillus aryabhattai | 99.86 | MK519217.1 | |
| Burkholderia sp. | 72.37 | MF059197.1 | |
| Bacillus cereus | 100 | MK819982.1 | |
| Bacillus sp. | 99.86 | MH484245.1 | |
| Burkholderia terricola | 78.44 | FN423792.1 | |
| Bacillus cereus | 99.71 | MN328352.1 | |
| Low P | Cohnella plantaginis | 98.58 | MK302227.1 |
| Cohnella sp. | 99.15 | FN178399.1 | |
| Burkholderia paludism | 84.07 | MK696579.1 | |
| Bacillus cereus | 99.71 | MN328352.1 |
Biomass production
High and intermediate P plants showed a significantly higher total biomass than plants grown under low P (F = 3.605, df = 14, P < 0.05) (Table 2). P deficient plants showed an increased root dry weight compared with high P plants (F = 6.266, df = 14, P < 0.05) (Table 2). The nodule dry weight was higher in high P plants followed by nodule weight from intermediate P plants and; the significantly lowest weight was observed in low P plants (F = 4.494, df = 14, P < 0.05) (Table 2). Nodule number was significantly higher in high P plants compared with low P plants, and there were no significant differences between high and intermediate P plants (F = 5.517, df = 14, P < 0.05) (Table 2). Leaf dry weight was significantly higher in high P plants compared with the low P plants. However, no significant differences were detected between the leaves of the intermediate P plants and any of the others (F = 6.675, df = 14, P < 0.05) (Table 2). Stem dry weight was significantly higher in intermediate P plants and there were significant differences between high and low P plants (F = 4.759, df = 14, P < 0.05) (Table 2). No significant differences were detected in root:shoot ratio between intermediate and low P plants, with high P plants showing a significantly higher root:shoot ratio (F = 14.004, df = 14, P < 0.05) (Table 2). No differences in the RGR were observed among plants grown under any of the applied P treatments. However, C constructions costs were significantly higher in low P plants (Table 2).
Biomass and growth kinetics of 120-day-old M. pruriens saplings grown in high, intermediate and low P sterile sand
| High P | Intermediate P | Low P | |
|---|---|---|---|
| Dry weight (g) | |||
| Total plant biomass | 4.06 ± 0.49 b | 3.96 ± 0.37 ab | 2.82 ± 0.42 a |
| Belowground biomass | |||
| Root | 0.621 ± 0.05 b | 0.78 ± 0.06 ab | 0.91 ± 0.06 a |
| Nodules | 0.15 ± 0.015 b | 0.12 ± 0.007 ab | 0.092 ± 0.015a |
| Number of nodules | 10 ± 3 a | 22 ± 3 b | 16 ± 2 a |
| Aboveground biomass | |||
| Leaves | 2.37 ± 0.22 b | 2.03 ± 0.23 ab | 1.11 ± 0.30 a |
| Stem | 0.97 ± 0.102 a | 1.05 ± 0.08 b | 0.71 ± 0.05 a |
| Growth kinetics | |||
| Root:shoot ratio | 0.559 ± 0.09 a | 0.255 ± 0.01 b | 0.19 ± 0.02 b |
| RGR (g day−1) | 0.024 ± 0.00 a | 0.023 ± 0.00 a | 0.20 ± 0.00 a |
| Carbon (C) cost (mmol C g−1 DW) | 0.004 ± 0.00 a | 0.003 ± 0.00 a | 0.009 ± 0.00 b |
Values are expressed as means ± SE, n = 5. Different letters represent significant differences (*P < 0.05) based on Turkey’s or Bonferroni post hoc statistical analysis.
Nitrogen (N)
High P supplied plants had a higher N concentration followed by intermediate P supplied plants, low P supplied plants showed the lowest N concentration (Table 3). However, statistical differences in total plant N concentration were only observed between plants in the high P and those in the low P (F = 5.087, df = 14, P < 0.05). High P treated plants increased their reliance on atmospheric N, followed by intermediate P treated plants (Table 3) while low P treated plants relied more on soil N (Table 3). This is confirmed by increased biological nitrogen fixation expressed as %NDFA and 15N/14N in high P treated plants compared with low P treated plants (Table 3). There were no %NDFA significant differences statistically between high P plants and intermediate P plants (F = 2.54, df = 14, P < 0.05). The N utilization rates showed the same trend as %NDFA, where there were no significant differences between the high and intermediate plants while there was a reduction in low P plants (F = 16.570, df = 14, P < 0.05) (Table 3).
The N and P nutrition, of M. pruriens saplings grown in high P, intermediate P and low P soils
| High P | Intermediate P | Low P | |
|---|---|---|---|
| N nutrition | |||
| Total plant N (mmol N g−1) | 2.05 ± 0.041 b | 1.79 ± 0.14 ab | 1.61 ± 0.03 a |
| 15N/14N | 1.59 ± 0.05 c | 1.40 ± 0.08 b | 1.34 ± 0.09 a |
| Soil N (mmol N g−1) | 0.27 ± 0.024 a | 0.39 ± 0.05 b | 0.45 ± 0.04 c |
| SNAR (mg N g−1 root DW day−1) | 0.147 ± 0.004 a | 0.212 ± 0.019 b | 0.009 ± 0.002 c |
| SNUR (mg N g−1 DW day−1) | 0.009 ± 0.00 a | 0.011 ± 0.001 b | 0.036 ± 0.001 c |
| %NDFA | 83.17 ± 1.74 b | 78.69 ± 1.62 b | 77.76 ± 2.06 a |
| BNF efficiency (mmol N g−1) | 0.85 ± 0.02 c | 0.66 ± 0.01 b | 0.57 ± 0.01 a |
| P nutrition | |||
| Total plant P (µmol P g−1) | 61.36 ± 3.21 b | 50.19 ± 5.10 ab | 42.71 ± 4.34 a |
| SPAR (mg P g−1 root DW day−1) | 5.06 ± 0.77 a | 5.05 ± 0.72 a | 3.68 ± 0.28 a |
| SPUR (mg P g−1 DW day−1) | 0.00 ± 1.44 b | 0.00 ± 1.81 ab | 0.004 ± 1.88 a |
Values are expressed as means ± SE, n = 5. Different letters represent significant differences (*P < 0.05) based on Turkey’s or Bonferroni post hoc statistical analysis.
Phosphorus (P)
High P plants had a significantly higher P concentration than low P plants. No significant differences were observed between P concentration in intermediate P plants and any of the others (F = 4.785, df = 14, P < 0.05) (Table 3). There were significant differences in P utilization rates between high P and low P treatments (F = 15.984, df = 14, P < 0.05) (Table 3). While, no statistical differences were observed between high P and intermediate treatment. No significant differences were observed in P assimilation rates between all treatments (F = 1.583, df = 14, P < 0.05) (Table 3).
Percentage AM fungi colonization
Low P supplied saplings showed the significantly highest AM fungi percentage root colonization (Fig. 1). This was followed by intermediate P supplied saplings, for which no significant differences were observed with high P supplied saplings (F = 6.121, df = 2, P < 0.05) (Fig. 1). The multiple correlation analyses (Supplementary Table S2) between AM colonization and plant variables did only show positive significance for the variables treatment and root and nodules. The root size and the number of nodules showed a negative significant correlation as well as total biomass and relative growth cost and carbon cost with stem biomass (Table 3).
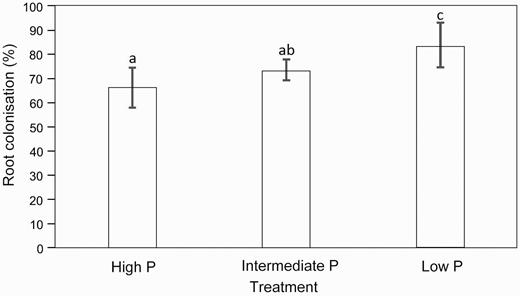
AM fungi colonization percentage of 120-day-old M. pruriens saplings grown in high P, intermediate P and low P soils. Values are expressed as mean ± SE, n = 5. Different letters represent significant differences (*P < 0.05) based on Turkey’s or Bonferroni post hoc statistical analysis.
The soil N content also showed negative significant correlation with BNF efficiency and total plant P concentration as well as between SNUR and SPAR. Positive significant correlations were detected between total plant N and total plant P as well as between SNUR and SPUR.
The principal components analysis
The results from the PCA provided evidence that the different P treatments had a contrasting effect on the analysed plant variables (Fig. 2). The contribution of the first and second principal components explained 100% (first component: 86.3 %; second component: 13.7%) of the total variance. The high P application was associated with the %NDFA, the BNF efficiency, total plant N and total plant P. The intermediate P application showed a positive correlation with SPAR and SNAR, while a strong positive correlation was observed between SPUR and SNUR in the low P treatment plant. Also, the AM root colonization direction depicted a negative relationship with SPUR and SNUR in the low P treatment plant. Conversely, the detrended direction of the soil N content from the central axis plotting represented its unrelatedness with the different P treatments and other variables assessed.
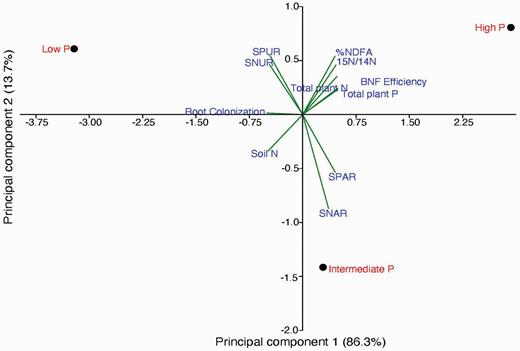
The PCA of N nutrition, P nutrition and root colonization of M. pruriens saplings grown in high P, intermediate P and low P soils.
DISCUSSION
This study revealed that M. pruriens established symbiosis with bacteria namely Burkholderia sp. irrespective of the P variation. However, we observed that plants under the high P concentration were nodulated exclusively by members in the Paenibacillus and Mycobacterium genera. Bacteria in the genera Cohnella were only found in plants under the low P concentration. Paenibacillus is usually found in growing media with high concentrations of N and P, what let the microorganisms to produce their characteristic cover of exopolysaccharides (Sutherland 1985). Both Paenibacillus and Mycobacterium are known for their acid resistance and good P solubilizers (Johansson et al. 2004), being more active when phosphorus is highly available, thus reinforcing the explanation of why they are more abundant under high levels of P. Bacteria in the genus Cohnella have been described in legumes growing in very poor soils, where the bacteria can fix N endophytically (Flores-Félix et al. 2014). The presence of bacteria of this genus only in plants under the lowest concentration of P, can be taken as an indicative of the plant’s need to develop any strategy to make up for the lack of nutrients. Thus, the plant sanctions for those bacteria that can aid to acquire nutrients.
Our results indicate that the levels of P in the growing media of M. pruriens modulate the bacteria they interact with. In addition, P levels seem to regulate the functioning of the symbionts. In fact, there were differences in %NDFA of M. pruriens that are nodulated by different bacterial strains and between high P and low P treatments. P deficient plants showed the lowest %NDFA, however these low P plants changed their N preference to mostly soil N. These results concur with a previous study which indicate that M. pruriens growing in nutrient-poor soils relied more on soil N to reserve energy required during BNF (Aranjuelo et al. 2014). Similarly, other legumes from Mediterranean-type ecosystems show similar patterns of N use under varying concentrations of P (Magadlela et al. 2016). P deficiency can limit bioenergetic processes affecting plant development and functions, especially legume plants as they require P as ATP during dinitrogen (N2) fixation (Le Roux et al. 2008; Rychter et al. 1992; Theodorou and Plaxton 1993). Legume plants grown in high P treatment had a higher %NDFA. Aranjuelo et al. (2014) mentioned that P is the main factor that contributes to nodulation and BNF. This is shown by the P concentrations and specific P assimilation rates between the P treatment, where they were higher in high and intermediate P supplied plants compared with low P supplied plants.
Although the plants were exposed to different P levels there was no change in RGR, which could have contributed to the increased carbon cost in the low P plants. As low P plants relied on both soil and atmospheric derived N, this might have increased the demand for carbon increasing the C costs, also to provide symbionts with their energetic needs. Bacteria consume carbon as organic acids during symbiosis and nitrogen fixation (Bontemps et al. 2010; Vandamme et al. 2002). The high carbon cost in low P treatment may be explained by less total plant biomass.
Mucuna pruriens appear to adapt to different P availability by increasing its root biomass and the number of nodules. These results may show that the increase root biomass may have resulted to increased root surface area enabling these plants to efficiently assimilate available soil nutrients and efficiently fix atmospheric N2 (Neumann and Martinoia 2002). Previous studies have reported that in nutrient deficiency soils, legumes develop growth adaptations to enhance nutrient uptake, these include changes in root architecture, which leads to increased root biomass to increased surface area to enhance nutrient acquisition (Thuynsma et al. 2014). Additionally, legume plants growing under P-stress soil conditions have been reported to allocate its resources to the belowground organs to increase the surface area maximizing nutrient assimilation rates for plant optimum growth (Sanginga et al. 2000). Also, the high percentage AM fungi root colonization in the low P supplied M. pruriens could have contributed to the P nutrient assimilation rates. Legumes have been reported to establish symbiotic interactions with soil microbes AM fungi (Berruti et al. 2016). This AM fungi symbiosis may contribute to increased assimilation efficiency and solubilization of soil P resulting in improved N2 fixation (de Vries et al. 2012). Our results are in line with those by Morcillo et al. (2019, 2020), who found that the symbiosis in Arabidopsis only takes place when the two partners grow under Pi deficiency. In this system, the symbionts provide the plant with phosphorus enhancing plant growth. On the other hand, when the two partners grow with sufficient Pi, the endophytic colonization is restricted by plant Tryptophan-derived secondary metabolites but not by phyto-hormone-mediated defence signalling. Although in the present study we have not analysed the particular hormone production by the plants under the three different levels of phosphorus in the growing sand, it is possible, in the light of Morcillo et al. (2019, 2020) and Zuccaro (2020) results, to presume that a similar kind of responses are expressed by M. pruriens. As in the case of Arabidopsis, in our study of M. pruriens plants respond differently to the presence of soil microorganisms being the amount of P in the soil what determines the direction of the interaction (Fig. 2). While plants with sufficient P enhance their BNF and accumulate more N and P in their tissues, those under low P maximize their uses of N and P. Actually, the P deficiency makes the plants to increase in nodule numbers thus increasing the efficiency of this legume to fix atmospheric N, this might have resulted in the legume maintaining its RGRs. It is likely that Pi-deficient plants allow symbiosis with both N-fixing bacteria and fungi because endophytic microorganisms can transfer phosphate to plants and favour the acquisition of N. However Pi-sufficient plants need the aid of the fungi in nutrients uptake, as seen by the reduced percent of colonization in plants with high levels of P in our study (Fig. 1). Following the same reasoning, as rhizobacteria do not transfer phosphorus to the plants, plants sanction for bacteria under high levels of phosphorus and avoid the competition with bacteria for this nutrient, when P is limited.
In further studies, it will be interesting to prove whether or not exudates like Tryptophan-derived secondary metabolites act in the same way as they do in Arabidopsis (Hiruma et al. 2016; Morcillo et al. 2020; Zuccaro 2020) inducing resistance or immunity against bacteria when phosphorus is limited in the soil.
CONCLUSIONS
Therefore, M. pruriens can adapt and grow in P limited soils by establishing symbiosis with multiple bacterial genera and AM fungi, allocating its resources to the belowground biomass to increase surface area and utilize soil N during P deficiency than atmospheric derived N. Plants sanction for symbionts based on the amount of nutrients in the soils, favouring those bacteria that help the plant to meet their needs. Therefore, it can be recommended that KZN regions farmers in grassland and savanna P poor ecosystems can use M. pruriens as a green manure crop.
Supplementary Material
Supplementary material is available at Journal of Plant Ecology online.
Table S1: Soil phosphorus and nitrogen concentrations, total cations, pH and arbuscular mycorrhizal (AM) fungi spore count determined in soils collected from four sites in KwaZulu-Natal.
Table S2: Correlation between biomass, growth kinetics and AM root colonization of 120-day-old M. pruriens saplings grown in high, intermediate and low P sterile sand.
Funding
This research was supported by the National Research Foundation, South Africa (NRF grant no. UID 113576).
Acknowledgements
We thank the Central Analytical Facilities at Stellenbosch University and the Archeometry Department at the University of Cape Town for their research facilities.
Conflict of interest statement. The authors declare that they have no conflict of interest.
Authors’ Contributions
Anathi Magadlela, Nokhetho Makhaye and María Pérez-Fernández contributed equally to this work.


