
Abstract
Much research on foreign aid presents claims that apply to aid in general but tests these claims using data from one or a small number of donors. This makes it difficult to know if we have learned something about aid, or merely something about one donor. For example, the literature on project aid success has found that per capita GDP growth rates or Freedom House scores in recipient countries correlate with project success. However, these claims have been tested against data from only multilateral donors and often against data from only the World Bank. I re-examine these analyses using a dataset of harmonized project outcome scores for seven diverse donors. Most donors seem to be similarly influenced by recipient-level and project-level factors, though a few notable exceptions exist. Analyses of project aid success that focus on single donors may be able to produce knowledge about aid in general.


Notes
If country-year data suffice then the OECD DAC database has reasonable coverage for their members for many aid flows.
As noted by Neumayer (2003, p. 102) in a discussion of bilateral aid, “there is little doubt that economic, political, and sometimes military-strategic interests of donors play a significant and sometimes dominating role for practically all donors.” For further discussion, see Briggs (2017, p. 189).
The sector fixed effects use the OECD-DAC’s 5-digit purpose classification codes. This means that sectors specify something precise like ‘Tuberculosis control’ rather than the more aggregated ‘Basic health.’ The results are very similar if I use the cruder 3-digit codes for the fixed effects.
The dataset includes 8 donors, but the UK’s DFID lacks information on start and end dates and so I ignore it here. The first year in the database in which a project was started is 1956 and the last year is 2012, but the data are densest between 1975–2005.
Japan’s lack of poverty sensitivity is partially due to the fact that “Japanese aid is concentrated on (relatively advanced) Asian neighbours” (Nunnenkamp and Thiele 2006, p. 1191).
One may worry that project outcome ratings are biased by, for example, political factors. Kilby and Michaelowa (2016) examine WB project outcome ratings for bias and find that most geopolitical variables do not seem to cause bias in IEG ratings. Only non-permanent membership in the UN Security Council seems to influence IEG ratings.
For more information, see Honig (2018, p. 58–68) and Honig (2019). Section two of Bulman et al. (2017) also has a useful discussion of the potential challenges when comparing outcome scores across different donors. Every time that I make cross-donor comparisons I normalize the data by donor (through the addition of donor fixed effects, for example).
Past work also used (private) WB CPIA scores as a measure of the institutional environment of a recipient country (Denizer et al. 2013; Bulman et al. 2017). Publicly available data on CPIA scores runs from 2005 to 2016, and only 7% of the projects in the PPD start on or after 2005. For this reason, I do not examine the relationship between CPIA scores and project outcomes.
I drop GiZ and IFAD from this analysis as both donors have very few projects and so I expect them to produce very unreliable results.
The dataset runs from 1956 to 2012, so starting on years that end in five creates a better spread of projects over decadal periods than starting on years that end in zero.
The results are quite similar if I use five year periods instead of ten year periods.
I report scatter plots of some of the correlations in the online appendix.
Note that in calculating the Pearson correlation coefficients the data are demeaned by donor. Thus, I am never making a comparison between absolute levels of projects success scores across donors. This is important as different donors very likely have different baseline levels of project success ratings.
The p-values are shown to two significant digits.
Fig. 2 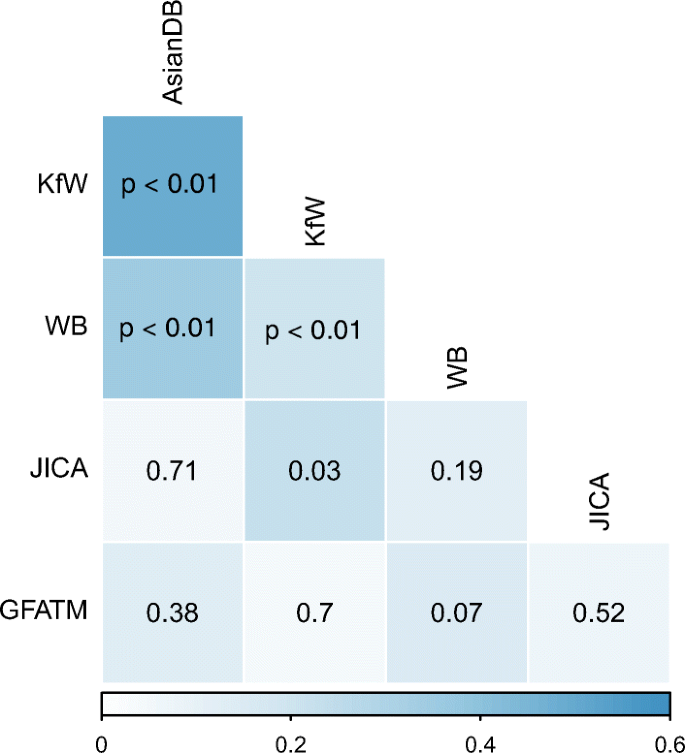
Cross-donor correlations between project success per recipient-period (numbers in cells are p values testing zero correlation)
Clustering on periods and sectors generally produced similar standard errors. Clustering on (the small number of) donors produced smaller standard errors. Thus, clustering on recipients seems conservative.
More precisely, the AsianDB is the base term in the interaction, so its estimate in Fig. 3 is β. The interaction terms (each donor’s γ) then are added to β to show effect for each donor.
Fig. 3 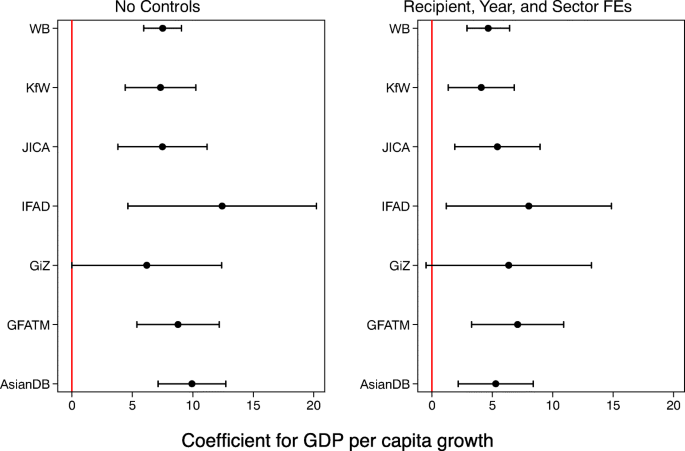
Relationship between GDP per capita growth and project success
Their coefficient comes from Table 3, Panel B, Model 6. They add a series of sector fixed effects and some related interactions, but they notably do not add country fixed effects as I do in the right pane of Fig. 3.
If I add the fixed effects sequentially, the point estimates all move toward zero when the recipient country fixed effects are added. The year and sector fixed effects do very little in this case.
In the limiting case, if each recipient receives one project then the recipient dummies will explain 100% of the variation in project outcomes. This issue is noted in footnote 5 of Bulman et al. (2017) and they respond to it by dropping some of their data.
It is important not to read this result in causal terms, as sample selection is a major issue. Given that a donor is active in a country, local conditions appear to not explain much of the variation in outcomes across its projects. Of course, donors may choose not to operate in places with particularly bad conditions because of the causal effect of those conditions on outcomes.
There does not appear to be much sector-level heterogeneity in the relationship between project duration and outcome scores. For evidence supporting this claim, see the appendix.
This discussion brackets research on the effects of aid and instead focuses on aid as a dependent variable. Informally, there seems to be more heterogeneity in the effects of aid on various outcomes than there is on the effects of various factors on aid.
For an extended discussion of how these bargains work themselves out in practice, see Swedlund (2017b).
The names of people in TTL-equivalent roles could be use to test the degree to which variation in outcomes is associated with fixed features of team leaders (Denizer et al. 2013).


References
Brazys, S., Elkink, J.A., Kelly, G. (2017). Bad neighbors? How co-located Chinese and World Bank development projects impact local corruption in Tanzania. The Review of International Organizations, 12(2), 227–253.
Briggs, R.C. (2014). Aiding and abetting: Project aid and ethnic politics in Kenya. World Development, 64, 194–205.
Briggs, R.C. (2017). Does foreign aid target the poorest? International Organization, 71(1), 187–206.
Briggs, R.C. (2018a). Leaving no one behind? a new test of subnational aid targeting. Journal of International Development, 30(5), 904–910.
Briggs, R.C. (2018b). Poor targeting: A gridded spatial analysis of the degree to which aid reaches the poor in Africa. World Development, 103, 133–148.
Bulman, D., Kolkma, W., Kraay, A. (2017). Good countries or good projects? Comparing macro and micro correlates of World Bank and Asian Development Bank project performance. The Review of International Organizations, 12(3), 335–363.
Canavire, G., Nunnenkamp, P., Thiele, R., Triveno, L. (2006). Assessing the allocation of aid: Developmental concerns and the self-interest of donors. The Indian Economic Journal, 54(1), 26–51.
Custer, S., DiLorenzo, M., Masaki, T., Sethi, T., Wells, J. (2017). Beyond the tyranny of averages: Development progress from the bottom up. AidData Policy Report.
Denizer, C., Kaufmann, D., Kraay, A. (2013). Good countries or good projects? macro and micro correlates of World Bank project performance. Journal of Development Economics, 105, 288–302.
Dietrich, S. (2016). Donor political economies and the pursuit of aid effectiveness. International Organization, 70(1), 65–102.
Dollar, D., & Levin, V. (2006). The increasing selectivity of foreign aid, 1984–2003. World Development, 34(12), 2034–2046.
Dollar, D., & Svensson, J. (2000). What explains the success or failure of structural adjustment programmes? The Economic Journal, 110(466), 894–917.
Dreher, A., Fuchs, A., Hodler, R., Parks, B.C., Raschky, P.A., Tierney, M.J. (2019). African leaders and the geography of China’s foreign assistance. Journal of Development Economics, 140, 44–71.
Graham, B.A., & Tucker, J.R. (2019). The international political economy data resource. The Review of International Organizations, 14(1), 149–161.
Honig, D. (2018). Navigation by judgment: Why and when top down management of foreign aid doesn’t work. Oxford University Press.
Honig, D. (2019). When reporting undermines performance: The costs of politically constrained organizational autonomy in foreign aid implementation. International Organization, 73(1), 171–201.
Isaksson, A. -S., & Kotsadam, A. (2018). Chinese aid and local corruption. Journal of Public Economics, 159, 146–159.
Isham, J., Kaufmann, D., Pritchett, L.H. (1997). Civil liberties, democracy, and the performance of government projects. The World Bank Economic Review, 11 (2), 219–242.
Jablonski, R. (2014). How aid targets votes: The impact of electoral incentives on foreign aid distribution. World Politics, 66(2), 293–330.
Kilby, C. (2013). The political economy of project preparation: An empirical analysis of World Bank projects. Journal of Development Economics, 105, 211–225.
Kilby, C. (2015). Assessing the impact of World Bank preparation on project outcomes. Journal of Development Economics, 115, 111–123.
Kilby, C., & Michaelowa, K. (2016). What influences World Bank project evaluations? Working Paper.
Maizels, A., & Nissanke, M.K. (1984). Motivations for aid to developing countries. World Development, 12(9), 879–900.
Neumayer, E. (2003). The Pattern of Aid Giving: The Impact of Good Governance on Development Assistance. London: Routledge.
Nielson, D.L., Parks, B., Tierney, M.J. (2017). International organizations and development finance: Introduction to the special issue. The Review of International Organizations, 12(2), 157–169.
Nunnenkamp, P., & Thiele, R. (2006). Targeting aid to the needy and deserving: Nothing but promises? The World Economy, 29(9), 1177–1201.
OECD DAC. (2019). QWIDS: Query Wizard for International Development Statistics: About. https://stats.oecd.org/qwids/.
Öhler, H., Negre Rossignoli, M., Smets, L., Massari, R., Bogetic, Z. (2019). Putting your money where your mouth is: geographic targeting of World Bank projects to the bottom 40 percent. PloS one, 14(6), e0218671.
Öhler, H., & Nunnenkamp, P. (2014). Needs-based targeting or favoritism? the regional allocation of multilateral aid within recipient countries. Kyklos, 67(3), 420–446.
Rodrik, D. (1995). Why is there multilateral lending? . In Bruno, M., & Pleskovic, B. (Eds.) Annual World Bank Conference on Development Economics (pp. 167–193). Washington: International Monetary Fund.
Swedlund, H.J. (2017a). Can foreign aid donors credibly threaten to suspend aid? Evidence from a cross-national survey of donor officials. Review of International Political Economy, 24(3), 454–496.
Swedlund, H.J. (2017b). The development dance: How donors and recipients negotiate the delivery of foreign aid. Cornell University Press.
Winters, M.S. (2014). Targeting, accountability and capture in development projects. International Studies Quarterly, 58(2), 393–404.
Author information
Authors and Affiliations
Corresponding author
Additional information
Publisher’s note
Springer Nature remains neutral with regard to jurisdictional claims in published maps and institutional affiliations.
I’d like to thank Aart Kraay for comments on an earlier draft and Dan Honig for sharing data and for comments.
Electronic supplementary material
Below is the link to the electronic supplementary material.
Rights and permissions
About this article

Cite this article
Briggs, R.C. Results from single-donor analyses of project aid success seem to generalize pretty well across donors. Rev Int Organ 15, 947–963 (2020). https://doi.org/10.1007/s11558-019-09365-x
Published:
Issue Date:
DOI: https://doi.org/10.1007/s11558-019-09365-x