


Eating behaviours develop early in life, beginning in utero, and may track throughout childhood(Reference Birch and Fisher1,Reference Mennella and Beauchamp2) . The Children’s Eating Behaviour Questionnaire (CEBQ) is a widely used parent-report psychometric measure of child eating behaviours, which assesses a variety of appetitive traits in population-based studies(Reference Wardle, Guthrie and Sanderson3). Some of these traits are related to the degree in which children respond to their internal satiety cues, being frequently categorised as ‘food avoidant behaviours’(Reference Webber, Hill and Saxton4–Reference Sleddens, Kremers and Thijs6) and are measured through subscales namely Food Fussiness, Slowness in Eating, Emotional Undereating and Satiety Responsiveness. Other traits, the ‘food approach behaviours’(Reference Webber, Hill and Saxton4–Reference Sleddens, Kremers and Thijs6), are related to the degree in which children respond to external eating cues and can be assessed through subscales such as Emotional Overeating, Desire to Drink, Enjoyment of Food and Food Responsiveness. This range of eating behaviours may arise during childhood(Reference Webber, Hill and Saxton4,Reference de Barse, Jansen and Edelson-Fries7,Reference Wood, Blissett and Brunstrom8) and have been widely associated with child food intake(Reference Albuquerque, Lopes and Durão9–Reference Russell and Worsley11) and weight(Reference Webber, Hill and Saxton4,Reference Santos, Ho-Urriola and González5,Reference Carnell and Wardle12) , which may compromise child’s future health. Evidence from different populations show a strong association between food approach behaviours, such as Food Responsiveness, Emotional Overeating and Enjoyment of Food and greater BMI in children in their first year of life(Reference Quah, Chan and Aris13,Reference van Jaarsveld, Llewellyn and Johnson14) and during preschool- and school-age years(Reference Viana, Sinde and Saxton15,Reference Eloranta, Lindi and Schwab16) .On the other hand, a negative association between food avoidant behaviours (mainly Slowness in Eating and Satiety Responsiveness) and BMI was found among children(Reference Quah, Chan and Aris13,Reference Viana, Sinde and Saxton15,Reference Eloranta, Lindi and Schwab16) . These traits may also lead to a poor diet quality in childhood and adolescence, as shown previously(Reference Birch and Fisher1,Reference Oliveira, Jones and de Lauzon-Guillain17,Reference Dovey, Staples and Gibson18) . A poor diet quality involves a lack or excess of food intake in general or of specific food groups, for example, high consumption of energy-dense foods (such as fatty and/or sugary foods and beverages) and low consumption of nutrient-dense foods (such as fruits and vegetables), leading to an unbalanced nutritional status and, for this reason, these eating behaviours might be a cause of concern(Reference Birch and Fisher1,Reference Quah, Chan and Aris13,Reference Dovey, Staples and Gibson18) .
Sugar-sweetened beverages (SSB) have been considered one of the dietary factors with greatest impact on childhood obesity(Reference Bucher Della Torre, Keller and Laure Depeyre19) and have been associated with an increased risk of dental caries and insulin resistance(Reference Bleich and Vercammen20), a positive energy balance(Reference Mattes21) and increased food intake(Reference Bennett, Totosy de Zepetnek and Brett22,Reference Poirier, Totosy de Zepetnek and Bennett23) . It also appears to play a key role in moderating fullness, responses possibly driven via ghrelin(Reference Shearrer, O’Reilly and Belcher24). Evidence suggests that if there is no compensation for energy provided in liquid forms, it can result in an increased total energy intake(Reference Mattes21,Reference Sweetman, Wardle and Cooke25) . However, long-term effects of SSB consumption are poorly studied(Reference Shearrer, O’Reilly and Belcher24), especially on eating behaviours.
Some cross-sectional studies showed that the consumption of SSB is positively associated with food approach behaviours and negatively associated with food avoidant behaviours(Reference Sweetman, Wardle and Cooke25,Reference Elfhag, Tynelius and Rasmussen26) . For instance, higher preferences and greater frequency of SSB consumption among English pre-schoolers were associated with higher scores on the Desire to Drink subscale, measured through the CEBQ, suggesting that this can be linked to the desire for sweet taste in the mouth and not simply a matter of thirst or hunger(Reference Sweetman, Wardle and Cooke25). Among Swedish 12-year-olds with higher response to internal satiety cues, a lower SSB consumption was found(Reference Elfhag, Tholin and Rasmussen27). In contrast, studies in Finland(Reference Jalkanen, Lindi and Schwab28) and the Netherlands(Reference Rodenburg, Kremers and Oenema29) did not find any relationship between SSB consumption and food approach appetitive traits, such as Food Responsiveness and Desire to Drink, among school-age children.
Research on the effect of SSB on appetitive traits is still scarce, especially using a prospective approach(Reference Rodenburg, Kremers and Oenema29). Knowledge from prospective studies may help to better understand how the consumption of SSB shapes child’s eating behaviours and influences weight and other health indicators later in life. Thus, this study aimed to investigate if the consumption of SSB early in childhood (at 4 years old) is prospectively associated with appetitive behaviours 3 years later (at 7 years old). First, we hypothesised that a higher consumption of SSB at 4 years old might be associated with higher scores of food approach behaviours (i.e. Enjoyment of Food, Food Responsiveness, Desire to Drink and Emotional Overeating) and higher ‘Appetite Disinhibition’ factor 3 years later, at age 7 years. In addition, we expected to find that higher SSB consumption at 4 years old would be associated with lower scores of food avoidant behaviours (i.e. Slowness in Eating, Satiety Responsiveness, Food Fussiness and Emotional Undereating) and lower ‘Appetite Restraint’ factor at age 7 years.
Methods
Study design and participants
This study included participants from the Generation XXI, a population-based birth cohort, described in detail elsewhere(Reference Larsen, Kamper-Jørgensen and Adamson30,Reference Alves, Correia and Barros31) . A total of 8495 women and their 8647 children were recruited from all public maternity units in the Porto Metropolitan Area (northern Portugal), between 2005 and 2006. These maternity units were responsible, at enrolment, for 91·6 % of the deliveries in the whole catchment population. Of the invited mothers, 91·4 % agreed to participate.
The second evaluation wave was between April 2009 and August 2011, when children were 4 years old, and 7459 children were evaluated (86 % participation rate). Between April 2012 and March 2014, 6882 children (80 % participation rate) participated in the third evaluation wave (at 7 years old). Only participants who had been on site, followed-up by face-to-face interviews, at 4 and 7 years (n 5137) were included in the present study. Participants who had no available data on the CEBQ at 7 years old (n 329), no data of SSB consumption from the FFQ at 4 years, nor data of variables of interest (n 731) were excluded. We also excluded participants with congenital malformations and twins (n 197). Overall, the final sample consisted of 3880 participants (see study’s flow chart in Fig. 1).
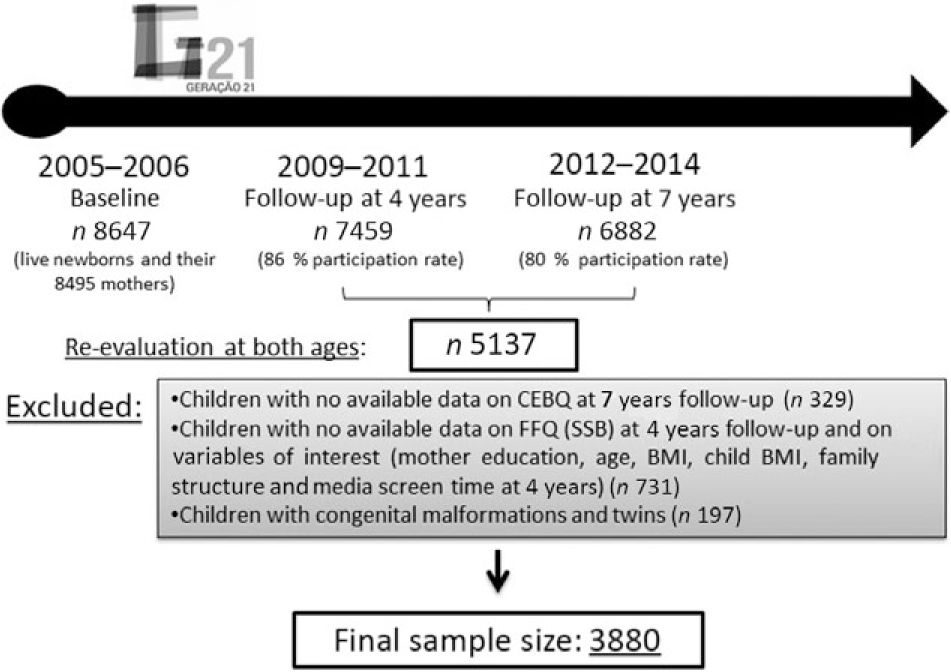
Fig. 1. Flow chart of participants. CEBQ, Children’s Eating Behaviour Questionnaire; SSB, sugar-sweetened beverages.
Student’s t test was performed in order to compare the current sample (n 3880) with non-participant’s characteristics at baseline (n 4767). In the current sample, mothers were slightly older (29·8 (sd 5·2) years old compared with 28·3 (sd 5·8) years old, P < 0·001) and were slightly more educated (11·3 (sd 4·2) schooling years compared with 9·7 (sd 4·2) schooling years, P < 0·001). According to Cohen’s d effect size values (0·26 for maternal age and 0·38 maternal education), the magnitude of the presented differences is considered low(Reference Cohen32), suggesting that these differences were likely to be due to the large sample size and less likely because of differences between participants’ characteristics.
Ethical considerations
Generation XXI was conducted in accordance with the guidelines defined in the Declaration of Helsinki, and all procedures involving human subjects were approved by the Ethics Committee of the Hospital de São João/University of Porto Medical School. The legal representatives of each participant were informed about benefits and potential discomforts, through written informed consent, with the information of all the examinations to be carried out during the evaluation, at baseline and in the subsequent follow-up evaluations.
Data collection
Data were collected in face-to-face interviews by trained researchers using structured questionnaires. Self-reported questionnaires, answered by the main caregiver, were also used.
Information on mother characteristics and birth data were available at baseline. At 4 years old, child characteristics were assessed, including family structure (with whom the child was living with – parents, siblings, grandparents, other family members or others) and daily media screen time (average time during weekdays and weekend were converted into average daily screen time). In addition, children’s dietary intake was obtained through an FFQ, covering the previous 6 months, which was filled out by the main caregiver, which were usually mothers. Response frequency options varied between ‘More than 4 times per day’ and ‘Never’. From the thirty-five food groups, four assessed the consumption of sugary beverages, these were: packed nectar and fruit juices, ice tea, colas and other carbonated drinks. Frequencies of consumption were converted into daily frequencies (e.g. once a week was converted into 1/7 d = 0·14 times/d). This questionnaire was previously validated through comparison with 3-d food records in a sub-sample of children from Generation XXI. Significant intraclass correlation coefficients (ICC) were found between the consumption of soft drinks from the FFQ and from food diaries at 4 years old, ranging between 0·12 and 0·29, and ICC between 0·39 and 0·57 between FFQ food groups and total intake and macronutrients from food diaries at 4 years of age(Reference Vilela, Severo and Moreira33). Maternal diet, including SSB consumption, was also assessed by a FFQ following the same structure described above.
At the 7-year-old follow-up, eating behaviours were assessed through the CEBQ, completed by the main caregiver (94 % were mothers). The original CEBQ includes thirty-five items related to child eating behaviours, answered on a five-point Likert scale, ranging from 1 (‘never’) to 5 (‘always’)(Reference Wardle, Guthrie and Sanderson34). In accordance with the original scale, five of the items were reverse-scored due to opposite phrasing. The scale is composed of eight subscales, namely Satiety Responsiveness, Slowness in Eating, Emotional Undereating and Food Fussiness, characterising food avoidant behaviours, and Enjoyment of Food, Food Responsiveness, Desire to Drink and Emotional Overeating characterising food approach behaviours(Reference Webber, Hill and Saxton4–Reference Sleddens, Kremers and Thijs6). To determine the score of each subscale, items were summed and its mean was calculated. In questionnaires with <50 % of missing data, subscales were calculated by replacing missing items with the mean of the present items (about 3 % of the sample). This questionnaire is a well-established instrument, demonstrating stability over time and good psychometric properties(Reference Wardle, Guthrie and Sanderson3,Reference Viana, Sinde and Saxton15,Reference Carnell and Wardle35) .
In this research, the Portuguese version of the CEBQ (P-CEBQ)(Reference Vilela, Severo and Moreira33) was used. Previously, the psychometric properties of the questionnaire subscales were tested in children from Generation XXI at 7 years of age(Reference Vilela, Severo and Moreira33). A confirmatory factor analysis was conducted to test if the original factor structure (eight subscales) would be replicated in the current sample, and an eight-factor structure that explained 67 % of the total variance was identified. The questionnaire showed good internal consistency (Cronbach’s α ranged from 0·74 to 0·85) and good reliability (average ICC = 0·73)(Reference Albuquerque, Severo and Oliveira36). More details about the validation process of the P-CEBQ can be found elsewhere(Reference Vilela, Severo and Moreira33). In this previous work from Albuquerque et al. (Reference Albuquerque, Severo and Oliveira36), subscales were grouped into two composite factors using principal component analysis: ‘Appetite Restraint’ and ‘Appetite Disinhibition’, explaining 62 % of the total variance (35 and 26 %, respectively). The ‘Appetite Restraint’ factor is related to behaviours associated with internal satiety cues and food fussiness, on which loaded mostly the subscales Food Fussiness, Enjoyment of Food, Slowness in Eating and Satiety Responsiveness, and the ‘Appetite Disinhibition’ factor is related to behaviours associated with external food cues and emotional responses towards foods, on which loaded mostly the subscales Food Responsiveness, Emotional Overeating, Emotional Undereating and Desire to Drink. In the present study, we also investigated the relationship between SSB consumption at 4 years old and both of these factors 3 years later.
Child’s height and weight were measured at 4 and 7 years old by trained staff, according to standard procedures(Reference Gibson37). Weight was measured in light clothing and without shoes, using a digital scale (TANITA®) and the measure was recorded to the nearest 0·1 kg. Height was measured using a fixed stadiometer (SECA®), and the measure was recorded to the nearest 0·1 cm. Children were classified according to the age- and sex-specific BMI z-scores (BMIz) developed by the WHO at 4 years of age. ‘Underweight’ was defined as z-score <−2 sd, ‘normal weight’ as z-score ≥−2 sd and ≤+1 sd, ‘at risk of overweight’ as z-score >+1 and ≤+2, overweight >+2 and ≤+3 and ‘obesity’ as z-score >+3 sd (Reference de Onis and Lobstein38). The two upper categories were combined for statistical analysis purposes (sample descriptive, only).
Mothers’ height was also measured, and they were asked about their weight before pregnancy at the baseline of Generation XXI. Maternal BMI before pregnancy was calculated and categorised as follows: ‘underweight’ was defined as BMI < 18·5 kg/m2, ‘normal weight’ as BMI ≥ 18·5 and <25 kg/m2, ‘overweight’ as BMI ≥ 25 and <30 kg/m2 and ‘obesity’ as BMI ≥ 30 kg/m2(39).
Statistical analysis
Descriptive statistics were performed; proportions were compared using the Pearson’s χ 2 test and means using Student’s t tests. Univariate and multivariate generalised linear models, computing β regression coefficients and the respective 95 % CI, were performed to estimate the associations between SSB consumption and the eight subscales of the P-CEBQ and the two composite factors of ‘Appetite Restraint’ and ‘Appetite Disinhibitions’. Additionally, we performed multinomial logistic regression models aiming to assess the association between the consumption of SSB at 4 years and appetitive traits at age 7 years. Since a low percentage of parents reported that their child did not consume SSB in the FFQ (7·8 %), we opted to dichotomise child SSB consumption into <1 and ≥1 times/d. Increasing scores on the P-CEBQ subscales were categorised into tertiles at 7 years old, with the reference category being set in the lower levels, that is, 1st tertile, of each subscale.
The selection of confounders in each model was based on literature review, and these potential confounders were included in groups into the models. Thus, the first adjusted model included child’s sex, family structure at 4 years old (living with both parents or living with one of them or having other type of family structure – without any of their parents) and media screen time at 4 years old(Reference Sadeghirad, Duhaney and Motaghipisheh40). The second model was further adjusted for maternal characteristics, namely maternal BMI before pregnancy, maternal age and education. Model 3 was further adjusted for maternal SSB consumption at 4 years of the child(Reference Padez, Mourão and Moreira41–Reference Scaglioni, Arrizza and Vecchi43). In the fourth (and last) model, we further adjusted for other dietary variables, namely child’s daily consumption, at 4 years old, of fruit and vegetables and sweets (cookies, cakes, candies and chocolates), which were considered indicators of overall diet quality(Reference Oliveira, Jones and de Lauzon-Guillain17).
The effect of child BMI at 4 years old was also tested in the adjusted model, and the magnitude of the associations did not change (data not shown). For this reason, and due to the possible bidirectional relationship between BMI and eating behaviours(Reference Costa, Severo and Vilela44), we decided not to include child BMIz in the models. A sensitivity analyses was also performed by adjusting the models for father’s characteristics (i.e. father’s age, education and BMI), instead of maternal characteristics. As a much lower sample size was available with father’s data and because results did not change substantially, we opted to show results controlling for maternal characteristics, thus increasing the power of the analyses.
An interaction effect of child’s sex in these associations was also tested, but no differences were observed. Thus, analyses were not stratified by sex, and sex was included in the model as a potential confounder, as described above.
Statistical significance was set in 5 %, and data were analysed using SPSS statistical software (IBM Corp. Released 2017. IBM SPSS Statistics for Windows, version 25.0: IBM Corp.).
Results
Table 1 shows the mother and child characteristics considering the whole sample, and after stratification by categories of SSB consumption at 4 years of age. Children with greater consumption of SSB (≥1 times/d) had more frequently younger (<25 years of age) and less educated mothers (<9 years of schooling), with higher prevalence of overweight/obesity before pregnancy, and who also consumed more frequently SSB. Among the 31·3 % of children consuming SSB ≥1 times/d, 33·6 % were at risk of overweight/overweight/obesity weight categories. Children with greater consumption of SSB at 4 years old spent more time using screens compared with children with lower consumption. Additionally, children who lived with both parents consumed less SSB compared with other family structures.
Table 1. Parent and child characteristics at baseline and follow-ups at 4 years, according to child‘s consumption of sugar-sweetened beverages (SSB) at 4 years (n 3880)
(Numbers and percentages)

* Statistically significant differences according to Pearson’s χ 2 test.
† BMI defined according to the WHO’s classification(39).
‡ BMI z-scores defined according to the WHO’s classification(Reference de Onis and Lobstein38).
Nearly 60 % of the children consumed SSB between 2 and 4 times/week and 80·4 % consumed once a week (data not shown). Children consumed most frequently ice teas (16·5 % consumed daily) and packed fruit nectars (10·6 % consumed daily), and less frequently colas (1·4 % consumed daily) and other carbonated beverages (1·7 % consumed daily) (data not shown).
Fig. 2 presents the mean scores of each P-CEBQ subscale at 7 years old, stratified by child SSB consumption at 4 years of age. Those children consuming SSB once a day or more at 4 years had greater average scores of the food approach behaviours Enjoyment of Food, Food Responsiveness, Emotional Overeating and Desire to Drink at 7 years old. On the other hand, children consuming SSB less than once a day at 4 years old showed greater scores of the food avoidant subscale Slowness in Eating.
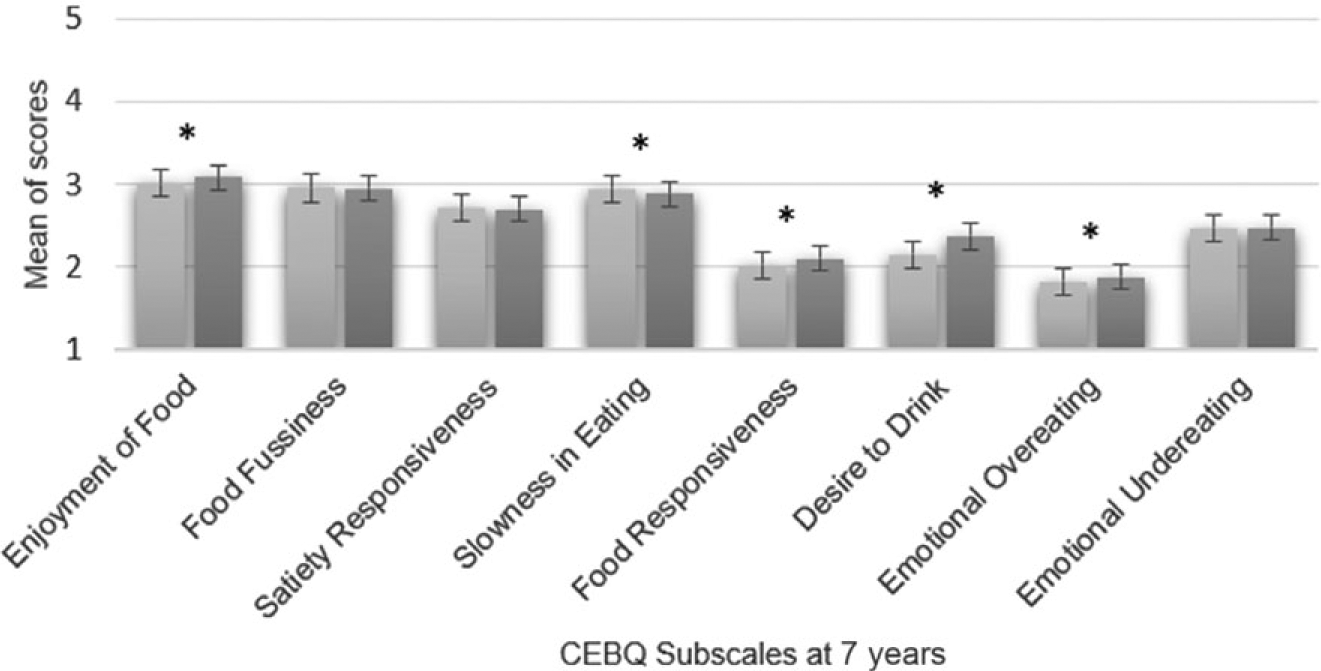
Fig. 2. Children’s appetitive behaviour scores at 7 years of age, according to their intake of sugar-sweetened beverages (SSB) at 4 years old (n 3880). Values are means, with their standard errors represented by vertical bars. * Statistically significant difference according to Student’s t test (P < 0·05). ![]() , <1 Time/d SSB at 4 years;
, <1 Time/d SSB at 4 years; ![]() , ≥1 time/d SSB at 4 years. CEBQ, Children’s Eating Behaviour Questionnaire.
, ≥1 time/d SSB at 4 years. CEBQ, Children’s Eating Behaviour Questionnaire.
Associations between the consumption of SSB at 4 years old and eating behaviours at 7 years old are described in Table 2. In the final adjusted model (model 4), higher consumption of SSB at 4 years of age was associated with higher scores of the food approach behaviour subscale Desire to Drink (β = 0·065, 95 % CI 0·033; 0·097) and the ‘Appetite Disinhibition’ factor (β = 0·047, 95 % CI 0·007, 0·086). On the other hand, higher consumption of SSB at 4 year old was associated with lower scores on the food avoidant behaviours subscales Slowness in Eating (β = −0·044, 95 % CI −0·079, −0·009) and Food Fussiness (β = −0·031, 95 % CI −0·061, −0·001) at 7 years of age.
Table 2. Generalised linear regression models between child sugar-sweetened beverage (SSB) consumption at 4 years old and appetitive behaviours at 7 years old†
(β-Coefficients and 95 % confidence intervals)

CEBQ, Children’s Eating Behaviour Questionnaire; CEBQ-EUE, Emotional Undereating; CEBQ-FF, Food Fussiness; CEBQ-SR, Satiety Responsiveness; CEBQ-SE, Slowness in Eating; CEBQ-FR, Food Responsiveness; CEBQ-DD, Desire to Drink; CEBQ-EOE, Emotional Overeating; CEBQ-EF, Enjoyment of Food.
*P < 0·05, ** P < 0·001.
† Model 1 – adjusted for child’s sex, family structure at 4 years, media screen time at 4 years; model 2 – adjusted for model 1 plus maternal BMI before pregnancy, maternal age and education; model 3 – adjusted for model 2 plus maternal consumption of SSB at 4 years of the child; model 4 – adjusted for model 3 plus child’s consumption of fruits and vegetables and sweets at 4 years.
The multinomial logistic regression analyses (Table 3) showed that consuming ≥1 times/d of SSB (v. <1 time/d) at 4 years old was associated with an increased odds of scoring higher in Desire to Drink in a dose–response relationship (P = 0·019 for 2nd v. 1st tertile and P < 0·001 for 3rd v. 1st tertile). In the final adjusted model (model 4), the association between the consumption of SSB at age 4 and Desire to Drink at 7 years old was significant considering the third tertile of consumption (1st v. 3rd tertile adjusted OR = 1·29, 95 % CI 1·08, 1·54). SSB consumption also showed an association with the third tertile of ‘Appetite Disinhibition’ (1st v. 3rd tertile adjusted OR = 1·28, 95 % CI 1·08, 1·53, adjusting for demographics in models 1 and 2), but this association was no longer significant when further adjusting for maternal consumption of SSB. No significant associations were found with the remaining appetitive subscales (Table 3).
Table 3. Multinomial logistic regression models between child sugar-sweetened beverage (SSB) consumption (≥1 v. <1 times/d – reference category) at 4 years old and appetitive behaviours at 7 years old (1st tertile as reference category)†
(Odds ratios and 95 % confidence intervals)
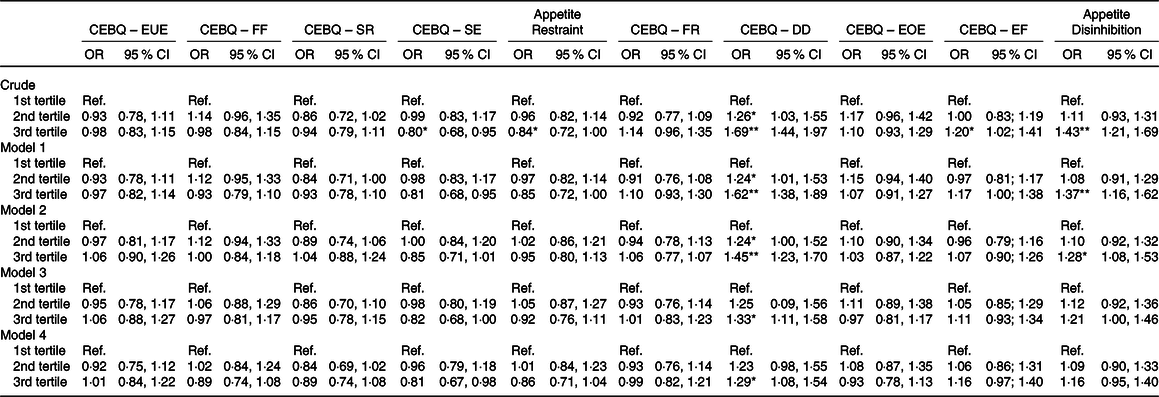
CEBQ, Children’s Eating Behaviour Questionnaire; CEBQ-EUE, Emotional Undereating; CEBQ-FF, Food Fussiness; CEBQ-SR, Satiety Responsiveness; CEBQ-SE, Slowness in Eating; CEBQ-FR, Food Responsiveness; CEBQ-DD, Desire to Drink; CEBQ-EOE, Emotional Overeating; CEBQ-EF, Enjoyment of Food.
* P < 0·05, ** P < 0·001.
† Model 1 – adjusted for child’s sex, family structure at 4 years, media screen time at 4 years; model 2 – adjusted for model 1 plus maternal BMI before pregnancy, maternal age and education; model 3 – adjusted for model 2 plus maternal consumption of SSB at 4 years of the child; model 4 – adjusted for model 3 plus child’s consumption of fruits and vegetables and sweets at 4 years.
Discussion
This study aimed to examine the prospective associations between the consumption of SSB of 4-year-olds and appetitive behaviours at age 7 years. SSB consumption at 4 years old was associated with increased food approach behaviours 3 years later, especially higher scores of Desire to Drink, as well as higher scores in the composite factor ‘Appetite Disinhibition’. In addition, SSB consumption was associated with lower scores in Food Fussiness and Slowness Eating, corroborating our previous hypothesis.
Previous cross-sectional studies(Reference Sweetman, Wardle and Cooke25–Reference Jalkanen, Lindi and Schwab28) showed a tendency of positive associations between the consumption of SSB and food approach behaviours among children. Sweetman et al.(Reference Sweetman, Wardle and Cooke25) found that the consumption of SSB among preschoolers was associated with a greater preference for these beverages and higher scores of Desire to Drink, which corroborates the current results. In contrast, Jalkanen et al. (Reference Jalkanen, Lindi and Schwab28) did not find this relationship among school-age children, only an association between greater fat-containing milk consumption and Desire to Drink was found. In the present study, the subscale Desire to Drink showed the most consistent associations with child’s SSB consumption. CEBQ measures, among other traits, child’s general appetite for drinks, using, for example, the following statement: ‘My child is always asking for a drink’. Accordingly, a higher score in Desire to Drink does not provide sufficient information about the actual consumption and type of beverage consumed.
In this study, we found that a greater consumption of SSB was associated with a higher score in the ‘Appetite Disinhibition’ factor, which is related to the subscales Desire to Drink, Emotional Overeating and Food Responsiveness. Overall, these subscales measure desinhibited behaviours towards eating. Eating in response to emotions has been previously associated to the consumption of sugary and fatty foods, which might be explained by their high palatability(Reference Elfhag, Tholin and Rasmussen27,Reference Frayn and Knäuper45,Reference Lopez-Cepero, Frisard and Lemon46) . In our study, we suggest that the opposite is also true, that is, children consuming more SSB might also develop food approach behaviours. Previous studies suggested that SBB imply a higher food intake(Reference Bennett, Totosy de Zepetnek and Brett22,Reference Poirier, Totosy de Zepetnek and Bennett23) because liquid forms (like SSB) do not provide subsequent compensation of energy intake, leading to a greater total caloric intake(Reference Mattes21,Reference Sweetman, Wardle and Cooke25) . Also, beverages require less oral processing and have a faster gastric-emptying and orocecal transit times(Reference Glasbrenner, Pieramico and Brecht-Krauss47,Reference Hoad, Rayment and Spiller48) . In other words, liquid forms exert a less satiating effect compared with solid forms, which supports the association of SSB with the food approach subscales. Another hypothesis is related to the smaller increase of GLP-1 and insulin and likewise a smaller reduction in ghrelin after ingestion of liquids, compared with solid forms(Reference Cassady, Considine and Mattes49).
Considering our second hypothesis, we expected to find a negative association between SSB consumption and food avoidant subscales, namely Satiety Responsiveness, Slowness in Eating, Food Fussiness and Emotional Undereating. From our findings, a child who consumed more SSB at 4 years old had greater risk of eating faster and also of being less fussy at 7 years. These results may be related to the food environment the child lives in and the meals context. Children with less healthy dietary patterns, such as a high consumption of SSB, tend to live in a more obesogenic environment and show more food approach behaviours(Reference Russell and Worsley11,Reference Mallan, Fildes and Magarey50) . On the other hand, children who show food avoidant traits tend to eat more slowly and to be more selective, excluding several foods from their diet, not only unhealthy foods, such as SSB but it is also common the refusal to eat healthy foods, like vegetables(Reference van der Horst, Deming and Lesniauskas51).
Different adjustments were tested in the associations under study. After further adjusting for maternal SSB consumption (model 3), a significant impact was found. Overall, associations were weakened and others were lost (e.g. association between SSB consumption and the Emotional Overeating subscale). We also tested the model stratified by mother SSB consumption (<1 time/d (70·3 % of mothers) and ≥1 times/d (29·7 %)). The consumption of SSB by mothers did not modify the majority of the associations that remained virtually the same by strata of mother’s own SSB consumption (<1 v. ≥ 1 times/d). However, for Appetite Disinhibition, the association with child’s SSB consumption was only significant among those children whose mothers had a higher consumption of SSB (≥1 times/d: β = 0·061, 95 % CI 0·006, 0·115). This may suggest a positive contribution to the eating habits of children whose mothers consume less SSB. The impact of the mother’s consumption of SSB may be a reflection of parent’s influence as role models in child’s eating(Reference Savage, Fisher and Birch52). Children tend to behave according to their families and peers, especially at early ages, when parents and siblings have a high influence in the development of eating behaviours(Reference Scaglioni, De Cosmi and Ciappolino42). Furthermore, this can also be an indicator of the food accessibility and availability within the child’s environment(Reference Savage, Fisher and Birch52). When the mother has a frequent SSB consumption, it is likely that this type of food is available in their home, too. Thus, factors related to family characteristics and habits seem to play an important role in child’s SSB consumption, as well as in disinhibition behaviours later in childhood.
In our study, SSB were investigated as an independent group of drinks. Nevertheless, diet is complex and the consumption of SSB has been considered a marker of a dietary pattern with poor quality that usually includes other unhealthy foods and beverages(Reference Oliveira, Jones and de Lauzon-Guillain17,Reference Ambrosini, Oddy and Huang53–Reference de Lauzon-Guillain, Jones and Oliveira56) . In order to test if the effects were specifically from SSB consumption, further adjustments for other dietary variables were done (i.e. daily fruit, vegetables and sweets consumption – model 4). Previous associations were weakened, but remained significant. This is an important result of this study, showing that even with a diet with greater quality (i.e. high in fruits and vegetables and low in sweets), the consumption of SSB per se seems to affect eating behaviours later in life.
It is relevant to mention that studies with European populations have shown that Portuguese children have, in general, healthier eating habits(Reference Albuquerque, Lopes and Durão9,Reference Oliveira, Jones and de Lauzon-Guillain17,Reference de Lauzon-Guillain, Jones and Oliveira56) . Our data revealed a relative lower intake of SSB and other energy-dense foods and a higher intake of fruit and vegetables compared with other European populations(Reference Albuquerque, Lopes and Durão9,Reference Oliveira, Jones and de Lauzon-Guillain17,Reference Bleich and Vercammen20,Reference de Lauzon-Guillain, Jones and Oliveira56) . A lower consumption of SSB may have implied in weaker associations between SSB consumption and appetitive traits, not just due to the lower intake of unhealthy foods but also because of the intake of foods with protective effects, such as fruit and vegetables (high content of micronutrients and phytochemicals)(Reference Birch and Fisher1,Reference Liu57,Reference Van Duyn and Pivonka58) . In light of this, the associations between the consumption of SSB and appetitive traits could be even stronger in populations with an increased daily consumption of SSB, and additional associations with other subscales could also be found. Despite the consumption of SSB in our sample being minor compared with other samples in the same age group(Reference Albuquerque, Lopes and Durão9,Reference Oliveira, Jones and de Lauzon-Guillain17,Reference Bleich and Vercammen20,Reference de Lauzon-Guillain, Jones and Oliveira56) , this consumption is still worrisome and reinforces this public health concern.
In recent years, due to the negative impact of SSB on health, companies have been reformulating products high in sugar, reducing portion sizes and introducing formulas with lower sugar content or artificial sweeteners(Reference Jensen and Smed59,Reference Kleiman, Ng and Popkin60) . In Portugal, the introduction of sugar taxation regulation in 2017(61) also led to product reformulations. It is important to highlight that the evaluation of the SSB consumption of the current sample occurred between 2009 and 2011 (4 years follow-up), that is, before the implementation of the taxation regulation in Portugal. Therefore, at that time, the sugar content of these beverages was higher, and artificial versions were less frequent compared with the beverages currently available in the market(Reference Goiana-da-Silva, Cruz-e-Silva and Gregório62,Reference Graça, Gregório and de Sousa63) .
This study has limitations that need to be addressed. First of all, food consumption and eating behaviour data were self-reported, which might introduce some recall and social desirability bias. However, both the instruments were previously tested; the FFQ data were validated in comparison with 3-d food records in this same birth cohort(Reference Vilela, Severo and Moreira33), as well as the CEBQ that showed good psychometric properties in the current sample(Reference Albuquerque, Severo and Oliveira36). Furthermore, we grouped the colas, other carbonated drinks, ice tea and packed nectar and fruit juices, assuming similar contents of sugar, which might not be entirely factual. Likewise, other sugary beverages were not included, for example chocolate milk, and the consumption of artificially sweetened beverages or light versions was not considered as they were expected to be less frequent at that time in our country, especially among children of 4 years of age.
Despite the adjustments for several potential confounders, residual confounding of other foods not included in the adjustments is still possible, such as the consumption of foods high in salt, for example. Moreover, only the mother characteristics were included as co-variates, not taking into account the father’s role in shaping child’s eating behaviours. Commonly, mothers are seen as the providers of food and have an important role as main caregiver by shaping child’s eating behaviour and lifestyle(Reference Khandpur, Blaine and Fisher64,Reference Mallan, Nothard and Thorpe65) . However, father’s role has recently increased in households, as shown in a recent review which suggests that father’s eating habits, weight status and parenting techniques influence child’s dietary behaviours(Reference Litchford, Savoie Roskos and Wengreen66). However, in the current sample, the CEBQ was answered by the main caregiver, and in 94 % of cases, these were mothers. A sensitivity analysis was performed with the inclusion of father’s characteristics as co-variates in the models, but as the current results were very similar and, as the sample size significantly decreased due to lower availability of father‘s data, we chose to show the associations with maternal confounders only, and larger sample size.
The main strength of the present study is, to our knowledge, to be one of the first studies investigating the association between the consumption of SSB and eating behaviours in childhood, using a prospective approach. So far, only one study used a prospective approach in this investigation, but in the opposite direction of associations(Reference Rodenburg, Kremers and Oenema29), as cited above. In that study, associations between SSB and eating behaviours were inconsistent, and the appetitive traits did not predict changes in child’s weight, nor intake(Reference Rodenburg, Kremers and Oenema29). In our study, the associations were exploited in the opposite direction with 3 years between follow-ups, which allowed a better understanding of cause and effect relationships, in contrast to the previous study. Moreover, this study had a larger sample size (n 3880 v. n 1275).
Conclusions
The consumption of SSB during pre-school years was associated with increased food approach behaviours and less food avoidant behaviours later in childhood. Family characteristics, particularly maternal SSB consumption, explained part of these associations.
In light of this, it is relevant, from early ages, to promote the intake of alternative drinks, such as water, and to restrict the availability of other sweetened options, making parents and caregivers aware of the importance of these exposures. Longitudinal studies are necessary in order to better understand the long-term effects of frequent SSB consumption, and of different types of SSB, on the development of eating behaviours and future health across childhood.
Acknowledgements
The authors gratefully acknowledge the families enrolled in Generation XXI for their kindness, all members of the research team for their enthusiasm and perseverance and the participating hospitals and their staff for their help and support. We also acknowledge the support from the Epidemiology Research Unit (EPI-Unit: UIDB/04750/2020; POCI-01-0145-FEDER-006862).
Generation XXI was funded by the Health Operational Programme – Saúde XXI, Community Support Framework III and the Regional Department of Ministry of Health. This study was supported through FEDER from the Operational Programme Factors of Competitiveness – COMPETE and through national funding from the Foundation for Science and Technology – FCT (Portuguese Ministry of Education and Science) under the projects ‘Appetite regulation and obesity in childhood: a comprehensive approach towards understanding genetic and behavioural influences’ (PTDC/SAU-EPI/30334/2017/ POCI-01-0145-FEDER-030334) and ‘Appetite and adiposity – evidence for gene–environment interplay in children’ (IF/01350/2015 – Andreia Oliveira). It had also support from the Calouste Gulbenkian Foundation, Portugal.
D. C. was responsible for data analysis and interpretation, drafting of the manuscript and final approval of the version to be published. S. W. was responsible for interpretation of data, critical revision of the manuscript and final approval of the version to be published. A. O. was responsible for study concept, interpretation of data, critical revision of the manuscript and final approval of the version to be published. All authors read and approved the final manuscript.
There are no conflicts of interest.


