


Hypertension is the most important risk factor for CVD and the leading preventable cause of premature death and disability worldwide(Reference Lawes, Vander Hoorn and Rodgers1,Reference Mills, Bundy and Kelly2) . A pragmatic global screening campaign by the International Society of Hypertension detected hypertension in 502 079 (33·4 %) individuals among 1 504 963 aged 18 years and older who were screened in 2018(Reference Beaney, Burrell and Castillo3). In China, a national survey from 2014 to 2017 including 1 738 886 participants showed that almost half of Chinese adults aged 35–75 years had hypertension(Reference Lu, Lu and Wang4). Despite the high prevalence, the levels of awareness, treatment and control of hypertension among Chinese remain low(Reference Lu, Lu and Wang4). Therefore, early and accurate identification of hypertension-related risk factors is urgently needed to effectively prevent its incidence and then reduce its disease burden.
Visceral adiposity index (VAI) was found as a reliable index for evaluating visceral fat dysfunction and to have better prediction value than traditional clinical parameters for metabolic disorders in Caucasians(Reference Amato, Giordano and Galia5,Reference Kouli, Panagiotakos and Kyrou6) . Considering the different characteristic of body fat in Asian populations as compared with Caucasians(Reference Deurenberg, Deurenberg-Yap and Guricci7,Reference Camhi, Bray and Bouchard8) , recently, the Chinese visceral adiposity index (CVAI), which combines demographic (age), anthropometric (BMI and waist circumference (WC)) and metabolic characteristics (serum TAG and HDL-cholesterol), was developed in Chinese adults(Reference Xia, Chen and Lin9). A cross-sectional study including 6495 participants showed that CVAI is superior to BMI, WC and VAI in predicting the metabolic syndrome, hypertension, diabetes and prediabetes(Reference Xia, Chen and Lin9). There were also some prospective studies reporting a positive association between CVAI and risk of incident diabetes(Reference Xia, Lin and Chen10–Reference Wu, Gong and Li12). However, whether CVAI is also positively associated with risk of incident hypertension remains unknown. In addition, the effect of CVAI change on hypertension incidence and the performance of CVAI for predicting incident hypertension need to be explored to provide additional epidemiological evidence for future hypertension prevention.
Therefore, the present study aimed to evaluate the association of the CVAI and its 6-year change with incident hypertension and compare the value of the CVAI for predicting incident hypertension with that of other obesity indices (VAI, a body shape index (ABSI), WC, and BMI) in sample of 10 304 non-hypertensive participants recruited by a cluster sampling procedure.
Methods
Study population
The Rural Chinese Cohort Study was a prospective cohort study, and participants were selected by cluster random sampling among people ≥18 years old who had lived for at least 10 years in a rural area of Henan Province in China. All participants were free of severe psychological disorders, physical disabilities, Alzheimer’s disease, dementia, tuberculosis, AIDS or other infectious diseases at the time of enrolment. Ultimately, a total of 20 194 participants were recruited at baseline during July to August 2007 and July to August 2008, and 17 265 participants (response rate 85·5 %) were successfully followed up during July to August 2013 and July to October 2014. Details of the study design and participant characteristics were described previously(Reference Zhao, Liu and Sun13,Reference Li, Zhang and Guo14) . Written informed consent was obtained from each participant after a full explanation of the study, which was approved by the Ethics Committee of Zhengzhou University.
In the primary analysis, we excluded participants with hypertension at baseline (n 6229), hypertension status at baseline or follow-up unknown (n 3554) and missing data for baseline age, BMI, WC, and TAG and HDL-cholesterol levels (n 37) among the 20 194 study participants; finally, a total of 10 304 individuals were included to evaluate the association between baseline CVAI and risk of hypertension. In the second analysis, we excluded participants with missing data for follow-up age, BMI, WC, and TAG and HDL-cholesterol levels (n 945) and therefore had data for 9359 participants to assess risk of incident hypertension with 6-year change in the CVAI (online Supplementary Fig. S1).
Baseline data collection
Questionnaires including items on demographic characteristics (age, sex, marital status and educational level), behavioural measures (smoking, alcohol drinking and physical activity) and medical history (anti-hypertensive medication and lipid-lowering medication history) were administered by trained research staff during face-to-face interviews. Drinking was defined as drinking alcohol ≥ 12 times during the last year(Reference Zhang, Wang and Liu15). Physical activity level was classified by the International Physical Activity Questionnaire scoring protocol(Reference Craig, Marshall and Sjostrom16). Family history of hypertension was defined as having at least one first-degree family member with hypertension. For measuring anthropometric indices, participants were asked to wear light clothes and be barefoot. Height was measured to the nearest 0·1 cm with participants standing erect. Weight was measured to the nearest 0·5 kg by use of a vertical weight scale. WC was measured at the midpoint between the lowest rib and the iliac crest to the nearest 0·1 cm with participants gently breathing. Participants were measured twice, and the average was used for analyses. BMI was calculated as weight (kg) divided by height (m) squared. ABSI was defined as WC/((BMI)2/3 × (height)1/2)(Reference Krakauer and Krakauer17).
Participants were instructed to refrain from smoking and consuming alcohol, coffee and tea before blood pressure (BP) measurement. They sat comfortably with the arm positioned at the level of the heart during the measurement. BP was measured with an electronic oscillometric BP measurement device (HEM-770 AFuzzy) during one visit by trained health workers, according to the American Heart Association’s standardised protocol(Reference Perloff, Grim and Flack18). The measurements were repeated three times with a 30-s interval, and the average was used for the analysis. Hypertension was defined as systolic BP (SBP) ≥140 mmHg and/or diastolic BP (DBP) ≥ 90 mmHg and/or use of antihypertensive medication(Reference Chobanian, Bakris and Black19).
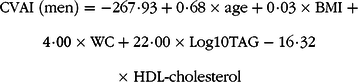
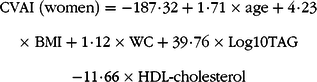
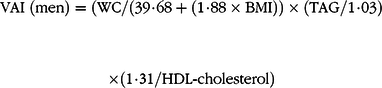
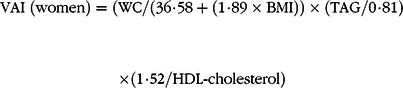
Blood samples were obtained after an overnight fast of at least 8 h. Levels of fasting plasma glucose, TAG, total cholesterol and HDL-cholesterol were measured using a HITACHI automatic clinical analyzer (model 7060). The CVAI(Reference Xia, Chen and Lin20) and VAI(Reference Amato, Giordano and Galia21) were calculated as follows:
 $$\eqalign{
& {\rm{CVAI}}\;({\rm{men}}){\rm{ = - 267}}\cdot{\rm{93 + 0}}\cdot{\rm{68}} \times {\rm{age + 0}}\cdot{\rm{03}} \times {\rm{BMI}}\; + \cr
& {\rm{4}}\cdot{\rm{00}} \times {\rm{WC + 22}}\cdot{\rm{00}} \times {\rm{Log10TAG - 16}}\cdot{\rm{32}} \cr
& \times \;{\rm{HDL - cholesterol}} \cr} $$
$$\eqalign{
& {\rm{CVAI}}\;({\rm{men}}){\rm{ = - 267}}\cdot{\rm{93 + 0}}\cdot{\rm{68}} \times {\rm{age + 0}}\cdot{\rm{03}} \times {\rm{BMI}}\; + \cr
& {\rm{4}}\cdot{\rm{00}} \times {\rm{WC + 22}}\cdot{\rm{00}} \times {\rm{Log10TAG - 16}}\cdot{\rm{32}} \cr
& \times \;{\rm{HDL - cholesterol}} \cr} $$
 $$\eqalign{
& {\rm{CVAI}}\;({\rm{women}}){\rm{ = - 187}}\cdot{\rm{32 + 1}}\cdot{\rm{71}} \times {\rm{age + 4}}\cdot{\rm{23}} \cr
& \times \;{\rm{BMI + 1}}\cdot{\rm{12}} \times {\rm{WC + 39}}\cdot{\rm{76}} \times {\rm{Log10TAG}} \cr
& {\rm{ - 11}}\cdot{\rm{66}} \times {\rm{HDL - cholesterol}} \cr} $$
$$\eqalign{
& {\rm{CVAI}}\;({\rm{women}}){\rm{ = - 187}}\cdot{\rm{32 + 1}}\cdot{\rm{71}} \times {\rm{age + 4}}\cdot{\rm{23}} \cr
& \times \;{\rm{BMI + 1}}\cdot{\rm{12}} \times {\rm{WC + 39}}\cdot{\rm{76}} \times {\rm{Log10TAG}} \cr
& {\rm{ - 11}}\cdot{\rm{66}} \times {\rm{HDL - cholesterol}} \cr} $$
 $$\eqalign{
& {\rm{VAI}}\;({\rm{men}}){\rm{ = }}({\rm{WC/}}({\rm{39}}\cdot{\rm{68 + }}({\rm{1}}\cdot{\rm{88}} \times {\rm{BMI}})) \times ({\rm{TAG/1}}\cdot{\rm{03}}) \cr
& \times ({\rm{1}}\cdot{\rm{31/HDL - cholesterol}}) \cr} $$
$$\eqalign{
& {\rm{VAI}}\;({\rm{men}}){\rm{ = }}({\rm{WC/}}({\rm{39}}\cdot{\rm{68 + }}({\rm{1}}\cdot{\rm{88}} \times {\rm{BMI}})) \times ({\rm{TAG/1}}\cdot{\rm{03}}) \cr
& \times ({\rm{1}}\cdot{\rm{31/HDL - cholesterol}}) \cr} $$
 $$\eqalign{
& {\rm{VAI}}\;({\rm{women}}){\rm{ = }}({\rm{WC/}}({\rm{36}}\cdot{\rm{58 + }}({\rm{1}}\cdot{\rm{89}} \times {\rm{BMI}})) \times ({\rm{TAG/0}}\cdot{\rm{81}}) \cr
& \times ({\rm{1}}\cdot{\rm{52/HDL - cholesterol}}) \cr} $$
$$\eqalign{
& {\rm{VAI}}\;({\rm{women}}){\rm{ = }}({\rm{WC/}}({\rm{36}}\cdot{\rm{58 + }}({\rm{1}}\cdot{\rm{89}} \times {\rm{BMI}})) \times ({\rm{TAG/0}}\cdot{\rm{81}}) \cr
& \times ({\rm{1}}\cdot{\rm{52/HDL - cholesterol}}) \cr} $$
Follow-up examination
The same questionnaire interview, anthropometric measurements and laboratory measurements at baseline were performed during the follow-up visits. The same definitions for hypertension and CVAI were adopted in the follow-up.
Statistical analyses
The 6-year change in CVAI was calculated as CVAI at the end of follow-up minus that at baseline. Continuous variables are described with medians and interquartile ranges because of skewed distribution and were analysed by the Wilcoxon two-sample test. Categorical variables are described with frequencies and percentages and were analysed by the χ 2 test. Sex-specific analyses were conducted for all results.
Modified Poisson regression is commonly used to derive adjusted relative risks (RR) and 95 % CI for cohort studies(Reference Petersen and Deddens22). In the primary analysis, study participants were classified by four CVAI quartiles, with the lowest quartile as the reference. We also estimated risk of hypertension with per-sd increase in CVAI. Model 1 was adjusted for age at baseline, model 2 was adjusted for model 1 plus marital status, educational level, drinking, physical activity and family history of hypertension at baseline and model 3 was further adjusted for model 2 plus SBP, DBP and fasting plasma glucose and total cholesterol level at baseline. Sensitivity analysis was conducted by excluding participants with cancers, kidney disease, stroke, myocardial infarction or heart failure at baseline to minimise the potential influence on risk estimates in model 4 and further excluding participants with lipid-lowering medication history in model 5. We used restricted cubic splines analysis to explore the dose–response association between CVAI and risk of hypertension, with the knot at 25th percentile of the distribution as the reference. Finally, area under the receiver operating characteristic curve analysis was used to evaluate the predictive value of incident hypertension with baseline CVAI, VAI, ABSI, WC and BMI; differences between area under the receiver operating characteristic curve for these obesity indices were tested with the Z statistic.
In the second analysis, study participants were classified by four CVAI change quartiles, with the quartile containing 0 as the reference. We also estimated risk of hypertension with per-sd increase in CVAI change. Model 1 was adjusted for age at baseline, model 2 was further adjusted for model 1 plus marital status, educational level, drinking, physical activity and family history of hypertension at baseline and model 3 was further adjusted for model 2 plus SBP, DBP, fasting plasma glucose and total cholesterol levels, and CVAI at baseline. Sensitivity analysis was conducted by excluding participants with cancers, kidney disease, stroke, myocardial infarction or heart failure at baseline to minimise the potential influence on risk estimates in model 4 and further excluding participants with lipid-lowering medication history in model 5. The receiver operating characteristics were calculated using Medcalc version 9.3, and other analyses involved using SAS version 9.4 for Windows (SAS Institute). Two-sided P < 0·05 was considered statistically significant.
Results
Demographic characteristics of the study participants
A total of 10 304 participants (women 6240) were included in the study. Median age for men and women was 51·00 (interquartile range 41·00–59·00) and 46·00 (interquartile range 39·00–55·00) years, respectively. Baseline characteristics of study participants with and without hypertension stratified by sex are presented in Table 1. For both men and women, participants with hypertension had higher WC, BMI, SBP, DBP, fasting plasma glucose and total cholesterol levels, ABSI and CVAI than those without hypertension (all P < 0·05). However, participants with hypertension had higher TAG level and VAI and lower proportion of married/cohabitating for women but not men (all P < 0·05). Participants without hypertension were more likely physically active for men but not women (P < 0·05).
Table 1. Baseline characteristics of the study participants with and without hypertension by sex
(Medians and interquartile ranges (IQR); numbers and percentages)
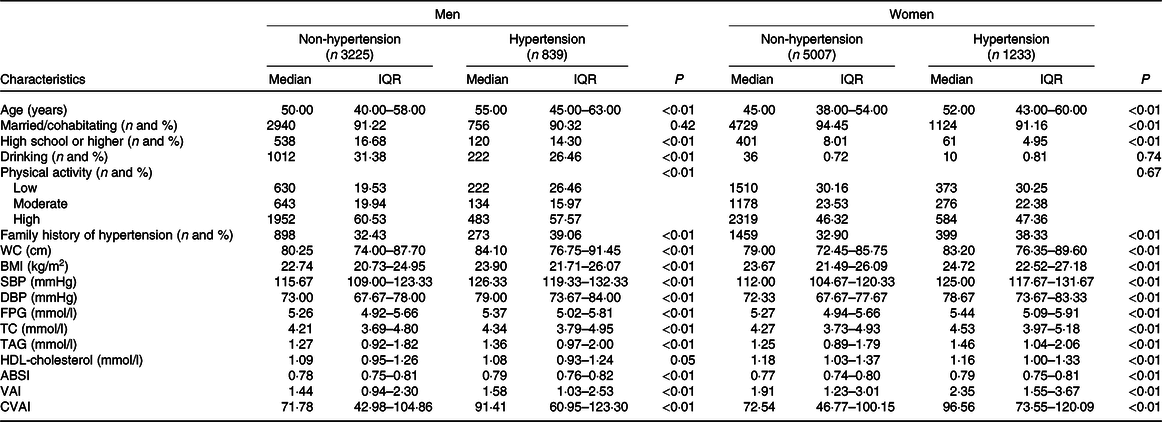
WC, waist circumference; SBP, systolic blood pressure; DBP, diastolic blood pressure; FPG, fasting plasma glucose; TC, total cholesterol; ABSI, a body shape index; VAI, visceral adiposity index; CVAI, Chinese visceral adiposity index.
Association of baseline Chinese visceral adiposity index and hypertension risk
During a mean of 6·03 (range 4·80–7·23) years of follow-up, hypertension developed in 839 of 4064 men and 1233 of 6240 women. The cumulative incidence of hypertension for participants in quartiles 1, 2, 3 and 4 of the CVAI was 13·08, 17·65, 22·52 and 29·33 %, respectively, for men and 7·82, 16·22, 22·56 and 32·44 %, respectively, for women (Table 2). With increasing CVAI quartile, hypertension risk increased for both men and women (all P < 0·05). In unadjusted models, with CVAI quartile 1 as the reference, with quartiles 2, 3 and 4, the RR for hypertension were 1·25 (95 % CI 1·02, 1·54), 1·57 (95 % CI 1·29, 1·90) and 2·03 (95 % CI 1·69, 2·45), respectively, for men, and 1·69 (95 % CI 1·37, 2·09), 2·11 (95 % CI 1·71, 2·61) and 2·62 (95 % CI 2·11, 3·26), respectively, for women. After adjusting for potential confounding factors, the positive association between CVAI and hypertension risk persisted only with the highest quartile for men (RR 1·29, 95 % CI 1·05, 1·59, model 3). For women, CVAI quartiles 2, 3 and 4 were significantly associated with hypertension in model 3: the adjusted RR were 1·34 (95 % CI 1·08, 1·65), 1·42 (95 % CI 1·15, 1·76) and 1·53 (95 % CI 1·22, 1·91), respectively.
Table 2. Association of baseline Chinese visceral adiposity index and risk of hypertension*
(Relative risks (RR) and 95 % confidence intervals; numbers and ranges)
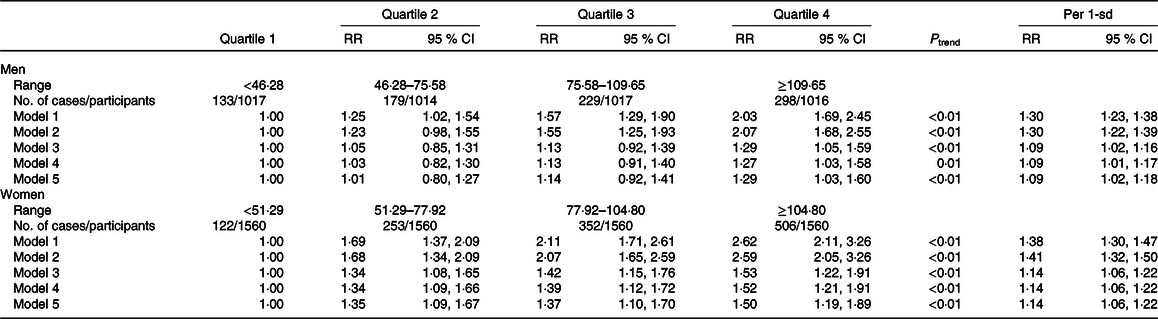
* Model 1: adjusted for age at baseline. Model 2: adjusted for model 1 as well as marital status, educational level, drinking, physical activity and family history of hypertension at baseline. Model 3: adjusted for model 2 as well as systolic blood pressure, diastolic blood pressure, fasting plasma glucose and total cholesterol at baseline. Model 4: adjusted for model 3 and further excluded participants with cancers, kidney disease, stroke, myocardial infarction or heart failure at baseline. Model 5: adjusted for model 4 and further excluded participants with lipid-lowering medication history at baseline.
Risk of hypertension was increased with per-sd increase in CVAI for both men and women. The adjusted RR were 1·09 (95 % CI 1·02, 1·16) for men and 1·14 (95 % CI 1·06, 1·22) for women in model 3. The positive association between CVAI and hypertension risk persisted on further excluding participants with cancers, kidney disease, stroke, myocardial infarction, heart failure or lipid-lowering medication history at baseline. Restricted cubic splines indicated a significant non-linear dose–response association between CVAI and hypertension risk for both men and women (all P non-linearity < 0·01, Figs. 1 and 2).

Fig. 1. Dose–response association between Chinese visceral adiposity index and risk of hypertension for men. Data are relative risks (RR; ![]() ) and 95 % CI (
) and 95 % CI (![]() ) from restricted cubic splines, with Chinese visceral adiposity index 43·795 as the reference.
) from restricted cubic splines, with Chinese visceral adiposity index 43·795 as the reference.
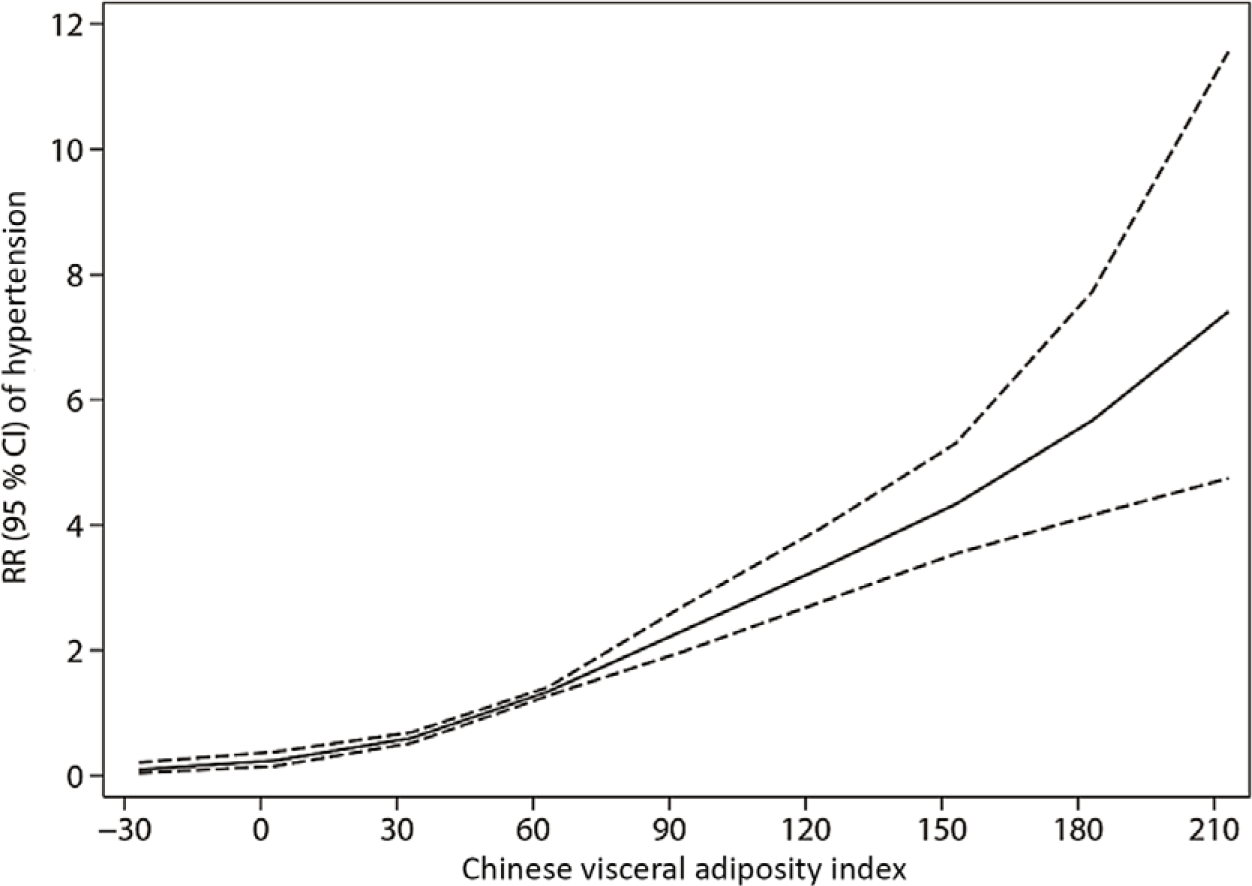
Fig. 2. Dose–response association between Chinese visceral adiposity index and risk of hypertension for women. Data are relative risks (RR; ![]() ) and 95 % CI (
) and 95 % CI (![]() ) from restricted cubic splines, with Chinese visceral adiposity index 51·298 as the reference.
) from restricted cubic splines, with Chinese visceral adiposity index 51·298 as the reference.
Comparison of the association of Chinese visceral adiposity index, visceral adiposity index, a body shape index, BMI and waist circumference with hypertension risk
The receiver operating characteristic curve analysis of the association between the five obesity indices and hypertension for men and women is in online Supplementary Figs. S2 and S3. The area under the receiver operating characteristic curves for CVAI, VAI, ABSI, WC and BMI were 0·611 (95 % CI 0·595, 0·626), 0·542 (95 % CI 0·526, 0·557), 0·567 (95 % CI 0·552, 0·583), 0·591 (95 % CI 0·576, 0·606) and 0·597 (95 % CI 0·582, 0·612), respectively, for men, and 0·672 (95 % CI 0·661, 0·684), 0·584 (95 % CI 0·572, 0·597), 0·599 (95 % CI 0·587, 0·612), 0·609 (95 % CI 0·597, 0·621) and 0·586 (95 % CI 0·574, 0·598), respectively, for women. The CVAI had the largest area under the receiver operating characteristic curve value for hypertension among the five obesity indices, and the differences were all statistically significant (all P < 0·05).
Association of 6-year change of Chinese visceral adiposity index and hypertension risk
Table 3 shows the association between 6-year change of CVAI during the 6-year follow-up and hypertension risk. For men, risk of hypertension was increased with the highest quartile of CVAI change (≥28·54) as compared with CVAI gain −2·19 to 12·36 (RR 1·37, 95 % CI 1·13, 1·65) (model 3). The adjusted RR for hypertension with per-sd gain in CVAI change was 1·26 (95 % CI 1·16, 1·36). For women, risk of hypertension was increased with the highest quartile of CVAI change (≥ 29·15) as compared with CVAI gain < 5·79 (RR 1·64, 95 % CI 1·41, 1·92) (model 3). The adjusted RR for hypertension with per-sd gain in CVAI change was 1·23 (95 % CI 1·15, 1·30). Similar results were found in the sensitivity analyses.
Table 3. Association of 6-year change of Chinese visceral adiposity index during the 6-year follow-up and risk of hypertension*
(Relative risks (RR) and 95 % confidence intervals; numbers and ranges)
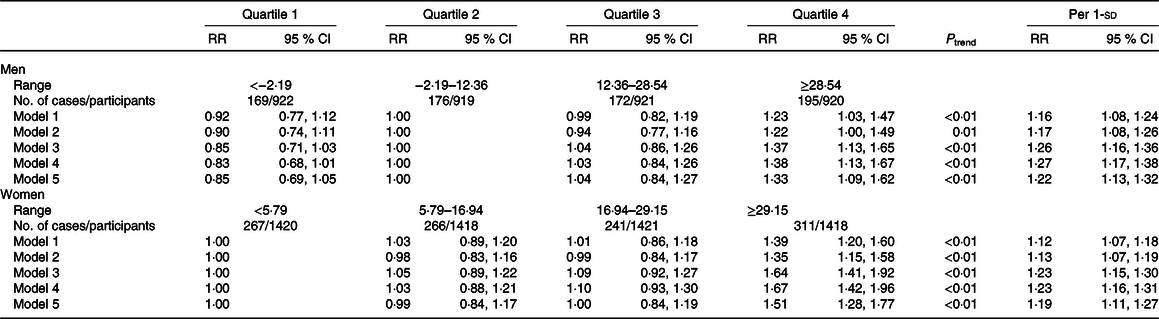
* Model 1: adjusted for age at baseline. Model 2: adjusted for model 1 as well as marital status, educational level, drinking, physical activity and family history of hypertension at baseline. Model 3: adjusted for model 2 as well as systolic blood pressure, diastolic blood pressure, fasting plasma glucose, total cholesterol and Chinese visceral adiposity index at baseline. Model 4: adjusted for model 3 and further excluded participants with cancers, kidney disease, stroke, myocardial infarction or heart failure at baseline. Model 5: adjusted for model 4 and further excluded participants with lipid-lowering medication history at baseline.
Discussion
To our knowledge, this is the first prospective study to explore the association between the CVAI and risk of hypertension. As compared with CVAI quartile 1, with CVAI quartile 4, the risk of hypertension for men and women was increased 29 and 53 %, respectively. We observed dose–response associations between the CVAI and incident hypertension for both sexes. Also, we compared the performance of CVAI, VAI, ABSI, WC and BMI in predicting incident hypertension and found CVAI as the best predictor of hypertension for both sexes. Finally, we explored the association of 6-year change in CVAI with risk of hypertension and found that with per-sd gain in CVAI, risk of hypertension was increased 26 and 23 % for men and women, respectively. The associations of baseline CVAI and its 6-year change with risk of hypertension were stable after excluding participants with cancers, stroke, myocardial infarction, heart failure, kidney disease and lipid-lowering medication history at baseline. Our findings indicate that CVAI may be a reliable index of visceral obesity in predicting incident hypertension in Chinese adults.
Mounting evidence has indicated that the quantity and distribution of body fat are associated with different risk of hypertension, and visceral adipose tissue (VAT) is more strongly associated with risk of hypertension than subcutaneous abdominal adipose tissue in different populations(Reference Fox, Massaro and Hoffmann23–Reference Chandra, Neeland and Berry26). Though BMI and WC were recommended and widely used to define general and abdominal obesity, neither can differentiate between VAT and subcutaneous abdominal adipose tissue(Reference Piché, Poirier and Lemieux27,Reference Després28) . ABSI, as a reliable index of body fat accumulation, has the same limitations as BMI and WC(Reference Krakauer and Krakauer29). Routine access to CT and MRI to assess VAT might be unsuitable in general clinical practice and large cohort studies; thus, VAI and CVAI were developed to predict VAT in European and Chinese populations, respectively(Reference Xia, Chen and Lin20,Reference Amato, Giordano and Galia21) . Our results showed that the CVAI had the best performance in predicting incident hypertension among various obesity indices (CVAI, VAI, ABSI, WC and BMI) for both sexes in our Chinese cohort. The CVAI may have higher predictive values than the VAI because of the different characteristics of body fat among various ethnicities. Asian populations are more prone to visceral fat accumulation at lower BMI values as compared with Western populations(Reference Nazare, Smith and Borel30,Reference Deurenberg, Deurenberg-Yap and Guricci31) . Consistent with our findings, Xia et al. (Reference Xia, Chen and Lin20) also found the CVAI with better predictive performance for hypertension than the VAI, WC and BMI in a Chinese population. Further research in other Asian populations may be needed to test the performance of the CVAI in predicting incident hypertension. As widely used and recommended obesity indices, WC and BMI are also good predictors for hypertension if data for blood lipid levels are not available.
Our analysis found a stronger association between baseline CVAI and hypertension for women than men (P interaction < 0·01). Tang et al. also found that VAT was more strongly associated with SBP and DBP in women than men(Reference Tang, Zhang and Tong32). The sex differences may be due to differences in fat distribution, sex hormones and the pathogenesis of hypertension(Reference Tchernof and Després33,Reference Denton, Hilliard and Tare34) . Further studies are needed to explore the potential mechanisms. Our analysis showed a positive association between CVAI gain and risk of hypertension for both men and women. Consistent with our findings, Chandra et al. (Reference Chandra, Ayers and Neeland35) found a 39 % increased risk of hypertension with per-sd gain in VAT. Another study by Sullivan et al.(Reference Sullivan, Kahn and Fujimoto36) observed a positive association between 5-year increase in intra-abdominal fat and risk of hypertension after adjusting for potential confounding factors. As compared with stable CVAI, decreased CVAI marginally lowered the risk of hypertension for men. The Framingham Heart Study Third Generation cohort gave similar findings, that decreasing VAT attenuation was positively associated with increased risk of hypertension after adjusting for BMI and WC(Reference Lee, Pedley and Hoffmann37). Also, Rosenquist et al.(Reference Rosenquist, Pedley and Massaro38) found low attenuation of VAT was associated with increased risk of hypertension even after adjusting for VAT volume for men. Reducing VAT through lifestyle interventions may be helpful to lower risk of hypertension.
The mechanisms linking visceral obesity to hypertension are elusive because of the multifactorial nature of hypertension. The possible mechanisms are as follows. First, increased sympathetic nervous system activity contributes to the association of VAT and hypertension, which seems mediated in part by the increase in level of the adipocyte-derived hormone leptin, the stimulation of pro-opiomelanocortin neurons and subsequent activation of melanocortin 4 receptors in the central nervous system(Reference Alvarez, Beske and Ballard39–Reference DeMarco, Aroor and Sowers41). Second, increased VAT is negatively associated with circulating concentrations of B-type natriuretic peptide: lower level of circulating B-type natriuretic peptide may diminish vasodilation and natriuresis and contribute to hypertension(Reference Seven, Thuesen and Linneberg40,Reference Seravalle and Grassi42) . Third, VAT secretes a more pro-inflammatory cytokine profile, characterised by higher levels of TNF-α and other pro-inflammatory factors, than does abdominal adipose tissue, which could be involved in the pathogenesis of hypertension(Reference Fox, Massaro and Hoffmann23).
Our study has some strengths. Primarily, the present study first explored the association of baseline CVAI and its 6-year change with risk of hypertension and tested the predictive performance of hypertension among various obesity indices (CVAI, VAI, ABSI, WC and BMI) by sex. Also, its prospective design, large sample size and standardised high-quality clinical and laboratory procedures may provide relatively convincing findings. However, the study participants were all rural adults in the middle of China, so our findings require validation in other ethnic populations. Also, although we adjusted for various covariates, other potential confounders (i.e. diet, psychological factors, etc.) may affect the association between CVAI and risk of hypertension.
Conclusions
Our results show higher baseline CVAI and dynamic gain in CVAI positively associated with increased risk of incident hypertension in Chinese adults. The performance of CVAI in predicting incident hypertension is superior to that of other visceral obesity indices (VAI, ABSI, WC and BMI). Because its components are easily available in large prospective studies and routine clinical practice, CVAI might be a reliable and applicable index for identifying high risk of hypertension and promoting essential measures to reduce or delay the incidence of hypertension.
Acknowledgements
We thank all the study investigators and staff and individuals who participated in the present study, especially Dr Dongsheng Hu.
The present study was supported by the National Natural Science Foundation of China (grant numbers 81402752 and 81673260); the Natural Science Foundation of Guangdong Province (grant number 2019A1515011183) and the Science and Technology Development Foundation of Shenzhen (grant numbers JCYJ20170412110537191 and JCYJ20190808145805515).
M. H., R. Q. and D. H. designed and conducted the research; M. H. and R. Q. analysed the data and wrote the paper; Q. L., L. L., S. H., X. W., D. Z., C. C., Y. Z., D. L., C. G., Q. Z., G. T., Y. Z., Y. W., Y. L., X. Y., Y. Z., Y. F., P. Q., F. H. and M. Z. provided constructive suggestions and M. H. and R. Q. had primary responsibility for the final content. All authors read and approved the final manuscript for submission.
There are no conflicts of interest.
Supplementary material
For supplementary material referred to in this article, please visit https://doi.org/10.1017/S0007114520004298


