


Globally, there is growing interest in assessing overall diet quality or dietary patterns and associations with health outcomes such as healthy weight and reduced risk of diet-related disease(1–Reference Burggraf, Teuber and Brosig3). This has been reflected in dietary guidelines where the focus has shifted from single nutrients (e.g. saturated fat) to the consumption of whole foods and preferred dietary patterns (e.g. eat fish and legumes more often)(1,2) . Food-based diet quality indices evaluate dietary intake against dietary guidelines or other pre-defined criteria(Reference Kant4–Reference Wirt and Collins6) and reflect that people eat food, and combinations of food consumed as meals and snacks, and not nutrients in isolation. The diet quality of athletes has been investigated in a small number of studies using general population tools such as the Healthy Eating Index(Reference Jürgensen, Daniel and da Costa Padovani7–Reference Zanella, August and Alves10) and the Australian Recommended Food Score(Reference Spronk, Heaney and Prvan11,Reference Burrows, Harries and Williams12) . Although there are certain aspects of general population diet quality indices relevant to athletes (e.g. achieving an adequate intake of core food groups), there are other factors that require specific consideration such as higher energy requirements(Reference Manore, Thompson, Burke and Deakin13), an increased need for specific micronutrients (such as Fe and Ca)(Reference Thomas, Erdman and Burke14) and practical considerations regarding nutrition support for regular training (e.g. meal frequency and patterns)(Reference Burke, Slater and Broad15). To our knowledge, a valid and reliable athlete-specific diet quality tool does not exist currently.
In practice, sports dietitians typically apply various criteria to interpret the dietary intake of athletes including adherence to dietary guidelines relevant to age and sex(1). These are used in conjunction with sports nutrition recommendations which vary according to sporting type, training load and/or body size(Reference Thomas, Erdman and Burke14), particularly with respect to energy and macronutrient needs. A high-quality diet promotes general health and minimises risk of nutritional inadequacy(Reference Thomas, Erdman and Burke14). Conversely, poor dietary intake may compromise recovery and adaptations from training(Reference Thomas, Erdman and Burke14,Reference Maughan and Shirreffs16) . Despite this, athletes have been known to consume diets that do not meet sport-specific guidelines, particularly for carbohydrate intake(Reference Burke, Cox and Cummings17–Reference Jenner, Buckley and Belski20). Furthermore, the basic nutrition practices of athletes (i.e. an adequate intake of core food groups such as fruit, vegetables and dairy products) have been shown to be sub-optimal(Reference Jürgensen, Daniel and da Costa Padovani7,Reference Burrows, Harries and Williams12) . Jürgensen et al. (Reference Jürgensen, Daniel and da Costa Padovani7) observed a low consumption of fruits, vegetables, whole grains, milk and dairy products by team sport athletes, while Burrows et al. (Reference Burrows, Harries and Williams12) reported a lack of variety within key food groups such as fruits, vegetables and dairy products in adolescent rugby union players.
There are several sport-specific challenges that influence the accuracy of dietary assessment of athletes such as modification of food intake due to periodised training, competition or travel; frequent eating occasions and larger portion sizes(Reference Magkos and Yannakoulia21). Food records are commonly used to assess dietary intake in practice(Reference Capling, Beck and Gifford22); however, the burden on athletes to document intake accurately, and the time required by sports dietitians to code data correctly(Reference Braakhuis, Meredith and Cox23) mean that dietary assessment may be conducted infrequently or not at all. Technology-based dietary assessment methods offer an appealing and cost-effective approach, particularly for screening or monitoring large groups of athletes. Advances in technology may facilitate automation of certain aspects of dietary assessment, reduce cost and respondent burden(Reference Stumbo24–Reference Boushey, Spoden and Zhu26); however, existing online dietary applications typically focus on evaluating macro- and/or micronutrient intake and have often not been validated in an athlete population.
A valid and reliable diet quality tool that rapidly evaluates dietary intake and habits of athletes would therefore be invaluable to sports nutrition practitioners. A self-administered electronic tool could assist in the assessment of dietary intake at a certain stage of the training cycle (e.g. pre-season), identify athletes at risk of inadequate intake and who may benefit from further nutrition investigation or evaluate the effectiveness of a nutrition intervention programme if implemented longitudinally. The recently developed Athlete Diet Index (ADI) has been previously evaluated for relevance and utility by Australian athletes(Reference Capling, Gifford and Beck27); we now aim to determine the relative validity and reliability of the ADI in an elite athlete population.
Methods
Study design
For validation of FFQ or short dietary surveys such as the ADI, Cade et al. (Reference Cade, Thompson and Burley28) suggest the test instrument should be administered prior to the reference measure to ensure the participants encounter the test method independent of the reference method (i.e. 4-d estimated food record (4-dFR)). Furthermore, the test–retest administration of the ADI was conducted prior to the food record as the reference measure may draw participants’ attention to their dietary intake(Reference Cade, Thompson and Burley28,Reference Willett, Lenart and Willett29) and influence the accuracy of completing the ADI afterwards. Relative validity and test–retest reliability of the ADI were therefore undertaken over three phases (Fig. 1). Athletes completed the ADI using a portable electronic device (iPad mini™) in the presence of one researcher (L. C.) on two occasions, administered 2 weeks apart. A maximum of 2 weeks between administrations was selected to minimise potential modification of dietary intake due to periodised training or change in routine (e.g. competition or travel). To assess reliability, scores derived from the two administrations (i.e. first administration (Adm-1) and second administration (Adm-2)) were compared. At the Adm-1, female athletes also completed a modified Low Energy Availability in Females Questionnaire (LEAF-Q)(Reference Melin, Tornberg and Skouby30) to compare with the score derived from Adm-1. Stature and body mass were measured at Adm-1, while body mass alone was measured at Adm-2 to indicate weight stability between administrations. A comparison of ADI scores derived from Adm-1, Adm-2 and the mean of the two administrations (mAdm) were compared with scores derived from a 4-dFR completed within 7 d following Adm-2. The minimum length of time between Adm-1 and the first day of recording in the 4-dFR was 3 weeks; therefore, it was possible the dietary intake of the athlete participants was modified within this 3–4-week time frame due to periodisation of the training load(Reference Thomas, Erdman and Burke14). mAdm scores were therefore used to assess relative validity and were compared with scores derived from the 4-dFR. Lastly, construct validity was evaluated by comparing mAdm scores against nutrient intakes obtained by the 4-dFR. All participants provided written informed consent prior to commencement of the study. The study was approved by the University of Sydney Human Research Ethics Committee (protocol number: 2018/927).

Fig. 1. Overview of the study design outlining the testing process for the test–retest reliability (phases 1 and 2) and relative validity (phase 3) evaluation. Images sourced from Microsoft PowerPoint (Microsoft Office 2010). ADI, Athlete Diet Index; LEAF-Q, Low Energy Availability in Females Questionnaire.
Participants
A formal invitation seeking athlete participation was sent to a convenience sample of head coaches of sporting programmes at an Australian state-based sports institute (online Supplementary material 1). Elite athletes (≥16 years of age) who had competed at state level or higher in their chosen sport were eligible to participate in the study. Phase 1 of the study was commenced when athletes presented prior to a scheduled training session or formal nutrition screening session as arranged with the head coach. Stretch stature and body mass (wearing light clothing and no shoes) were recorded in duplicate (mean data used in subsequent analysis) immediately prior to Adm-1 using a standardised protocol(Reference Marfell-Jones, Vaquero-Cristóbal and Esparza-Ros31) and measured to the nearest 0·1 cm using a wall-mounted stadiometer (Holtain Limited) and to the nearest 0·1 kg using portable electronic scales (A&D HW-200KGL), respectively. BMI was calculated by dividing the body mass (kg) by height in square metres (kg/m2). Weight stability between administrations was assessed by measuring body mass immediately prior to Adm-2 using the same protocol and electronic scales (A&D HW-200KGL).
Athlete Diet Index
The concept, design and development of the ADI including evaluation of the content and face validity have been described elsewhere(Reference Capling, Gifford and Beck27). Briefly, the ADI is uniquely tailored to athletes and involves the reporting of intake of serves of core foods (i.e. fruit, vegetables, grains, breads and cereals, dairy products and alternatives, and meat and alternatives), discretionary foods and alcohol over the past 7 d (i.e. Core Nutrition); indicators for specific micronutrients such as Ca and Fe that might have increased requirements in athletes (i.e. Special Nutrients); and patterns of dietary behaviour specific to athletes undertaking a rigorous training schedule (i.e. Dietary Habits). Information about food variety, special diets and intolerances, supplement use and culinary skills is also captured. The ADI was developed using FileMaker™ Pro 16 software programme (FileMaker Inc., 2017).
Scoring matrix
A scoring matrix was developed using a selection of ADI items that measure the intake of core and discretionary foods, markers of healthy dietary habits (i.e. variety of different fruits and vegetables, frequency of selecting whole-grain foods and frequency of selecting reduced-fat dairy products) and preferred dietary behaviours (e.g. eating and drinking around training, inclusion of a range of core food groups and following a regular meal pattern). Core food groups (i.e. fruit, vegetables, grains and dairy products) were reported as daily intake, while meat and alternatives, and discretionary foods were reported as weekly intake and were summed and then divided by seven to convert into daily equivalents. Variety of fruits and vegetables were expressed as the number of different types consumed over the past 7 d. Key components were quantified, weighted for importance and assigned cut-off values based on adherence to the Australian Guide to Healthy Eating(1) and international sports nutrition recommendations(Reference Thomas, Erdman and Burke14). Contentious items were discussed by members of the research team (L. C., J. A. G., K. L. B., V. M. F. and H. O’C.) to reach resolution regarding weighting for importance and cut-off values. A maximum score (out of a possible 125) was applied for participants who met recommendations, with pro-rated scores applied for lower intakes and less desirable habits (e.g. skipping one or more main meals on a regular basis). A score ≥90 was classified as exceeds recommendations (i.e. Gold status); a score 66–89 was classified as meets recommendations (i.e. Silver status); while a score ≤65 was classified as below recommendations (i.e. Bronze status). Non-scored items (e.g. medical and special dietary information, current training schedule, supplement use and culinary skills) captured by the ADI are not reported here. An example of ADI items including minimum and maximum criteria and scores are outlined in online Supplementary material 2.
Four-day estimated food record
Immediately following the completion of Adm-2, dietary intake was recorded on four non-consecutive days within a 7-d period. The days were selected based on the athletes’ current training schedule and included three weekdays, involving one heavy training day (i.e. a training day involving two or more sessions or heavy training load), and one light training or rest day (i.e. a training day involving a lighter training load or no training), in addition to one weekend day. Athletes were provided with detailed written and visual instructions (i.e. demonstration video produced by collaborators at Massey University, New Zealand) and were asked to estimate quantities of foods and beverages using standard household measures, commercial brand names of products and by reporting recipes or specific preparation methods. Dietary intake data were collected by conventional paper-based method supported by photographic images, food packaging and/or recipes. Participants were sent a series of reminders (i.e. sent on 1, 3 and 7 d post-Adm-2) via email or SMS with a final reminder sent 10 d post-Adm-2. Incomplete or records that failed to be returned within 10 d post-Adm-2 were not included in the analysis. Returned 4-dFR were reviewed by one researcher (L. C.) and cross-checked for missing or incomplete items using a checklist designed for this study (online Supplementary material 3). Missing or incomplete items were subsequently clarified with participants over the phone or via email.
Food intake data were entered by a trained dietitian (F. H.) and analysed using dietary analysis software (FoodWorks version 10; Xyris). Analysed dietary data were reviewed for accuracy by one researcher (L. C.) before being coded into serves of core food group equivalents (i.e. fruit, vegetables, grains, dairy products and alternatives, and meat and alternatives), discretionary foods and alcohol based on the Australian Guide to Healthy Eating(1) and a coding reference document developed for this study (online Supplementary material 4). Discretionary items included foods with low nutrient density and/or high levels of Na, sugar and/or saturated fat (e.g. chocolate, biscuits, cakes, fried foods and chips)(1). Discretionary items that provided a source of key nutrients (i.e. Ca, Fe, carbohydrate and/or protein) equivalent to a standard serve or more were coded as one or more core food group equivalents (e.g. pizza was coded as a grain and dairy food) instead of a discretionary item. Cereal and nut-based snack bars with a higher nutrient density(Reference Curtain and Grafenauer32) were coded as a grain food. Coding decisions were made by one researcher (L. C.), and contentious decisions were reviewed by members of the research team (L. C., J. A. G., V. M. F., F. H. and H. O’C).
Statistical analysis
Descriptive analyses are presented as mean values and standard deviations for demographics, total and sub-scores, and dietary intake data. Data were checked for normality using Shapiro–Wilk tests and histograms for curves, skewness and kurtosis. Average energy, macro- and micronutrient intakes were compared relative to the Australian Guide to Healthy Eating(1) and Nutrient Reference Values for Australia and New Zealand(33), in addition to current sports nutrition guidelines(Reference Thomas, Erdman and Burke14). Revised Goldberg cut-offs described by Black(Reference Black34) were calculated based on a physical activity level of 1·8 for moderate activity(33) and applied to identify possible misreporting by participants. Reported energy intake (EI) was compared with predicted BMR and expressed as a ratio of EI:BMR, where participants with EI:BMR ≤ 1·19 or ≥2·72 were considered under-reporters (UR) or over-reporters, respectively(Reference Black34). Data were subsequently analysed with and without the inclusion of potential UR or over-reporters. Comparison with a reference method of dietary assessment can provide a measure of relative validity(Reference Marks, Webb and Rutishauser35) and refers to the extent to which the test method (i.e. ADI) agrees with a comparative method (i.e. 4-dFR) when measuring the same underlying concept (i.e. diet quality scores)(Reference Gleason, Harris and Sheehan36,Reference Lombard, Steyn and Charlton37) . Relative validity was evaluated by comparing mean scores derived from the mean of the two ADI administrations (mAdm) with mean scores derived from the 4-dFR (following conversion into food group equivalents) using Spearman’s rank correlation coefficient (r s). Agreement between scores was also assessed using B–A plots with level of agreement (LOA) determined as the mean difference ± 1·96 SD and bias determined via linear regression analysis(Reference Bland and Altman38). Construct validity was assessed by comparing mAdm scores with nutrient intake derived from the 4-dFR using Spearman’s correlation, and by examining differences between mAdm scores (i.e. < and > median score) and nutrient intake using independent t tests. Strength of Spearman’s correlation was interpreted as low (0·30–0·50), moderate (0·50–0·70), high (0·70–0·90) or very high (≥0·90)(Reference Hinkle, Wiersma and Jurs39). A minimum sample size of fifty participants is desirable for validity of FFQ or short dietary questionnaire(Reference Cade, Thompson and Burley28). Test–retest reliability was assessed by comparing scores derived from the two ADI administrations using paired t tests, B–A plots and intraclass correlation coefficients (ICC) based on absolute agreement, two-way random effects model. Agreement was interpreted as poor (≤0·50), moderate (0·50–0·75), good (0·75–0·90) or excellent (≥0·90)(Reference Koo and Li40). All statistical analyses were performed using IBM SPSS Statistics version 26.0 (IBM Corp.) with significance level accepted as P < 0·05.
Results
Eighty-three elite athletes (55 female; 18·8 (sd 4·2) years) consented to participate in the study between June and December 2019. Of the eighty-three athletes who completed Adm-1, sixty-eight participants completed Adm-2. Fifteen athletes (18 %) withdrew due to time constraints (n 9), competition commitments (n 4) or illness/injury (n 2). Of the participants who completed Adm-2 (n 68), a further 18 (26 %) athletes did not complete phase 3. Twelve participants did not respond to follow-up reminders to return their 4-dFR, while six participants were unavailable due to competition commitments. Therefore, validity was evaluated in fifty participants who completed all three study phases (i.e. Adm-1, Adm-2 and 4-dFR), while test–retest reliability was assessed in sixty-eight participants who completed both administrations of the ADI (online Supplementary material 1). Participants represented endurance (i.e. rowing) and team (i.e. volleyball, water polo and softball) sports, and most were competing at national or international level (84·3 %). Participant characteristics for the three study phases are presented in Table 1. There were no differences observed in demographic variables between participants included in the reliability or validity analyses compared with those who were excluded, with the exception of mean stature (i.e. 186·9 cm, Adm-2 v. 176·6 cm, 4-dFR; P < 0·05). Eight female athletes (i.e. rowing n 1, volleyball n 3, water polo n 3 and softball n 1) had an elevated LEAF-Q score; however, there was no association observed between the LEAF-Q score and the score derived from Adm-1 (P = 0·56) for female participants (n 55).
Table 1. Characteristics of participants included in the two administrations of the Athlete Diet Index (ADI) and participants who completed the comparative dietary assessment method (i.e. 4-d estimated food record (4-dFR))
(Mean values and standard deviations; numbers of participants)

Adm-1, first administration; Adm-2, second administration.
* The values included for primary sport, representative calibre, stage of training and training hours for the participants who completed the 4-dFR (n 50) were reported at Adm-2.
Dietary analysis from the 4-day estimated food record
The mean EI from the 4-dFR (n 50) was 10·4 (sd 3·3) MJ/d (females 9·3 (sd 2·3) MJ/d; males 13·5 (sd 3·8 MJ/d). Mean protein and carbohydrate intakes were 118·9 (sd 42·8) g/d (1·7 (sd 0·6) g/kg per d) and 270·6 (sd 80·9) g/d (3·8 (sd 1·2) g/kg per d), respectively (online Supplementary material 5). Overall, 84 % of athletes met the suggested protein recommendation (1·2 g/kg per d), while only 18 % of athletes met the minimum carbohydrate recommendation for moderate-intensity exercise (5 g/kg per d)(Reference Thomas, Erdman and Burke14). More than half (54 %) of the participants reported a carbohydrate intake between 3 and 5 g/kg per d indicating a moderate–low carbohydrate intake relative to sports nutrition recommendations(Reference Thomas, Erdman and Burke14). Six athletes (5 female) were classified as UR (i.e. EI:BMR ≤ 1·19; range mean EI: 5341–7944 kJ/d), while none was classified as over-reporters. Only 24 % of females (16–18 years) achieved an adequate intake of Ca compared with estimated average requirements(33). In comparison, 16 % of females and 33 % of males (16–18 years) achieved an adequate intake of Ca compared with recommended dietary intakes, while just 12 % of females (16–18 years) and 17 % of females (19–30 years) achieved an adequate Fe intake compared with recommended dietary intake(33). Overall, more than 75 % of athletes met the requirements for all other micronutrients compared with estimated average requirements (online Supplementary material 5).
Relative validity of the Athlete Diet Index
On average, there were 2·9 (sd 3.·3) d between Adm-2 and the first day of recorded intake in the 4-dFR. There were no differences between total scores achieved from Adm-2 or mAdm compared with the 4-dFR scores (n 50), while Adm-1 total scores were higher compared with the 4-dFR scores (85·7 v. 81·4), mean difference 4·3 (95 % CI 0·1, 8·6; P = 0·04) (online Supplementary material 6). Differences were also observed between Core Nutrition sub-scores for Adm-1 and 4-dFR (P < 0·05), and mAdm and 4-dFR (P < 0·05) (online Supplementary material 6). Comparison of the mAdm following the removal of the six UR did not result in any differences between scores. Although the scores achieved from Adm-2 were more closely associated with the scores derived from the 4-dFR, the research team agreed that a comparison with the mAdm would provide a more accurate indication of relative validity; therefore, mAdm scores derived from all participants (n 50) were used for the remainder of the validity tests. Spearman’s rank-order correlation coefficient was moderate (r s 0·69; P < 0·001) (Table 2). Association between the mAdm and 4-dFR sub-scores was moderate (Core Nutrition: r s 0·58; P < 0·001; Special Nutrients: r s 0·66; P < 0·001) to high (Dietary Habits: r s 0·76; P < 0·001) (Table 2). Bland–Altman (B–A) analysis of the difference between mAdm scores and 4-dFR scores showed a positive mean difference of 3·2 (LOA −21·3, 27·7), and the regression line demonstrated no indication of systematic bias (y = 6·90–0·04 × x) (95 % CI −0·3, 0·2; P = 0·73) (Fig. 2). There was no systematic bias for the Core Nutrition, Special Nutrients and Dietary Habits sub-scores (online Supplementary material 7a).
Table 2. Mean total and sub-scores derived from two administrations (mAdm) and 4-d estimated food record (4-dFR) and a comparison of scores between assessment methods (n 50)
(Mean values and standard deviations; 95 % confidence intervals; Spearman’s rank correlation coefficients (r s))
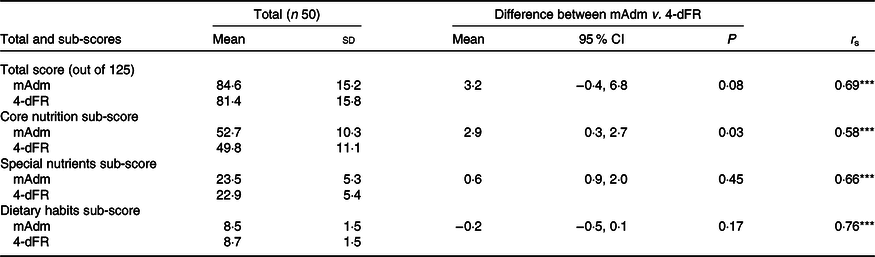
*** P < 0·001.

Fig. 2. Bland–Altman plot of the difference between the mean score from the two administrations (mAdm) and the score derived from the estimated food record (FR), and the mean score derived from mAdm and FR scores (n 50). The bold middle line represents the mean difference between mAdm and FR scores, while the dotted lines represent the upper and lower levels of agreement ± 1·96 SD. The fitted regression line is y = 6·90–0·04 × x (95 % CI −0·3, 0·2; P = 0·78), indicating no systematic bias.
Differences were reported between serves of core foods, discretionary foods and alcohol obtained by mAdm compared with the 4-dFR (Table 3). Spearman’s correlation was moderate for vegetables (r s −0·57), meat and alternatives (r s 0·57), dairy products (r s 0·61) and discretionary foods (r s 0·63), while serves of fruit, grains and alcohol had lower correlations between the two dietary assessment methods (Table 3).
Table 3. Serves of core foods, discretionary foods and alcohol reported by mean of the two administrations (mAdm) and obtained by the 4-d estimated food record (4-dFR) and a comparison between the two dietary assessment methods (n 50)
(Mean values and standard deviations; 95 % confidence intervals; Spearman’s rank correlation coefficients (r s))

**P < 0·01, ***P < 0·001.
† Combination of weekly serves divided by 7.
‡ Standard serves of alcohol per week.
Construct validity of the Athlete Diet Index
The association between mAdm score and mean EI obtained from the 4-dFR was significant but weak (r s 0·40; P < 0·01), and the association between mAdm score and mean EI relative to body mass (i.e. kJ/kg) was also weak (r s 0·32; P < 0·05). A further evaluation of the association between mAdm score and mean EI for males (n 13) was moderate (r s 0·63; P < 0·05), while for females (n 37), the association was weak (r s 0·38; P < 0·05). However, there was no association observed between mAdm score and mean EI relative to body mass (kJ/kg) for females (r s 0·27; P = 0·11) or males (r s 0·44; P = 0·13), respectively. Spearman’s correlation between mAdm scores and nutrients derived from the 4-dFR was moderate for Ca (r s 0·59) and fibre (r s 0·52), while Fe and vitamin E (r s 0·44), carbohydrate (r s 0·43), vitamin C (r s 0·40), Zn (r s 0·39), protein (r s 0·37) and fat (r s 0·30) had lower correlations. However, there was no association between mAdm scores and vitamin A (r s 0·19; P = 0·20) or Na (r s 0·15; P = 0·30).
More than 26 % of athletes (n 18) achieved a mAdm score ≥90 (i.e. exceeds recommendations), and 41 % (n 28) achieved a score 66–89 (i.e. meets recommendations), while <6 % of athletes (n 4) scored ≤65 (i.e. below recommendations). Only one of the four athletes who achieved a low mAdm score (≤65) was also identified as a potential UR. Due to the small sample size, relative validity was unable to be assessed by tertiles; therefore, participants were reclassified into two groups comprising scores equal to or higher than the median mAdm score (≥85) (i.e. HmAdm; n 26) and scores lower than the median mAdm score (<85) (i.e. LmAdm; n 24). Mean absolute energy and nutrient intakes obtained from the 4-dFR were higher (range: 3·8–33·3 % difference) for HmAdm scores compared with LmAdm scores (Table 4). Differences in nutrient intake were significant for all nutrients, except carbohydrate reported in g/kg (P = 0·06), saturated fat (P = 0·06), Na (P = 0·64) and vitamin C (P = 0·12). However, mean differences in nutrient intake when reported per MJ were significant only for Ca (mg/MJ) (Table 4).
Table 4. Mean energy and nutrient intake obtained by the 4-d estimated food record compared between the lower and higher total mAdm scores
(Mean values and standard deviations; 95 % confidence intervals)

LmAdm, lower total score than median score (<85 points); HmAdm, equal to or higher total score than median score (≥85 points); t, independent t test; EI, energy intake.
* P value applies to the comparison between HmAdm and LmAdm scores for all participants (n 50).
† Under-reporters defined as EI:BMR ≤ 1·19 (n 6).
‡ Unsaturated fat is the sum of polyunsaturated and monounsaturated fats.
§ Total vitamin A equivalents.
Reliability of the Athlete Diet Index
The two online administrations of the ADI were conducted 13·8 (sd 0·9) d apart. The mean change in body mass between administrations was −0·1 (sd 0·9) kg, or 0·8 (sd 0·6) % of total body mass (P = 0·31), with ranges of 0·0–2·9 kg and 0·0–3·5 % of total body mass. The mean total score (out of a possible 125) was 84·1 (SD 15·2) (range: 42·5–114·0, median 85·0), while mean sub-scores were 52·4 (sd 10·3) (Core Nutrition), 23·5 (sd 5·3) (Special Nutrients) and 8·3 (sd 1·6) (Dietary Habits). A comparison between total and sub-scores derived from the two administrations is outlined in Table 5. There were no differences between the mean total score and sex (P = 0·79), sport type (P = 0·75) or sporting calibre (P = 0·23) reported by participants (n 68) who completed both administrations of the ADI.
Table 5. Mean total and sub-scores derived from first administration (Adm-1), second administration (Adm-2) and the mean of the two administrations and comparison between scores (n 68)
(Mean values and standard deviations; 95 % confidence intervals; intra-class correlations (ICC))

*** P < 0·001.
There was no difference between total scores on the two occasions of administration, mean difference 1·9 (95 % CI −0·5, 4·4; P = 0·12). The reliability of the ADI was good (ICC = 0·80, 95 % CI 0·69, 0·87; P < 0·001), indicating that the total score was measured similarly at the two time points (Table 5). There were also no differences between Core Nutrition sub-scores, mean difference 0·2 (95 % CI −1·7, 2·1; P = 0·84), or Dietary Habits sub-scores, mean difference 0·1 (95 % CI −0·2, 0·4; P = 0·56). However, differences were noted between the sub-scores for Special Nutrients, mean difference 1·7 (95 % CI 0·8, 2·6; P < 0·001) (Table 5).
B–A analysis for repeated measures showed a mean difference of 1·9 (LOA −17·8, 21·7), and the regression line demonstrated no indication of systematic bias (y = 4·57–0·03 × x) (95 % CI −0·2, 0·1; P = 0·70), supporting the null hypothesis that the scores at the two time points were equally variable (Fig. 3). B–A analysis of the sub-scores for Core Nutrition, Special Nutrients and Dietary Habits is presented in online Supplementary material 7b.

Fig. 3. Bland–Altman plot of the difference between the score measured at the first administration (Adm-1) and the second administration (Adm-2), and the mean score of the two administrations (n 68). The bold middle line represents the mean difference between scores, while the dotted lines represent the upper and lower levels of agreement ± 1·96 SD. The fitted regression line is y = 4·57–0·03 × x (95 % CI −0·2, 0·1; P = 0·70), indicating no systematic bias. ADI, Athlete Diet Index.
There were no differences between ADI administrations in the reported serves of fruit, vegetables and grains, but there was a difference in serves of meat and alternatives (1·7 v. 1·6; P < 0·01), and discretionary foods (1·8 v. 1·5; P < 0·001) between administrations (Table 6). The ICC were moderate for vegetables (ICC = 0·50), dairy products (ICC = 0·57), alcohol (ICC = 0·59), meat and alternatives (ICC = 0·72), and discretionary foods (ICC = 0·75); however, the ICC were lower for fruit (ICC = 0·42) and grains (ICC = 0·33).
Table 6. Serves of core foods, discretionary foods and alcohol reported by first administration (Adm-1) and second administration (Adm-2) and comparison between the two administrations (n 68)
(Mean values and standard deviations; 95 % confidence intervals)

* Combination of weekly serves divided by 7.
† Standard serves of alcohol per week.
Discussion
The results of this study demonstrate the relative validity and reliability of the electronic ADI to assess the diet quality of elite Australian athletes. In the assessment of relative validity, total ADI score was moderately correlated (r s 0·69) with scores derived from the 4-dFR, and correlations for the ADI sub-scores were moderate (r s 0·58, Core Nutrition; r s 0·66, Special Nutrients) to high (r s 0·77, Dietary Habits). While differences in methodology make it difficult to relate to other studies; our findings can be compared with the relative validity of a general population diet quality tool in adolescent New Zealanders aged 14–18 years(Reference Wong, Parnell and Howe41). They reported overall correlation between methods was fair (r 0·39; range: 0·21–0·57). Few have assessed the relative validity of dietary assessment methods specific to athletes(Reference Ward, Hunt and Burstyne Berg42–Reference Baker, Heaton and Stein44). The correlations between ADI scores and 4-dFR scores were higher than those who compared specific nutrient intakes such as Ca obtained by a self-administered checklist (ICC = 0·41)(Reference Ward, Hunt and Burstyne Berg42), or antioxidant intake of rowers reported by FFQ (r 0·38)(Reference Braakhuis, Hopkins and Lowe43) compared with a weighed 6- or 7-dFR, respectively. Baker et al. (Reference Baker, Heaton and Stein44) demonstrated validity between a digital 24-h dietary recall tool and 24-h dietary recall interviews for energy (r 0·52), protein (r 0·61) and carbohydrate (r 0·29) at the group level but noted large variations in individual dietary intake estimates, particularly in athletes with higher energy and nutrient intakes. In the present study, B–A analysis demonstrated that differences between mAdm scores and 4-dFR scores fell within the upper and lower LOA for all but three athletes. However, variation in absolute magnitude of agreement between methods (i.e. LOA −21·3, 27·7) may be due to the range of scale in scoring (i.e. out of 125), and day-to-day variation of dietary intake in elite athletes over the 3–4-week reporting period. Apart from vegetables, differences were observed in the absolute intake of all food groups between the mAdm and 4-dFR, with the largest variation in serves of fruit, grains and meat and alternatives. Potential explanation for variation in intake between the two ADI administrations and the 4-dFR includes modification of usual intake due to recording, absence of some foods (e.g. red meat) or smaller serve sizes (e.g. fruit and dairy products) consumed during the 4 d of recording, in addition to within-person dietary intake variation over the reporting period.
Correlations between mAdm and the 4-dFR for serves of vegetables, dairy products, meat and alternatives, and discretionary foods (range r s 0·42–0·63) and for serves of fruit, grains and alcohol (range r s 0·38–0·43) were consistent with those reported by Collins et al. (Reference Collins, Burrows and Rollo45) who compared a diet quality tool with FFQ in adults (r 0·38, fruit; r 0·45, vegetables; r 0·51, meat and alternatives; r 0·53, dairy products). However, only two studies have compared intake of food groups between dietary assessment methods in an athlete cohort(Reference Sunami, Sasaki and Suzuki46,Reference Fogelholm and Lahti-Koski47) . Sunami et al. (Reference Sunami, Sasaki and Suzuki46) compared the dietary intake of college athletes from a previously validated semi-quantitative FFQ in adults with three non-consecutive 24-h dietary recall and found median correlations for nineteen food group classifications were r s 0·30 (range: −0·08 to 0·72). While in an older study, Fogelholm & Lahti-Koski(Reference Fogelholm and Lahti-Koski47) compared nutrient intake of male athletes derived from FFQ and 7-dFR. In the present study, correlations between mAdm and 4-dFR for serves of food were an improvement on previous work reported in athlete populations.
A small number of participants (n 4) had a low ADI score (≤65) which indicated that dietary intake was below recommendations. Analysis of the 4-dFR confirmed the ADI correctly identified an inadequate intake of protein, carbohydrate, Fe and Ca in three athletes compared with sports nutrition guidelines(Reference Thomas, Erdman and Burke14). The fourth athlete reported a low intake of fruit, vegetables and whole grains, and a high intake of discretionary foods (i.e. chips, doughnuts and pizza) which contributed to a higher energy and nutrient intake overall. Most athletes (94 %) achieved a moderate to high total score (mean score 84·1 out of 125), while a range of scores achieved from 42·5 to 115·0 indicate that the ADI was able to identify athletes with low, medium or high diet quality. Differences in scoring make comparison with other diet quality tools challenging; however, Burrows et al. (Reference Burrows, Harries and Williams12) also classified the diet quality of adolescent rugby union players as good (median Australian Recommended Food Score = 34 out of 73). In contrast, sub-optimal diet quality has been reported in marching artists and adolescent volleyball athletes(Reference McConnell, McPherson and Woolf9,Reference Zanella, August and Alves10) . We found the dietary intake of our study participants was comparable to the dietary intake of elite team sport athletes where athletes met or exceeded recommendations for protein and fat, while carbohydrate intake was below recommendations(Reference Burrows, Harries and Williams12,Reference Jenner, Buckley and Belski20) . Apart from Ca and Fe, the intake of key micronutrients was achieved for most participants compared with general population dietary recommendations(33). While estimated average requirements for micronutrients are acceptable to guide dietary assessment of athletes(Reference Fogelholm, Burke and Deakin48), sports nutrition recommendations suggest that athletes may have a higher requirement for some micronutrients, particularly those athletes who restrict EI and/or limit food variety or specifically avoid foods that are rich in Ca and Fe(Reference Thomas, Erdman and Burke14,Reference Fogelholm, Burke and Deakin48) . An association was observed between a higher total score (HmAdm) with a more favourable absolute nutrient intake compared with a lower total score (LmAdm). These results indicate that the ADI is an appropriate tool to assess diet quality and has the potential to identify participants with a lower intake of certain micronutrients that may have an increased requirement in athletes(Reference Thomas, Erdman and Burke14,Reference Fogelholm, Burke and Deakin48) . Our findings are supported by population evidence that a healthy eating pattern consistent with current guidelines is associated with a superior nutritional status(1,2,Reference Wirt and Collins6) .
The ADI was found to have good test–retest reliability as demonstrated by ICC for the total score (ICC = 0·80) and sub-scores (range ICC: 0·74–0·75), confirming the ADI measured similarly at the two time points. These results align with others investigating the reliability of general population diet quality indices in Australian adults (ICC = 0·87(Reference Collins, Burrows and Rollo45); ICC = 0·71(Reference Hendrie, Rebuli and Golley49)). Only two studies have conducted reproducibility of a novel dietary assessment method in athletes(Reference Ward, Hunt and Burstyne Berg42,Reference Braakhuis, Hopkins and Lowe43) , and our results were comparable or superior to these studies. There was good reliability between the sub-scores for Core Nutrition, Special Nutrients and Dietary Habits across the two administrations; however, there was a difference in the sub-scores for Special Nutrients. The Special Nutrients sub-score was based on modelling from general population guidelines(1) and is composed of ADI items reflecting a dietary pattern that provide specific nutrients (e.g. red meat and Fe intake; dairy foods and Ca intake). Differences in sub-scores could have been influenced by variation in reported serves of meat and alternatives between the two administrations. Similarly, meat has been reported as the least reliable component in reliability assessment of diet quality tools in other populations(Reference Collins, Bucher and Taylor50–Reference Sui, Raubenheimer and Rangan52). While standard serve sizes for most food groups were visually depicted in the ADI as outlined in the Australian Guide to Healthy Eating(1), visual images of red meat and poultry were depicted as typically consumed portions(Reference Collins, Bucher and Taylor50,Reference Zheng, Wu and Louie51) . The ability for participants to estimate portion size is widely recognised as a limitation of self-reported diet methodology(Reference Tabacchi, Amodio and Di Pasquale53,Reference Burke, Lundy and Fahrenholtz54) . Lastly, the test–retest reliability and strong correlation (r s 0·76) of the Dietary Habits sub-score may provide an indication of particular dietary behaviours (e.g. eating and drinking around training, following a regular meal pattern) that support a rigorous training schedule and is a unique feature of the ADI compared with general population diet quality tools.
Limitations and strengths
There are several limitations to this study. While the sample size (n 50) was acceptable at a group level for validity(Reference Cade, Thompson and Burley28), a larger sample size (i.e. 100–200 participants) would be preferable(Reference Cade, Thompson and Burley28,Reference Willett, Lenart and Willett29,Reference Serra-Majem, Frost Andersen and Henríque-Sánchez55) . However, our sample size was comparable to validity of diet quality indices in Australian adults(Reference Collins, Burrows and Rollo45,Reference Hendrie, Rebuli and Golley49) and New Zealand adolescents(Reference Wong, Parnell and Howe41), and dietary surveys in athletes(Reference Burke, Cox and Cummings17). Study strengths include the calibre of athlete participants and the evaluation of the ADI in a free-living setting(Reference Jones56). Although a greater proportion of female participants and the small number of sporting types are considered, limitations due to the variation of athlete’s energy requirements were based on sex, body size and sporting type(Reference Manore, Thompson, Burke and Deakin13). Further research in a larger sample of athletes from a wider range of sporting backgrounds is therefore suggested.
While the food record was considered a suitable comparative dietary assessment method(Reference Willett, Lenart and Willett29,Reference Tabacchi, Amodio and Di Pasquale53,Reference Burke, Lundy and Fahrenholtz54) , both methods involved in self-reporting of dietary intake, therefore, are prone to a degree of mis- or under-reporting(Reference Cade, Thompson and Burley28). Bias associated with self-reported dietary assessment includes potential modification of usual intake, under-reporting of less healthy options, under-recording of portion sizes and other reporting errors(Reference Magkos and Yannakoulia21,Reference Capling, Beck and Gifford22,Reference Burke, Lundy and Fahrenholtz54) . The athletes were relatively young (mean age 18·8 years) which may contribute to difficulty in reporting portion sizes accurately(Reference Tabacchi, Amodio and Di Pasquale53). Furthermore, mis-reporting has been associated with increasing energy expenditure particularly for individuals with higher energy needs(Reference Magkos and Yannakoulia21,Reference Barnard, Tapsell and Davies57) . This may be due to the difficulty in estimating large portion sizes and frequent eating occasions resulting in the omission of dietary items(Reference Magkos and Yannakoulia21,Reference Capling, Beck and Gifford22,Reference Barnard, Tapsell and Davies57) . Despite a weak association observed between the mAdm score and mean EI obtained from the 4-dFR, longer periods of reporting may be required to capture the variation in macronutrient intake due to a periodised training load. In addition, a longer reporting period may be required to reflect usual intake of some micronutrients (e.g. Fe, vitamin C and vitamin A) due to day-to-day variation of intake of foods containing these nutrients(Reference Braakhuis, Meredith and Cox23,Reference Fogelholm, Burke and Deakin48,Reference Basiotis, Welsh and Cronin58) . Dietary assessment is one aspect involved in determining the nutrient status of athletes which may also include the evaluation of anthropometric, biochemical and/or clinical components(Reference Larson-Meyer, Woolf and Burke59). Further validation of the ADI compared with biochemical indicators would be valuable.
This study provides a valuable contribution to the literature due to limited validity of dietary assessment instruments specific to athlete populations(Reference Capling, Beck and Gifford22). The relative validity and reliability of the ADI were consistent with or superior to diet indices used for and in the wider population. The self-administered, electronic ADI automates certain aspects of dietary assessment, which offers an appealing and cost-effective approach, particularly for assessing large groups of athletes. The short test–retest reporting period (i.e. 2 weeks) was designed to minimise potential dietary modification due to periodisation of training load within a 4-week micro-cycle(Reference Wardenaar, Steennis and Ceelan60). Standard protocols were used to enhance the reliability of the FR by reviewing and cross-checking for missing or ambiguous items with athletes(Reference Braakhuis, Meredith and Cox23) and by quantifying and coding food groups in a consistent manner. The reporting of food groups was beneficial as food group intake is less frequently reported in validation studies compared with energy and macronutrient intake(Reference Burke, Lundy and Fahrenholtz54). However, there were methodological differences between the assessment of the number of serves of core and discretionary foods which may have resulted in a difference between participants’ self-reported intake and expert analysis. Screening the 4-dFR for implausible reporting was important as few have assessed relative validity of dietary intake data reported by athletes using Goldberg cut-offs(Reference Burke, Lundy and Fahrenholtz54). Black(Reference Black34) suggests examination of dietary intake data for misreporting and its possible influence on results; in the current study, removal of (n 6) UR yielded no differences in results. Finally, the lack of association observed between the modified LEAF-Q and Adm-1 score could be due to validation of the LEAF-Q in a different population (i.e. female dancers and endurance athletes from sports such as long distance running and triathlon)(Reference Melin, Tornberg and Skouby30) to the present study.
Conclusions
The ADI is the first validated athlete-specific diet quality tool which has demonstrated good reliability in elite athletes, providing sports dietitians with a promising measure of diet quality. The novel electronic tool rapidly evaluates usual intake of core food groups, essential micronutrients such as Ca and Fe and preferred dietary behaviours. The total ADI score was positively associated with absolute nutrient intake and identified athletes who may be at risk of inadequate dietary intake. While the ADI provides a rapid and efficient method of dietary assessment of elite athletes, it is not intended to replace expert guidance from a sports dietitian, including individual counselling, practical advice or behaviour change strategies. Further evaluation of the performance of the ADI in a larger group of athletes from a range of different sporting backgrounds is suggested.
Acknowledgements
This research is dedicated to the late Associate Professor Helen O’Connor who was instrumental in the overall study design in her capacity as primary supervisor of L. C. during her PhD candidature.
This study was supported by a research grant from the Queensland Academy of Sport’s Sport Performance Innovation and Knowledge Excellence Unit, Australia. The authors would like to thank the sports dietitians and coaches for supporting athlete participation and the athletes who generously gave up their time to participate in this study. Fellow PhD candidate, Ryan Tam, is gratefully acknowledged for his technical expertise in creating the automated scoring on FileMaker™ Pro 16 software programme (FileMaker Inc., 2017).
All authors contributed to the study design; data were collected and analysed by L. C. and F. H., while data interpretations were undertaken by L. C., J. A. G., K. L. B., V. M. F., F. H., G. J. S. and H. O’C. All authors (except H. O’C.) provided critical review and approved the final version of the manuscript.
The authors declare no personal or financial conflicts of interest.
Supplementary material
For supplementary materials referred to in this article, please visit https://doi.org/10.1017/S000711452000416X


