


Introduction
Powering remote field instrumentation for long-duration scientific studies is a significant challenge faced by researchers across many disciplines. For polar region studies, the problem is exacerbated by the several months of complete darkness encountered during the winter season, which preclude the use of photovoltaic solar panels to provide energy (Lawrence et al. Reference Lawrence, Ashley and Storey2004, Bauguitte et al. Reference Bauguitte, Brough, Frey, Jones, Maxfield and Roscoe2011). Furthermore, the extreme low temperatures in these regions degrade battery performance, and violent storms often cause damage to wind turbines.
Erebus volcano is one such field site where these issues have been experienced routinely by researchers of the ‘Mount Erebus Volcano Observatory’, a project supported by the US Antarctic Program until 2016. Situated on Ross Island, Antarctica, Erebus is an active, open-vent stratovolcano whose continuous, but relatively benign, volcanic activity makes it particularly suited to close-range, ground-based measurements. Its active phonolitic lava lake, the only one in the world, has made it of particular interest to volcanologists, and many scientific studies have been conducted there since the 1970s. Several of these have relied on measurements recorded by instruments situated at the crater rim (e.g. Oppenheimer et al. Reference Oppenheimer, Lomakina, Kyle, Kingsbury and Boichu2009, Peters et al. Reference Peters, Oppenheimer, Killingsworth, Frechette and Kyle2014b, Ilanko et al. Reference Ilanko, Oppenheimer, Burgisser and Kyle2015, Jones et al. Reference Jones, Kyle, Oppenheimer, Frechette and Okal2015).
In addition to the challenges of maintaining instrument power, running instruments at the crater rim of Erebus is complicated by the presence of corrosive gases in the volcanic plume and the volcanic bombs that are sporadically ejected from the crater by Strombolian explosions occurring in the lava lake. Salt deposition from the plume can also rapidly obscure photovoltaic panels, drastically reducing their efficiency.
Typically, during the summer field seasons, power for instruments at the crater rim has been generated by a combination of photovoltaic panels and wind turbines at a site 0.5 km downslope from the crater rim (and, to an extent, less exposed to the hazards of lava projectiles and volcanic gases) and transferred to the crater via a high-voltage cable. The system is described in more detail in Peters et al. (Reference Peters, Oppenheimer and Kyle2014a). Although this system proved reliable through the summer months, its reliance on solar and wind energy meant that it was incapable of powering instruments year-round. Given the complex and expensive logistics involved in putting researchers at the crater rim of Erebus, year-round data capture by autonomous instruments offers cost benefits as well as considerable scientific potential. Despite the development of several autonomous monitoring systems (e.g. Peters et al. Reference Peters, Oppenheimer and Kyle2014a, Reference Peters, Oppenheimer, Brennan, Lok, Ash and Kyle2018), the lack of a reliable over-winter power system has so far prevented year-round data acquisition at the crater rim of Erebus.
Thermoelectric generators (TEGs) are solid-state devices that convert a flow of heat (i.e. a temperature differential across the device) into electrical current by exploiting the Seebeck effect (Jaziri et al. Reference Jaziri, Boughamoura, Müller, Mezghani, Tounsi and Ismail2019). Although they suffer from relatively low efficiency, their lack of moving parts and inherent robustness make them an attractive technology for harsh-environment energy production (Jones et al. Reference Jones, Jackson, James, Meldrum and Rose2011). The aim of this study is to investigate the feasibility of using TEG-based systems to harvest thermal energy produced by Erebus volcano with the goal of providing a reliable power source for monitoring instruments deployed at the crater rim. A prototype system, referred to subsequently as the ‘Seebeck generator’, was built and trialled at Erebus during December 2014. Here, we describe its design and its deployment on Erebus, and we report and evaluate the results of the field trial.
Methodology
The Seebeck generator developed for this study consists of a coil of copper pipe (the evaporator coil) to provide efficient transfer of heat into the unit from the surrounding ground (Fig. 1). This heat is transferred to the surface via a heat pipe, the function of which is described in detail in Jones et al. (Reference Jones, Jackson, James, Meldrum and Rose2011). To reduce the cost of manufacturing the generator, the heat pipe was made in-house and used water as its working fluid (unlike the Jones et al. (Reference Jones, Jackson, James, Meldrum and Rose2011) system, which used methanol). Water is a reasonable choice for this application, as the hot end of the heat pipe is kept at well above freezing point by the geothermal activity. Initially, the vacuum in the heat pipe was achieved by heating the whole unit to high temperature using blowtorches before sealing it. However, subsequent re-vacuuming was achieved using a vacuum pump. A long hose was used to allow sufficient time to disconnect the pump before it would ingest water from the heat pipe. No wick material was used inside the heat pipe, as this would have added significant complexity to the design and is unnecessary, as the vertical orientation of the pipe is sufficient to return condensed water to the evaporator coil.

Fig. 1. Seebeck generator: A = evaporator coil, B = heat pipe, C = cold-side heat sink, D = data cable, E = top of heat pipe and F = thermoelectric generator chip.
A Custom Thermoelectric 1991G-7L31-12CQ TEG was sandwiched between the top of the heat pipe and the cold-side heat sink. This was terminated across a 1 Ω resistor to give a matched load, and power output from the TEG was monitored by measuring the potential difference across the load resistor using a Campbell Scientific CR1000 data logger.
A Nofan CR-95C was used as the cold-side heat sink. This is a commercial, off-the-shelf unit designed for cooling computer central processing units. It uses small heat pipes to rapidly transfer heat away from the cooling surface. The unit was supplied with water as its working fluid, which would have frozen in the low Antarctic temperatures. We therefore replaced the water with methanol, re-vacuumed the unit and sealed it with solder.
Analog Devices TMP36 temperature sensors were mounted on the evaporator coil on the top of the heat pipe (effectively the hot side of the TEG) and within the ring of the cold-side heat sink (approximating to atmospheric temperature) to monitor heat transfer through the generator. These were connected to additional channels on the data logger.
The Seebeck generator was deployed on Erebus in December 2014 and operated uninterrupted for a period of 11 days until the end of the fieldwork period. Prior to deployment, several sites around the crater rim were surveyed to assess their suitability. Criteria for site selection included ease of access, proximity to the crater rim (where typically sensors are deployed to monitor volcanic activity) and the temperature of the ground. Figure 2 shows the selected site, which is located on the ‘septum’ between the active main crater and a side crater. Although this site is ~0.5 km from the position of the year-round instrumentation at the crater rim, its high temperature and relatively soft ground made it a good choice for this initial trial.
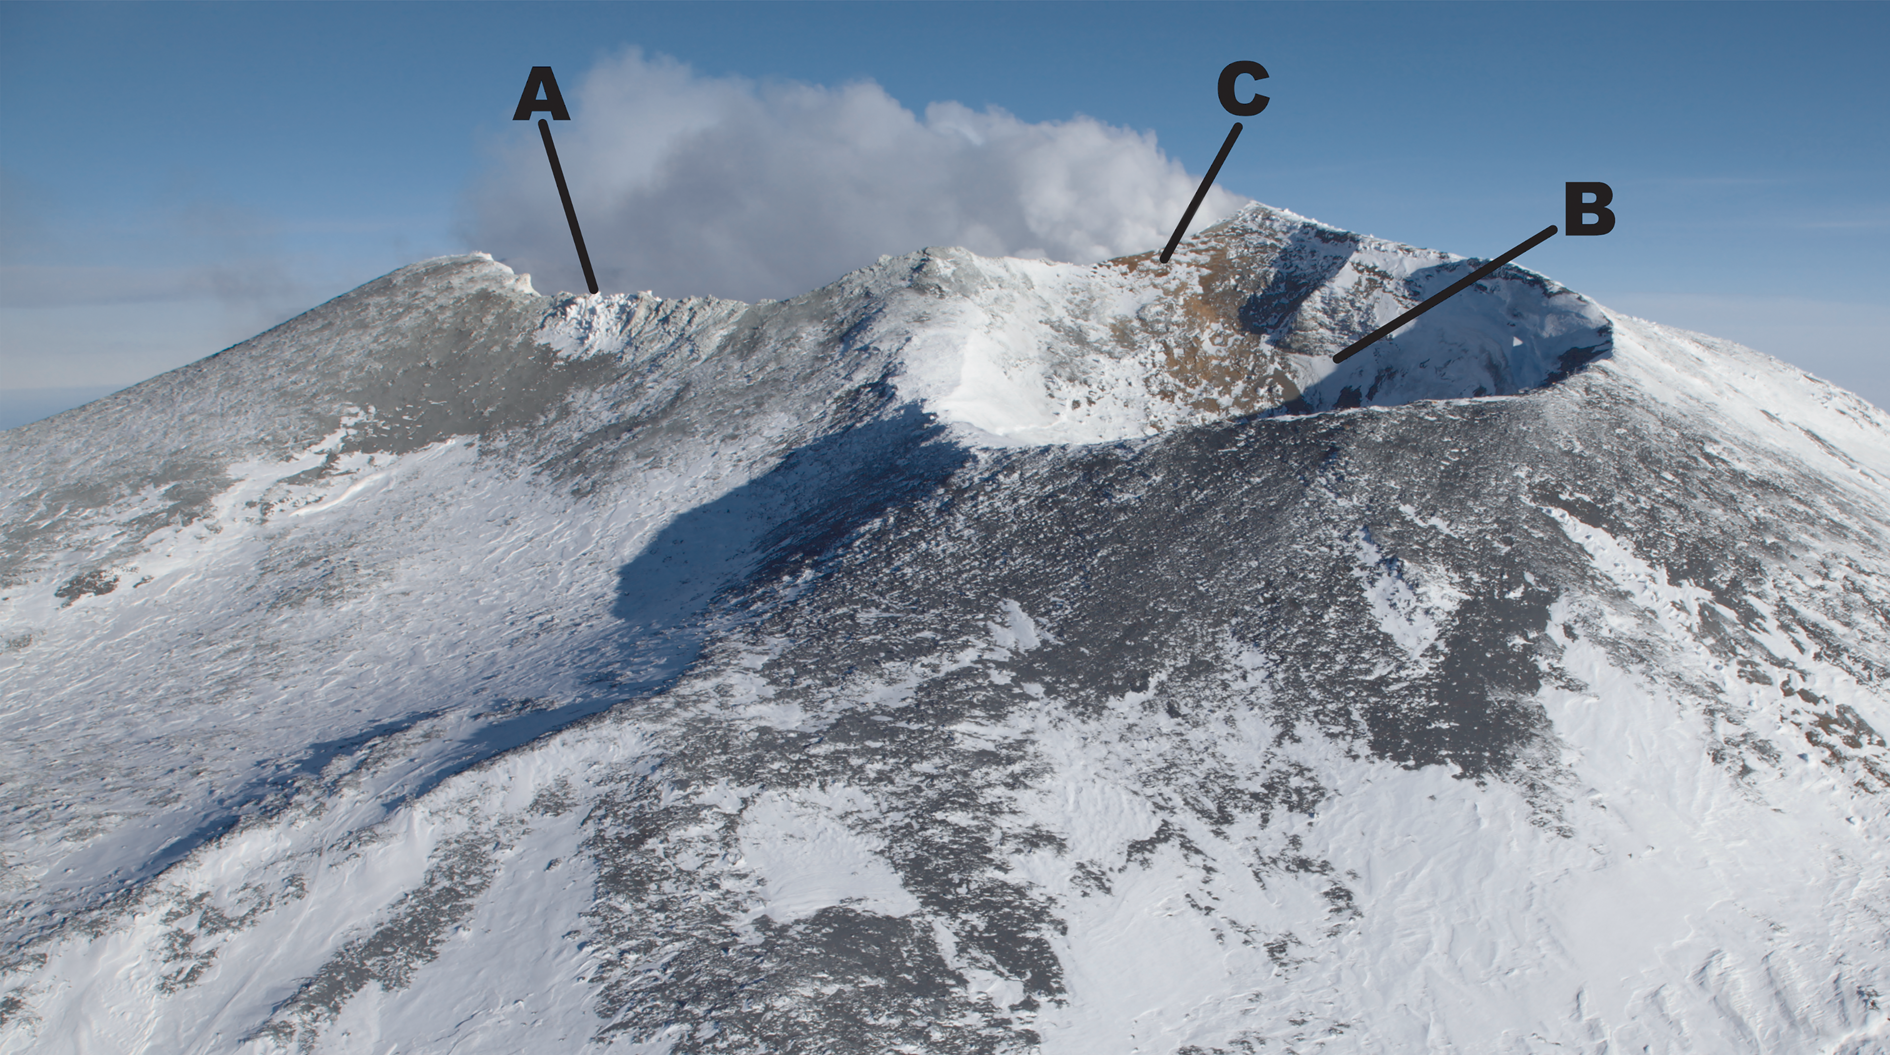
Fig. 2. Aerial photograph of the Erebus summit region looking east: A = the active main crater, B = the side crater and C = the hot ground on the septum between them where the Seebeck generator was deployed.
Results
Figure 3 shows the temperature profile with depth at the deployment site of the generator. The evaporator coil of the generator was buried to a depth of ~0.5 m where the temperature was ~80°C. The rocky nature of the ground made it impractical to install the generator any deeper. As can be seen in Fig. 4, the heat pipe of the generator was too long for such a deployment and protruded above the ground by ~0.5 m. Reducing the heat pipe length is a simple improvement that could be made to future versions of the generator both to improve efficiency and to reduce the overall size of the system. Field-installable insulation for any exposed length of the heat pipe would also be beneficial in case the unit cannot be buried to the anticipated depth. Atmospheric temperature at the crater rim of Erebus during the summer is typically between -20°C and -30°C, giving a maximum possible temperature differential of order 100°C.

Fig. 3. Temperature profile with depth of hot ground at Seebeck generator deployment site.

Fig. 4. The Seebeck generator installed in the hot ground. The data logger is housed in the black Peli case.
Readings from the three temperature sensors on the evaporator coil, the hot side of the TEG and the atmosphere are shown in Fig. 5. For some periods, the data appear to be corrupted, probably due to a poor electrical connection between the sensors and the data logger. It should also be noted that the atmospheric temperature readings are probably overestimates, as the sensor was close to the top of the heat pipe and was not shaded from direct sunlight.

Fig. 5. Seebeck generator temperature data from the ~11 days of deployment showing the temperature of the evaporator coil (top), the hot side of the thermoelectric generator (TEG) chip (middle) and the atmospheric temperature (bottom). The anomalous data in the TEG hot-side and evaporator coil series are thought to be caused by a poor electrical connection to the data logger. The shaded region denotes the time period plotted in the scatter plots in Fig. 6.

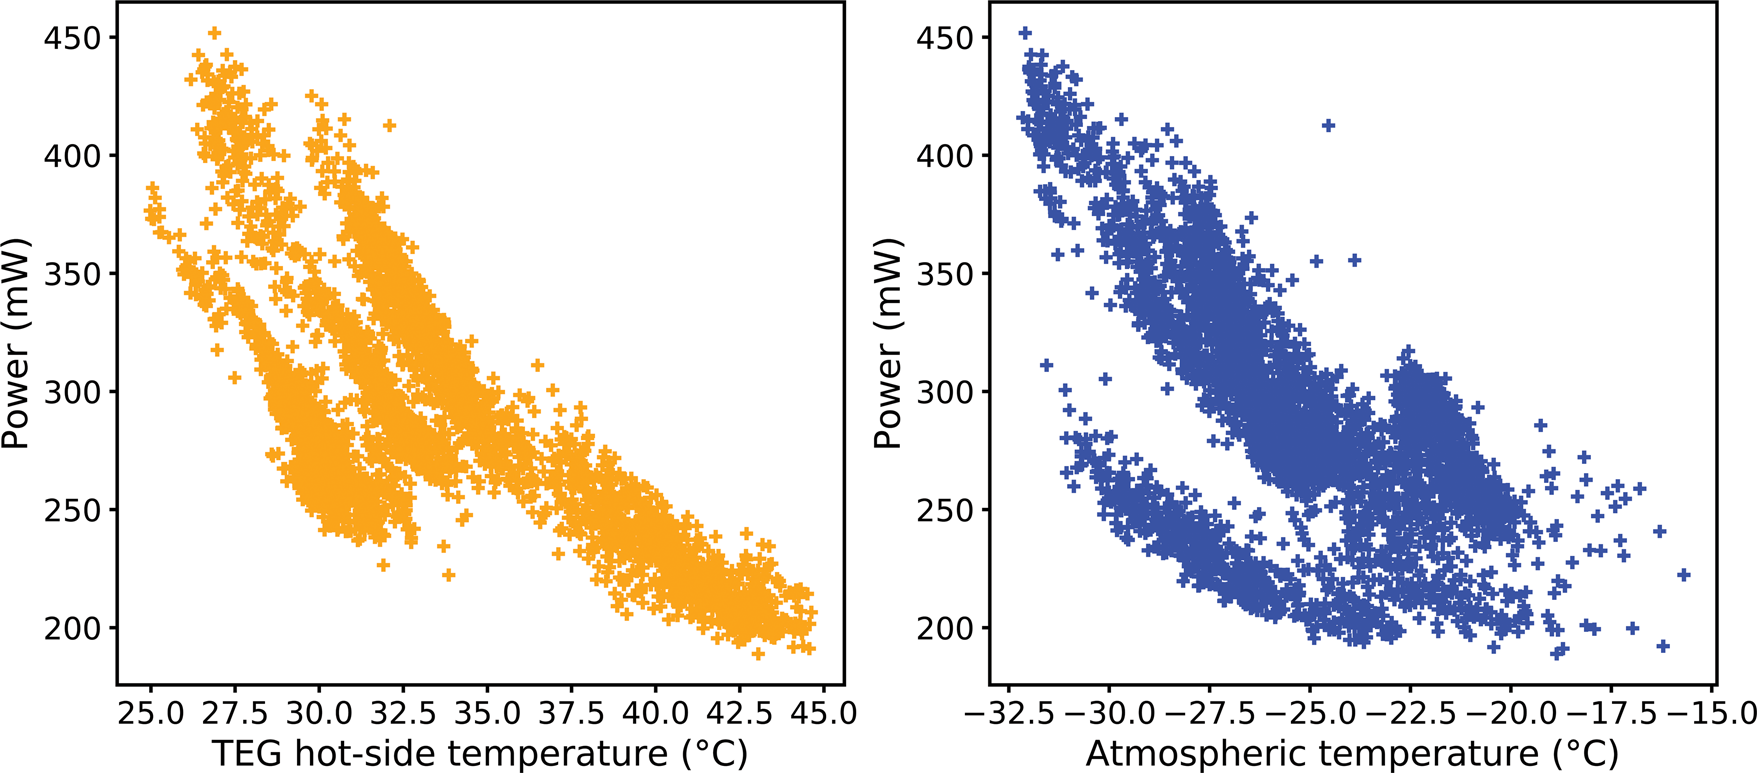
Fig. 6. Scatter plots of thermoelectric generator (TEG) hot-side temperatures (left) and atmospheric temperatures (right) against power output for the time period denoted by the shaded region in Fig. 5. Each data point represents a 1 min average of the recorded values.
The data show that after an initial equilibration period, the temperature of the evaporator coil remained at an almost constant 75°C for the entire duration of the trial. This shows that the heat flux through the hot ground is sufficient to maintain the ground temperature despite the increased cooling due to the Seebeck generator installation, indicating the site's suitability for long-duration energy harvesting.
Figure 6 shows the atmospheric temperature and TEG hot-side temperature against power output for the period between 16:53 on 29 November 2014 and 10:24 on 2 December 2014. This time period was chosen due to the reliable operation of the temperature sensors throughout (see shaded region in Fig. 5). The negative correlation of the power output with atmospheric temperature is as expected. The power output of a TEG is proportional to the temperature differential across it, so for a fixed hot-side temperature, a lower atmospheric temperature will result in a greater power output. However, the negative correlation of the power output with the TEG hot-side temperature is somewhat surprising, as it appears to contradict the expected response of the TEG. Given that the evaporator coil temperature is relatively constant throughout, the most probable explanation for this is that the changes in hot-side temperature are due to changing efficiencies of the cold-side heat sink. These changes may be caused by variations in wind speeds (which are known qualitatively to have varied considerably during the field deployment), although without corresponding meteorological data there is no way to be certain of this. More efficient heat loss at the cold-side heat sink results in a larger temperature differential across the TEG (despite lower hot-side temperatures) and so a higher output power.
The measurements plotted in Fig. 6 fall into three clusters with similar gradients but distinct offsets. Each cluster represents a sequential period, and we therefore attribute the different offsets to different points in the diurnal cycle. Although the sun never dips below the horizon here at this location in the summer, at the deployment site it is occluded for a period by the summit of Erebus and also, sporadically, by the plumes of gases and aerosols emanating from the crater. Variations in power output within each cluster are probably caused by variations in wind speeds, as suggested above.
Figure 7 shows the power output from the TEG during the deployment. Power output was calculated by recording the potential difference across a 1 Ω load resistor placed in series with the TEG chip. A 1 Ω load resistor was chosen so as to match the load to the internal resistance of the TEG chip. Power output varied from ~180 to 450 mW, with an average power output over the whole deployment of 270 mW (mean output voltage of 0.52 V).

Fig. 7. Time series of Seebeck generator power output. The mean power output is 270 mW.
Figure 8 shows images of the Seebeck generator as seen from above, both in visible and thermal infrared (IR) light. The IR image reveals that the heat pipes that make up part of the heat sink and are designed to carry heat away from the cold side of the TEG are cold. This suggests that they were not functioning correctly. As discussed above, we had replaced the water in these heat pipes with methanol to prevent freezing; however, it was difficult to control the amount of methanol in the pipe, and based on Fig. 8, it seems probable that there was an insufficient amount inside after sealing. Inefficient cooling of the TEG will have significantly impacted the power output of the unit. This also explains its sensitivity to atmospheric temperature (Fig. 6), as cooling the TEG was the limiting factor in the device's efficiency and dominated over the variations in hot-side temperature.

Fig. 8. Top view of the Seebeck generator (left) and corresponding image in thermal infrared (right). The heat pipes incorporated into the heat sink assembly (marked A) appear cold, suggesting that they were not operating correctly (note that these heat pipes are distinct from that labelled B in Fig. 1). The atmospheric temperature sensor is marked B.
Discussion
As discussed by Jones et al. (Reference Jones, Jackson, James, Meldrum and Rose2011), the utility of TEG devices comes not from their efficiency, which is relatively poor, but from their reliability and robustness. For remote polar field sites, such as the Erebus crater, it can be far more beneficial to have a modest but continuous source of power than a higher-output but lower-reliability system. This is particularly the case where site access is limited and infrequent, making maintenance of equipment difficult. That said, a reliable source of energy is only useful if it is sufficient for the instrumentation to be powered. For instruments such as the Erebus thermal camera with a power draw of ~11 W (Peters et al. Reference Peters, Oppenheimer and Kyle2014a) or in situ ‘MultiGAS’ gas monitoring instruments with a power draw of ~6 W (e.g. Moussallam et al. Reference Moussallam, Oppenheimer, Aiuppa, Giudice, Moussallam and Kyle2012), it would be impractical to attempt to use TEG devices as a power source. However, for low-power sensors, such as automatic weather stations (~100 mW) or infrasound sensors having a power draw of just 27 mW (Marcillo et al. Reference Marcillo, Johnson and Hart2012), the 270 mW output of our prototype Seebeck generator is already ample. It is also worth noting that many long-term monitoring instruments only require significant power whilst they are taking a measurement, and between measurements can be in a low-power ‘sleep’ state. The power needs of these high-power, low-duty-cycle systems could be met by using TEG devices to charge a suitable battery.
As technology continues to develop, there will be an increasing number of low-power monitoring devices that could be powered by TEG devices. For example, the Erebus radar system used to monitor to the level of the active lava lake initially consumed ~21 W (Peters et al. Reference Peters, Oppenheimer, Brennan, Lok, Ash and Kyle2018); however, recent hardware upgrades have reduced this to ~3 W, with further reductions possible by lowering the acquisition rate. Although still considerably higher than the power output of our prototype generator, the power requirements of the radar are now approaching what could be achieved with a small network of Seebeck generators.
Conclusions
We have presented a prototype system for harvesting geothermal energy from the flanks of Erebus volcano by exploiting the Seebeck effect, with the aim of powering volcano monitoring equipment year-round. The prototype Seebeck generator was deployed on Erebus for 11 days from late November until early December 2014 and the power production was logged, along with temperature readings from several parts of the generator.
The field deployment highlighted several issues with the prototype generator that could be improved upon in future versions:
• Reduction of the length of the heat pipe would improve its efficiency and reduce the overall size of the generator.
• Use of a more reliable cold-side heat sink would increase the thermal gradient and hence power generation.
• Use of several TEG units per heat pipe would increase both output power and output voltage. The limiting factor is the quality of the thermal contact of the evaporator coil with the ground, but given the recorded stability of the coil temperature in our deployment, it seems that there is spare capacity that could be utilized. Additionally, several generators could be deployed in the same region, with their outputs being combined to provide higher output power and voltage.
Despite the aforementioned shortcomings of our prototype Seebeck generator, it nevertheless provided a mean output power of 270 mW over the 11 day trial period. Although this is a rather modest power output compared to a photovoltaic panel or a wind turbine, it has the advantage of continuous generation irrespective of season or weather. Furthermore, its lack of moving parts makes it robust in the face of the often extreme environmental conditions encountered at the crater rim of Erebus.
The power output of the prototype system is already sufficient to sustain low-power monitoring instrumentation (e.g. an infrasound network). However, the low output voltage of the TEG would necessitate some form of DC-DC conversion to make it usable with any real instrument. With the improvements listed above, together with networking several generators together (increasing both the power and voltage output), an effective system could quite feasibly be developed to handle the requirements of a suite of monitoring instruments.
Acknowledgements
The authors wish to thank Mike Prior-Jones and another anonymous reviewer for their insightful comments on the manuscript.
Author contributions
NJP collected and analysed the measurements and authored the manuscript. CO aided in field trials. BJ designed and constructed the generator and helped with data analysis. MR aided in the design and approach. PK organized the field campaign. All authors commented on and contributed to the manuscript.
Financial support
NJP acknowledges the support of an Antarctic Science International Bursary from Antarctic Science Ltd. NJP and CO acknowledge support from the Natural Environment Research Council (grant # NE/N009312/1). Field support was provided by the National Science Foundation (United States Antarctic Program) under award ANT1142083.


 Open access