Spatially Explicit Capture-Recapture Through Camera Trapping: A Review of Benchmark Analyses for Wildlife Density Estimation
 Austin M. Green
 Mark W. Chynoweth
 Çağan Hakkı Şekercioğlu
- 1School of Biological Sciences, University of Utah, Salt Lake City, UT, United States
- 2Department of Wildland Resources, Utah State University – Uintah Basin, Vernal, UT, United States
- 3College of Sciences, Koç University, Istanbul, Turkey
Camera traps have become an important research tool for both conservation biologists and wildlife managers. Recent advances in spatially explicit capture-recapture (SECR) methods have increasingly put camera traps at the forefront of population monitoring programs. These methods allow for benchmark analysis of species density without the need for invasive fieldwork techniques. We conducted a review of SECR studies using camera traps to summarize the current focus of these investigations, as well as provide recommendations for future studies and identify areas in need of future investigation. Our analysis shows a strong bias in species preference, with a large proportion of studies focusing on large felids, many of which provide the only baseline estimates of population density for these species. Furthermore, we found that a majority of studies produced density estimates that may not be precise enough for long-term population monitoring. We recommend simulation and power analysis be conducted before initiating any particular study design and provide examples using readily available software. Furthermore, we show that precision can be increased by including a larger study area that will subsequently increase the number of individuals photo-captured. As many current studies lack the resources or manpower to accomplish such an increase in effort, we recommend that researchers incorporate new technologies such as machine-learning, web-based data entry, and online deployment management into their study design. We also cautiously recommend the potential of citizen science to help address these study design concerns. In addition, modifications in SECR model development to include species that have only a subset of individuals available for individual identification (often called mark-resight models), can extend the process of explicit density estimation through camera trapping to species not individually identifiable.
Introduction
Camera Traps and Benchmarking Biodiversity
Human-induced changes to both terrestrial and marine ecosystems are intensifying, especially in areas of the world with historically high levels of biodiversity (Venter et al., 2016). Human activities have a direct effect on biodiversity, altering ecosystems around the globe (Cardinale et al., 2006; Estes et al., 2011; Hooper et al., 2012). During this period of rapid change, and in order to better understand the effects of human activity on biodiversity, it has become increasingly important to provide baseline measurements of species distributions and population sizes, especially for rare, elusive, and difficult-to-monitor species like carnivores, which play particularly important roles in regulating ecosystems (Beschta and Ripple, 2009; Laundre et al., 2010; Ripple et al., 2014). Providing these benchmark analyses, and establishing the methodology and analysis framework to compare changes over time, is essential to understanding and quantifying the ways in which these species are both affected by rapid change and how they, in turn, affect human well-being.
Camera traps have been used in animal ecology studies for decades, and are particularly suitable for studying large carnivores, which can be difficult to study with other methods (Griffiths and Van Schaik, 1993; Rowcliffe and Carbone, 2008; Trolliet et al., 2014; Burton et al., 2015). Cameras provide researchers with a non-invasive survey tool to sample wildlife communities and usually require less intensive labor commitment than standard trapping and marking techniques (Meek et al., 2014). Consequently, camera traps have become powerful research tools for scientists and wildlife managers investigating a wide variety of ecological questions, management situations, and conservation strategies (Karanth and Nichols, 1998; and Glen and Dickman, 2003; Hirakawa, 2008; O'Connell et al., 2011; Meek et al., 2014).
Measuring Biodiversity: Density Estimation
In order to measure how species respond to rapid change, and to establish proper avenues for comparative studies, researchers must first establish a reference or baseline population size. In biodiversity studies, density estimation is often considered the gold-standard of population assessment and for species conservation, wildlife management planning, and long-term population monitoring (O'Connell et al., 2011; Tobler and Powell, 2013; Royle et al., 2014). Wildlife density has long been estimated through capture-recapture methods (Otis et al., 1978). Karanth (1995) and Karanth and Nichols (1998) pioneered the use of camera traps in a photographic capture-recapture framework to estimate population size of tigers Panthera tigris in Nagarhole, India. The authors used camera trap images, which come with an accompanying GPS coordinate (and date and time stamp), as individual “captures.” They then used the photographs from these individual captures to build a dataset of multiple individual tigers. From there, they could create separate capture histories for each one. Since this work, multiple independent investigations have adopted camera traps and this analysis framework to estimate the densities of tigers in other areas of the world (O'Brien et al., 2003; Linkie et al., 2006; Harihar et al., 2009; Gopal et al., 2011), as well other individually identifiable animals (Kelly et al., 2008; Paviolo et al., 2008).
Many of these early investigations relied on closed model capture-recapture methods (Otis et al., 1978; White et al., 1982). This method requires compiling individual-specific capture histories across a defined study area where the boundaries of an individual animal's movement may not be well-known. The detection histories contain information about individual capture probability, and can thus be used for estimating population abundance. However, these models provide little information on the movement patterns of each individual, as well as the spatial distribution of the traps themselves. Therefore, under this framework, density is estimated according to an arbitrarily set area, usually defined as the camera trap polygon plus a buffer with radius equal to either the maximum distance moved by an individual across the trap array or half the distance moved (O'Connell et al., 2011). As density requires both an abundance and an area, arbitrary designation of area is an obvious hindrance to closed model capture-recapture methods. Consequently, this method is often considered to measure density implicitly (Royle et al., 2014). That is, density is estimated without explicitly measuring all of its elements. The population size is functionally unrelated to an explicitly monitored area, which can make it impossible to compare across studies or even different models (Royle et al., 2014). Furthermore, research has shown this method to consistently overestimate density by underestimating the distances moved by individual animals (Obbard et al., 2010; Noss et al., 2012; Pesenti and Zimmermann, 2013).
Spatially Explicit Capture-Recapture
Spatially explicit capture-recapture (SECR) density estimation was developed independently by Borchers and Efford (2008) and Royle and Young (2008) (see also Efford, 2004, 2011; Efford et al., 2009; Royle et al., 2009). What separates SECR density estimation from closed capture-recapture models is the incorporation of an explicit spatial component to each individual's detection history, as well as a defined state-space over which density is estimated (Efford and Fewster, 2013; Royle et al., 2014). Therefore, SECR analysis represents an explicit way of measuring density (i.e., both components of density are estimated without ad hoc calculations). However, because of the additional parameters to estimate, SECR models can be more data hungry than their implicit counterparts (Royle et al., 2014).
A detailed breakdown of SECR analysis is beyond the scope of this paper. Efford et al. (2009) offer a thorough introduction and explanation of SECR analysis through Maximum Likelihood-based methods, and Royle et al. (2014) provide a thorough introduction and explanation of SECR analysis through Bayesian techniques incorporating data augmentation. Here, instead, we provide a brief summary based on the work of Royle and Young (2008) and Borchers and Efford (2008).
SECR models are hierarchical, where the full model is described by multiple component models (Royle and Dorazio, 2008). The first of these components describes the distribution of activity centers s, or home range centers, of individual animals. In this characterization, si represents the geographic point where individual i's movement is centered (the movement around the point si is then described according to a specific probability function), and si; i = 1, 2,…, N represents the activity centers of every individual within a defined state-space S, the region over which density is estimated (Royle and Young, 2008). This model is a spatial point process, capable of measuring density as either constant across the state-space or with spatial variation (Efford et al., 2009; Royle et al., 2014). S is typically described by specifying coordinates of a polygon that is substantially larger than the area sampled, allowing some individuals to have si outside of the sampled area. As mentioned above, individuals are assumed to move around the state-space randomly as specified by some probability distribution. Finally, the sum of activity centers, N, over the state-space S, specified u, represents the estimated population density.
Another component, the observation model, describes y, or how the observed data occur based on the locations of N individuals (Efford et al., 2009; Royle et al., 2014), as it is assumed that individuals are sampled imperfectly due to detection probability being <1. The observed data are binary observations during a specific sample that state whether an individual was captured or not (Royle and Young, 2008). These observations are used to create encounter histories for each individual. In addition, each encounter comes with a pair of coordinates that specify where each encounter occurred. These encounters are defined by at least two parameters, p and σ, which describe the probability of capturing or detecting an individual at a given location by using the distance between each individual's activity center and a given encounter location. In this formulation, when individuals are marked, pij is the probability of capturing individual i at trap location j, and σ is the spatial scale parameter that defines how capture probability declines with distance (Efford et al., 2009; Royle et al., 2014).
The most basic SECR models come with the following major assumptions: (1) within the population of interest, and during the period of study, there exists both demographic and geographic closure; (2) individual activity centers are randomly distributed and do not change; (3) the probability of detection at a given location is a function of distance to an individual's activity center; and (4) there is independence in individual encounters among individuals and within the same individual.
The first assumption means that basic SECR models assume no exit or entry into the population through either recruitment or mortality or permanent emigration or immigration from the area of study. However, the model does allow for “temporary” variability to encounter around the state-space (Royle et al., 2014). Violations of closure can result in detection probability estimates that are too low or the effective trap area being considered too small, resulting in positive bias in resulting density estimates (Dillon and Kelly, 2008; Obbard et al., 2010). Typically, practitioners are encouraged to either (a) keep their survey period as short as possible or (b) use an open population model (e.g., Gardner et al., 2010a; Ergon and Gardner, 2014; Schaub and Royle, 2014) to avoid violating this assumption. The second assumption deals with the distribution of individual activity centers across the state space. This is often referred to as the “uniformity assumption,” (Royle et al., 2014) modeled as,
This creates what is known as a homogenous point process model; however, inclusion of site-specific covariates can make it possible to estimate density as a function of state-space heterogeneity (Royle et al., 2018). Accompanying this assumption is that individual home range centers are spatially stationary for the duration of study. However, this assumption may be relaxed by modeling si with some type of latent movement model. Thus, the activity centers of all or some of the individuals within a population are allowed to drift (Royle et al., 2016).
The third assumption states that each animal has an activity center and the probability of capture decreases with distance to that activity center. Typically, a half-normal detection function is applied to describe how detection probability decreases with distance, but a variety of functions are available. In this formulation, the detection function is described by the detection probability and the scale parameter, which denote the probability of detection when the distance between an individual and their activity center is 0 and how that probability declines in response to distance, respectively. The most basic models assume that these parameters do not change across individuals, but this assumption can be relaxed to vary across time, individuals, and covariates (Royle et al., 2018). Finally, the assumption of independence of encounters states that the encounter of one individual does not affect the encounter of another individual at the same trap, and encounter of an individual at one trap location is independent of encounter at any other trap location. It is natural to think that species may have a behavioral response to certain areas, making them more or less likely to visit specific trapping locations. Recent model developments allow for this behavioral response to be explicitly accounted for (Gardner et al., 2010b; Royle et al., 2011).
Camera Traps and SECR Analysis
Camera trapping lends itself well to measuring density through SECR analysis. SECR analysis requires marking a sample of individuals and monitoring their presence across multiple surveys and study sites (Borchers and Efford, 2008; Efford et al., 2009; Royle et al., 2014). Traditionally, monitoring requires setting up live-trapping stations, using natural marks or marking individuals caught in each trap, and repeating the process over a given time-frame. This results in multiple visits (usually daily) to each trap station, individual processing of animals caught in the traps, and consistent maintenance of traps to ensure that each is capable of capturing animals, resulting in a time and effort-intensive process that hinders the number of traps that can be deployed during a particular investigation (Jimenez et al., 2017; Loock et al., 2018; Whittington et al., 2018; Petersen et al., 2019). This is problematic for species with low detection or capture rates due to natural rarity or large individual home ranges. To compensate, researchers are required to increase the duration of time each trap is active during a season, which can lead to violations of the closure assumption.
However, camera traps are non-invasive, remote sensing devices that can monitor animal populations over a wide-geographic area (Kelly et al., 2008; Linden et al., 2017; Luskin et al., 2017). They are relatively cost and time-effective monitoring tools, requiring no intensive and individually-invasive capturing techniques, and they can be paired with other methodological approaches that bolster the predictive power of population monitoring investigations (O'Connell et al., 2006; Lyra-Jorge et al., 2008; De Bondi et al., 2010; Roberts, 2011; Welbourne et al., 2016). Camera surveys require little maintenance once initially setup, and they offer the unique ability for researchers to mark individual animals without having to maintain the traps they were caught in or process the individuals captured. Furthermore, since SECR analysis requires that density is estimated over an explicitly determined state-space, and that a state-space is typically defined as the polygon surrounding the outermost traps of a particular array (aka the minimum convex trap polygon), using camera traps instead of other trapping methods allows researchers to explicitly adjust the size of their study area. Finally, the ease of setup and relatively low maintenance requirements for camera traps allows researchers to establish a higher density of traps within their camera array compared to more traditional methods, with more than one trap within the average home range size of the species studied, another requirement of SECR analysis (Borchers and Efford, 2008; Royle et al., 2009, 2018).
In this review, we aim to explain the current extent of camera trap SECR analysis, identifying whether benchmark density estimates have been precise enough to monitor change over time, especially for species where no other estimates exist. Our goals were to (1) summarize the current efforts of SECR analysis through camera trap surveys and (2) analyze study design criteria to identify important predictors of density precision and suggest recommendations to improve density precision in future studies. Our review provides an accurate picture of the current direction of the science. We document the publication outlets, species studied, and geographic extent of these efforts. As a guide for future research, we highlight the analysis software used, the study designs adopted, and both the amount of effort and number of detections recorded. Finally, we report on the study design factors that lead to increases in density estimation precision and how incorporation of new analysis techniques, online technologies, and citizen science may offer ways to increase these factors for future investigators, as well as pave the way for new developments.
Materials and Methods
Literature Review
Our literature review took place between 24 April and 21 October 2019. We searched the Web of ScienceTM for papers using the following title and topic search terms: “spatial capture-recapture” AND “spatially explicit capture-recapture” AND “spatial mark-recapture” AND “spatially explicit mark-recapture” AND “spatial mark-resight” AND “spatially explicit mark-resight” AND “spatially explicit density estimation.” We reviewed the resulting dataset of 309 papers and included only those that used camera traps. The resultant dataset included 88 scientific articles. We then expanded this dataset by searching through all studies citing Royle et al. (2014), which resulted in an additional 7 studies. The final dataset included 95 papers (Supplementary Table 1).
Categorical variables were extracted from each study. We recorded the title, author(s), journal, year, pagination, class and species studied, and continent and country of focus for each study. If more than one species was included in a single study, a separate record was produced for each. This resulted in a dataset with 110 species-specific records. Each study's objective was classified as either single-species, two-species, or multi-species density estimation. Spatially-explicit capture-recapture (SECR) analysis is typically done using freely available data analysis software and can be implemented in either a maximum likelihood or Bayesian framework, so we recorded the method of analysis as either MLE (for maximum likelihood), Bayesian, or both, and the statistical program used to implement the analysis was also included in the database. We recorded whether or not each study used site-specific covariates within their analysis framework. For studies that paired non-covariate spatially explicit density estimation with diet, movement, or occupancy analyses that included site-specific covariates (n = 8), the study was classified as using covariates and the discrepancy was noted on a separate column in the dataset. We recorded any methods (simulations, occupancy analysis, live trapping, etc.), besides spatially explicit density estimation through camera trapping, implemented during the course of each study. Furthermore, if a study made any comparisons between SECR and another density estimation framework (n = 23), the specific models compared and the results of these comparisons were recorded. Finally, we recorded if each study included baited camera trap stations and whether or not community engagement or citizen science was implemented during any stage of the project.
We extracted a number of numerical variables from each study. The number of camera stations was recorded as the average number of stations implemented per year of study. We recorded the length of each study in years. We included, when recorded, the minimum convex polygon of the camera station array. If this camera polygon was not reported in the manuscript (n = 5), the state-space of the study was used instead (see section Measuring Biodiversity: Density Estimation above). We recorded the average camera spacing in meters. When the average spacing was not explicitly reported, we recorded the average of the reported camera spacing range (n = 13), the minimum distance between stations (n = 1), or the maximum distance between stations (n = 1). The number of trap days was recorded as the total accumulated effort for all camera stations across all years of survey. This total was then averaged across years for analysis. The total number of photo-captured target species was recorded, as was the total number of individuals tracked throughout the study. The scaling parameter, σ, was recorded for each study as the average across years per species using either the author-specified top model or the author-reported model average. If the best model was not specified (n = 9), σ was extracted as the average across all models reported. When more than one area was surveyed during a particular study and no average was recorded (n = 7), the scaling parameter was recorded as the weighted average of estimates based on the size of each area's assessed state-space. Furthermore, if the scaling parameter was reported to vary based on sex (n = 8), the estimate was averaged using an assumed 1:1 sex ratio (n = 7) or the specified sex ratio provided (n = 1). Density was recorded as the number of individuals reported per 100 km2 on a per species basis. Estimates were averaged across year using either the top model reported or the author-reported model average. As with the scaling parameter, when the best model was not specified (n = 9), density was extracted as the average across all models reported. When more than one area was surveyed during a particular study and no average was recorded (n = 7), density was recorded as the weighted average of estimates based on the size of each area's assessed state-space. One study did not report the specific state-space of each area surveyed, so the density estimate for this study was calculated without area-specific weights. Lastly, to assess the precision of density estimates, the coefficient of variation (CV) was calculated on a per species basis across studies. When the standard deviation of the maximum likelihood estimator or the posterior standard deviation of density were not explicitly reported, the standard error was used to calculate CV (n = 12). One study provided only a 95% confidence interval, and the standard deviation for this study was calculated as the range of the confidence interval divided by 3.92 (assuming a normally distributed density estimate).
Data Analysis
In an effort to identify important study design parameters for increases in density precision, we modeled each study's coefficient of variation against study design parameters. However, all predictor variables were correlated with at least one other variable (Pearson's r > 0.5). Therefore, we conducted Principal Component Analysis (PCA) on study design factors and modeled density precision as a function of the first three principal components (PC1, PC2, and PC3), which collectively accounted for 72.6% of the variation in study design factors. Since each predictor was on a different scale, predictor variables were standardized to have a mean = 0 and a standard deviation = 1 before running the PCA. We then used PC1, PC2, and PC3 as covariates in modeling density precision to study design components using a Gaussian linear model. We determined significant associations between precision and principal components at α = 0.05. Predictors included in the PCA were: density, target captures, individuals monitored, camera stations, camera days, and study area.
Results
Dataset Summary
SECR analysis through camera trapping has focused on multiple species across a wide geographic range. The results from our dataset were published in 37 different journals. Five journals accounted for 42.1% (n = 40) of publications (PLoS One = 13, Oryx = 12, Biological Conservation = 7, Ecology and Evolution = 4, and Nature = 4). Publication rate has steadily increased since 2010 (the earliest publication year included in our dataset), with 67.3% (n = 64) published between 2015 and 2019 (Supplementary Table 1). All studies focused on mammals. Of the 110 species density estimates, 60.9% (n = 67) were of 10 different species: leopard (Panthera pardus) = 17, tiger (Panthera tigris) = 14, jaguar (Panthera once) = 8, clouded leopard (Neofelis nebulosi) and (Neofelis diardi) = 7, cougar (Puma concolor) = 5, ocelot (Leopardus pardalis) = 4, domestic cat (Felis catus) = 3, leopard cat (Prionailurus bengalensis) = 3, red fox (Vulpes vulpes) = 3, serval (Leptailurus serval) = 3. All other species were included in fewer than three occasions (Supplementary Table 1, Figure 1). 90.9% (n = 100) of estimates were of carnivores, and of those 82% (n = 82) were of felids. 91.6% of studies focused on only one species (n = 87), 5.3% on two species (n = 5), and 3.1% on more than two species (n = 3). SECR studies using camera traps were conducted on six continents, with Asia and South America representing 58.9% (Asia = 38, South America = 18) of all studies (Supplementary Table 1, Figure 1).
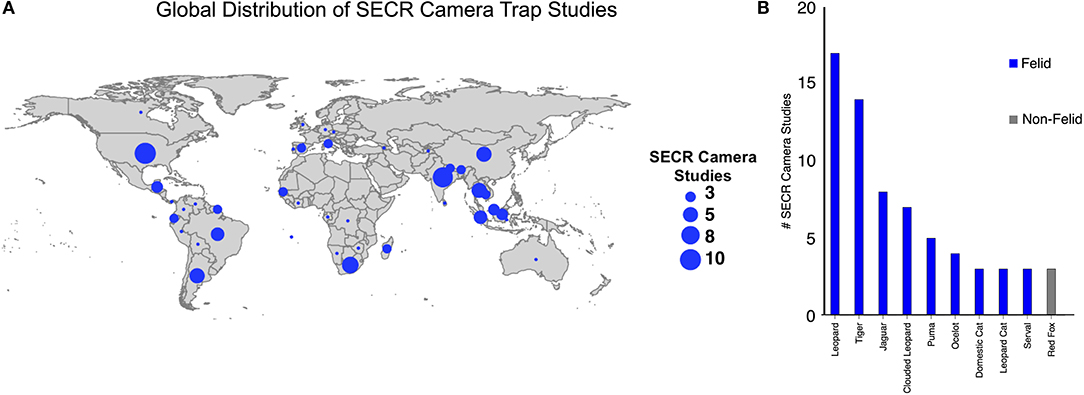
Figure 1. Camera trap SECR study spatial distribution and species focus. (A) Global spatial distribution of camera trap SECR studies by country. (B) Number of studies focused on the top 10 focal species. The top 10 species listed accounted for 61% of all SECR camera trap studies. Most (75%) SECR camera trap studies focused on felids.
SECR models incorporated both maximum likelihood and Bayesian analysis methodologies. Researchers estimated density using exclusively maximum likelihood estimation 46.3% (n = 44) of the time, with 72.7% (n = 32) of these studies using the R package secr (Efford, 2010) for analysis; Bayesian inference was used exclusively in 35.8% (n = 34) of studies, where the program SPACECAP (Gopalaswamy et al., 2012) was used for analysis in 40.6% (n = 13) of these studies; and both methods were incorporated in the remaining 17.9% (n = 17) of studies, with secr or SPACECAP used in 88.2% (n = 15) of these studies.
Camera trapping methodology varied in both spatial scale and temporal extent, resulting in highly variable numbers of target captures and individuals monitored. Most studies lasted for 1 year or less (71.6%, n = 68, mean = 1.9), and a median of 57.5 camera stations were deployed per study per year (mean = 100.1, min = 12, max = 849). Surveys lasted for a median of 3,124 camera-days per year (mean = 7,762, min = 478, max = 114,854). The minimum convex camera trap polygons covered a median area of 306 km2, with large-scale, multi-year studies having a major effect on the mean (mean = 2,646, min = 4, max = 70,096). Camera stations were placed, on average, 1,962 m apart (median = 2,000, min = 100, max = 8,740), and bait was used in 24.2% (n = 23) of studies. SECR studies recorded a median of 129.5 detections of their target species (mean = 340.1, min = 21, max = 3,163) and resulted in a median of 27 individual animals tracked (mean = 60.8, min = 4, max = 1,240). The median scaling parameter varied across species and dietary preferences (Supplementary Table 2). Density was lowest for large carnivores and varied across species and geographic locations (Supplementary Table 2).
Camera trapping studies deployed for SECR density estimation incorporated a number of supplemental methodologies and compared the effectiveness across these methods, as well as across data analysis approaches and modeling schemes. Twenty-two (23.2%) studies incorporated site-specific covariates into their analysis. As noted in section 2.1, 36.4% (n = 8) of these studies used the information from site-specific covariates in analysis separate of density estimation through SECR analysis. Slightly under half of studies (46.3%, n = 44) incorporated methodologies in addition to camera trapping. Of these methodologies, GPS tracking, telemetry, and live trapping were used most frequently (27.3%, n = 12), followed by simulations (22.7%, n = 10). Nineteen studies (20.0%) compared the results of SECR analysis with closed-population capture-recapture analysis (n = 16), Random Encounter Model analysis (n = 1), distance sampling analysis (n = 1), and Royle-Nichols occupancy analysis (n = 1). Authors self-reported that SECR analysis either outperformed closed-population capture-recapture or they recommended SECR analysis 93.8% of the time (n = 15). One study self-reported that closed-population capture-recapture analysis outperformed SECR analysis. Twenty-six (27.3%) studies surveyed across multiple years or seasons.
Density Precision Predictors
The precision of density estimates, as measured through the coefficient of variation (CV), was reported or extracted as explained in section 2.1 for 90 species-specific density estimates. The median CV was 30% (mean = 31.1%). 75.6% (n = 68) of studies reported a CV of ≤40%, but only 21% (n = 19) of studies reported a CV ≤20%.
The first three principle components of our PCA, which accounted for 72.6% of the variation in study design characteristics, described axes of increasing camera stations and camera days (PC1), increasing density and individuals monitored (PC2), and increasing density and decreasing individuals monitored (PC3; Supplementary Tables 3, 4). Density precision did not differ significantly across PC1 and PC3 (p = 0.131 and p = 0.919, respectively; Supplementary Table 5). However, density precision increased significantly with higher values of PC2 (increases in density and individuals captured; p = 0.038; Figure 2).
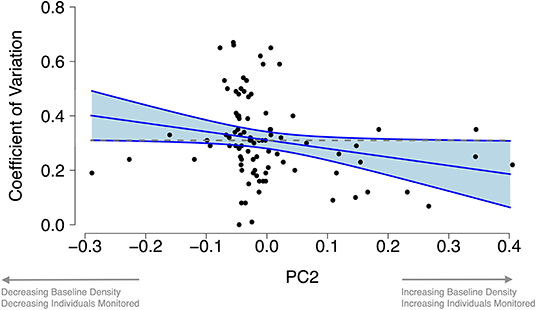
Figure 2. Study design characteristics predicting increases in density precision. Density precision increased with increasing values of PC2 (describing axes of increasing density and increasing individuals monitored). Data points are species-specific values of the Coefficient of Variation. Larger values mean lower precision. Blue line and shaded area represent the slope and 95% Confidence Intervals from our linear model. Dashed gray line represents the mean Coefficient of Variation in our review.
Discussion
In this review, we summarized the current publication extent, geographic coverage, and species focus; study design specifics; and available analysis pipelines of SECR camera trap studies. Our review highlights the flexibility of SECR analysis through camera trapping, which makes this methodology a tool for providing benchmark analysis of previously understudied species. Our review also sheds light on the current geographic and species bias toward areas with rare, elusive, and individually-identifiable species, particularly large felids. We also found that many studies produced relatively imprecise density estimates (see below for details), and that precision could be increased with increases in the number of individuals captured, which can be accomplished with a larger study area.
Benchmarking Rare and Elusive Species
Our review highlights the importance of camera trapping for studying rare, elusive, and human-intolerant large carnivores (Ripple et al., 2014). These are species that are both exceptionally important to ecosystems throughout the world and difficult to study through other means. For many of the species in our review, the density estimates calculated were the first reported population estimates for them, highlighting the ability of camera traps to monitor previously understudied species, providing benchmark estimates that can be compared over space and time. As the world continues to change at an increasingly rapid rate, benchmarking and archiving density estimates for these species will be critical for tracking the effects of rapid global change.
SECR density estimation through camera trapping is currently focused on rare, elusive, large-ranging, and individually identifiable carnivores, specifically large felids, and this methodology represents one of the best ways to study these species. More than a third of all studies included in this review focused on one of three species: leopard, tiger, and jaguar (35.5%, n = 39). This explains the subsequent bias in geographic focus of camera trap SECR studies (Results section; Figure 1). Focusing on species that are capable of individual identification through photographic analysis alone is the obvious reason for this bias, as it represents the simplest avenue to robust density estimation without the need to employ more-intensive methodology (e.g., live trapping; scat, environmental, and/or hair sampling for DNA analysis, etc.). Large felids tend to be wide-ranging, naturally rare, and heavily affected by human influence (Seidensticker and McDougal, 1993; Turner, 1997). Many of these species are currently threatened or endangered with extinction, so information about their population densities and trends through space and time, especially in relation to human influence and climatic change, is needed for their continued conservation (Ripple et al., 2014). Since these species require large areas of undisturbed habitat, they tend to be excellent indicators of general ecosystem health and conservation of these umbrellas species is thought to affect the conservation of other species at lower trophic levels (Dalerum et al., 2008a,b; Estes et al., 2011).
Addressing Imprecise Density Estimates
Although the goal of many studies in this review was to assess the current population size of a particular species and/or lay the framework for a long-term monitoring project, multiple density estimates from studies included in this review may not be precise enough to monitor population trends through time. The mean reported or derived coefficient of variation (CV) was relatively high (31.1 %). In fact, less than a quarter of studies reported high precision in their density estimates (CV ≤20%). Conducting a power analysis before implementing a specific study protocol can reduce “… [wasting] time and effort on a program that is unlikely to yield useful information” (Gerrodette, 1987). This power analysis can be conducted for multiple fieldwork scenarios using the readily available software TRENDS and the R package emon (Gerrodette, 1993; Barry and Maxwell, 2017). For example, using emon and the average density and standard deviation of tigers in our dataset (CV = 0.31), assuming a normal distribution for random values and that density is measured twice per year, the likelihood of detecting a 50% linear decline in tiger density over 10 years is only 32.7%. This likelihood increases to 68.0% with a CV = 0.20 and to 89.2% with a CV = 0.15. This simple exercise shows that a majority of camera trap monitoring programs designed around species where precise density estimates are needed to assess population change through time may be inadequate. Furthermore, pairing simulation with SECR density estimation through camera trapping has great potential. Only 10.5 % (n = 10) of studies performed any type of simulation before implementing their field protocol. Conducting simulations before implementing field protocol can help elucidate the effects particular study designs could have on density estimation, and recent developments in SECR simulation and design (see Efford, 2019a,b; Efford and Boulanger, 2019) make it relatively straightforward to evaluate study designs using prior information. Given that the majority of studies were conducted on species where prior information on home range size and density were available (over 60% of studies were conducted on only 10 species), including this information into simulation models could help structure studies where a certain measure of precision is needed to monitor population trends. For example, Efford (2019a) designed the R package secrdesign and the accompanying web-based application “SECRDESIGNAPP” (Efford, 2019b) for researchers of all levels of statistical proficiency. Using the average study design characteristics for tiger SECR studies in this review (Supplementary Table 2), as well as the accompanying average density in the above power analysis, assuming a grid-based design with a half-normal detection function, Poisson distribution for n, and three temporal replicates per site (a common camera trap study design used in SECR analysis), the program recommends that this design proceed with caution. SECRDESIGNAPP makes this recommendation based on the power to detect a trend in population density exceeding 80% only in cases of a net density decrease of ≥64.1% or a net increase of ≥94.9%. With all of the other study design criteria held equal, a similar study would need to deploy 240 camera stations (nearly 100 more than average) to achieve a design that meets the app's recommendations for statistical power. Moving forward, we strongly recommend future studies conduct these simulation exercises before following through with a potentially unsatisfactory field protocol.
Increasing Density Precision
Density precision increased with increasing values of baseline density and the number of individuals captured. As the former cannot be controlled by researchers beforehand, the best way to increase precision from a study design perspective would seem to be through increasing the number of individuals captured. This can be done naturally by increasing the survey area, thus exposing a greater number of individuals to sampling. However, increasing survey area is not always feasible in many typical research situations. Investigators are hindered by the amount of resources available to them, and any one study's scale can be limited by labor, money, time, political boundaries, and other factors. In order to increase the efficacy of SECR density estimation through camera trapping, especially in the context of long-term population monitoring, researchers must adopt new techniques and technologies [e.g., automatic detection through artificial intelligence (Norouzzadeh et al., 2018), online data entry and verification platforms (eMammal:: https://emammal.si.edu/)] to increase the scale of their investigations and improve the precision of density estimates.
Future Research Using Camera Traps and SECR Analysis
There are exciting avenues through which research using SECR analysis and camera traps could be expanded. The incorporation of community science (aka citizen science) into SECR camera trapping studies can increase the scale of their investigations. Community science has expanded recently due to changing views of science and because of its scientific and societal benefits (Silverton, 2009; Adler et al., 2020). One of the hallmarks of community science is its ability to increase the spatial scale and temporal extent of investigations (Devictor et al., 2010; Abolafya et al., 2013; Jarvis et al., 2015; Adler et al., 2020). Specifically, community science has been shown to be effective in gathering baseline population and habitat usage data tracked through both space and time (Conrad and Hilchey, 2011; Sullivan et al., 2017; Horns et al., 2018; Neate-Clegg et al., 2020). Community science allows for the effective tracking of species distributions, as it allows projects to cover much greater areas than through more traditional methods (Gallo and Waitt, 2011; Hawthorne et al., 2015; Chandler et al., 2017). With camera traps, volunteers can setup cameras, maintain them in the field, and even upload and tag images to an online database. Furthermore, employing volunteers to help setup camera traps may even be a way for researchers to access land not previously available (e.g., private land, farmland, etc.). Finally, online camera trap databases (e.g. eMammal: https://emammal.si.edu/; Smithsonian Wild: http://siwild.si.edu; Wildlife Insights: https://www.wildlifeinsights.org/home; and the Urban Wildlife Information Network: https://urbanwildlifeinfo.org) make it possible for online data entry, data upload, project management, and expert review, each of which is critical to the operation and maintenance of a community science project, and these above-mentioned programs have already initiated multiple successful citizen science initiatives.
It is important, however, to note the potential drawbacks and limitations of citizen science camera trapping projects. A consistent and critical challenge to citizen science is maintaining data quality and consistency (Hecker et al., 2018). For example, qualitative analysis of citizen science data quality showed that only 62% of citizen science data meets scientifically accepted precision parameter thresholds (Aceves-Bueno et al., 2017; Adler et al., 2020). Citizen science data quality can be improved with close communication between project leads and volunteers and rigorous citizen science training, but this requires both extensive time and resources (Dickinson et al., 2010; Vann-Sander et al., 2016; Alexandrino et al., 2019). Additionally, collaboration with citizen science projects and online programs such as eMammal (https://emammal.si.edu/) make it possible for experts to review each citizen science classification. Another potential limitation of any citizen science camera trapping project is the ability to retain volunteers (Sauermann and Franzoni, 2015; Seymour and Haklay, 2017; Alexandrino et al., 2019). In one study, Wald et al. (2016) found that only a few participants complete large portions of work. The authors suggest that providing project-based benefits to return participants, sharing data with participants, and consistent communication between scientists and participants could address these low levels of retention. Furthermore, scientists must understand and empathize with the motivations of both new and return participants, especially with how these motivations change as volunteers progress through the project (Rotman et al., 2012).
Finally, modifications to spatially explicit density estimation are worth noting. Spatially explicit mark-resight models (Kelly et al., 2008; McClintock et al., 2009, 2012) incorporate information about both marked and unmarked individuals to estimate density. By using both marked and unmarked animals in density analysis, they have the ability to potentially expand the number of species that can be studied using camera traps by including species where not all individuals are identifiable. Gilbert et al. (2020) recently reviewed the methods for estimating the abundance of unmarked animals using camera traps, as well as their potential shortcomings, assumptions, and recommended uses. Although the authors show that mark-resight methods are not consistently used to estimate abundance or density of unmarked animals (appearing in < 5% of included studies) throughout the camera trap community and that relative abundance across study covariates remains the most common methodology, the method holds promise and is becoming increasingly more common.
Conclusions
Camera traps have been used for population monitoring for decades. Spatially-explicit mark recapture (SECR) methods make it possible to accurately estimate density over a given area, eliminating the need for ad hoc approaches like estimating individual movement through the maximum distance traveled across camera stations or applying an arbitrary buffer around the camera trap array. Currently, SECR analyses have focused on large-ranging, rare and elusive, and easily identifiable carnivores, specifically felids. These analyses have answered previously unknown questions about how these species are distributed across particular landscapes. However, a bias toward spotted, striped, or individually-identifiable animals has left much of the world's species out of the conversation when it comes to camera trap SECR benchmark studies. Furthermore, this review shows that some density estimates may not be precise enough to monitor population trends over space and time, and we offer some recommendations for increasing density precision in future studies. Conducting power analysis or simulations using readily available software should help future researchers and managers design SECR studies that meet their desired ability to monitor trends through space and time. We recommend that studies focus on increasing the total number of individuals monitored throughout a study area, which can be done by increasing the area of the camera trap array. As many studies lack the resources or labor to accomplish such an increase in effort, we recommend that researchers think about ways to incorporate new technology, such as machine-learning, web-based data entry and deployment management, and citizen science into their study design, while recognizing that the latter comes with associated drawbacks and limitations. Lastly, SECR model development to include species that have only a subset of individuals available for individual identification (often called mark-resight models), which incorporate information from both these individuals and individuals captured without individual markings, hold promise in extending the process of explicit density estimation through camera trapping to species not individually identifiable.
SECR density estimation through camera trapping is a powerful tool in the conservation biologist's or land manager's toolbox. If executed effectively, these models can be used to monitor populations of rare, elusive, large-ranging, and individually recognizable species, making it one of the best ways to benchmark the current standing of species with recognizable individual markings.
Data Availability Statement
The raw data supporting the conclusions of this article will be made available by the authors, without undue reservation.
Author Contributions
AG developed the idea for the paper, conducted the literature review, analyzed the data, and wrote the manuscript. MC helped develop the idea for the paper and reviewed the manuscript. ÇŞ helped develop the idea for the paper and wrote the manuscript. All authors contributed to the article and approved the submitted version.
Conflict of Interest
The authors declare that the research was conducted in the absence of any commercial or financial relationships that could be construed as a potential conflict of interest.
Acknowledgments
AG would like to thank the Global Change and Sustainability Center at the University of Utah for supporting this work. ÇŞ thanks Hamit Batubay Özkan and Barbara J. Watkins for their generous support. The authors would like to thank Roland Kays, Adam Duarte, a reviewer and the handling editor for their helpful comments. Their revisions greatly improved the quality of the manuscript.
Supplementary Material
The Supplementary Material for this article can be found online at: https://www.frontiersin.org/articles/10.3389/fevo.2020.563477/full#supplementary-material
References
Abolafya, M., Onmuş, O., Sekercioglu, Ç. H., and Bilgin, R. (2013). Using citizen science data to model the distributions of common songbirds of Turkey under different global climatic change scenarios. PLoS ONE 8:e68037. doi: 10.1371/journal.pone.0068037
Aceves-Bueno, E., Adeleye, A. S., Feraud, M., Huang, M., Tao, Y., and Yang, S. E. (2017). The accuracy of citizen science data: a quantitative review. Bull. Ecol. Soc. Am. 98, 278–290. doi: 10.1002/bes2.1336
Adler, F. R., Green, A. M., and Sekercioglu, Ç.H. (2020). Citizen science in ecology: a place for humans in nature. Ann. NY Acad. Sci. 1469, 52–64. doi: 10.1111/nyas.14340
Alexandrino, E. R., Navarro, A. B., Paulete, V. F., Camolesi, M., Lima, V. G. R., Green, A., et al. (2019). Challenges in engaging birdwatchers in bird monitoring in a forest patch: lessons for future citizen science projects in agricultural landscapes. Citizen Sci. Theory Pract. 4, 1–14. doi: 10.5334/cstp.247
Barry, J., and Maxwell, D. (2017). emon: Tools for Environmental and Ecological Survey Design. Available online at: https://cran.r-project.org/package=emon (accessed November 5, 2020).
Beschta, R. L., and Ripple, W. J. (2009). Large predators and trophic cascades in terrestrial ecosystems of the western United States. Biol. Conserv. 142, 2401–2414. doi: 10.1016/j.biocon.2009.06.015
Borchers, D. L., and Efford, M. G. (2008). Spatially explicit maximum likelihood methods for capture-recapture studies. Biometrics 64, 377–385. doi: 10.1111/j.1541-0420.2007.00927.x
Burton, A. C., Neilson, E., Moreira, D., Ladle, A., Steenweg, R., Fisher, J. T., et al. (2015). Wildlife camera trapping: a review and recommendations for linking surveys to ecological processes. J. Appl. Ecol. 52, 675–685. doi: 10.1111/1365-2664.12432
Cardinale, B. J., Srivastava, D. S., Duffy, J. E., Wright, J. P., Downing, A. L., Sankaran, M., et al. (2006). Effects of biodiversity on the functioning of trophic groups and ecosystems. Nature 443, 989–992. doi: 10.1038/nature05202
Chandler, M., See, L., Copas, K., Bonde, A. M. Z., Lopez, B. C., Danielsen, F., et al. (2017). Contribution of citizen science towards international biodiversity monitoring. Biol. Conserv. 213, 280–294. doi: 10.1016/j.biocon.2016.09.004
Conrad, C. C., and Hilchey, K. G. (2011). A review of citizen science and community-based environmental monitoring: issues and opportunities. Environ. Monit. Assess. 176, 273–291. doi: 10.1007/s10661-010-1582-5
Dalerum, F., Cameron, E. Z., Kunkel, K., and Somers, M. J. (2008a). Diversity and depletions in continental carnivore guilds: implications for prioritizing global carnivore conservation. Biol. Lett. 5, 35–38. doi: 10.1098/rsbl.2008.0520
Dalerum, F., Somers, M. J., Kunkel, K. E., and Cameron, E. Z. (2008b). The potential for large carnivores to act as biodiversity surrogates in southern Africa. Biodivers. Conserv. 17:2939. doi: 10.1007/s10531-008-9406-4
De Bondi, N., White, J. G., Stevens, M., and Cooke, R. (2010). A comparison of the effectiveness of camera trapping and live trapping for sampling terrestrial small-mammal communities. Wildlife Res. 37, 456–465. doi: 10.1071/WR10046
Devictor, V., Whittaker, R. J., and Beltrame, C. (2010). Beyond scarcity: citizen science programmes as useful tools for conservation biogeography. Divers. Distribut. 16, 354–362. doi: 10.1111/j.1472-4642.2009.00615.x
Dickinson, J. L., Zuckerberg, B., and Bonter, D. N. (2010). Citizen science as an ecological research tool: challenges and benefits. Annu. Rev. Ecol. Evol. Syst. 41, 149–172. doi: 10.1146/annurev-ecolsys-102209-144636
Dillon, A., and Kelly, M. J. (2008). Ocelot home range, overlap and density: comparing radio telemetry with camera trapping. J. Zool. 275, 391–398. doi: 10.1111/j.1469-7998.2008.00452.x
Efford, M. (2004). Density estimation in live-trapping studies. Oikos 106, 598–610. doi: 10.1111/j.0030-1299.2004.13043.x
Efford, M. (2010). Secr 4.1 – Spatially Explicit Capture-Recapture in R. Dunedin: Department of Zoology, University of Otago.
Efford, M. G. (2011). Estimation of population density by spatially explicit capture-recapture analysis of data from area searches. Ecology 92, 2202–2207. doi: 10.1890/11-0332.1
Efford, M. G. (2019a). secrdesign: Sampling Design for Spatially Explicit Capture-Recapture. R package version 2.5.7. Available online at: https://CRAN.R-project.org/package=secrdesign (accessed November 5, 2020).
Efford, M. G. (2019b). secrdesignapp 1.3 An Interactive App for Designing Spatially Explicit Capture-Recapture Studies. Available online at: https://github.com/MurrayEfford/secrdesignap (accessed November 5, 2020).
Efford, M. G., Borchers, D. L., and Byrom, A. E. (2009). “Density estimation by spatially explicit capture-recapture: likelihood-based methods,” in Modeling Demographic Processes in Marked Populations. Environmental and Ecological Statistics, Vol. 3, eds D. L. Thomson, E. G. Cooch, and M. J. Conroy (Boston, MA: Springer), 255–269. doi: 10.1007/978-0-387-78151-8_11
Efford, M. G., and Boulanger, J. (2019). Fast evaluation of study designs for spatially explicit capture-recapture. Methods Ecol. Evol. 10, 1529–1535. doi: 10.1111/2041-210X.13239
Efford, M. G., and Fewster, R. M. (2013). Estimating population size by spatially explicit capture-recapture. Oikos 122, 918–928. doi: 10.1111/j.1600-0706.2012.20440.x
Ergon, T., and Gardner, B. (2014). Separating mortality and emigration: modelling space use, dispersal and survival with robust-design spatial capture-recapture data. Methods Ecol. Evol. 5, 1327–1336. doi: 10.1111/2041-210X.12133
Estes, J. A., Terborgh, J., Brashares, J. S., Power, M. E., Berger, J., Bond, W. J., et al. (2011). Trophic downgrading of planet Earth. Science 333, 301–306. doi: 10.1126/science.1205106
Gallo, T., and Waitt, D. (2011). Creating a successful citizen science model to detect and report invasive species. Bioscience 61, 459–465. doi: 10.1525/bio.2011.61.6.8
Gardner, B., Reppucci, J., Lucherini, M., and Royle, J. A. (2010a). Spatially explicit inference for open populations: estimating demographic parameters from camera-trap studies. Ecology 91, 3376–3383. doi: 10.1890/09-0804.1
Gardner, B., Royle, J. A., Wegan, M. T., Rainbolt, R. E., and Curtis, P. D. (2010b). Estimating black bear density using DNA data from hair snares. J. Wildlife Manage. 74, 318–325. doi: 10.2193/2009-101
Gerrodette, T. (1987). A power analysis for detecting trends. Ecology 68, 1364–1372. doi: 10.2307/1939220
Gerrodette, T. (1993). TRENDS: software for a power analysis of linear regression. Wildl. Soc. Bull. 21, 515–516.
Gilbert, N. A., Clare, J. D., Stenglein, J. L., and Zuckerberg, B. (2020). Abundance estimation methods for unmarked animals with camera traps. Conserv. Biol. doi: 10.1111/cobi.13517. [Epub ahead of print].
Glen, S. A., and Dickman, C. R. (2003). Monitoring bait removal in vertebrate pest control: a comparison using track identification and remote photography. Wildlife Res. 30, 29–33. doi: 10.1071/WR01059
Gopal, R., Qureshi, Q., Bhardwaj, M., Singh, R. K. J., and Jhala, Y. V. (2011). Evaluating the status of the endangered tiger Panthera tigris and its prey in Panna Tiger Reserve, Madhya Pradesh, India. Oryx 44, 383–389. doi: 10.1017/S0030605310000529
Gopalaswamy, A. M., Royle, J. A., Hines, J. E., Singh, P., Jathanna, D., Samba Kumar, N., et al. (2012). Program SPACECAP: software for estimating animal density using spatially explicit capture-recapture models. Methods Ecol. Evol. 3, 1067–1072. doi: 10.1111/j.2041-210X.2012.00241.x
Griffiths, M., and Van Schaik, C. P. (1993). The impact of human traffic on the abundance and activity periods of Sumatran rain forest wildlife. Conserv. Biol. 7, 623–626. doi: 10.1046/j.1523-1739.1993.07030623.x
Harihar, A., Pandav, B., and Goyal, S. P. (2009). Responses of tigers (Panthera tigris) and their prey to removal of anthropogenic influences in Rajaji National Park, India. Eur. J. Wildl. Res. 55, 97–105. doi: 10.1007/s10344-008-0219-2
Hawthorne, T. L., Elmore, V., Strong, A., Bennett-Martin, P., Finnie, J., Parkman, T., et al. (2015). Mapping non-native invasive species and accessibility in an urban forest: a case study of participatory mapping and citizen science in Atlanta, Georgia. Appl. Geogr. 56, 187–198. doi: 10.1016/j.apgeog.2014.10.005
Hecker, S. M., Haklay, E., Bowser, A., Makuch, Z., Vogel, J., and Bohn, A. (2018). Citizen Science – Innovation in Open Science, Society and Policy. London: UCL Press. doi: 10.2307/j.ctv550cf2
Hirakawa, H. (2008). Luring bats to the bait – a new technique for bat surveys. Mammal Study 30, 69–71. doi: 10.3106/1348-6160(2005)30[69:LBTTCA]2.0.CO;2
Hooper, D. U., Adair, E. C., Cardinale, B. J., Byrnes, J. E. K., Hungate, B. A., Matulich, K. L., et al. (2012). A global synthesis reveals biodiversity loss as a major driver of ecosystem change. Nature 486, 105–108. doi: 10.1038/nature11118
Horns, J. J., Adler, F. R., and Sekercioglu, Ç. H. (2018). Using opportunistic citizen science data to estimate avian population trends. Biol. Conserv. 221, 151–159. doi: 10.1016/j.biocon.2018.02.027
Jarvis, R. M., Breen, B. B., Krageloh, C. U., and Billington, D. R. (2015). Citizen science and the power of public participation in marine spatial planning. Marine Policy 57, 21–26. doi: 10.1016/j.marpol.2015.03.011
Jimenez, J., Nunez-Arjona, J. C., Rueda, C., Gonzalez, L. M., Garcia-Dominguez, F., Munoz-Igualada, J., et al. (2017). Estimating carnivore community structures. Sci. Rep. 7:41036. doi: 10.1038/srep41036
Karanth, K. U. (1995). Estimating tiger Panthera tigirs populations from camera-trap data usingcapture-recapture models. Biol. Conserv. 71, 333–338. doi: 10.1016/0006-3207(94)00057-W
Karanth, K. U., and Nichols, J. D. (1998). Estimation of tiger densities in India using photographic captures and recaptures. Ecology 79, 2852–2862. doi: 10.1890/0012-9658(1998)079[2852:EOTDII]2.0.CO;2
Kelly, M. J., Noss, A. J., Di Bitetti, M. S., Maffei, L., Arispe, R. L., Paviolo, A., et al. (2008). Estimating puma densities from camera trapping across three study sites: Bolivia, Argentina, and Belize. J. Mammal 89, 408–418. doi: 10.1644/06-MAMM-A-424R.1
Laundre, J. W., Hernandez, L., and Ripple, W. J. (2010). The landscape of fear: ecological implications of being afraid. Open Ecol. J. 3, 1–7. doi: 10.2174/1874213001003030001
Linden, D. W., Fuller, A. K., Royle, J. A., and Hare, M. P. (2017). Examining the occupancy-density relationship for a low-density carnivore. J. Appl. Ecol. 54, 2043–2052. doi: 10.1111/1365-2664.12883
Linkie, M., Chapron, G., Martyr, D. J., Holden, J., and Leader-Williams, N. (2006). Assessing the viability of tiger subpopulations in a fragmented landscape. J. Appl. Ecol. 43, 576–586. doi: 10.1111/j.1365-2664.2006.01153.x
Loock, D. J. E., Williams, S. T., Emslie, K. W., Matthews, W. S., and Swanepoel, L. H. (2018). High carnivore population density highlights the conservation value of industrialised sites. Sci. Rep. 8:16575. doi: 10.1038/s41598-018-34936-0
Luskin, M. S., Albert, W. R., and Tobler, M. W. (2017). Sumatran tiger survival threatened by deforestation despite increasing densities in parks. Nat. Commun. 8:1783. doi: 10.1038/s41467-017-01656-4
Lyra-Jorge, M. C., Ciocheti, G., Pivello, V. R., and Meirelles, S. T. (2008). Comparing methods for sampling large-and medium-sized mammals: camera traps and track plots. Eur. J. Wildl. Res. 54, 739–744. doi: 10.1007/s10344-008-0205-8
McClintock, B. T., King, R., Thomas, L., Matthiopoulos, J., McConnell, B. J., and Morales, J. M. (2012). A general discrete-time modelling framework for animal movement using multivariate random walks. Ecol. Monogr. 82, 335–349. doi: 10.1890/11-0326.1
McClintock, B. T., White, G. C., Antolin, M. F., and Tripp, D. W. (2009). Estimating abundance using mark-resight when sampling is with replacement or the number of marked individuals is unknown. Biometrics 65, 237–246. doi: 10.1111/j.1541-0420.2008.01047.x
Meek, P. D., Ballard, G., Claridge, A., Kays, R., Moseby, T., O'Brien, A., et al. (2014). Recommended guiding principles for reporting on camera trapping research. Biodivers. Conserv. 23, 2321–2343. doi: 10.1007/s10531-014-0712-8
Neate-Clegg, M. H. C., Horns, J. J., Adler, F. R., Kemahli Aytekin, M. Ç., and Sekercioglu, Ç. H. (2020). Monitoring the world's birds with community science data. Biol. Conserv. 248:108653. doi: 10.1016/j.biocon.2020.108653
Norouzzadeh, M. S., Nguyen, A., Kosmala, A., Swanson, M. S., Palmer, C., Packer, J., et al. (2018). Automatically identifying, counting, and describing wild animals in camera-trap images with deep learning. Proc. Nat. Acad. Sci. U.S.A. 115, 5716–5725. doi: 10.1073/pnas.1719367115
Noss, A. J., Gardner, B., Maffei, L., Cuellar, E., Montano, R., Romero-Munoz, A., et al. (2012). Comparison of density estimation methods for mammal populations with camera traps in the Kaa-lya del Gran Chaco landscape. Anim. Conserv. 15, 527–535. doi: 10.1111/j.1469-1795.2012.00545.x
Obbard, M. E., Howe, E. J., and Kyle, C. J. (2010). Empirical comparison of density estimates for large carnivores. J. Appl. Ecol. 47, 76–84. doi: 10.1111/j.1365-2664.2009.01758.x
O'Brien, T. G., Kinnaird, M. F., and Wibisono, H. T. (2003). Crouching tiger, hidden prey: Sumatran tiger and prey populations in a tropical forest landscape. Anim. Conserv. 6, 131–139. doi: 10.1017/S1367943003003172
O'Connell, A. F., Nichols, J. D., and Karanth, K. U. (2011). Camera Traps in Animal Ecology: Methods and Analyses. New York, NY: Springer. doi: 10.1007/978-4-431-99495-4
O'Connell, A. F., Talancy, N. W., Bailey, L. L., Sauer, J. R., Cook, R., and Gilbert, A. T. (2006). Estimating site occupancy and detection probability parameters for meso-and large mammals in a coastal ecosystem. J. Wildl. Manage. 70, 1625–1633. doi: 10.2193/0022-541X(2006)70[1625:ESOADP]2.0.CO;2
Otis, D. L., Burnham, K. G., and Anderson, W. D. (1978). Statistical inference from capture data of closed animal populations. Wildlife Monogr. 62, 3–135.
Paviolo, A., De Angelo, C. D., Di Blanco, Y. E., and Di Bitetti, M. S. (2008). Jaguar Panthera once population decline in the Upper Parana Atlantic Forest of Argentina and Brazil. Oryx 42, 554–561. doi: 10.1017/S0030605308000641
Pesenti, E., and Zimmermann, F. (2013). Density estimation of the Eurasian lynx (Lynx lynx) in the Swiss Alps. J. Mammal 94, 73–81. doi: 10.1644/11-MAMM-A-322.1
Petersen, W. J., Savini, T., Steinmetz, R., and Ngoprasert, D. (2019). Estimating leopard cat Prionailurus bengalensis Kerr, 1792 (Carnivora: Felidae) density in a degraded tropical forest fragment in northeastern Thailand. J. Threat. Taxa 11, 13448–13458. doi: 10.11609/jott.4553.11.4.13448-13458
Ripple, W. J., Estes, J. A., Beschta, R. L., Wilmers, C. C., Ritchie, E. G., Hebblewhite, M., et al. (2014). Status and ecological effects of the world's largest carnivores. Science 343:1241484. doi: 10.1126/science.1241484
Roberts, N. J. (2011). Investigation into survey techniques of large mammals: surveyor competence and camera-trapping vs. transect-sampling. Biosci. Horizons 4, 40–49. doi: 10.1093/biohorizons/hzr006
Rotman, D., Preece, J., Hammock, J., Procita, K., Hansen, D., Parr, C., et al. (2012). “Dynamic changes in motivation in collaborative citizen science projects,” in Proceedings of the ACM 2012 Conference on Computer Supported Cooperative Work (Seattle, WA), 217–226. doi: 10.1145/2145204.2145238
Rowcliffe, J. M., and Carbone, C. (2008). Surveys using camera traps: are we looking to a brighter future? Anim. Conserv. 11, 185–186. doi: 10.1111/j.1469-1795.2008.00180.x
Royle, J. A., Chandler, R. B., Sollmann, R., and Gardner, B. (2014). Spatial Capture-Recapture. Waltham: Academic Press. doi: 10.1016/B978-0-12-405939-9.00005-0
Royle, J. A., and Dorazio, R. M. (2008). Hierarchical Modeling and Inference in Ecology: The Analysis of Data from Populations, Metapopulations and Communities. London: Elsevier.
Royle, J. A., Fuller, A. K., and Sutherland, C. (2016). Spatial capture-recapture models allowing Markovian transience or dispersal. Popul. Ecol. 58, 53–62. doi: 10.1007/s10144-015-0524-z
Royle, J. A., Fuller, A. K., and Sutherland, C. (2018). Unifying population and landscape ecology with spatial capture-recapture. Ecography 41, 444–456. doi: 10.1111/ecog.03170
Royle, J. A., Karanth, K. U., Gopalaswamy, A. M., and Kumar, N. S. (2009). Bayesian inference in camera trapping studies for a class of spatial capture-recapture models. Ecology 90, 3233–3244. doi: 10.1890/08-1481.1
Royle, J. A., Magoun, A. J., Gardner, B., Valkenburg, P., and Lowell, R. E. (2011). Density estimation in a wolverine population using spatial capture-recapture models. J. Wildl. Manage. 75, 604–611. doi: 10.1002/jwmg.79
Royle, J. A., and Young, K. V. (2008). A hierarchical model for spatial capture-recapture data. Ecology 89, 2281–2289. doi: 10.1890/07-0601.1
Sauermann, H., and Franzoni, C. (2015). Crowd science under contribution patterns and their implications. Proc. Nat. Acad. Sci. U.S.A. 112, 679–684. doi: 10.1073/pnas.1408907112
Schaub, M., and Royle, J. A. (2014). Estimating true instead of apparent survival using spatial Cormack-Jolly-Seber models. Methods Ecol. Evol. 5, 1316–1326. doi: 10.1111/2041-210X.12134
Seidensticker, J., and McDougal, C. (1993). “Tiger predatory behavior, ecology and conservation,” in Mammals as Predators, eds N. Dunstone and M. L. Gorman (Oxford: Clarendon Press), 105–125.
Seymour, V. I., and Haklay, M. (2017). Exploring engagement characteristics and behaviours of environmental volunteers. Citizen Sci. Theory Pract. 2, 1–13. doi: 10.5334/cstp.66
Silverton, J. (2009). A new dawn for citizen science. Trends Ecol. Evol. 24, 467–471. doi: 10.1016/j.tree.2009.03.017
Sullivan, B. L., Phillips, T., Dayer, A. A., Wood, C. L., Farnsworth, A., Iliff, M. J., et al. (2017). Using open access observational data for conservation action: a case study for birds. Biol. Conserv. 208, 5–14. doi: 10.1016/j.biocon.2016.04.031
Tobler, M. W., and Powell, G. V. N. (2013). Estimating jaguar densities with camera traps: problems with current designs and recommendations for future studies. Biol. Conserv. 159, 109–118. doi: 10.1016/j.biocon.2012.12.009
Trolliet, F., Vermeulen, C., Huyen, M., and Hambuckers, A. (2014). Use of camera traps for wildlife studies: a review. Biotechnol. Agron. Soc. Environ. 18, 446–454.
Turner, A. (1997). The Big Cats and their Fossil Relatives. New York, NY: Columbia University Press.
Vann-Sander, S., Clifton, J., and Harvey, E. (2016). Can citizen science work? Perceptions of the role and utility of citizen science in a marine policy and management context. Marine Policy 72, 82–93. doi: 10.1016/j.marpol.2016.06.026
Venter, O., Sanderson, E. W., Magrach, A., Allen, J. R., Beher, J., Jones, K. R., et al. (2016). Sixteen years of change in the global terrestrial human footprint and implications for biodiversity conservation. Nat. Commun. 7, 1–11. doi: 10.1038/ncomms12558
Wald, D. M., Longo, J., and Dobell, A. R. (2016). Design principles for engaging and retaining virtual citizen scientists. Conserv. Biol. 30, 562–570. doi: 10.1111/cobi.12627
Welbourne, D. J., Claridge, A. W., Paull, D. J., and Lambert, A. (2016). How do passive infrared triggered cameras operate and why does it matter? Breaking down common misconceptions. Remote Sens. Ecol. Conserv. 2, 77–83. doi: 10.1002/rse2.20
White, G. C., Anderson, D. R., Burnham, K. P., and Otis, D. L. (1982). Capture-Recapture and Removal Methods for Sampling Closed Populations. Los Alamos, NM: International Laboratory Technical Report.
Keywords: citizen science, conservation biology, biodiversity monitoring, mammals, Carnivora, wildlife ecology, density estimation
Citation: Green AM, Chynoweth MW and Şekercioğlu ÇH (2020) Spatially Explicit Capture-Recapture Through Camera Trapping: A Review of Benchmark Analyses for Wildlife Density Estimation. Front. Ecol. Evol. 8:563477. doi: 10.3389/fevo.2020.563477
Received: 18 May 2020; Accepted: 01 December 2020;
Published: 18 December 2020.
Edited by:
W. Douglas Robinson, Oregon State University, United StatesReviewed by:
Roland Kays, North Carolina State University, United StatesAdam Duarte, USDA Forest Service, United States
Copyright © 2020 Green, Chynoweth and Şekercioğlu. This is an open-access article distributed under the terms of the Creative Commons Attribution License (CC BY). The use, distribution or reproduction in other forums is permitted, provided the original author(s) and the copyright owner(s) are credited and that the original publication in this journal is cited, in accordance with accepted academic practice. No use, distribution or reproduction is permitted which does not comply with these terms.
*Correspondence: Austin M. Green, austin.m.green@utah.edu