Distribution Patterns of Microplastics in Seawater Surface at a Portuguese Estuary and Marine Park
 Diana Rodrigues
 Joana Antunes
 Vanessa Otero
 Paula Sobral1
 - 1Departamento de Ciências e Engenharia do Ambiente, Faculdade de Ciências e Tecnologia, MARE - Marine and Environmental Sciences Centre, Universidade Nova de Lisboa, Caparica, Portugal
- 2Department of Conservation and Restoration and LAQV-REQUIMTE, Faculdade de Ciências e Tecnologia da Universidade Nova de Lisboa, Caparica, Portugal
Measuring local levels of marine pollution by microplastics (MP) and identifying potential sources in coastal areas is essential to evaluate the associated impacts to environment and biota. The accumulation of floating MP at the sea surface is of great concern as the neustonic habitat consists of a feeding ground for primary consumers (including filter-feeders) and active predators, which makes these organisms a relevant via of MP input into the marine trophic chain. Here, a baseline evaluation of MP accumulation at the sea surface was conducted with a neuston net (335 μm mesh) at the Arrábida coastal area, in Portugal. The study site encompasses a marine protected area and an estuary, both under strong anthropogenic pressures due to multiple activities taking place. A short-term investigation on local spatiotemporal distribution, concentration and composition of MP was performed for the first time, through the monthly collection (summer 2018 to winter 2019) of samples at 6 stations. All the neuston samples contained MP and their mean concentration was 0.45 ± 0.52 items m−3 (mean ± SD). Both the averaged MP:neuston and MP:ichthyoplankton ratios were higher in December, when concentrations of organisms decreased. Temporal distribution patterns followed expected trends, as MP concentration was clearly higher in winter months due to precipitation and runoff. Although mean MP concentrations did not vary significantly between sampling stations, there was a spatial distribution of MP in relation to particle shape and size. Fragments were the most abundant shape and MP belonging to 1–2 mm size class were dominant. Amongst a diversity of 10 polymers identified by FTIR analysis, polyethylene (PE), polypropylene (PP) and copolymer PP/PE were the most abundant. Potential links between local sources/activities and the different polymers were suggested. Altogether, the information provided in this study aims to raise awareness among the identified sectors and consequently to act toward the prevention of MP inputs in the region.
Introduction
Tackling marine plastic pollution became a major planetary challenge of the 21st century. Besides the worldwide scientific contribution to the topic for more than one decade and the increasing public awareness, governments have proven their commitment by implementing more sustainable measures and encouraging both initiatives and changes (European Commission, 2018; UNEP, 2018). Yet, although plastic production has recently decreased in Europe from 64.4 MT in 2017 to 61.8 MT in 2018, it has continued to grow at a global level, from 348 MT in 2017 to 359 MT in 2018 (PlasticsEurope, 2019). This tendency largely relies on the persistent high demand for such a low-cost, lightweight, versatile, and durable material (Barnes et al., 2009). Consequently, and adding to the excessive consumption of disposable items (Napper et al., 2015) and poor waste management (Frias et al., 2014), plastic pollution represents a significant threat to the marine environment (Laskar and Kumar, 2019). The latest estimations pointed out between 1.1 and 8.8 MT of mismanaged plastic waste being generated annually by land-based human activities at each country (Jambeck et al., 2015). From this waste amount, a considerable part ends up in the marine environment, mainly through wastewater treatment plants discharges, land runoff or transported by the wind, rivers and tides (Andrady, 2011; Jambeck et al., 2015). Despite the greater relevance of terrestrial sources, there are several sea-based activities, such as fishing, aquaculture, maritime traffic, offshore platforms and recreational uses, which may also be considered as additional sources of plastic pollution (Browne et al., 2011; Jambeck et al., 2015; UNEP, 2016; Gewert et al., 2017).
Pioneer studies focused on plastic debris abundance and distribution in the marine environment inevitably verified that plastic pollution could act at a wide size range (from macro to nanoplastics), at a broad spectrum of impacts, as skin injuries or smothering from entanglement, gastrointestinal tract lesions or blockage from ingestion, and event act as vectors of pathogens and chemicals (Laist, 1987; Teuten et al., 2009; Kühn et al., 2015; Bowley et al., 2020). Indeed, the potential of smaller plastics to be ingested by marine biota (Barnes et al., 2009) and to be transferred throughout the trophic chain (Eriksson and Burton, 2003; Farrell and Nelson, 2013; Setälä et al., 2014), was rapidly recognized. This perception shifted the focus of investigation onto microplastics [hereafter MP; defined as particles between 1 μm and 5 mm (Arthur et al., 2009)] which developed into a new research topic addressed worldwide. In addition, the critical concern about the potential impacts of MP in human health through oral, dermal and inhalation exposure has triggered an increase of investigation on this subject although it remains poorly understood (Thompson et al., 2009; Galloway, 2015; Revel et al., 2018).
Regarding the origin of MP, it was considered to be either primary, if manufactured in microscopic size ranges (as industrial pellets and abrasives or microbeads from personal care products); or secondary, if resulting from fragmentation of larger objects (fishing gear, packaging, fibers from synthetic textile washing, paint flakes from nautical coating and dust from vehicle tire) (Cole et al., 2011; Hidalgo-Ruz et al., 2012; GESAMP, 2016; Rochman et al., 2019). The fragmentation of plastic may occur by photo-degradation, mechanical, chemical, and biological action (Barnes et al., 2009; Andrady, 2011; van Sebille et al., 2015). Regardless of its origin, an evident spatial distribution of MP in the water column occurs vertically, from the water surface to the seabed (Thompson, 2004). This mainly relies on polymers density and biofouling level, as both affect particles buoyancy (Gregory, 2009; Kaiser et al., 2017). Horizontal distribution of MP is also known to occur as a result of hydrodynamic forces, mainly by wind (Kukulka et al., 2012), tides, waves and thermohaline gradients (Zhang, 2017). In addition, both vertical (Choy et al., 2019) and horizontal distribution may be influenced by biota, through ingestion and egestion of MP in different compartments of the water column and different locations.
Regarding the impacts on marine biota upon MP ingestion, besides physical harm [e.g., damage in the gastrointestinal tract with inflammatory responses (von Moos et al., 2012) or false sense of satiation (Kühn et al., 2015)], toxicological effects have also been reported (Rochman et al., 2013; Wright et al., 2013). These rely on potential load of harmful chemicals adsorbed from seawater onto plastic and on the toxic additives incorporated during manufacture (Teuten et al., 2009). As a result, MP are suggested to act as trophic vectors of contaminants (Teuten et al., 2007; Garcia-Garin et al., 2020), although their contribution for bioaccumulation (and bioamplification) in organisms tissues may not be as relevant as other contamination pathways, such as prey ingestion or dermal uptake (Koelmans et al., 2016).
Understanding the exposure of primary consumers to MP became essential to evaluate the consequent implications in the marine trophic chain (including eventual detrimental impacts on human health due to seafood contamination). This triggered an increase in research aiming at calculating encounter rates between MP and primary consumers, based on their concentrations and ratio (Collignon et al., 2012, 2014; Hitchcock and Mitrovic, 2019). Yet, such research has been scarcely conducted in Portuguese waters (Frias et al., 2014; Rodrigues et al., 2019), being insufficient for a country where fisheries have a large cultural and social importance (FAO, 2017) and where seafood constitutes a very important diet component (FAO, 2010; Almeida et al., 2015; EUMOFA, 2020).
Both the Sado estuary and Professor Luiz Saldanha Marine Park, located at the Portuguese west coast, are important nursery areas for fish larvae (Borges et al., 2007, 2009) and constitute valuable artisanal fishing grounds (Horta e Costa et al., 2013a,b; Batista et al., 2015). However, there are multiple anthropogenic activities taking place at this coastal zone, potentially contributing to local and regional MP pollution and thus posing a threat to this hotspot of biodiversity (Cunha et al., 2014). In this context, this study aims to contribute with baseline data on MP pollution at a Portuguese estuary and marine park by assessing temporal and spatial variations in concentration, distribution, and composition of MP particles. Two hypotheses are tested: (i) MP concentration decreases at sampling stations far away from the metropolitan area of Setúbal; and (ii) MP concentration increase in winter months when compared to summer and autumn months. Additionally, since these are important nursery areas for fish larvae, the ratio of MP to ichthyoplankton was calculated separately from the MP to neuston ratio, aiming to be useful either for comparing with other regions or as a simple and clear take-home message at science outreach activities.
Materials and Methods
Study Area
The study area, located on the west coast of Portugal, encompasses the south-facing coastal area between the city of Setúbal and the village of Sesimbra (Figure 1). It comprises both the mouth of Sado estuary [designated as the transitional water body Sado-WB1 (ARH Alentejo, 2012)] and the Professor Luiz Saldanha Marine Park (from its eastern side - Figueirinha beach – until the buffer area contiguous to Sesimbra). The meso-tidal homogeneous Sado estuary has a mainly tidally driven flow (Martins et al., 2002) with an annual average flow of 40 m3s−1 (Vale et al., 1993). It is under considerable anthropogenic pressure due to numerous activities (mostly occurring in its northern margin), from urban and industrial (including maritime traffic), to agriculture and animal production, fisheries and tourism sectors (APA, 2016). Nevertheless, this estuary (Ramsar site no. 826) encompasses a Nature Reserve [RNES (ICNF Reserva Natural do Estuário do Sado)], where birds and habitats are, respectively, protected by a Special Protection Area (PTZPE0011; Birds Directive) and a site classified under the Habitats Directive (PTCON0011), both belonging to Natura 2000 network. Located outside these conservation areas, the Sado-WB1 is adjacent to the city of Setúbal (ca 119.000 inhabitants: Statistics Portugal 2013), being close to a multipurpose terminal port, ship repair yard and to the submarine outfall of Setúbal wastewater treatment plant. Along the Sado-WB1 margins, where two streams discharge (Comenda and Livramento), there are diverse nautical and tourist facilities, an important cement industry, an Orthopedic Hospital and beaches of high demand.
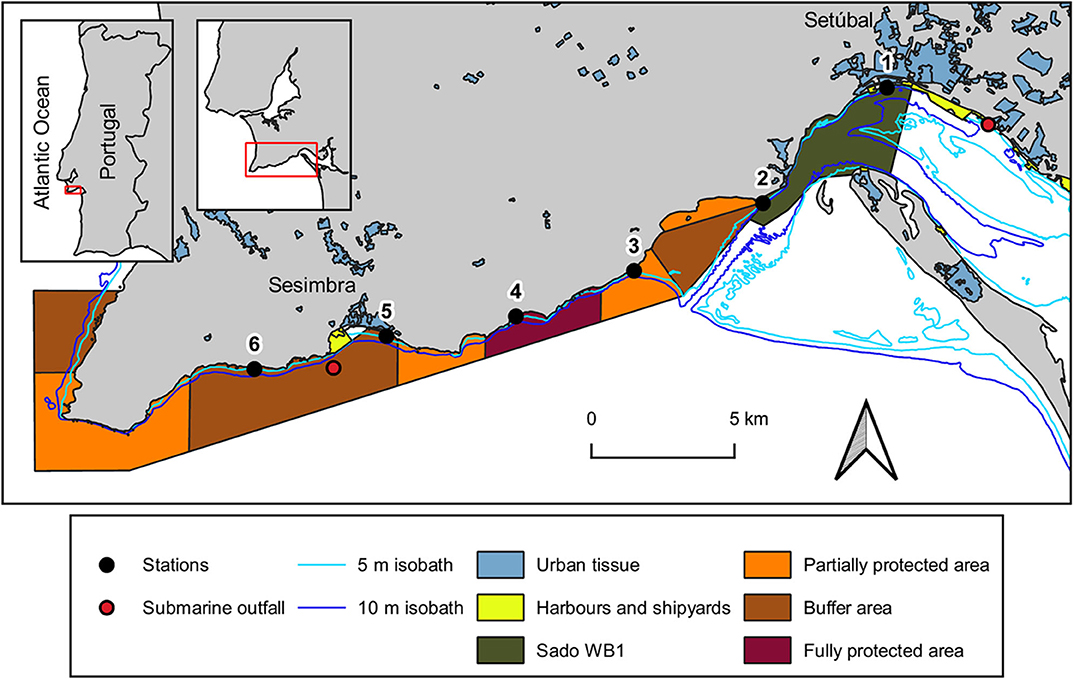
Figure 1. Map of the study area with the location of sampling stations at the coastal area between Setúbal city and Sesimbra village, at the Portuguese west coast. Urban tissue includes industry and tourist facilities. The isobath lines were provided by Instituto Hidrográfico and the submarine outfalls location was given by Águas do Sado (Setúbal WWTP) and SIMARSUL (Sesimbra WWTP). Map creation was based on 2 information layers: (1) land use and occupation of 20181 and (2) transitional surface water bodies of Portugal mainland2, respectively developed by Direção-Geral do Território and by Agência Portuguesa do Ambiente. Marine park borders and protection areas were depicted according to the POPNA spatial plan regulation (no. 141/2005).
Established westward from the estuary, is Professor Luiz Saldanha Marine Park (hereafter marine park), a sheltered coastline from the prevailing north and north-west winds by the Arrábida mountain chain (Henriques et al., 1999). The different protective measures established in this marine park aim to minimize the impacts of nautical, recreational and fishing activities on its biological and ecological patrimony (Henriques et al., 1999). The erosion of the adjacent cliffs of Arrábida (Gonçalves et al., 2002; Costa et al., 2013) contribute to the complex substratum found in this subtidal rocky reef, which is expected to export MP to the adjacent marine environment due to the breakdown of larger items through physical abrasion on rocks (Eriksson and Burton, 2003; Cheshire et al., 2009). One of 2 submarine outfalls regularly used for effluent discharges of wastewater treatment plants of Sesimbra Municipality (ca. 50.000 inhabitants; Statistics Portugal 2013) is located within the study area.
Sampling Methods
Six sampling campaigns were conducted from August 2018 to February 2019 (summer to winter), at 6 stations (Table 1). These were located at the 5 m isobaths and distributed 5 km apart from each other, from the mouth of Sado estuary through the marine park (Figure 1). In each station, a 30 min neuston trawl (following Directive, 2013) was performed in the E-W direction, at a constant speed of 1-3 knots. Initial and final GPS positions were registered and enabled trawl length and area calculations to allow posterior standardization of MP data (following Law et al., 2014). Sampling campaigns were specifically scheduled to days with calm weather conditions (Beaufort wind scale ≤3) and tows were performed out of the vessel wake zone (ca 25 m behind the vessel). Precautions intended to reduce vertical mixing of buoyant plastic particles and consequently increase the efficiency of the selected equipment (neuston net). The 3 m long neuston net (Aquatic Biotechnology) had a stainless steel 0.8 × 0.3 m (width × height) rectangular opening and a 335 μm polyamide mesh. Its floatation system assured that only half of the opening frame was submerged (therefore collecting MP floating in the top 15 cm of the water column). The flowmeter (Hydro-bios) attached to the lower third of the net opening enabled the calculation of the volume of filtered water. As only half of the net opening is submerged, the volume was calculated with the following formulae:
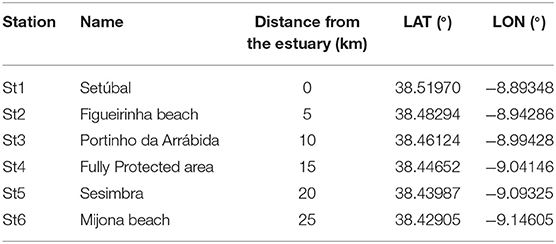
Table 1. Name, distance from the estuary (km) and GPS (datum WGS-84) coordinates of each sampling station.
Following each tow, the content in the cod end container was thoroughly poured into a 250 μm stainless steel mesh sieve (where larger pieces of biological material as sticks, seagrass leaves and algae, were rinsed with filtered seawater before being discarded) and then stored in glass jars. A small aliquot (ca 50 ml) per sample was collected and preserved separately, in 100 ml of 70% ethanol, to allow the identification of neustonic organisms and the calculation of the MP:neuston and MP:ichthyoplankton ratios. The neuston samples (n = 36) were transported in ice coolers to the laboratory and then frozen at −20°C.
Laboratory Procedures
Sample Processing and Microplastics Characterization
Due to the considerable volume of biological material present, samples were processed according to Gago et al. (2018). After thawing, the sample was transferred to a 2 L glass beaker where the biovolume was measured after 1 h of sedimentation. Then, the organic content digestion was performed by adding a 10% KOH solution, with volume equivalent to at least 3 times the sample biovolume. Following the 48 h of digestion at room temperature, density separation was conducted by adding 1 L of a hypersaturated NaCl solution (1.2 g cm−3). After manual stirring, it was left to settle for 1 h before filtration of the supernatant with a vacuum filtration system. After filtration of every 500 ml (approx.), the sample was stirred and allowed to settle again before the next filtration. Each filter (MFV2 glass fiber filter with 47 mm Ø and 1,0 μm pore; FILTER-LAB) was stored in a covered Petri dish until observation under a stereoscopic microscope (Leica MZ12.5) equipped with a camera (MOTICAM 10+). Particles were measured with the Motic Images Plus 3.0 software, considering the 0.335-5 mm size range (the lower limit corresponds to mesh size of the neuston net) and then attributed to one of the following size classes: 0.335-1, 1-2, 2-3, 3-4, and 4-5 mm. Characterization consisted of registering both color and shape. Particles were assigned to one of six shapes: fragment, film, foam, fiber, filament, and bead [Table 2; adapted from Lusher et al. (2017)]. The particles selected to follow polymer identification were isolated in covered concave slides. MP concentration was reported as items m−3 and items km−2 to enable comparisons with similar studies.
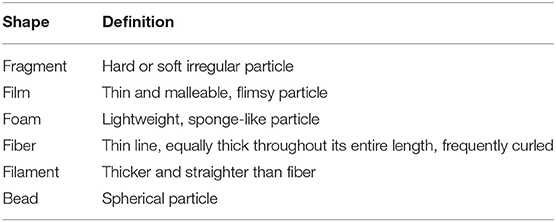
Table 2. Particle shape definition.
Polymer Identification
Selection of particles for polymer identification, from all shapes (Table 3), was based on the best expert judgment according to similarity, texture, thickness, shine and reaction to touch (following Lusher et al., 2017).
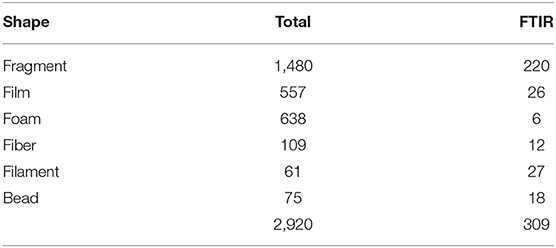
Table 3. Total of particles and number of MP selected for FTIR per shape.
Polymer identification was achieved by Fourier Transformed Infrared Spectroscopy (FTIR). The majority of the particles (mainly between 1 and 5 mm) were analyzed in attenuated total reflectance (ATR) mode. Spectra were acquired using an Agilent Handheld 4300 FTIR Spectrometer with a DTGS detector, with controlled temperature and a diamond ATR sample interface; the analyses were performed at the sample surface. Spectra were acquired with a resolution of 4 cm−1 and 32 scans. For fibers and smaller particles (mainly at the 0.335-1 mm size range), analyses were carried out in a Nicolet Nexus spectrophotometer coupled to a Continuμm microscope (15x objective) with an MCT detector. Spectra were collected in transmission mode, with a resolution of 8 cm−1 and 128 scans. The spectra are shown here as acquired, without corrections or any further manipulations, except for the occasional removal of the CO2 absorption at ca. 2,300–2,400 cm−1. The identification of polymers was first made by searching in the extensive polymer spectral database of the Department of Conservation and Restoration (FCT NOVA) and the assignments were confirmed by analysis of the polymers characteristic bands (Hummel, 2002).
Quality Assurance (QA) and Quality Control (QC)
The airborne contamination was analyzed by exposing wet filters to the air (procedural controls; blanks), both during field (inside a hanging open glass jar, at the boat deck, one per sampling campaign) and lab work (inside Petri dishes, one at the left and one at the right of the working area, per group of 3 samples). All the fibers extracted from a sample which were similar to those found in the respective blanks (from field and lab work) were excluded from results. Sources of contamination were also minimized both during field and lab work by using glass, stainless steel and aluminum materials. Samples were kept covered at all times, both cotton lab coat and nitrile gloves were always worn, and benches and equipment were rinsed before use with Milli-Q filtered water and ethanol.
MP:neuston and MP:ichthyoplankton Ratios
The biovolume of neuston aliquots was registered after 1 h of sedimentation in the graduated cylinders and then homogenized (manual stirring). Three subsamples of 2 ml each were analyzed under a stereomicroscope using a Bogorov counting chamber. Apart from insects, neuston organisms mainly consisted of zooplankton. Dominant groups (fish larvae and eggs, Mysidacea, Polychaeta, Chaetognata, Apendiculata, Bivalvia larvae, zoea and megalopa of Brachyura, Cladocera, naupli of Cirripedia, Copepoda, Echinodermata larvae, Amphipoda, Isopoda and Insecta), rather than individual species or genera (Di Mauro et al., 2017), were counted with the support of a hand tally counter, enabling the calculation of each group abundance. Mean counts (all dominant groups were considered for MP:neuston ratio, whereas only fish larvae and eggs were considered for MP:ichthyoplankton ratio calculation) were extrapolated according to the aliquot and sample biovolume and then converted to individuals m−3.
Statistical Analysis
To evaluate how the MP:neuston ratio varied temporally (along 6 months) and spatially (between the 6 stations), a Kruskal-Wallis test was performed. This non-parametric test, conducted after the invalidation of parametric assumptions, was followed by posthoc multiple comparisons with the Dunn's test. The same tests were applied for MP:ichthyoplankton ratio.
A two-way ANOVA without replication was performed to assess whether temporal (6 campaigns) and spatial (6 stations) variation occurred in MP concentration (dependent variable). This parametric test was used after Box-Cox transformation of original data to meet normality (Shapiro-Wilk test) and homogeneity of variances (Levene test) assumptions. Posthoc Bonferroni's test (p < 0.05) were used to identify the sources of significant differences. Analysis were conducted in Statistica 13 (Statsoft) software.
The effect of campaigns and stations (fixed factors; with 6 levels each) in MP concentration of each particle shape (multivariate data) was tested by a permutational multivariate analysis of variance (PERMANOVA), with 999 permutations. Data were square-root transformed and the resemblance matrix between samples was calculated based on Bray-Curtis similarities. When differences were statistically significant, pair-wise comparisons among levels were analyzed. Then, to determine which particle shape most contributed to explain the dissimilarity amongst each pair of samples, the similarity percentages routine (SIMPER; with a cut-off percentage of 90% for low contributions) was conducted. These statistical procedures, which were conducted in the Primer 6 software with the Permanova+ add-on (Clarke and Gorley, 2006; Anderson et al., 2008), were similarly applied to understand the response of MP concentration of each size class to both factors (campaigns and stations).
Results
Presence and Concentration of Microplastics
From the total of particles (3,317) extracted from the 36 neuston samples, 353 (11%) were discarded for being considered airborne contamination fibers and 44 (1%) were excluded after being identified as non-plastic particles by Fourier Transformed Infrared Spectroscopy. Therefore, the assessment of the temporal and spatial distribution of MP (size range 0.335 to 5 mm) was based on a total of 2,920 particles. All samples contained MP, with a mean concentration of 0.45 ± 0.52 items m−3 (mean ± SD) and 40,822.58 ± 43,578.63 items km−2. While the highest concentration per cubic meter was found in February at Figueirinha beach (St2; 2.06 items m−3), the highest concentration per square kilometer was verified at Setúbal (St1; 203558.50 items km−2). Conversely, the lowest concentration (0.04 items m−3 or 2,068.85 items km−2) was observed at Mijona beach (St6) in October (Figure 2). The number of MP ranged from 405 at St1 in February to 5 MP at St6 in October.
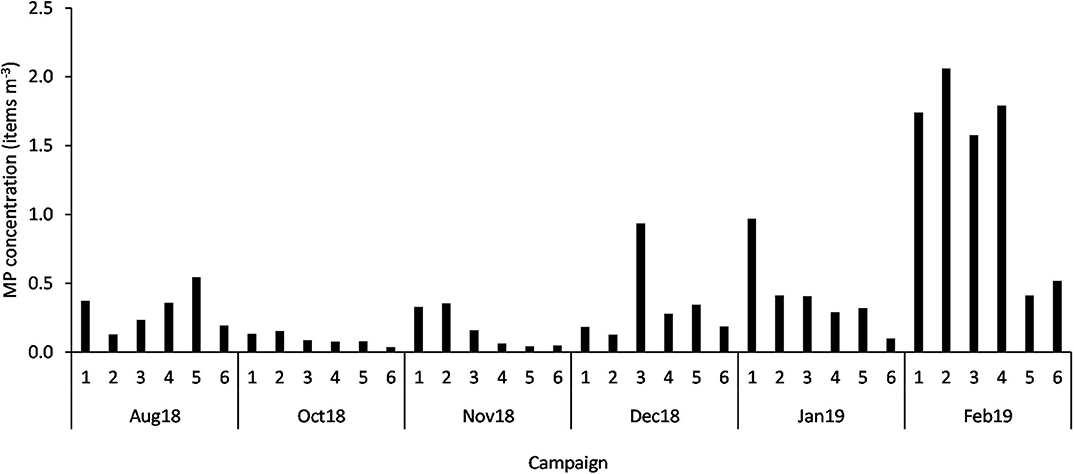
Figure 2. MP concentration (items m−3) in each sample (n = 36; 1 to 6 stations; Aug 18 to Feb 19 campaigns).
Fourier Transformed Infrared Spectroscopy (FTIR) Analysis
Among 265 particles confirmed as microplastics by FTIR analysis, a total of 10 polymers were identified (Table 4; Figure 3), including a Copolymer PP/PE. Despite the diversity of polymers identified, three of them (PE, PP and Copolymer PP/PE) represented more than 90% of the particles. Kaolin was also identified associated with PS and Copolymer PP/PE.
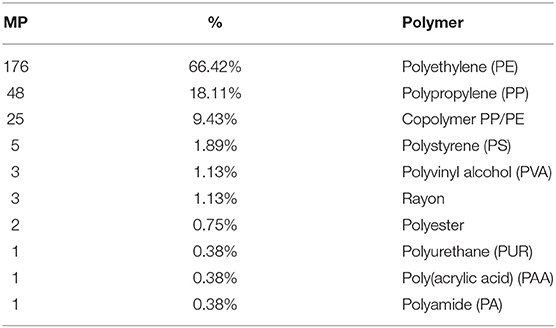
Table 4. MP number and relative abundance (%) assigned to each polymer.
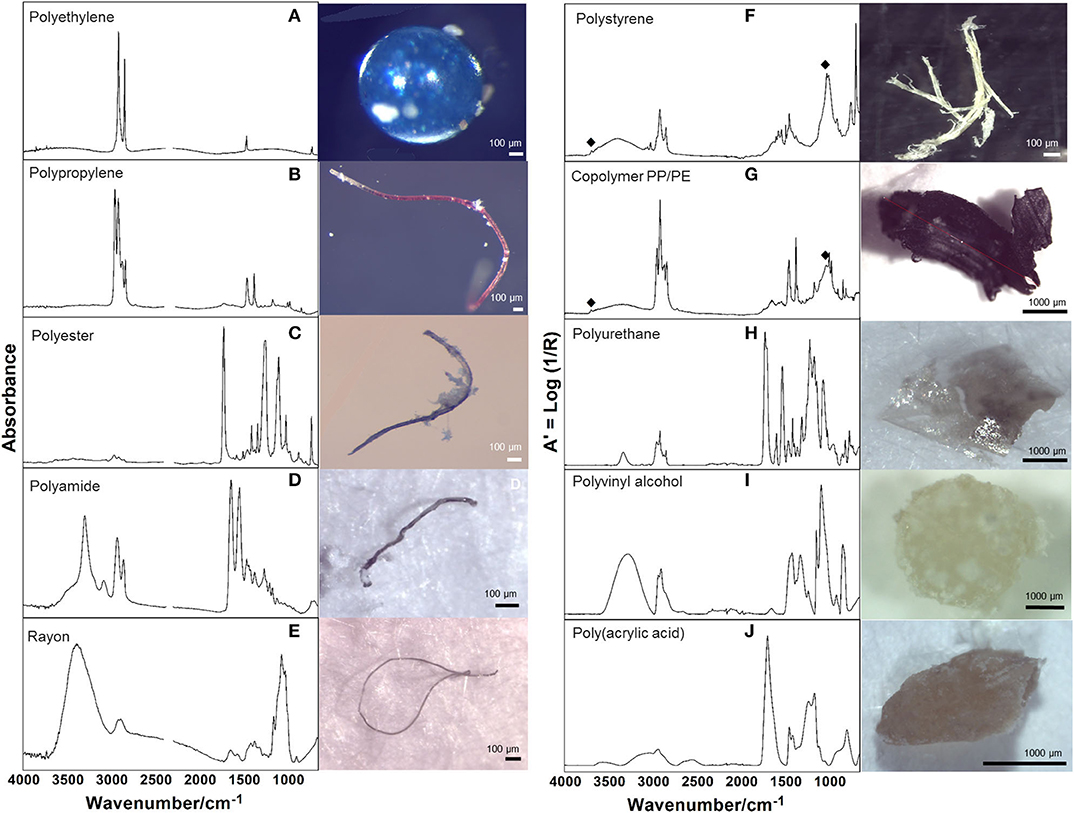
Figure 3. Representative infrared spectra of the identified polymers, analyzed in transmission (left column) and ATR mode (right column); ♦ identifies the presence of kaolin. The image assigned to each spectrum corresponds to the particle analyzed by FTIR. (A,I) Bead; (B–E) Fiber; (F,G,J) Fragment; (H) Film shapes.
MP:neuston and MP:ichthyoplankton Ratios
Considering all samples, the MP:neuston ratio was 0.0009 ± 0.0013, with the highest ratio 0.0059 (or 1:168.398) occurring in December (Figure 4), when neuston concentrations reached minimum levels (76.61 individuals m−3). The average MP:ichthyoplankton ratio was 0.091 ± 0.146, with the highest ratio 0.773 (or 1:1.294) being observed in November. A statistically significant variation at the MP:neuston (H = 20.80, p < 0.001) and MP:ichthyoplankton (H = 17.32, p < 0.05) ratios was found between campaigns (Figure 5) but not between stations.
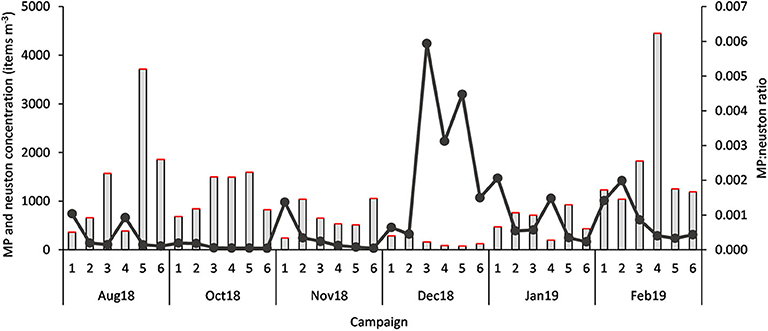
Figure 4. MP concentration (items m−3) (red bar), neuston concentration (items m−3) (gray bar) and MP:neuston ratio (dark gray dots), in each sample (n = 36; 1 to 6 stations; Aug 18 to Feb 19 campaigns).
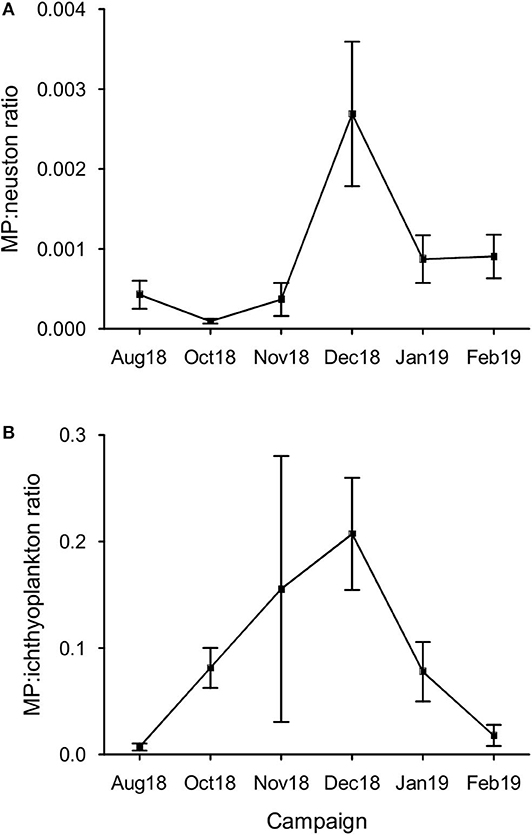
Figure 5. Variation of the MP to primary consumers ratio in the sampling period. (A) MP:neuston ratio per campaign (mean ± SE, n = 6); (B) MP:ichthyoplankton per campaign (mean ± SE, n = 6).
Temporal and Spatial Distribution
MP concentration in February was significantly higher than those found in all other campaigns (Figure 6A), except for January (Bonferroni test, p < 0.05). In October, concentration was the lowest and significantly different from January. MP concentration did not vary significantly between stations (p = 0.06; Figure 6B).
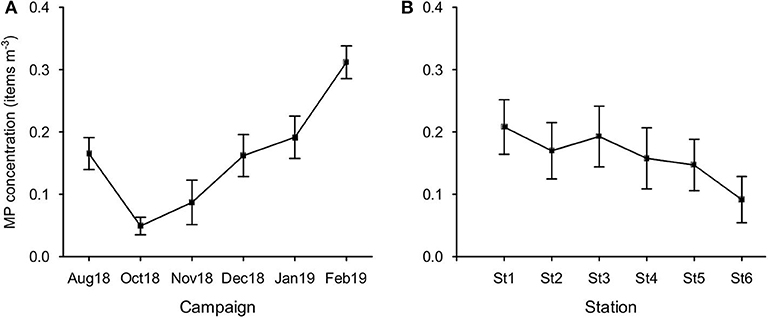
Figure 6. Variation of MP concentration (items m−3; mean ± SE) per campaign (A) and per station (B).
Distribution Variations According to Particle Shape
The relative abundance of six MP shapes (Figure 7) had the following decreasing order: fragment (51%) > foam (22%) > film (19%) > fiber (4%) > bead (3%) > filament (2%). The PERMANOVA results showed significant differences in the MP concentration of each particle shape, between sampling campaigns (Pseudo-F = 6.57, P(perm) = 0.001) and stations (Pseudo-F = 2.11, P(perm) = 0.008). MP concentrations per particle shape differed mainly between October and February, but also between each of these 2 months and all the other campaigns. The combination of the 3 predominant shapes: fragments, films and foams contributed with more than 71% (cumulative percentage) for the dissimilarities between all pairs, with concentrations being always higher in February (Figure 8A). An additional result from pair-wise comparisons concerned the dissimilarities between November and January campaigns, which were based on the higher concentration of fragments, foams and beads (with contributions of 27.87, 24.54, and 14.28%, respectively), found in January. Regarding spatial variation, the relatively higher foam and bead concentrations at St1 (estuary) explained dissimilarities found between this station and both St5 (Sesimbra; foam-24.82% and bead-14.00% contributions) and St6 (Mijona beach; foam-27.44% and bead-13.26% contributions) (Figure 8B). Moreover, at St6 concentrations of fragments were significantly lower than St3 (Portinho da Arrábida). No plastic pellets were collected in this study and all beads belonged to the smaller size class (0.335-1 mm).
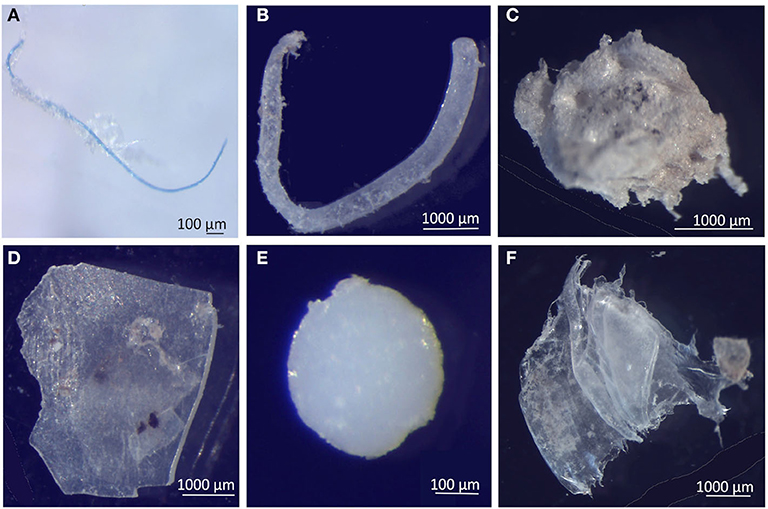
Figure 7. Selected microplastics from each particle shape, in neuston samples from the Sado estuary and Professor Luiz Saldanha Marine Park. (A) Fiber; (B) Filament; (C) Foam; (D) Fragment; (E) Bead; (F) Film.
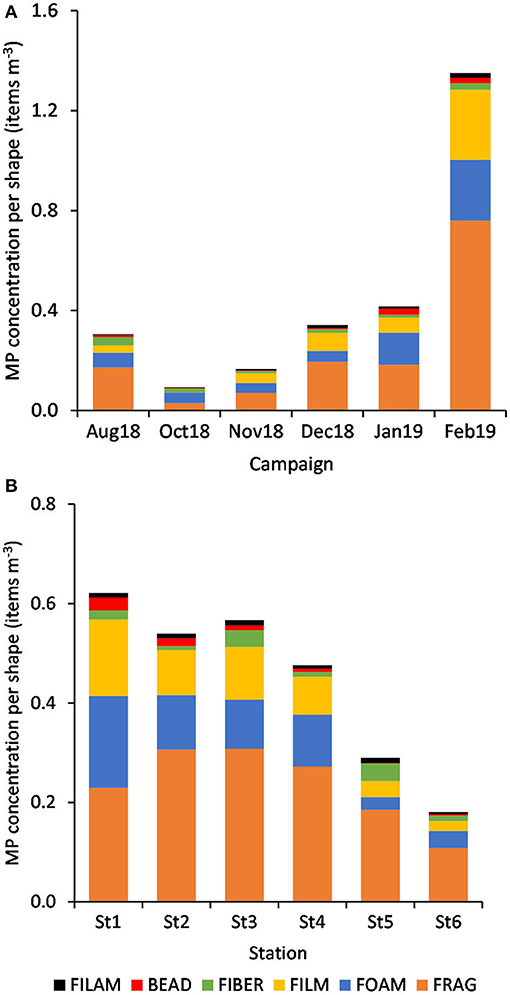
Figure 8. Variation of MP concentration (mean items m−3, n = 6) per particle shape, by campaign (A) and by station (B).
Distribution Variations According to Size Class
By decreasing order, the relative abundance of each size class (mm) was: 1-2 (36%) > 2-3 (24%) > 3-4 (16%) > 0.335-1 (15%) > 4-5 (9%). According to PERMANOVA results, MP concentration varied according to size class between campaigns (Pseudo-F = 7.69, P(perm) = 0.001) and stations (Pseudo-F = 2.55, P(perm) = 0.005). MP belonging to the 1-2 and 2-3 mm size classes explained (with more than 46% of cumulative contribution) the dissimilarities found between February and all the other campaigns and also between January and both November and October months (Figure 9A). In addition, while the 0.335-1 mm size class largely contributed (ca. 29%) to distinguish August from October (being more represented in August), the higher concentration of MP at the 1-2 and 3-4 mm class sizes in December, compared to October, contributed more than 48% for their differences. The particle size range at St6 (the furthest station from the estuary) was distinct from all the others, mainly due to its low concentration of MP belonging to the 3-4 mm size (contributions between 21 and 25%) and particularly different from St1 and St4 due to the smaller concentration of MP at the 4-5 and 1-2 mm size ranges, respectively (Figure 9B).
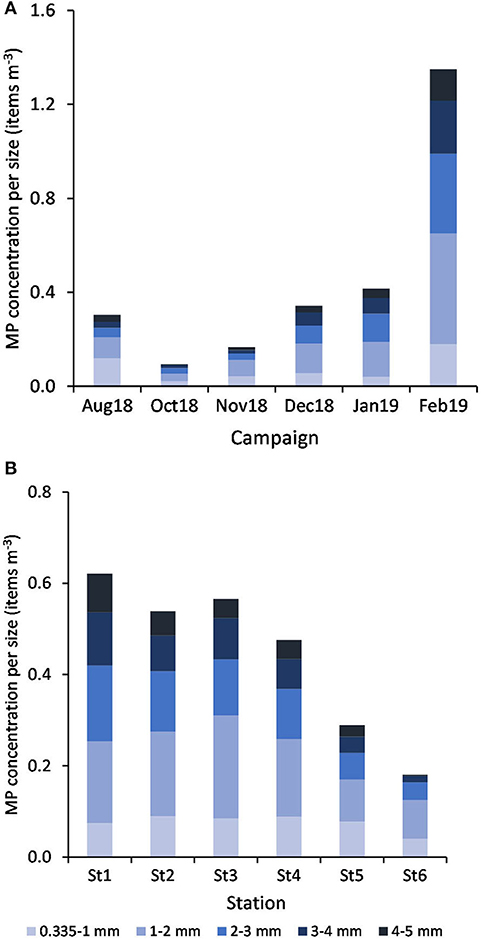
Figure 9. Variation of MP concentration (mean items m−3, n = 6) per size class, by campaign (A) and by station (B).
Discussion
Presence and Mean Concentration of Microplastics – Comparison With Other Studies
The presence of MP in all coastal samples collected in this study is in accordance to reported MP pollution levels close to shore and to estuaries, either at Portuguese (Frias et al., 2014), European (Pedrotti et al., 2016; Frère et al., 2017), Gulf of Mexico (Di Mauro et al., 2017) or Indonesian (Germanov et al., 2019) waters. The mean MP concentration found in this study (0.45 ± 0.52 items m−3) was higher than levels found in other Portuguese locations such as the Douro estuary (0.17 ± 0.16 items m−3; Rodrigues et al., 2019) and others (Aveiro: 0.002 ± 0.001 items m−3; Lisboa: 0.033 ± 0.021 items m−3; Costa Vicentina: 0.036 ± 0.027 items m−3; Algarve: 0.014 ± 0.012 items m−3; Frias et al., 2014), but was lower than values reported by Bessa et al. (2018) for the Mondego estuary (1.53 ± 1.04 items m−3).
In addition, if compared with surface waters of estuaries and contiguous coastal areas from other countries, our study area presents higher MP concentrations than those quantified by Lima et al. (2014) at the Goiana estuary in Brazil (0.26 items m−3). Conversely, mean MP concentration at Arrábida was more than one order of magnitude lower than the 3 estuaries in Australia east-coast investigated by Hitchcock and Mitrovic (2019) (with a range of 23–198 items m−3 at the Clyde estuary, the one with the lowest MP concentration). However, comparisons must be performed cautiously as local environmental conditions, levels of anthropogenic pressure, and methodologies applied may differ among studies (Lima et al., 2014). In fact, the lack of methodologies standardization has been often highlighted (Gago et al., 2018; GESAMP, 2019) and remains a current challenge.
MP:neuston and MP:ichthyoplankton Ratios
The accumulation of floating MP at the seawater surface layer leads to concerns about the exposure of neustonic organisms, such as zooplankton (including ichthyoplankton), to these synthetic particles and, consequently, of their active predators and filter-feeding biota (Collignon et al., 2012).
As expected, the increasing tendency of MP concentration observed in winter months and the simultaneous decline of zooplankton and larval fish abundance (Cunha, 1993; Primo et al., 2011) increased both MP:neuston and MP:ichthyoplankton ratios in this time of the year. Regarding the MP:ichthyoplankton ratio, although MP have never exceeded ichthyoplankton in number at any sample, their similar proportions suggest a higher potential for MP to be ingested either by fish larvae or by ichthyoplankton's predators [crustaceans: crabs, shrimps, euphausiids, amphipods, and copepods; ctenophores; fishes; medusae (Bailey and Houde, 1989; Paradis et al., 1996)]. As a consequence, it would be expected to find critical variations in the following spring at these important nursery areas. Further studies focused on MP:ichtyoplankton ratio and on MP ingestion by wild fish larvae would be essential to confirm possible impacts, as their survival largely influence fish recruitment success and population fluctuations (Houde, 1987).
The average MP:neuston ratio verified in this work (0.0009) was low when compared to other studies: 0.002 at the Bay of Calvi (Collignon et al., 2014) and 0.2 at the Ligurian Sea (Pedrotti et al., 2014). To our knowledge, besides the MP to fish larvae ratio (1.5:1.0; fish eggs excluded) found in Douro river, Portugal (Rodrigues et al., 2019), no studies have assessed the proportion between MP and ichthyoplankton alone (0.091 in average; 1:1.294 maximum), as it has been pooled together with all other zooplankton organisms.
Temporal and Spatial Distribution
Both temporal and spatial distribution variations were verified for MP concentration in our study site. As expected, MP concentrations increased significantly in winter months, achieving a maximum in February. This is in agreement with the reported increase of MP concentrations in marine coastal waters after storms and heavy rainfall, typically frequent in winter season for Mediterranean-type climatic conditions (Santos et al., 2005), which induces frequent floods and increase river discharges (Veerasingam et al., 2016; Gündogdu et al., 2018; Hitchcock, 2020). Regarding the spatial distribution, it was anticipated a clear seaward decrease in MP concentration at stations further away from the metropolitan area of Setúbal (Sado estuary), with an eventual increase at the station close to Sesimbra. Instead, MP pollution level found at stations located between Setúbal and Sesimbra municipalities kept similar orders of magnitude, although with a slight decrease tendency. Such retention of MP, which might be related with the shelter provided by Arrábida mountain chain against the prevailing north and north-west winds, may impact the high biodiversity of this Marine Park. Therefore, the continuous input of MP in the estuary (at St1, the closest station to the urban area of Setúbal) is suggested to partially accumulate in the sheltered Arrábida nearshore area.
Further explanations could rely on the hydrodynamics at the Arrábida rocky reef which may potentially enhance fragmentation of both MP or even larger items, by mechanical action against rocks (Eriksson and Burton, 2003; Cheshire et al., 2009) contributing for the increase of secondary MP. Subsequently, the continuous exportation of these MP by local currents could explain the considerable concentration of particles at st5, despite being distant from the estuary. Concentrations calculated at this station may also result from Sesimbra village input of MP yet, due to the fragmentation potential at the sandy surf zone of this sheltered bay, particles may easily achieve sizes which are not retained by the neuston net.
Lastly, fragmentation enhanced during retention at the Arrábida nearshore may also contribute to export MP in the coastal drift, explaining the unexpected high concentration of MP reported further south by Frias et al. (2014) at Costa Vicentina.
Distribution Variations According to Particle Shape
Bead and foam shapes presented distinct patterns in their distribution at the study area, unlike the other MP shapes. Both were predominantly collected in station 1 (Setúbal), contrasting with station 5 and 6 (Sesimbra and Mijona beach), with concentrations being higher in the January and February campaigns. The preponderance of foam shape (expanded polystyrene) in the estuary is potentially related to fisheries activities, consisting of secondary MP from the breakdown of buoys and cooler boxes for bait and catches, which despite the decrease of fishery activities during winter (DGRM, 2018) are frequently kept close to the seashore and left exposed to adverse weather conditions till the next fishing season. Conversely, beads (primary MP) are suggested to enter in the marine ecosystem by wastewater treatment plant (WWTP) effluents after domestic use (Fendall and Sewell, 2009), as these particles may not be retained in the treatment processes. The predominance of fragments in this study is in line with results from a similar study performed in Portugal, in the Douro estuary (Rodrigues et al., 2019) and in Australia, at Clyde, Bega and Hunter estuaries (Hitchcock and Mitrovic, 2019). This suggests that secondary sources of MP prevail, rather than primary sources, and are related with the diverse activities taking place in the nearby urban area, including littering. Our findings differ from studies reporting fibers as the predominant shape detected (Beer et al., 2018; Bessa et al., 2018), usually attributed to fishing ropes degradation (Ramos et al., 2012) and to the inefficient retention of fibers from textile laundry by the WWTP (Browne et al., 2011). In fact, fibers represented only 4% of the total of MP found in our study, after the exclusion of airborne contamination (11%) from the original MP amount. The small abundance of fibers reported here may rely on the retention efficiency of treatment processes of WWTW (Gies et al., 2018) at both Setúbal (advanced secondary treatment) and Sesimbra (tertiary treatment) Municipalities, or be related to the sampling method applied, as neuston nets are suggested to underestimate the concentrations of fibers when compared with other methods (Barrows et al., 2017; Green et al., 2018).
Distribution Variations According to Size Class
Distribution patterns of MP according to their size were noticed both in time and space. In fact, the predominance of bigger sized MP (3-4 and 4-5 mm size) inside the estuary, the abundance increase of MP in December (beginning of winter), particularly MP belonging to the 3-4 mm size class and the high concentration of MP from intermediate size classes (1-2 and 2-3 mm) at january and mostly in February, suggest that MP inputs in this Portuguese region occur mostly close to Setúbal and mainly consists of larger particles which undergo fragmentation over time.
The preponderance of 1-2 mm sized particles among the 5 size classes, instead of the expected smallest size class (0.335-1 mm), according to Norén (2007) and Kang et al. (2015) findings, may be essentially related with the sampling method used here. As mentioned before, the use of neuston nets may underestimate fibers concentrations, which are more malleable and easier to escape through the net mesh, explaining the low concentrations of fibers collected here and in particular those belonging to our smallest size class (0.335-1 mm). Secondly, the reduced concentration of MP belonging to the 0.335-1 mm size class could be related with the retention time spent at sheltered stations, which could enhance biofouling levels and consequently cause smaller particles to sink (Kaiser et al., 2017) or to be ingested, as biofilms are suggested to increase MP palatability (Vroom et al., 2017).
As several studies have already highlighted (Song et al., 2014; Lenz et al., 2016), MP concentrations at surface waters are potentially underestimated due to the lower size limit of the range considered for monitoring, usually ca. 330 μm (net mesh used). Consequently, as there is a tendency over time for continuous fragmentation of plastic and permanent input into the marine ecosystem, studies are missing the size fraction which is potentially more abundant and easily ingested by primary consumers (Cole et al., 2013). Therefore, the selection of a sampling method that efficiently collects smaller MP in further studies would be required to clarify the abundance patterns found at this coastal area.
Polymer Diversity
Polymer identification of particles in plastic pollution studies is essential to confirm visual identification processes (Löder and Gerdts, 2019), to characterize the diversity of polymers available and to assist in identifying potential local sources, as it will empower authorities and stakeholders to tackle this global concern by implementing efficient prevention measures. The high polymer diversity (10 polymers) detected mirrors the diverse activities performed in the area, both on land (domestic, commercial, industrial and tourism) and at sea (fishing and recreational activities, intense maritime traffic to shipyards). As expected, polyethylene (PE) and polypropylene (PP) showed higher percentages, since they are widely used in many applications (mainly packaging of consumer goods and single-use items). Nevertheless, there was also a considerable amount of particles identified as copolymer PP/PE, which occurs as an industrial way to recycle both PE and PP by giving origin to other high demanding applications and expanding market options (Graziano et al., 2019), as containers, outdoor decking or sack bags (Aumnate et al., 2019). Polystyrene (PS) particles, can be related to fragmentation of disposable cutlery, cups and Styrofoam® items (expanded and extruded PS, EPS and XPS), which are currently used in fishing activities, in food trays and other disposable items (Farrelly and Shaw, 2017). A note should be mentioned regarding the presence of kaolin in PS and copolymer PP/PE particles, which is used as a filler to improve the strength of the plastic material. Particles of polyvinyl alcohol polymer (PVA), considered of low environmental impact, may have been originated from medical and sanitary devices, as well as from food packaging. In fact, this polymer is considered appropriate for orthopedic applications (Baker et al., 2012) potentially linked to the Orthopedic Hospital located close to St2. Fibers were identified as Rayon, a cellulose-based semi-synthetic fiber frequently found in similar studies (Comnea-Stancu et al., 2017); polyester, widely used in packaging, textile, automotive, medical, electronic, and construction sectors (Camlibel, 2018); and polyamide (PA), predominantly used in fishing nets, but also used in the automotive sector and as a bone tissue scaffold in the medical sector (Winnacker, 2017; Atayeter and Atar, 2018). Polyurethane (PUR) is widely used in coating epoxy resins to protect boat hulls from deterioration and used as rigid foams to insulate boats from extreme temperatures and noise, besides biomedical, construction, and automotive applications (Akindoyo et al., 2016). Finally, polyacrylic acid (PAA) is used in the manufacture of household cleaning products, but also for enhancing the mechanical properties of hydrogels used as biological glues in the medical and tissue engineering sector (GVR - Grand View Reasearch, 2017).
Conclusion
As expected, MP pollution in this study was higher during the winter months, co-occurring with the usual decrease of primary consumers abundance in this season. The consequent increase of both MP:neuston and MP:ichthyoplankton ratios suggests therefore a critical time period for marine biota feeding in the neustonic habitat. Regarding MP spatial distribution, instead of a clear decreasing gradient from the estuary (area with higher human impact) to further coastal stations, a slight decline in concentrations was observed, suggesting a retention effect close to the Arrábida shore. Although fragments were the dominant shape, only foam and beads presented distinct variation in space, according to the location of their potential sources (fishing harbor and WWTP submarine outfall). The predominance of particles at the 1-2 mm size range instead of the smaller size range (0.335-1 mm), is suggested to be related with the sampling method used, although further studies would be required to clarify this hypothesis. The diversity of polymers reflects the multiple activities occurring in the estuary and in the marine park, highlighting the urgent need to disseminate findings locally, namely on fishing communities and in tourism, industrial and marine traffic sectors. Sharing scientific findings with society aims to increase public awareness about MP pollution and to inspire actions toward the prevention and reduction of plastic entering the marine environment.
Data Availability Statement
The raw data supporting the conclusions of this article will be made available by the authors, without undue reservation.
Author Contributions
DR conducted fieldwork sampling, laboratory procedures (MP extraction and characterization, neuston identification), statistical analysis, and wrote the manuscript. JA performed FTIR analysis, collaborated in the discussion and selection of the best method for MP extraction from neuston samples, provided assistance with laboratory procedures and at reporting FTIR analysis, and results. VO performed micro - FTIR analysis, assisted in the interpretation of spectra, and at reporting FTIR analysis and results. PS co-ordinated the study, discussed results, gave important contributions to the writing and to the English review of the text. MC reviewed and made important contributions to the text. All authors contributed to the article and approved the submitted version.
Funding
This research was partially funded by National Geographic Society with an Early Career Grant (EC-397R-18), by Clear Reef Social Fund and by Fundação para a Ciência e a Tecnologia through the research project BASEMAN (JPIOCEANS/0001/2015). DR was supported by a Ph.D. grant from FCT (SFRH/BD/130652/2017).
Conflict of Interest
The authors declare that the research was conducted in the absence of any commercial or financial relationships that could be construed as a potential conflict of interest.
Acknowledgments
The authors thank ICNF collaboration, in particular to M. Henriques, for providing their patrol vessels as research platforms during sampling campaigns. We also thank park rangers C. Silva and A. Silveira, and several volunteers, especially M. D'Ambrosio, for all the assistance during fieldwork. We are also grateful to CCMAR Scientific Dive Centre for lending their boat for the August sampling campaign. We also acknowledge Instituto Hidrográfico for providing the isobaths data presented in the map of Figure 1 which was developed in QGIS, with R. Cândido assistance.
Footnotes
1. ^https://snig.dgterritorio.gov.pt/rndg/srv/por/catalog.search#/metadata/b498e89c-1093-4793-ad22-63516062891b
2. ^https://snig.dgterritorio.gov.pt/rndg/srv/por/catalog.search#/metadata/0F67303C-5822-4D91-80F3-D217FD33667F
References
Akindoyo, J. O., Beg, M. D. H., Ghazali, S., Islam, M. R., Jeyaratnam, N., and Yuvaraj, A. R. (2016). Polyurethane types, synthesis and applications - a review. RSC Adv. 6, 114453–114482. doi: 10.1039/C6RA14525F
Almeida, C., Karadzic, V., and Vaz, S. (2015). The seafood market in Portugal: driving forces and consequences. Mar. Policy 61, 87–94. doi: 10.1016/j.marpol.2015.07.012
Anderson, M. J., Gorley, R. N., and Clarke, K. R. (2008). PERMANOVA+ for PRIMER: Guide to Software and Statistical Methods. Plymouth: PRIMER-E Ltd.
Andrady, A. L. (2011). Microplastics in the marine environment. Mar. Pollut. Bull. 62, 1596–1605. doi: 10.1016/j.marpolbul.2011.05.030
APA (2016). Plano de Gestão de Região Hidrográfica - Região hidrográfica do Sado e Mira (RH6). Parte 2 - Caracterização e Diagnóstico. Available online at: https://apambiente.pt/_zdata/Politicas/Agua/PlaneamentoeGestao/PGRH/2016-2021/PTRH6/PGRH6_Parte2.pdf (accessed November 30, 2020).
ARH Alentejo (2012). Planos de Gestão das Bacias Hidrográficas Integradas nas Regiões Hidrográficas 6 e 7. Relatório Síntese. Available online at: https://sniambgeoviewer.apambiente.pt/Geodocs/geoportaldocs/Planos/PGRH6/RelSintese%5CRS_RH6_RH7_VF.pdf (accessed November 30, 2020).
Arthur, C., Baker, J., and Bamford, H. (2009). “Proceedings of the International research workshop on the occurrence, effects, and fate of microplastic marine debris,” in NOAA Technical Memorandum, eds C. Arthur, J. Baker, and H. Bamford (Silver Spring, MD: NOAA Marine Debris Division), 49.
Atayeter, S., and Atar, H. H. (2018). Determination of mesh breaking strength of polyamide fishing nets under the exposure of benzine, detergent, salt and light. Qual. Stud. 13, 33–40. doi: 10.12739/NWSA.2018.13.4.E0039
Aumnate, C., Rudolph, N., and Sarmadi, M. (2019). Recycling of polypropylene/polyethylene blends: effect of chain structure on the crystallization behaviors. Polymers. 11:1456. doi: 10.3390/polym11091456
Bailey, K. M., and Houde, E. D. (1989). Predation on eggs and larvae of marine fishes and the recruitment problem Adv. Mar. Biol. 25, 1–83. doi: 10.1016/S0065-2881(08)60187-X
Baker, M. I., Walsh, S. P., Schwartz, Z., and Boyan, B. D. (2012). A review of polyvinyl alcohol and its uses in cartilage and orthopedic applications. J. Biomed. Mater. Res. B 100B, 1451–1457. doi: 10.1002/jbm.b.32694
Barnes, D. K. A., Galgani, F., Thompson, R. C., and Barlaz, M. (2009). Accumulation and fragmentation of plastic debris in global environments. Philos. Trans. R. Soc. B 364, 1985–1998. doi: 10.1098/rstb.2008.0205
Barrows, A. P. W., Neumann, C. A., Berger, M. L., and Shaw, S. D. (2017). Grab: vs. neuston tow net: a microplastic sampling performance comparison and possible advances in the field. Anal. Methods 9, 1446–1453. doi: 10.1039/C6AY02387H
Batista, M. I., Horta e Costa, B., Gonçalves, L., Erzini, K., Caselle, J. E., Gonçalves, E. J., et al. (2015). Assessment of catchhes, landings and fishing effort as useful tools for MPA management. Fisheries Res. 172, 197–208. doi: 10.1016/j.fishres.2015.07.020
Beer, S., Garm, A., Huwer, B., Dierking, J., and Nielsen, T. G. (2018). No increase in marine microplastic concentration over the last three decades – a case study from the Baltic Sea. Sci. Total Environ. 621, 1272–1279. doi: 10.1016/j.scitotenv.2017.10.101
Bessa, F., Sobral, P., Borja, A., and Marques, J. C. (2018). “Assessing microplastic abundance and distribution in the surface waters of the Mondego river estuary (Portugal),” in MICRO 2018 Fate and Impact of Microplastics: Knowledge, Actions and Solutions, eds V. J.-P. Baztan, J. M. Bergmann, A. Carrasco, C. Fossi, B. Jorgensen, A. Miguelez, S. Pahl, and R. C. Thompson (Lanzarote), 414.
Borges, R., Beldade, R., and Gonçalves, E. J. (2007). Vertical structure of very nearshore larval fish assemblages in a temperate rocky coast. Mar. Biol. 151, 1349–1363. doi: 10.1007/s00227-006-0574-z
Borges, R., Vaz, J., Serrão, E. A., and Gonçalves, E. J. (2009). “Short-term temporal fluctuation of very-nearshore larval fish assemblages at the Arrábida Marine Park (Portugal),” in Journal of Coastal Research, SI 56 (Proceedings of the 10th International Coastal Symposium) (Lisbon), 376–380.
Bowley, J., Baker-Austin, C., Porter, A., Hartnell, R., and Lewis, C. (2020). Oceanic hitchhikers – assessing pathogen risks from marine microplastic. Trends Microbiol. doi: 10.1016/j.tim.2020.06.011
Browne, M. A., Crump, P., Niven, S. J., Teuten, E., Tonkin, A., Galloway, T., et al. (2011). Accumulation of microplastic on shorelines woldwide: sources and sinks. Environ. Sci. Technol. 45, 9175–9179. doi: 10.1021/es201811s
Camlibel, N. O., (ed.). (2018). “Introductory chapter: introduction to ‘Polyester – production, characterization and innovative applications,” in Polyester - Production, Characterization and Innovative Applications (InTechOpen).
Cheshire, A. C., Adler, E., Barbière, J., Cohen, Y., Evans, S., Jarayabhand, S., et al. (2009). UNEP/IOC Guidelines on Survey and Monitoring of Marine Litter. Available online at: https://wedocs.unep.org/handle/20.500.11822/13604 (accessed November 30, 2020).
Choy, C. A., Robison, B. H., Gagne, T. O., Erwin, B., Firl, E., Halden, R. U., et al. (2019). The vertical distribution and biological transport of marine microplastics across the epipelagic and mesopelagic water column. Sci. Rep. 9:7843. doi: 10.1038/s41598-019-44117-2
Clarke, K. R., and Gorley, R. N. (2006). “PRIMER v6: user manual/tutorial,” ed R. N. Clarke, K.R., Gorley (Plymouth: PRIMER-E Ltd.).
Cole, M., Lindeque, P., Fileman, E., Halsband, C., Goodhead, R., Moger, J., et al. (2013). Microplastic ingestion by zooplankton. Environ. Sci. Technol. 47, 6646–6655. doi: 10.1021/es400663f
Cole, M., Lindeque, P., Halsband, C., and Galloway, T. S. (2011). Microplastics as contaminants in the marine environment: a review. Mar. Pollut. Bull. 62, 2588–2597. doi: 10.1016/j.marpolbul.2011.09.025
Collignon, A., Hecq, J.-H., Galgani, F., Collard, F., and Goffart, A. (2014). Annual variation in neustonic micro- and meso-plastic particles and zooplankton in the Bay of Calvi (Mediterranean–Corsica). Mar. Pollut. Bull. 79, 293–298. doi: 10.1016/j.marpolbul.2013.11.023
Collignon, A., Hecq, J.-H., Glagani, F., Voisin, P., Collard, F., and Goffart, A. (2012). Neustonic microplastic and zooplankton in the North Western Mediterranean Sea. Mar. Pollut. Bull. 64, 861–864. doi: 10.1016/j.marpolbul.2012.01.011
Comnea-Stancu, I. R., Wieland, K., Ramer, G., Schwaighofer, A., and Lendl, B. (2017). On the Identification of rayon/viscose as a major fraction of microplastics in the marine environment: discrimination between natural and manmade cellulosic fibers using fourier transform infrared spectroscopy. Appl. Spectrosc. 71, 939–950. doi: 10.1177/0003702816660725
Costa, B. H. E., Erzini, K., Caselle, J. E., Folhas, H., and Gonçalves, E. J. (2013). Reserve effect within a temperate marine protected area in the north-eastern Atlantic (Arrábida Marine Park, Portugal). Mar. Ecol. Prog. Ser. 481, 11–24. doi: 10.3354/meps10204
Cunha, A. H., Erzini, K., Serrão, E. A., Gonçalves, E., Borges, R., Henriques, M., et al. (2014). Biomares, a LIFE project to restore and manage the biodiversity of Prof. Luiz Saldanha Marine Park. J. Coast. Conserv. 18, 643–655. doi: 10.1007/s11852-014-0336-x
Cunha, M. E. (1993). “Seasonal variation of the zooplankton biomass over the portuguese continental shelf,” in ICES Statutory Meeting 1993 (Dublin, Ireland: ICES CM 1993 L:62).
DGRM (2018). Portuguese Fishing Fleet – 2018. Available online at: https://ec.europa.eu/fisheries/sites/fisheries/files/docs/2018-fleet-capacity-report-portugal_en.pdf (accessed November 30, 2020).
Di Mauro, R., Kupchik, M. J., and Benfield, M. C. (2017). Abundant plankton-sized microplastic particles in shelf waters of the northern Gulf of Mexico. Environ. Pollut. 230, 798–809. doi: 10.1016/j.envpol.2017.07.030
Directive, S. F. (2013). Guidance on Monitoring of Marine Litter in European Seas. Luxembourg. doi: 10.2788/99475
Eriksson, C., and Burton, H. (2003). Origins and biological accumulation of small plastic particles in Fur Seals from Macquarie Island. AMBIO A J. Hum. Environ. 32, 380–384. doi: 10.1579/0044-7447-32.6.380
EUMOFA (2020). The EU Fish Market. 106. Available online at: https://www.eumofa.eu/documents/20178/415635/EN_The+EU+fish+market_2020.pdf/fe6285bb-5446-ac1a-e213-6fd6f64d0d85?t=1604671147068
European Commission (2018). A European Strategy for Plastics in a Circular Economy. Available online at: https://ec.europa.eu/environment/circular-economy/pdf/plastics-strategy-brochure.pdf (accessed November 30, 2020).
FAO (2010). FAO yearbook. Fishery and Aquaculture Statistics. Available online at: http://www.fao.org/docrep/013/i1890t/i1890t.pdf (accessed November 30, 2020).
FAO (2017). Fishery and Aquaculture Country Profiles - The Portuguese Republic. Available online at: http://www.fao.org/fi/oldsite/FCP/en/PRT/profile.htm (accessed November 30, 2020).
Farrell, P., and Nelson, K. (2013). Trophic level transfer of microplastic: Mytilus edulis (L.) to Carcinus maenas (L.) Paul. Environ. Pollut. 177, 1–3. doi: 10.1016/j.envpol.2013.01.046
Farrelly, T. A., and Shaw, I. C. (2017). “Polystyrene as hazardous household waste,” in Household Hazardous Waste Management, ed. D. Mmereki (InTechOpen).
Fendall, L. S., and Sewell, M. A. (2009). Contributing to marine pollution by washing your face: Microplastics in facial cleansers. Mar. Pollut. Bull. 58, 1225–1228. doi: 10.1016/j.marpolbul.2009.04.025
Frère, L., Paul-Pont, I., Rinnert, E., Petton, S., Jaffré, J., Bihannic, I., et al. (2017). Influence of environmental and anthropogenic factors on the composition, concentration and spatial distribution of microplastics: a case study of the Bay of Brest (Brittany, France). Environ. Pollut. 225, 211–222. doi: 10.1016/j.envpol.2017.03.023
Frias, J. P. G. L., Otero, V., and Sobral, P. (2014). Evidence of microplastics in samples of zooplankton from Portuguese coastal waters. Mar. Environ. Res. 95, 89–95. doi: 10.1016/j.marenvres.2014.01.001
Gago, J., Filgueiras, A., Pedrotti, M. L., Suaria, G., Tirelli, V., Andrade, J., et al. (2018). Standardised Protocol for Monitoring Microplastics in Seawater. Available online at: https://repository.oceanbestpractices.org/handle/11329/1077 (accessed November 30, 2020).
Galloway, T. S. (2015). “Micro- and nano-plastics and human health,” in Marine Anthropogenic Litter, eds M. Bergmann, L. Gutow, and M. Klages (Cham: Springer International Publishing), 343-366. doi: 10.1007/978-3-319-16510-3_13
Garcia-Garin, O., Vighi, M., Sala, B., Aguilar, A., Tsangaris, C., Digka, N., et al. (2020). Assessment of organophosphate flame retardants in Mediterranean Boops boops and their relationship to anthropization levels and microplastic ingestion. Chemosphere 252:126569. doi: 10.1016/j.chemosphere.2020.126569
Germanov, E. S., Marshall, A. D., Hendrawan, I. G., Admiraal, R., Rohner, C. A., Argeswara, J., et al. (2019). Microplastics on the menu: plastics pollute indonesian manta ray and whale shark feeding grounds. Front. Mar. Sci. 6:678. doi: 10.3389/fmars.2019.00679
GESAMP (2016). Sources, fate and effects of microplastics in the marine environment: part two of a global assessment. eds P. J. Kershaw and C. M. Rochman IMO/FAO/UNESCO-IOC/UNIDO/WMO/IAEA/UN/UNEP/UNDP Joint Group of Experts on the Scientific Aspects of Marine Environmental Protection Available at: http://www.gesamp.org/publications/microplastics-in-the-marine-environment-part-2
GESAMP (2019). “Guidelines for the monitoring and assessment of plastic litter in the ocean,” eds. P. Kershaw, A. Turra, and F. Galgani. IMO/FAO/UNESCO-IOC/UNIDO/WMO/IAEA/UN/UNEP/UNDP/ISA Joint Group of Experts on the Scientific Aspects of Marine Environmental Protection. Available online at: http://www.gesamp.org/publications/guidelines-for-the-monitoring-and-assessment-of-plastic-litter-in-the-ocean (accessed November 30, 2020).
Gewert, B., Ogonowski, M., Barth, A., and MacLeod, M. (2017). Abundance and composition of near surface microplastics and plastic debris in the Stockholm Archipelago, Baltic Sea. Mar. Pollut. Bull. 120, 292–302. doi: 10.1016/j.marpolbul.2017.04.062
Gies, E. A., LeNoble, J. L., Noël, M., Etemadifar, A., Bishay, F., Hall, E. R., et al. (2018). Retention of microplastics in a major secondary wastewater treatment plant in Vancouver, Canada. Mar. Pollut. Bull. 133, 553–561. doi: 10.1016/j.marpolbul.2018.06.006
Gonçalves, E. J., Henriques, M., and Almada, V. C. (2002). “Use of a temperate reef-fish community to identify priorities in the establishment of a marine protected area,” in Aquatic Protected Areas: What Works Best And How Do We Know? Proceedings of the World Congress on Aquatic Protected Areas, eds. J. P. Beumer, A. Grant, and D. C. Smith (Cairns, QLD), 261–272.
Graziano, A., Jaffer, S., and Sain, M. (2019). Review on modification strategies of polyethylene/polypropylene immiscible thermoplastic polymer blends for enhancing their mechanical behavior. J. Elastomers Plast. 51, 291–336. doi: 10.1177/0095244318783806
Green, D. S., Kregting, L., Boots, B., Blockley, D. J., Brickle, P., da Costa, M., et al. (2018). A comparison of sampling methods for seawater microplastics and a first report of the microplastic litter in coastal waters of Ascension and Falkland Islands. Mar. Pollut. Bull. 137, 695–701. doi: 10.1016/j.marpolbul.2018.11.004
Gregory, M. R. (2009). Environmental implications of plastic debris in marine settings—entanglement, ingestion, smothering, hangers-on, hitch-hiking and alien invasions. Philos. Trans. R. Soc. B Biol. Sci. 364, 2013–2025. doi: 10.1098/rstb.2008.0265
Gündogdu, S., Çevik, C., Ayat, B., Aydogan, B., and Karaca, S. (2018). How microplastics quantities increase with flood events? An example from Mersin Bay NE Levantine coast of Turkey. Environ. Pollut. 239, 342–350. doi: 10.1016/j.envpol.2018.04.042
GVR - Grand View Reasearch (2017). Polyacrylic Acid Market Analysis By Application (Water & Wastewater Treatment, Detergents & Cleaners, Paints, Coatings, & Inks, Super Absorbent Polymers), By Region, And Segment Forecasts, 2018 - 2025. Available online at: https://www.grandviewresearch.com/industry-analysis/polyacrylic-acid-market (accessed November 30, 2020).
Henriques, M., Gonçalves, E. J., and Almada, V. C. (1999). “The conservation of littoral fish communities: a case study at Arrábida coast (Portugal),” in Behaviour and Conservation of Littoral Fishes, eds V. C. Almada, R. F. Oliveira, E. J. Gonçalves (Lisboa: ISPA), 473–519.
Hidalgo-Ruz, V., Gutow, L., Thompson, R. C., and Thiel, M. (2012). Microplastics in the marine environment: a review of the methods used for identification and quantification. Environ. Sci. Technol. 46, 3060–3075. doi: 10.1021/es2031505
Hitchcock, J. N. (2020). Storm events as key moments of microplastic contamination in aquatic ecosystems. Sci. Total Environ. 734:139436. doi: 10.1016/j.scitotenv.2020.139436
Hitchcock, J. N., and Mitrovic, S. M. (2019). Microplastic pollution in estuaries across a gradient of human impact. Environ. Pollut. 247, 457–466. doi: 10.1016/j.envpol.2019.01.069
Horta e Costa, B., Batista, M. I., Gonçalves, L., Erzini, K., Caselle, J. E., Cabral, H. N., et al. (2013a). Fishers' behaviour in response to the implementation of a marine protected area. PLoS ONE 8:e65057. doi: 10.1371/journal.pone.0065057
Horta e Costa, B., Gonçalves, L., and Gonçalves, E. J. (2013b). Vessels' site fidelity and spatio-temporal distribution of artisanal fisheriees before the implementation of a temperate multiple-use marine protected area. Fisheries Res. 148, 27–37. doi: 10.1016/j.fishres.2013.08.001
Houde, E. D. (1987). Fish early life dynamics and recruitment variability. Am. Fish. Soc. Symp. 2, 17–29.
Hummel, D. O. (2002). Atlas of Plastics Additives: Analysis by Spectrometric Methods. Berlin: Springer-Verlag.
ICNF Reserva Natural do Estuário do Sado. Available online at: http://www2.icnf.pt/portal/ap/r-nat/rnes/class-carac (accessed November 30, 2020).
Jambeck, J. R., Geyer, R., Wilcox, C., Siegler, T. R., Perryman, M., Andrady, A., et al. (2015). Plastic waste inputs from land into the ocean. Science 347, 768–771. doi: 10.1126/science.1260352
Kaiser, D., Kowalski, N., and Waniek, J. J. (2017). Effects of biofouling on the sinking behavior of microplastics. Environ. Res. Lett. 12:124003. doi: 10.1088/1748-9326/aa8e8b
Kang, J.-H., Kwon, O. Y., Lee, K.-W., Song, Y. K., and Shim, W. J. (2015). Marine neustonic microplastics around the southeastern coast of Korea. Mar. Pollut. Bull. 96, 304–312. doi: 10.1016/j.marpolbul.2015.04.054
Koelmans, A. A., Bakir, A., Burton, G. A., and Janssen, C. R. (2016). Microplastic as a vector for chemicals in the aquatic environment: critical review and model-supported reinterpretation of empirical studies. Environ. Sci. Technol. 50, 3315–3326. doi: 10.1021/acs.est.5b06069
Kühn, S., Rebolledo, E. L. B., and van Franeker, J. A. (2015). “Deleterious effects of litter on marine life,” in Marine Anthropogenic Litter, eds. M. Bergmann, L. Gutow, and M. Klages (Berlin: Springer), 75–116.
Kukulka, T., Proskurowski, G., Morét-Ferguson, S., Meyer, D. W., and Law, K. L. (2012). The effect of wind mixing on the vertical distribution of buoyant plastic debris. Geophys. Res. Lett. 39:6. doi: 10.1029/2012GL051116
Laist, D. W. (1987). Overview of the biological effects of lost and discarded plastic debris in the marine environment. Mar. Pollut. Bull. 18, 319–326. doi: 10.1016/S0025-326X(87)80019-X
Laskar, N., and Kumar, U. (2019). Plastics and microplastics: a threat to environment. Environ. Technol. Innov. 14:100352. doi: 10.1016/j.eti.2019.100352
Law, K. L., Morét-Ferguson, S. E., Goodwin, D. S., Zettler, E. R., DeForce, E., Kukulka, T., et al. (2014). Distribution of surface plastic debris in the eastern pacific ocean from an 11-year data set. Environ. Sci. Technol. 48, 4732–4738. doi: 10.1021/es4053076
Lenz, R., Enders, K., and Nielsen, T. G. (2016). Microplastic exposure studies should be environmentally realistic. Proc. Natl. Acad. Sci. U.S.A. 113, E4121–E4122. doi: 10.1073/pnas.1606615113
Lima, A. R. A., Costa, M. F., and Barletta, M. (2014). Distribution patterns of microplastics within the plankton of a tropical estuary. Environ. Res. 132, 146–155. doi: 10.1016/j.envres.2014.03.031
Löder, M. G. J., and Gerdts, G. (2019). “Methodology used for the detection and identification of microplastics—a critical appraisal,” in Marine Anthropogenic Litter, ed. K. M. Bergmann, L. Gutow (Springer), 201–228.
Lusher, A. L., Welden, N. A., Sobral, P., and Cole, M. (2017). Sampling, isolating and identifying microplastics ingested by fish and invertebrates. Anal. Methods 9, 1346–1360. doi: 10.1039/C6AY02415G
Martins, F., Leitão, P., and Neves, R. (2002). Simulating vertical water mixing in homogeneous estuaries: the sado estuary case. Hydrobiologia 475/476, 221–227. doi: 10.1023/A:1020369431924
Napper, I. E., Bakir, A., Rowland, S. J., and Thompson, R. C. (2015). Characterisation, quantity and sorptive properties of microplastics extracted from cosmetics. Mar. Pollut. Bull. 99, 178–185. doi: 10.1016/j.marpolbul.2015.07.029
Norén, F. (2007). Small Plastic Particles in Coastal Swedish Waters. Available online at: https://www.n-research.se/pdf/Smallplastic/particles/in/Swedish/West/CoastWaters.pdf (accessed November 30, 2020).
Paradis, A. R., Pepin, P., and Brown, J. A. (1996). Vulnerability of fish eggs and larvae to predation: review of the influence of the relative size of prey and predator. Can. J. Fish. Aquat. Sci. 53, 1226–1235. doi: 10.1139/f96-051
Pedrotti, M. L., Bruzaud, S., Dumontet, B., Elineau, A., Petit, S., Grohens, Y., et al. (2014). Plastic fragments on the surface of Mediterranean waters. Mar. Litter Mediterr. Black Seas 115–123.
Pedrotti, M. L., Petit, S., Elineau, A., Bruzaud, S., Crebassa, J.-C., Dumontet, B., et al. (2016). Changes in the floating plastic pollution of the mediterranean sea in relation to the distance to land. PLoS ONE 11:e0161581. doi: 10.1371/journal.pone.0161581
PlasticsEurope (2019). Plastics - the Facts 2019. An Analysis of European Plastics Production, Demand and Waste Data. Available online at: https://www.plasticseurope.org/en/resources/market-data (accessed November 30, 2020).
Primo, A. L., Azeiteiro, U. M., Marques, S. C., and Pardal, M. Â. (2011). Impact of climate variability on ichthyoplankton communities: an example of a small temperate estuary. Estuar. Coast. Shelf Sci. 91, 484–491. doi: 10.1016/j.ecss.2010.11.009
Ramos, J., Barletta, M., and Costa, M. (2012). Ingestion of nylon threads by Gerreidae while using a tropical estuary as foraging grounds. Aquat. Biol. 17, 29–34. doi: 10.3354/ab00461
Revel, M., Châtel, A., and Mouneyrac, C. (2018). Micro(nano)plastics: a threat to human health? Curr. Opin. Environ. Sci. Heal. 1, 17–23. doi: 10.1016/j.coesh.2017.10.003
Rochman, C. M., Brookson, C., Bikker, J., Djuric, N., Earn, A., Bucci, K., et al. (2019). Rethinking microplastics as a diverse contaminant suite. Environ. Toxicol. Chem. 38, 703–711. doi: 10.1002/etc.4371
Rochman, C. M., Hoh, E., Kurobe, T., and Teh, S. J. (2013). Ingested plastic transfers hazardous chemicals to fish and induces hepatic stress. Sci. Rep. 3:3263. doi: 10.1038/srep03263
Rodrigues, S. M., Almeida, C. M. R., Silva, D., Cunha, J., Antunes, C., Freitas, V., et al. (2019). Microplastic contamination in an urban estuary: abundance and distribution of microplastics and fish larvae in the Douro estuary. Sci. Total Environ. 659, 1071–1081. doi: 10.1016/j.scitotenv.2018.12.273
Santos, J. A., Corte-Real, J., and Leite, S. M. (2005). Weather regimes and their connection to the winter rainfall in Portugal. Int. J. Climatol. 25, 33–50. doi: 10.1002/joc.1101
Setälä, O., Fleming-Lehtinen, V., and Lehtiniemi, M. (2014). Ingestion and transfer of microplastics in the planktonic food web. Environ. Pollut. 185, 77–83. doi: 10.1016/j.envpol.2013.10.013
Song, Y. K., Hong, S. H., Jang, M., Kang, J.-H., Kwon, O. Y., Han, G. M., et al. (2014). Large accumulation of micro-sized synthetic polymer particles in the sea surface microlayer. Environ. Sci. Technol. 48, 9014–9021. doi: 10.1021/es501757s
Teuten, E. L., Rowland, S. J., Galloway, T. S., and Thompson, R. C. (2007). Potential for plastics to transport hydrophobic contaminants. Environ. Sci. Technol. 41, 7759–7764. doi: 10.1021/es071737s
Teuten, E. L., Saquing, J. M., Knappe, D. R. U., Barlaz, M. A., Jonsson, S., Björn, A., et al. (2009). Transport and release of chemicals from plastics to the environment and to wildlife. Philos. Trans. R. Soc. B Biol. Sci. 364, 2027–2045. doi: 10.1098/rstb.2008.0284
Thompson, R. C. (2004). Lost at sea: where is all the plastic? Science 304, 838–838. doi: 10.1126/science.1094559
Thompson, R. C., Moore, C. J., vom Saal, F. S., and Swan, S. H. (2009). Plastics, the environment and human health: current consensus and future trends. Philos. Trans. R. Soc. B Biol. Sci. 364, 2153–2166. doi: 10.1098/rstb.2009.0053
UNEP (2016). Marine Plastic Debris and Microplastics – Global Lessons and Research to Inspire Action and Guide Policy Change. Available online at: https://wedocs.unep.org/handle/20.500.11822/7720 (accessed November 30, 2020).
UNEP (2018). Single-Use Plastics: A Roadmap for Sustainability. Available online at: https://wedocs.unep.org/handle/20.500.11822/25496 (accessed November 30, 2020).
Vale, C., Cortesão, C., Castro, O., and Ferreira, A. M. (1993). Suspended-sediment response to pulses in river flow and semidiurnal and fortnightly tidal variations in a mesotidal estuary. Mar. Chem. 43, 21–31. doi: 10.1016/0304-4203(93)90213-8
van Sebille, E., Wilcox, C., Lebreton, L., Maximenko, N., Hardesty, B. D., van Franeker, J. A., et al. (2015). A global inventory of small floating plastic debris. Environ. Res. Lett. 10:124006. doi: 10.1088/1748-9326/10/12/124006
Veerasingam, S., Mugilarasan, M., Venkatachalapathy, R., and Vethamony, P. (2016). Influence of 2015 flood on the distribution and occurrence of microplastic pellets along the Chennai coast, India. Mar. Pollut. Bull. 109, 196–204. doi: 10.1016/j.marpolbul.2016.05.082
von Moos, N., Burkhardt-Holm, P., and Köhler, A. (2012). Uptake and effects of microplastics on cells and tissue of the blue mussel Mytilus edulis L. after an experimental exposure. Environ. Sci. Technol. 46, 11327–11335. doi: 10.1021/es302332w
Vroom, R. J. E., Koelmans, A. A., Besseling, E., and Halsband, C. (2017). Aging of microplastics promotes their ingestion by marine zooplankton. Environ. Pollut. 231, 987–996. doi: 10.1016/j.envpol.2017.08.088
Winnacker, M. (2017). Polyamides and their functionalization: recent concepts for their applications as biomaterials. Biomater. Sci. 5, 1230–1235. doi: 10.1039/C7BM00160F
Wright, S. L., Thompson, R. C., and Galloway, T. S. (2013). The physical impacts of microplastics on marine organisms: a review. Environ. Pollut. 178, 483–492. doi: 10.1016/j.envpol.2013.02.031
Keywords: microplastics, distribution, Sado estuary, marine park, MP:neuston ratio, MP:ichthyoplankton ratio, plastic polymers, Portugal
Citation: Rodrigues D, Antunes J, Otero V, Sobral P and Costa MH (2020) Distribution Patterns of Microplastics in Seawater Surface at a Portuguese Estuary and Marine Park. Front. Environ. Sci. 8:582217. doi: 10.3389/fenvs.2020.582217
Received: 10 July 2020; Accepted: 18 November 2020;
Published: 17 December 2020.
Edited by:
Juliana Assunção Ivar Do Sul, Leibniz Institute for Baltic Sea Research (LG), GermanyReviewed by:
Odei Garcia-Garin, University of Barcelona, SpainAna Luzia De Figueiredo Lacerda, Federal University of Rio Grande, Brazil
Copyright © 2020 Rodrigues, Antunes, Otero, Sobral and Costa. This is an open-access article distributed under the terms of the Creative Commons Attribution License (CC BY). The use, distribution or reproduction in other forums is permitted, provided the original author(s) and the copyright owner(s) are credited and that the original publication in this journal is cited, in accordance with accepted academic practice. No use, distribution or reproduction is permitted which does not comply with these terms.
*Correspondence: Diana Rodrigues, ddu.rodrigues@campus.fct.unl.pt