
Abstract
Droplet-Based energy harvesting is one of the most recent techniques used to convert environmental mechanical energies into electrical energy. Despite unique properties like compatibility with MEMS fabrication and efficient performance in reduced spaces, their operation is limited by the negative effects of electrowetting. In presence of an external electric filed, the wetting state of a droplet can be a function of three factors: the properties of applied dielectric, the wettability features of the droplet, and the amount of applied electric filed. An appropriate circuit can manage the effect of external electric filed on the droplets which here is considered as a tool to mitigate the negative effects of electrowetting. This paper presents designing, modeling, and fabrication steps of a droplet-based power generator considering electrowetting during fabrication and evaluation processes. The generator operation was analyzed in a voltage-constrained circuit and the experimental data were in accordance with the proposed semi-empirical model in this regard. Generator evaluation was done using a range of capacities made by 12 to 84 droplets under frequencies of 0.8, 10.8, and 16.6 Hz and a bias voltage of 7.5 V. The maximum output voltage and power was obtained by applying 16.6 Hz frequency to 84 droplets, reaching 1.25 V and 1.56 μW, respectively.
Export citation and abstract BibTeX RIS
1. Introduction
Investigations into energy harvesting methods and obtaining electricity for energy supply of portable and wearable electronics devices, Wireless Sensor Networks (WSNs) and monitoring systems have dramatically increased in the last few years [1, 2]. Different energy sources exist in the environment such as solar energy, wind energy, thermal energy and environmental mechanical energy. Among them, harvesting mechanical energy fits the small-scale power generation for low-power electronics application due to extensive availability of energy source [3]. Four recognized electro-mechanical energy conversion methods rely on electromagnetic and electrostatic fields and piezoelectric and magnetostrictive materials [4]. Among them, specific features of electrostatic systems like their compatibility with MEMS fabrications and efficient performance in a reduced space have turned them to a promising technology in this regard [5–7].
The operation of electrostatic power generator is dominated by displacement current which is defined as Maxwell equation in the absence of magnetic field [8]. Applied to a capacitor, it explains how current can flow through a capacitor when no conduction path exists [8]. Accordingly, power generation in an electrostatic energy harvester is possible by forcing relative changes in an electric field [9]. The electric field can originally be made by contact-induced electrification or electrostatic induction [10]. The former is known as triboelectric effect in which the polarity and strength of charges on two materials (after separation) depend on their relative position at triboelectric series [10]. The electrostatic induction generators, on the other hand, use an external source known as bias voltage to charge the variable capacitor [11]. In order to avoid the need for bias voltage, pre-charged materials known as electrets can be used as dielectric [8]. Nevertheless, the environmental stability of electret materials is a major concern for real applications which is under study to be improved in terms of self-recovery and robustness [12, 13]. The most recent approach proposed by Wang et al couples contact charging and electrostatic induction [10]. In their design, the traditional triboelectric generator has been modified by applying nano-materials, nanotechnology and liquid electrodes to improve accuracy, energy density, and efficiency [14–16]. In this paper the former method known as electrostatic induction is utilized. Traditional variable capacitors suffer from several defects such as low capacity and inflexibility [17, 18]. These defects were overcome by using liquid-based electrodes proposed by Boland et al [8]. Then the droplet-based ones, in particular , were introduced by Brono et al [19] and improved by Yıldırım et al [20]. These particular generators were presented as a superior option for using in self-powered energy harvesters by Krupenkin and Taylor [21].
In spite of relative simplicity and design efficiency, some issues have been reported in practical applications due to the electrowetting phenomenon [8, 21]. Electrowetting is originally the effect of an electric field on a conductive liquid that decreases the liquid-solid surface tension [22]. For the case of a droplet on a surface, decreasing liquid-solid interfacial tension leads to wetting the surface, according to the Young equation, and thus, harden the motion of droplet and power generation [21].
Krupenkin and Taylor discussed the effect of electrowetting on liquid-based power generators and introduced specific materials as dielectric to mitigate some of the side effects of electrowetting [21]. Yang et al used PTFE powder to coat the conductive droplet and made a non-wetting soft droplet named ionic liquid marble [23]. As another approach, Kim et al used water as a second liquid around the dielectric droplet to reduce its wettability and facilitate the droplet motion on a hydrophilic surface [24]. In another intelligent advance, Galchev et al used a ferromagnetic liquid in the space between two capacitor electrodes that was being actuated by an external magnet to change the capacitance [25].
In the present study, first, the relationship between electrowetting and power generation is clarified and then, the role of circuitry is analyzed. Considering two possible modes including voltage-constrained and charge-constrained, it can be inferred that the voltage-constrained mode would be a better option for droplet-based cases. The main reason is decreasing the possibility of voltage increment across the variable capacitor which can lead to dielectric breakdown and electrowetting.
In the following, a variable capacitor is created which includes an Hg droplet in a closed channel. This conductive droplet varies the capacitance by moving as an electrode under a dielectric arrayed conductive surface. The advantage of this mechanism is that it is almost easy to make and more efficient in a practical point of view.
The operation of system was evaluated by applying three different frequencies to a range of capacitances using a designed shaker for this purpose. To investigate the theoretical aspect of the system a semi-empirical model is presented. In this model the amounts of generated power and energy in each cycle have been demonstrated considering the periodic behavior of the variable capacitor. The predicted values was in accordance with the measured ones and confirmed the direct effect of applied frequency on power generation.
2. Principle and theory
2.1. The concept of wetting, electrowetting and power generation
In electromechanical systems, the variable capacitor has generally been considered as 'actuator' or 'motor' as shown in figure 1. In actuators, applying electrical energy to the variable capacitor at its minimum capacitance mode increases the electric field across the electrodes. It leads the electrodes to attract each other which is along with increasing the capacitance. In this mode the system acts as a 'motor' that converts the applied electrical energy into mechanical energy. Reversely, applying mechanical energy into a charged capacitor at its maximum capacitance will be along with discharging the capacitor and increasing voltage or making current according to the capacitor equation  In the latter equation, Q is the charge across capacitor and V is the voltage. In this mode, the system acts a 'generator' that converts the applied mechanical energy into electricity [26].
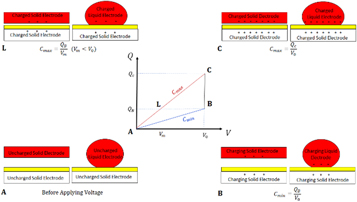
Figure 1. Charge-Voltage cycle for an electrostatic induction motor/generator along with the schematic droplet-based and solid-based variable capacitors. During voltage-constrained mode, the motor passes ABCA and generator passes ACBA cycles. During the charge-constrained mode, the motor passes ABLA and generator passes ALBA cycles.
Download figure:
Standard image High-resolution imageSimilarly, in the electrowetting process there is a variable capacitor which has one liquid electrode and can be considered as a droplet-based motor. Applying potential difference to this capacitor makes an electric field in solid-liquid interface and forces its electrodes to attract each other [27]. This attraction is visible in the form of spreading droplet and increasing the overlap area. In other words, the droplet wets the surface.
Despite similar functionalities, there are differences between the conventional electrostatic motors and the electrowetting-based ones due to the effect of wettability features of the droplet on the process [28]. For example, according to Young equation, the surface tension of droplet acts as a resisting agent against spreading [29]. Hence, the wettability features of the droplet can affect the electrowetting process which is assumed as a droplet-based motor.
In droplet-based generators, droplet movement is the main reason of capacitance variation and power generation. Thus, the key point in these systems is the ability of droplet to move freely without wetting the surface or being affected by the existing electric field. Although choosing a liquid of high surface tension (like Hg) can be an effective solution in this matter, the long-term exposure to electrical field can gradually change the wettability features of even Hg droplet. It is mainly due to effect of some unintended phenomenon like 'hysteresis' and 'charge trapping' that generally depend on the type of applied dielectric and can harden the droplet motion and the flow of the charges on the dielectric surface [22, 30].
Accordingly, wettability features of the droplet -that intensify in presence of an electric field- can be considered as a bridge between wetting, electrowetting and power generation. Hence, these features should be considered in designing the generator in order to maintain the negative effects of electrowetting as low as possible.
2.2. The effect of circuitry
As mentioned earlier, power generation can occur in voltage-constrained or charge-constrained modes [26]. In the case of, charge-constrained, charge remains constant by holding the capacitor in open-circuit conditions [8]. Hence, in response to capacitance reduction, the voltage across the capacitor will increase ( ). The equivalent charge-constrained cycle for generator is shown by ALBA in figure 1. While voltage and capacitance relation is linear, capacitor energy is proportional to the voltage square (
 ) that causes a net electrical energy [31]. The area of ALB triangle corresponds to electric energy generation. Two main drawbacks of this scheme are probability of dielectric breakdown and electrowetting. Dielectric breakdown occurs due to exceeding the capacitor voltage from the breakdown voltage of the dielectric and can damage the capacitor. In droplet-based systems, we are also facing electrowetting which starts when the applied voltage exceeds the threshold voltage [22]. The voltage-constrained scheme, on the other hand, benefits from voltage controllability. As can be seen in figure 1, during ACBA cycle, the applied mechanical energy leads to the capacitance reduction. The charges then are forced to leave the capacitor and generate electricity in the form of current (
 ) . Accordingly, the voltage-constrained mode is utilized to protect system against dielectric breakdown and electrowetting.
Figure 2 shows the basic operation of a voltage-constrained circuit that first was proposed by O'Donnell et al for application of an electrostatic energy harvester as wind turbine [32]. In the charge half-cycle, the variable capacitor is charged by the bias voltage during its variation from minimum to maximum capacitance. In this mode  which is turned on, will not switch to the OFF position unless the applied mechanical energy compels the capacitor to reduce its capacitance. Capacitance reduction will be concurrent with the discharge half-cycle, turning on
  and power generation phase.

Figure 2. Voltage-constraint circuit as electrostatic generator supporter.
Download figure:
Standard image High-resolution image3. Design and modeling of variable capacitor
Figure 3 shows the proposed mechanism for making a variable electric field using a droplet in a closed channel alongside the equivalent charge and discharge half-cycles according to the voltage-constraint mode. The droplet moves under patterned dielectric-coated electrode and simultaneously varies the capacitance. The capacitor made by the droplet and the underneath dielectric coated electrode is named  When the droplet is in direct contact with the top electrode, the equivalent capacitance is in maximum condition, as shown in figure 3(a). As mentioned earlier, the best liquids to be used are those that have more surface tension and relative permittivity. Therefore, Hg droplet was used with a surface tension ten times that of water and the infinite relative permittivity. Hence, as can be seen, Hg is considered as one of the capacitor electrodes. After the droplet motion, the capacitance decreases gradually until it reaches under the dielectric-coated part of the top electrode. In this mode, another capacitor will be made which is named
  Since
Since  and
and  are in series, the equivalent capacitance is minimum which is illustrated in figure 3(b). Capacitance variation can be evaluated using,

and if

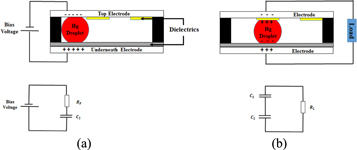
Figure 3. Working principle of the system as a variable capacitor. (a) Droplet in direct contact with the top electrode along with its equivalent circuit. (b) Droplet in indirect contact with the top electrode along with its equivalent circuit.
Download figure:
Standard image High-resolution imageEquation (1) shows that the key parameter in gaining a remarkable capacitance difference is making the underneath capacitor as high as possible. This approach is traceable in the fabrication process. The operation of variable capacitor in each half-cycle can be modeled as:


as the capacitor works in a voltage-constraint mode. Here Q is the charge on the variable capacitor, V is the applied bias voltage, C0 is the maximum capacitance of the variable capacitor, and t is time. To solve this equation, the periodic performance of capacitor was modeled in the form of,

where  is the capacitance oscillation frequency. Equation (3) generally states that the capacitor oscillates between a maximum and a minimum value. The constants A and B are functions of the type and structure of the capacitor. For example, in an ideal situation, where the maximum and minimum capacitances are
  and 0, respectively, (3) is simplified to
  To make the model closer to the real situation, these constants are obtained according to the measured capacitance values in section four.
Considering (3), the current across the circuit can analytically be predicted by solving (2) as,

Consequently, the electrical energy and power generation in one cycle can be appraised as,

and

where R is the resistance load.
4. Fabrication
4.1. Capacitor
The material used, schematic of fabrication process, and the prototyped droplet-based variable capacitor are demonstrated in figure 4. Since considering (1), C2 plays an important role in the efficiency of the generator, using a high dielectric constant material as the dielectric component is determinative. Among different dielectric materials, TiO2 and BaTiO3 have more widely been studied due to their high dielectric constants [33, 34]; However, BaTiO3 is not recommended in this regard because of strong charge trapping and bistable electrowetting [35]. Therefore, TiO2 was selected as the dielectric and as the electrode we managed to use FTO (Fluorine Tin Oxide).
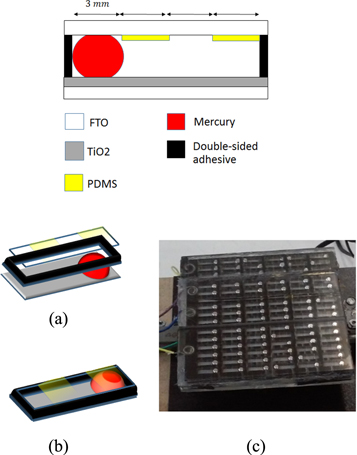
Figure 4. (a) The material used to make the capacitor section. (b) Fabrication process regarding one droplet. (c) Final prepared variable capacitor.
Download figure:
Standard image High-resolution imageDifferent deposition techniques were examined to make a thin layer of TiO2 on FTO that among them, the electrophoretic method was selected. In this process 1.5 gr TiO2 in the form of P25 powder was dispersed in 250 ml isopropanol by ultrasonic agitation. Then, the FTO substrate, as the electrode, was put horizontally in the vessel as shown in figure 5(a). To deposit TiO2 on FTO, a potential of 125 V was applied to FTO and counter electrode for 30 s. After TiO2 deposition, surface modification was carried out using 40 mM solution of TiCl4 in ethanol and finally the plate was annealed at 450 °C for 1 h. The layer formed by this method had the thickness about 9.8 μm which is equivalent to benefiting from the dielectric constant of 50 [33].
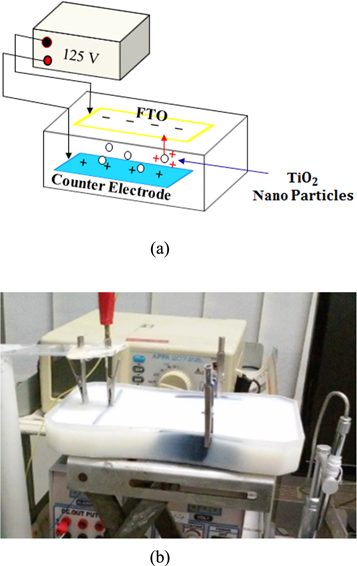
Figure 5. (a) Schematic of TiO2 deposition on horizontal FTO electrode using the electrophoretic method. (b) Utilized setup for the deposition process.
Download figure:
Standard image High-resolution imageIn order to put the Hg droplets on the FTO surface of 10 cm × 10 cm, a set of 84 separate channels was created on a double-sided adhesive using a laser cut machine. Each created channel has the dimension of 2 mm × 3 mm × 12 mm as shown in figure 6.

Figure 6. (a) Side view of one droplet. (b) Upper perspective of each droplet in the channel.
Download figure:
Standard image High-resolution imageAs the other electrode, FTO was used due to its transparency and smoothness. To be able to evaluate the generator operation in different capacities, four pieces of FTO, with dimensions proportional to specific numbers of Hg droplets, were utilized.
As mentioned before, the importance of C1 in the system is reducing the secondary equivalent capacitance. Therefore, during the dielectric selection of the upper electrode, the main focus was the wettability features like hysteresis and charge trapping [21]. PDMS is one of the proposed materials that alleviates hysteresis negative effects [36]. Whereas the most common way of PDMS deposition is spin coating, the dip coating method was applied due to the patterned form of the upper dielectric. To do so, arrays of 3 mm width adhesive tape on the FTO electrode in specified distances of 3 and 5 mm were stuck. While the main distance of these arrays should be 3 mm, the 5 mm distance was regarded considering the 2 mm width of double-sided adhesive separators as shown in figure 6(a). Next, a PDMS solution with a base-to-curing agent ratio of 1:10 was prepared and degassed in a vacuum desiccator. This solution then was diluted using toluene. In dip coating process, a PDC-01 programmable dip coater with adjusted upward speed of 1 mm s−1 was applied.
After preparing tow electrodes, sticking separators to the underneath electrode, and putting Hg droplets in channels, first electrical connections were ramified from each electrode, and then the upper electrodes were stuck to the adhesive separators. Finally, the whole system was sealed using silicon glue to avoid the Hg droplets from spreading out. Equivalent capacitance calculation was accomplished with the assumption of homogeneous shape for the droplets. This assumption leads to equality in the upper and underneath contact areas and simplifies the model. In this regard, the Hg droplets geometric features have been measured using the 'Image J' software. The results showed that the radius and area of droplets were about 0.6 mm and 1.13 mm2, respectively. Accordingly, the maximum equivalent capacitance of each droplet is 51pF whereas the dielectric stack of TiO2 is about 4.52 nF cm2.
4.2. Mechanical section
In order to evaluate the variable capacitor operation, we designed a shaker to convert rotational movements of a typical electric motor to linear oscillations. In this regard, the crank mechanism was applied which in comparison with the other rotational-to-linear mechanisms benefits from less friction and more efficiency. To take advantage of smooth oscillations, a linear rail system was attached to it. Finally, to control the oscillation rate for quantitative measurements, a dimmer switch was connected to the electric motor.
5. Results and discussion
5.1. Capacitance and voltage measurement
Evaluation of the capacitor was carried out using a GW Instek LCR meter connected to a computer software that enabled us to measure continuous variations of the capacitance as can be seen in figure 7.

Figure 7. Capacitance measurement using LCR meter.
Download figure:
Standard image High-resolution imageUsing different modes of capacitor connections, the capacitance of the system was measured for 12, 18, 36, 48, 66, and 84 droplets. Figure 8. Illustrates the maximum and minimum experimental and theoretical capacitance values. where Cex−min, Cex−max, and Cth−max represent minimum experimental values, maximum experimental values, and maximum theoretical values, respectively.
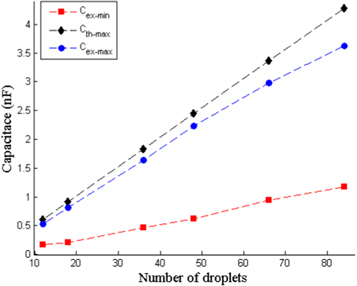
Figure 8. Theoretical and experimental capacitances per the number of droplets.
Download figure:
Standard image High-resolution imageAlthough the minimum theoretical values are considered to be zero, experimental results indicate that the minimum capacitance is not zero and its value increases constantly as a function of the number of droplets. This increment is due to the effect of the fringing fields as well as the limited precision of the measurement at relatively low capacitance values. Similarly, there is an increasing difference between experimental and theoretical maximum values which is attributed to the uncoordinated linear movement of the droplets. This difference leads us to more flexible designs, especially for the practical applications as the system is subjected to different mechanical forces with diverse directions.
Considering both (3) and figure 8, the capacitor oscillations were approximated in a range between 25%–100% of the maximum capacitance. The result can be formulated as,

Thus, considering (4) and (6), the charge variations of the capacitor and the power generation can be written as,

and

Using the voltage-constrained circuit shown in figure 3, the generated power was evaluated by recording the voltage values across the load resistor. Considering the fluctuating nature of the voltage, the effective values were calculated using:

As a result, the effective power is obtainable by:

In the circuit, the bias voltage and the load resistor were 7.5 V and 1MΩ respectively which were not optimized values.
5.2. Processing the results
Because of employing an electric motor nearby the system as well as small amounts of generated voltage, unintentional noises were detected in the measured values. To reduce the effect of external noises, the signal processing module of MATLAB was utilized. Regarding the distinct frequencies of the generated voltage in the system that were proportional to the applied mechanical forces, the FFT function was used. The FFT converts the measured voltage-time diagram to its equivalent of domain-frequency diagram. By eliminating the excess frequency signals and doing the process in reverse using IFFT, the real time-varying voltage diagram was attained. Figure 9 shows the theoretical capacitance variations of one droplet along with its position in the channel at one mechanical rotation. As can be seen, each mechanical rotation in this system is proportional to three electrical cycles. Hence, we were able to attain the frequency of electrical power by measuring the rotational speed.

Figure 9. The capacitance variations of one droplet at one mechanical rotation that is equivalent to three electrical cycles.
Download figure:
Standard image High-resolution imageRotational speed measurement was done using a PCE-151 handheld rotation meter that enabled us to measure the velocity and store the readings onto a computer using its software. To meet the practical needs, three different speeds were considered; one to gain power during common human activities such as walking, another in the case of deliberately forcing the system to produce power (for example by shaking hands), and finally when the system is being subjected to high-frequency linear motions such as industrial machines. In this regard, 16, 216, and 332 rpm rotational speeds were applied to the system that were equivalent to electrical cycles of 0.8, 10.8, and 16.6 Hz, respectively.
Figure 10(a) represents the measured voltage values for 18 droplets exited with mechanical rotation of 332 rpm as well as its unilateral FFT magnitude spectrum. The major peak at 50 Hz is due to residual AC coupling from the power grid and the peak in 100 Hz is due to the effect of dimmer on the system. In 33.4 Hz and 66.6 Hz frequencies, the effect of a second order intermodulation between 50 Hz and 16.6 Hz frequencies can be observed while the peak in 83.4 Hz is due to a third order intermodulation.
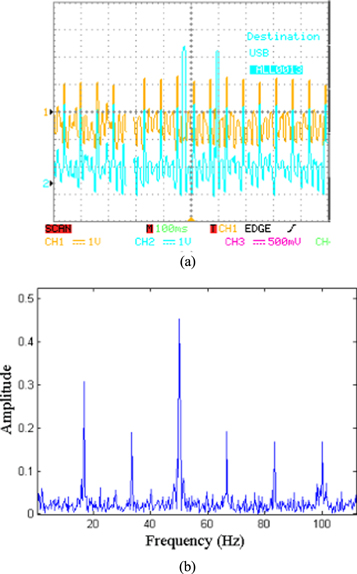
Figure 10. (a) Measured voltage for 18 droplets exited with mechanical rotation of 332 rpm. Blue wave and orange wave forms are related to the measured voltage across the variable capacitor and the load resistor, respectively. (b) Unilateral FFT magnitude spectrum related to the load resistor values.
Download figure:
Standard image High-resolution imageFigure 11 shows the processed time varying voltage diagram together with the effective amount corresponding to figure 10. As can be seen, the system generates 0.115 V RMS voltage in a voltage-constrained circuit with a 7.5 V supply.
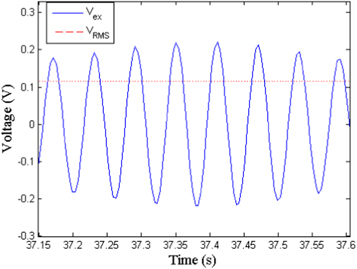
Figure 11. Processed time varying voltage diagram together with the effective values related to 18 droplets exited with rotation of 332 rpm.
Download figure:
Standard image High-resolution image5.3. The generator performance
Figure 12 represents the theoretical time varying curves of capacitance, current and power that have been gained using (7), (8), and (9) as well as their experimental equivalents related to 18 droplets excited with mechanical rotation of 332 rpm. The experimental curves shows the measured amounts of capacitance and current across the variable capacitor and voltage across the load resistor.
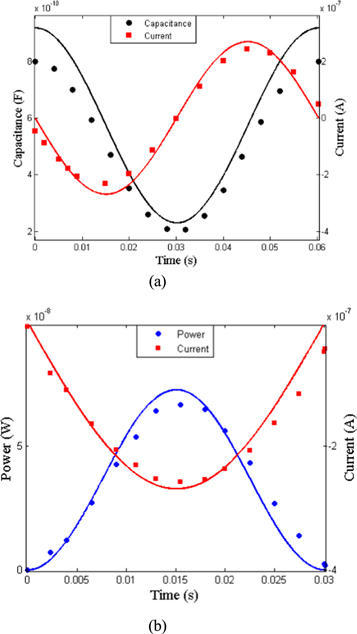
Figure 12. The capacitance, current and power values related to 18 droplets excited with mechanical rotation of 332 rpm. (a) The variations of capacitance and current across the capacitor in one cycle. (b) The power and current passing through the load in one half-cycle. Dots represent the experimental data while solid lines are the theoretical data calculated using proposed model.
Download figure:
Standard image High-resolution imageAs illustrated by figure 12(a), during the discharge half-cycle that is concurrent with the capacitance decrement, the decreased charge across the capacitor generates an electrical current. In this phase, charge reduction through the capacitor is visible in the form of a negative current that will turn to positive values in the charge half-cycle. It means that the charge half-cycle is along with attracting charge and energy from the bias source. Thus, to calculate the generated power, the discharge phase should be considered.
The generated current in the discharge half-cycle then passes through the load. The potential difference across the load resistor can be recorded and used to calculate the experimental values of power and current regarding  and
and  as shown in figure 12(b). Energy conversion in one half-cycle can be estimated by replacing (8) in (5) in the time interval of 0-T/2, is:

Equation (12) simply states that the operation of this generator in the voltage-constraint circuit is a function of four key parameters: frequency, load resistance, bias voltage, and maximum accessible capacitance. It worth mentioning that as the capacitor behavior had already been formulated using a semi-empirical model, the thermodynamic forces which affect the droplets are included in (12). However, in high bias voltage and charge-constraint circuits, more attention is required. It should be noted that in such cases the strong electric field can affect the dielectric and the droplets. Therefore, the forces are more complex and cannot be simplified as one single equation.
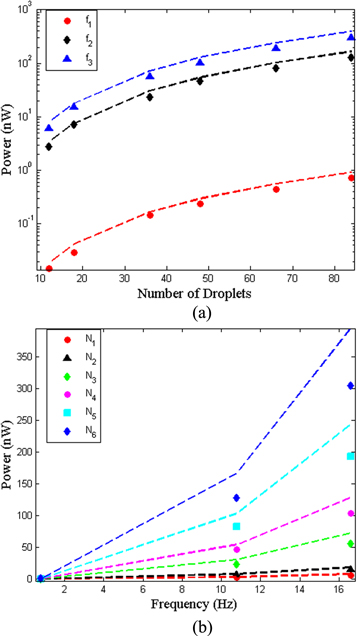
The dependence of power generation on the number of droplets and frequency is shown in figure 13. As can be seen in figure 13(a) the diagram has been captured in a logarithmic form due to the rapid growth of generated power with the number of droplets. In figure 13(b) a similar relation between the generated power and frequency is visible, as well. It means that frequency and number of droplets are two of the most effective parameters in the power generation process. The other important parameter is the bias voltage that is preferred to be low due to the probability of dielectric breakdown and electrowetting, as discussed earlier. The relative accordance between the experimental data from (11) and the theoretical data from (12) (considering P = Ef) confirms the reliability of the model. However, as the number of droplets increases, the deviation between the experimental and theoretical values is more recognizable. The main reason is inconsistency between the droplet motions.
Figure 13. (a) Effective power versus number of droplets in three frequencies of 0.8, 10.8, and 16.6 Hz. (b) Effective power versus frequency related to 12, 18, 36, 48, 66 and 84 droplets. Rload = 1 MΩ, and Bias voltage = 7.5 V. Dots represent the actual experimental data and solid lines are the theoretical values.
Download figure:
Standard image High-resolution image
As shown in figure 9, the droplet motion leads to capacitance variation and power generation. The maximum power generation occurs when all the droplets have exactly the same position in each single channel. However, as the applied frequency and number of droplets increases, full harmonic movement of droplets is less probable due to unpredictable frictional forces.
The maximum effective power reaches 305 nW which is quite close to the theoretical value of 394 nW. According to (11), the effective voltage and current are 0.55 V and 0.55 μA, respectively. These values can be enhanced using higher bias voltage and optimized load resistor.
6. Conclusions
In summary, a droplet-based power generator considering the effect of electrowetting was demonstrated. Because of the negative effects of dielectric breakdown and electrowetting on droplet-based power generator, a voltage-constrained circuit was used to mitigate uncontrolled voltage increment.
Considering the proposed model and experimental results, the working principle and performance of the system can be understood better. The theoretical and experimental analyzes and results were presented in detail. Different steps of noise cancellation and data processing were presented which would be a helpful example in similar experimental efforts. The fabricated generator was able to generate effective power of 305 nW at the load resistance of 1MΩ and the rotation rpm. The maximum output voltage was 1.25 V that can be increased by optimizing the bias voltage and load resistance. Different parameters affect the operation of the generator that among them, the effect of frequency and number of droplets was studied. Though increasing the number of droplets and the applied frequency can lead to inconsistency between the droplet motions and deviation from the ideal situation, the results confirm a direct relation between applied frequency and power generation.
The overall generated power can be increased using thin film deposition techniques (to increase capacitance per area) and also increasing the size and number of droplets. Replacing other conductive liquids and simultaneously using hydrophobic and super hydrophobic surfaces would be the subject of future studies.
The authors gratefully thank to Ahmad Gholami Boroujeni for his effective collaborations in designing and fabricating the mechanical section, Aliasghar Sadeghi for helpings in dielectric coat preparation, and Dr Farhad Barati for beneficial advises in the research path.
Funding
This work was supported by Materials and Energy Research Center. Program for Basic Research in Renewable Energies of Iran (grant no. 371393062).