


Abstract
Acetylene and benzene are two common molecules formed in Titan's atmosphere, and are likely components of the lake evaporites. It is known that these two molecules can form a cocrystal, a molecule with a structure that is unique from that of the component molecules. Thus, we sought to study this cocrystal using an experimental setup that simulates Titan surface conditions (90 K, 1.5 bar). Using Fourier transform infrared (FTIR) spectroscopy, we characterize new spectral absorptions, band shifts, and morphological sample changes associated with this cocrystal from 1 to 2.6 μm, which overlaps with Cassini VIMS wavelength range (0.35–5.1 μm). This is the first study of the resulting acetylene–benzene cocrystal under Titan-relevant temperature and pressure. The cocrystal forms at 135 K and is stable down to 90 K. Our findings can be applied to the cocondensation process in Titan's atmosphere, as well as the ongoing effort to better characterize the composition and spectral properties of Titan's lake evaporites. These results can also provide a stepping stone to future surface missions such as Dragonfly, which will closely examine relevant surface materials on Titan.
Export citation and abstract BibTeX RIS

Original content from this work may be used under the terms of the Creative Commons Attribution 4.0 licence. Any further distribution of this work must maintain attribution to the author(s) and the title of the work, journal citation and DOI.
1. Background
Titan has a plethora of simple and complex organic molecules that are created in the atmosphere by solar ultraviolet (UV) rays and energetic particles from Saturn's magnetosphere interacting with atmospheric methane (CH4) and nitrogen (N2). A range of simple organics can be produced, including C2H6, C2H2, C2H4, C6H6, HCN, etc. (Hörst 2017), many of which are able to condense or cocondense from gas to solid ices in Titan's atmosphere and potentially form ice clouds (Anderson et al. 2018). These condensation (or cocondensation) byproducts would eventually fall to Titan's surface in the solid phase, where they could either directly deposit into the polar lakes and be dissolved, or they may be transported fluvially across Titan's surface via river channels, and eventually dissolve into the lakes and seas. After lake evaporation, these types of compounds would precipitate out from the lakes in the form of evaporites, as observed by Cassini RADAR (Barnes et al. 2011; Cordier et al. 2016; MacKenzie & Barnes 2016). However, to fully understand the composition of these observed evaporitic features, additional experimental work is needed. Previous laboratory studies have characterized a number of potential evaporite compounds and cocrystals such as acetylene (C2H2) (Singh et al. 2017), ethylene (C2H4) (Czaplinski et al. 2019; Singh et al. 2017) ethane-benzene (C2H6–C6H6) (Cable et al. 2014; Vu et al. 2014), acetylene–butane (C2H2–C4H10) (Cable et al. 2019), and acetylene–ammonia (C2H2–NH3) (Cable et al. 2018).
Here, we characterize a type of evaporite compound (a cocrystal) formed with C2H2 and C6H6. Both C2H2 and C6H6 are relatively abundant photochemical products, with C2H2 being the second most abundant hydrocarbon produced in Titan's atmosphere, behind ethane (C2H6) (Hörst 2017). Acetylene has been detected in Titan's atmosphere by the infrared radiometer spectrometer (IRIS) on Voyager 1 (Hanel et al. 1981), telescopes such as the Infrared Space Observatory (ISO; Coustenis et al. 2003), Cassini's Ion Neutral Mass Spectrometer (INMS; Waite et al. 2005), Cassini's Ultraviolet Imaging Spectrometer (UVIS; Shemansky et al. 2005), Cassini Infrared Spectrometer (CIRS; Coustenis et al. 2007), and near Titan's surface by the Huygens probe (Niemann et al. 2010). Solid acetylene ices have been observed by the Cassini Visual and Infrared Mapping Spectrometer (VIMS; Singh et al. 2016b). Acetylene has been linked to the composition of Titan's equatorial dunes (Abplanalp et al. 2019; Lorenz et al. 2006) and is a primary candidate for composing the evaporites that are ever present in Titan's lake district (Cordier et al. 2009). Benzene was first detected at Titan by the ground based telescope ISO (Coustenis et al. 2003), and was also measured by Cassini/INMS (Waite et al. 2005), UVIS (Koskinen et al. 2011), CIRS (Coustenis et al. 2007), near the surface by the Huygens probe (Niemann et al. 2005), and as surface ices by Huygens' Gas Chromatograph Mass Spectrometer (GCMS; Niemann et al. 2005) and Cassini/VIMS (Clark et al. 2010).
The formation of the C2H2–C6H6 cocrystal has been studied in great detail in previous works using infrared–ultraviolet (IR–UV) double resonance spectroscopy (Sundararajan et al. 2002; Fujii et al. 2004; Busker et al. 2008; Böning et al. 2013; Ulrich et al. 2014). In the simplest structure, a hydrogen from the C2H2 molecule interacts with the π cloud from the C6H6 molecule, forming a C–H ••• π bond in a T-shaped arrangement (e.g., Figure 1 from (Busker et al. 2008))(Sundararajan et al. 2002). The driving factor in the T-shaped arrangement of the C2H2–C6H6 cocrystal is a coulombic-polarization interaction between the electron-deficient H-atom end of the C2H2 molecule and the electron-rich C6H6 ring (Boese et al. 2003). Strong miscibility and solubility between C2H2 and C6H6 is the main force for cocrystal formation (Boese et al. 2003). These previously reported techniques have laid the groundwork for characterizing the cocrystal in the mid infrared region. Additionally, X-Ray Diffraction (XRD) and ab initio theoretical calculations (Sundararajan et al. 2002; Majumder et al. 2013; Maleev & Boese 2014; Ulrich et al. 2014) have also given detailed structural information on the cocrystal.

Figure 1. Fourier transform infrared reflectance spectra (1.45 to 1.96 μm) of C2H2 from 89 K to 184 K. Acetylene was deposited at 140 K, the sample was cooled to 89 K, then slowly warmed to 184 K. Two transition phases are observed at 140 K and 184 K.
Download figure:
Standard image High-resolution imageRecent studies of evaporite-relevant cocrystal formation with C2H2–C4H10 and C2H2–NH3 mixtures underscores the importance of studying such molecules under Titan conditions (Cable et al. 2018, 2019). Cocrystal formation in a C2H6–C6H6 system has also been carried out at Titan temperatures (Cable et al. 2014; Vu et al. 2014; Maynard-Casely et al. 2016), and benzene has been included in the list of probable evaporite molecules (Clark et al. 2010). However, the formation of the C2H2–C6H6 cocrystal has not yet been tested under Titan atmospheric and surface conditions. Therefore, we sought to study the interactions of the acetylene–benzene aggregate at Titan-relevant temperatures and pressure (∼89–94 K, 1.5 bar) using IR spectroscopy (1–2.6 μm).
2. Experimental Methods
To investigate interactions between acetylene and benzene, we conduct laboratory experiments in the Titan Surface Simulation Chamber (TSSC) located at the University of Arkansas (Wasiak et al. 2013). Briefly, a pressure of 1.5 bar is maintained with N2 gas and temperatures of 89–94 K are maintained with liquid nitrogen (LN2). Organic compounds are condensed from gas phase in a condenser, and are then poured onto a sample dish for further analysis. The TSSC has been used for a number of previous Titan-relevant studies (Luspay-Kuti et al. 2012, 2015; Singh et al. 2017). More recently, several modifications to the TSSC's cooling system, fiber optics, and cameras have allowed for studies of Titan's evaporites (Czaplinski et al. 2019) and bubble formation in Titan's lakes (Farnsworth et al. 2019). The specific mechanics and protocols of the TSSC are detailed in these previous studies. Relevant details for this set of experiments are provided below.
Prior experimental protocol for the TSSC was designed for compounds that are gas phase at standard ambient temperature and pressure (SATP; e.g., CH4, C2H4, C2H6, etc.). However, as C6H6 is a liquid at SATP, a refined experimental protocol must be followed when introducing C6H6 to the TSSC. First, we restrict LN2 flow from the condenser, while LN2 cools the rest of the TSSC temperature control box (TCB) as normal. Inside a custom-built glovebox, an Erlenmeyer flask is filled with 50 mL of >99.7%, OmniSolv® Benzene (C6H6, Sigma-Aldrich). The flask has two connections through the glovebox: one to the N2 gas (Airgas industrial grade, >99.998%), and the other to a valve control on the exterior of the chamber with "exhaust" and "condenser" outlets. Nitrogen is continuously bubbled through the C6H6-filled flask to the exhaust system at 20 kPa for ∼5 min. This flow of N2 through the flask creates surficial bubbling of the C6H6 that is confirmed through optical images. After the flask reaches N2 saturation and the sample dish reaches ∼223 K, we then open the solenoid valve, close the exhaust valve, and open the exterior condenser inlet so that the N2–C6H6 saturated mixture is carried through the condenser where it deposits onto the sample dish in solid phase (referred to here as the cold trap method). The C6H6 deposits onto the sample dish for ∼15 minutes, or until solid C6H6 particles are seen in the TCB's optical cameras and Fourier transform infrared spectroscopy (FTIR) measurements show C6H6 vibrational bands. We use a Nicolet 6700 FTIR spectrometer that is equipped with a TEC InGaAs 2.6 μm detector, a CaF2 beam-splitter, spectral range of 1 to 2.6 μm, spectral sampling of 4 cm−1, spectral resolution of 0.01 cm−1, and connected to a fiber optic probe located above the sample dish. After this allotted time, the N2 bubbling through the Erlenmeyer flask is stopped, and the external condenser outlet is closed. We leave the solenoid valve open for an additional 5 minutes to prevent any blockages from the C6H6. Additional FTIR measurements of the pure C6H6 are made for comparisons between the combined mixture later.
After the sample dish has reached 173 K, we begin flowing C2H2 (Airgas, 99.6%, acetone added as stabilizer) through the condenser at 50 kPa for 20 minutes, where it deposits on the sample dish in solid phase. Deposition is confirmed by optical TCB cameras and FTIR spectra. After we stop the C2H2 gas flow, the solenoid valve is left open for 5 minutes to prevent blockages.
Once both compounds are deposited onto the sample dish (sample thickness on the order of a few mm), the LN2 flow to the condenser is turned on. Note that at this point, we are finished adding compounds to the condenser; the condenser LN2 flow merely contributes to the rest of the TCB successfully attaining Titan surface temperatures (89–90 K). Depending on the experiment, the TCB temperatures may be warmed later in the experiment in an attempt to speed up reaction times or, in the case of C2H2, to identify how the spectra changes with regards to temperature. The mole fraction for the acetylene–benzene experiment was calculated using the same methods reported in Czaplinski et al. (2019; see Spectral Unmixing Model section), a Python code (see Czaplinski et al. 2019) that decomposes a given spectrum into a best fit of linear combinations of the pure spectra (taken at corresponding temperatures) added together. The mole fraction is reflected in the linear weights that each raw component spectrum is given to fit the experimental data.
3. Results
Near-infrared (NIR) spectra of acetylene is reported first, then benzene, and lastly we examine the formation of the acetylene–benzene combined aggregate. For clarity, a reduced spectral range (1.45 to 1.96 μm for C2H2 and 1.57 to 2.33 μm for C6H6) is presented to allow for an enhanced view of the bands described. The full range spectra are included in the Appendix (Figures A1–A4). Regarding the vibrational mode and bond label columns in Tables 1–5, NIR absorption bands arise from overtones and combinations of the fundamental IR molecular vibrations often associated with hydrogen atoms. Changes in the interatomic distance or angle between two atoms are known as stretching or bending vibrations, respectively. The vibrational quantum number, v, describes the energy state of the vibrational motion of the molecule, in terms of degrees of freedom.
Table 1. Vibrational Modes and Band Assignments of C2H2
| Vibrational Mode Assignment | Band Centers from the Literature a | This Study | ||
|---|---|---|---|---|
| λ (μm) 15 K | λ (μm) | λ (μm) | λ (μm) | |
| [wavenumber (cm−1)] | 89 K | 140 K | 184 K | |
| ν1 + ν3 | 1.552 | 1.552 | ||
| (sym. and asym. C–H stretch) | [6442] | [6440] | ... | ... |
| ν1 + ν3(ν2 + ν3 + 2ν4) | 1.545 | 1.547 | ||
| First overtone of C–H stretch | [6472] | ... | [6465] | ... |
| 1.549 | 1.548 | |||
| [6454] | [6457] | ... | ... | |
| 1.552 | 1.552 | |||
| [6442] | [6440] | ... | ... | |
| 1.555 | 1.555 | |||
| [6431] | [6432] | ... | ... | |
| 1.557 | 1.558 | 1.558 | ||
| [6421] | [6419] | [6418] | ... | |
| ν1 + 2ν4 + ν5 | 1.896 | 1.895 | 1.890 | |
| (C–H sym., trans, and cis bend) | [5275] | [5276] | [5291] | ... |
| 5ν4 + 3ν5 | 1.929 | 1.928 | 1.923 | |
| (Trans and cis bend) | [5183] | [5185] | [5201] | ... |
| 1.933 | 1.932 | 1.925 | ||
| [5174] | [5176] | [5193] | ... | |
| ν1 + ν4 + ν5 | 2.133 | |||
| (C–H sym., trans, and cis bend) | 2.135 | 2.135 | [4689] | ... |
| [4684] | [4682] | 2.139 | ||
| [4674] | ||||
| ν3 + 2ν4 | 2.221 | 2.222 | 2.224 | |
| (C–H asym. stretch, trans bend) | [4502] | [4500] | [4495] | ... |
Notes. Band centers from this study at various temperatures are compared with values from the literature at 15 K (band centers in wavenumbers (cm−1) are listed in brackets).
References.
a Hudson, Ferrante, and Moore 2014.Download table as: ASCIITypeset image
3.1. NIR Reflectance Spectra of C2H2 Ice
Figure 1 shows NIR spectra of acetylene ice from 89 to 184 K. Vibrational modes and band assignments are presented in Table 1. The acetylene was deposited as a solid at 140 K, after which the temperature was lowered to 89 K over the course of 28 minutes, then slowly warmed (temperatures denoted in Figure 1). The average temperature decrease was −1.73 degrees/minute with the steepest decrease in temperature being −4.61 degrees/minute. At 89 K, the acetylene exhibits a quadruplet feature from 1.54–1.55 μm (ν1 + ν3 vibrational mode), as well as two smaller bands around 1.931 μm (5ν4 + 3ν5 vibrational mode; see Figure 1). Significant spectral changes occur as the sample is slowly warmed.
Repeated experiments show the next major change occurs at 140 K, where the quadruplet transforms into a single band (centered at 1.547 μm), and the 5ν4 + 3ν5 mode decreases in reflectance by ∼13% (Figure 1). The quadruplet band center is blueshifted to the single band by 0.025–0.026 μm from the 89 K spectrum. The last band transition in this study occurs at 184 K (just before acetylene's sublimation point, 189 K, and triple point, 192 K), where the formerly single band at 1.547 μm disappears, leaving only the doublet with band centers at 1.521 and 1.529 μm (Figure 1). Minor bands at 2.135 and 2.222 μm (ν1 + ν4 + ν5 and ν3 + 2ν4 , respectively) are presented in the Appendix (Figure A1).
3.2. NIR Reflectance Spectra of C6H6 Ice
Figure 2 shows NIR spectra of pure benzene from 85 to 151 K from separate experiments where corresponding temperatures were achieved. Vibrational modes and band assignments of benzene are presented in Table 2. NIR benzene spectra are characterized by C–H aromatic ring first overtones of stretching vibrations in the 1.65–1.70 μm region (Figure 2, Table 2). Various less reflective bands are observed from 1.70–2.00 μm, which lead up to the C–H aromatic ring combination bands from 2.14–2.20 μm region (Figure 2).

Figure 2. Fourier transform infrared reflectance spectra (1.57 to 2.33 μm) of C6H6 from 85 to 151 K. Full range spectra presented in Appendix Figure A2. These spectra represent three separate experiments where the corresponding temperature range was achieved. Notice the decrease in reflectance with increasing temperature.
Download figure:
Standard image High-resolution imageTable 2. Vibrational Modes and Band Assignments of C6H6.
| Vibrational Mode Assignment | Band Centers From the Literature | This Study (85–151 K) | ||
|---|---|---|---|---|
 (cm−1) (cm−1) | λ (μm) |
 (cm−1) (cm−1) | λ (μm) | |
| ν3 (C–H aromatic stretch) | 8786 a | 1.138 | 8793 | 1.137 |
| 2νCH + 2(νCC + ν3) (C–H aromatic stretch) | 8770 b | 1.140 | 8774 | 1.139 |
| ν15 + ν5 (C–H aromatic stretch) | 6107 d , c | 1.637 | 6136 | 1.63 |
| ν12 + ν1 (C–H aromatic stretch) | 5985 c | 1.671 | 5976 | 1.673 |
| ν15 + ν5 (C–H aromatic stretch) | 5920 e , c | 1.689 | 5910 | 1.691 |
| ν15 + ν9 (C–H aromatic combination) | 4655 c | 2.141 f | 4663 | 2.144 |
| ν12 + ν16 (C–H aromatic combination) | 4642 c | 2.153 f | 4640 | 2.155 |
| ν16 + ν5 (C–H aromatic combination) | 4615 c | 2.163 f | 4618 | 2.165 |
| ν13 + ν1 (C–H aromatic combination) | 4570 c | 2.181 f | 4580 | 2.183 |
| ν13 + ν15 (C–H aromatic combination) | 4532 c | 2.200 f | 4541 | 2.202 |
| ν12 + ν3 Methyl C–H combination) | 4360 c | 2.294 | 4372 | 2.286 |
| ν12 + ν17 (Methyl C–H combination) | 4252 c | 2.352 | 4256 | 2.349 |
References.
a (Reddy & Berry 1982), gas phase. b (Bassi et al. 1993), 300 K. c (Kaye 1954), no temperature noted. d Calculated. e Observed. f Reboucas & de Barros Neto (2001), 292 K.Download table as: ASCIITypeset image
We do not observe drastic spectral changes with temperature, as with acetylene. The main difference among the benzene spectra is the decrease in reflectance by ∼10%–15% at warmer temperatures, possibly due to grain size differences, volumetric scattering (Singh et al. 2016a), or a change in thickness due to sublimation or evaporation of the sample as it is heated.
3.3. NIR Reflectance Spectra of C2H2–C6H6 Mixture
Figures 3 and 4 show NIR spectra of a C2H2–C6H6 mixture from 135 to 151 K and 93 to 94 K, respectively. The benzene:acetylene %mol fraction for this experiment is 45:55. Assignments of new bands are presented in Tables 3 and 4. Table A1 lists the temperature at each time a new spectrum was recorded. In this experiment, C6H6 was deposited first, from 158 to 132 K, then C2H2 was deposited afterward, from 168 to 150 K. The sample was cooled to 94 K, warmed to 173 K, before cooling back to 93 K to characterize spectral changes with temperature. The 144 K spectrum (Figure 3) was taken during C2H2 deposition (t = 0). We observe several new bands in the combined spectrum that are not present in either pure C2H2 or C6H6 spectra (Figures 1 and 2). These bands are located from 1.569 to 1.598 μm, as well as 1.943 to 2.122 μm (Figures 3 and 4). We observe an increase in reflectance by up to 20% as temperature decreases. These reflectance changes may be due to changes in sample thickness, as more C2H2 and/or C6H6 in the "atmosphere" above the sample dish could be condensing on the sample dish.

Figure 3. NIR reflectance spectra of pure C6H6 (blue) and C2H2 (red) compared with the C2H2–C6H6 cocrystal (purple) from 1.48 to 2.35 μm. Cocrystal spectra are shown in order of increasing time from top to bottom. Only "warm" spectra are shown here (135–151 K). The sample was cooled to 94 K, warmed to 173 K, then cooled back to 93 K to characterize changes with temperature ("cold" spectra shown in Figure 4). The bands denoted by arrows in the 135 K spectrum represent the transition to cocrystal formation, as they are neither present in pure C6H6 nor C2H2 at similar temperatures.
Download figure:
Standard image High-resolution image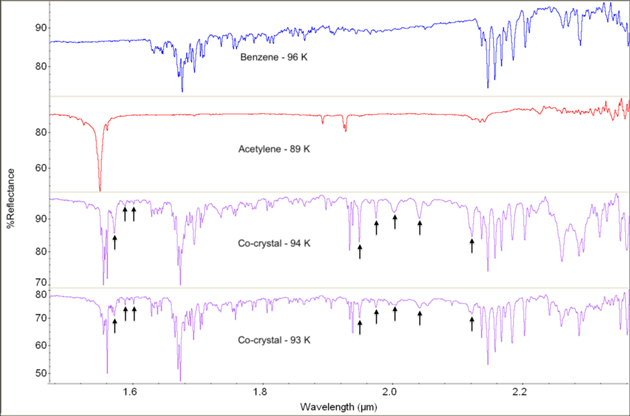
Figure 4. NIR reflectance spectra of pure C6H6 (blue) and C2H2 (red) compared with the C2H2–C6H6 cocrystal (purple) from 1.48 to 2.35 μm. Cocrystal spectra are shown in order of increasing time from top to bottom. Only "cold" spectra are shown here (89–96 K). The sample was cooled to 94 K, warmed to 173 K ("warm" spectra shown in Figure 3), then cooled back to 93 K to characterize changes with temperature. Notice the additional new bands (denoted by arrows) associated with the cocrystal that appear at these colder temperatures, when compared with the warmer temperatures of Figure 3.
Download figure:
Standard image High-resolution imageTable 3. Band Centers from Pure Cubic C2H2 (140 K) and Pure C6H6 (151 K) Compared with Cocrystal Bands at 135 K
| Molecule | Vibrational Mode Assignment | Band Center λ (μm) [wavenumber (cm-1)] | ||
|---|---|---|---|---|
| Pure Component | Cocrystal (135 K) | Δν between Pure and Cocrystal | ||
| Acetylene | ν1 + ν3(ν2 + ν3 + 2ν4 ) | 1.558 [6418] | 1.557 [6421] | 0.001 [3] |
| (140 K) | First overtone of C–H stretch | ... | 1.568 [6376] | ... |
| 5ν4 + 3ν5 (Trans and cis bend) | 1.923 | 1.936 [5166] | 0.011 [-35] | |
| [5201] | ||||
| 1.925 | ||||
| [5193] | ||||
| ... | ... | 1.946 [5138] | ... | |
| ... | ... | 1.971 [5072] | ... | |
| ... | ... | 2.038 [4906] | ... | |
| Benzene | ν12 + ν1 (C–H aromatic stretch) | 1.673 [5976] | 1.673 [5976] | 0 |
| (151 K) | ν15 + ν5 (C–H aromatic stretch) | 1.693 [5908] | 1.692 [5911] | 0.001 [3] |
| ν15 + ν9 (C–H aromatic combination) | 2.145 [4662] | 2.145 [4662] | 0 | |
| ν12 + ν16 (C–H aromatic combination) | 2.155 [4640] | 2.155 [4640] | 0 | |
| ν16 + ν5 (C–H aromatic combination) | 2.165 [4618] | 2.165 [4618] | 0 | |
| ν13 + ν1 (C–H aromatic combination) | 2.183 [4579] | 2.182 [4582] | 0.001 [3] | |
| ν13 + ν15 (C–H aromatic combination) | 2.202 [4540] | 2.201 [4543] | 0.001 [3] | |
| ν12 + ν17 (Methyl C–H combination) | 2.350 [4256] | 2.348 [4258] | 0.002 [2] | |
Note. Only bands present in either the cocrystal or both the cocrystal and pure component are presented. All other bands for C2H2 and C6H6 are listed in Tables 1 and 2.
Download table as: ASCIITypeset image
Additionally, we observe several significant frequency shifts of bands associated with the bare C2H2 molecule (Figures 3 and 4, Tables 3 and 4). The largest shifts associated with C2H2 are observed immediately after C2H2 has been deposited on the sample dish at 135 K (t = 6). This is observed in the 5ν4 + 3ν5 band of C2H2 which blueshifts by 30 cm−1 upon cocrystal formation. When combined with C6H6, the 1.548 μm band (ν1 + ν3(ν2 + ν3 + 2ν4 ) mode) redshifts by 45.64 cm−1 and the 1.925 μm bands (5ν4 + 3ν5 mode) redshifts by 26.85 cm−1 (Table 5). Note that we use the unit cm−1 in these shifts to compare values with ones reported in the literature. The ν1 + ν3(ν2 + ν3 + 2ν4 ) vibrational mode (quadruplet feature at 1.549 μm and 1.558 μm; see Table 1) blueshifts from 4.12 to 8.35 cm−1, whereas the 5ν4 + 3ν5 vibrational mode (1.932 μm) redshifts by up to 10.69 cm−1 in the last spectrum of the experiment (t = 168). Figure A5 shows shifts of the 1.558 μm band with temperature. Frequency shifts of bands associated with the bare C6H6 molecule are characterized by a 3.60 cm−1 blueshift of the C–H aromatic ring first overtones, a 3.58 cm−1 redshift of the ν2 mode, a 3.50 cm−1 blueshift of the ν15 + ν5 mode, and a 2.10 cm−1 blueshift of the ν13 + ν1 mode.
Table 4. Band Centers from Pure Orthorhombic C2H2 (89 K) and Pure C6H6 (96 K) Compared with Cocrystal Bands at 94 K
| Molecule | Vibrational Mode Assignment | Band Center λ(μm) [wavenumber (cm-1)] | ||
|---|---|---|---|---|
| Pure Component | Cocrystal (94 K) | Δν between Pure and Cocrystal | ||
| Acetylene | ν1 + ν3(ν2 + ν3 + 2ν4 ) | ... | 1.569 [6374] | ... |
| (89 K) | First overtone of C–H stretch | ... | 1.585 [6306] | ... |
| ... | 1.599 [6254] | ... | ||
| ν1 + 2ν4 + ν5 | 1.895 [5276] | 1.895 [5276] | 0 | |
| (C–H sym., trans, and cis bend) | ||||
| ... | 1.903 [5254] | ... | ||
| 5ν4 + 3ν5 (Trans and cis bend) | 1.928 [5185] | 1.928 [5185] | 0 | |
| 1.932 [5176] | 1.931 [5177] | 0.001 [1] | ||
| ... | ... | 1.936 [5164] | ... | |
| ... | ... | 1.946 [5137] | ... | |
| ... | ... | 1.972 [5069] | ... | |
| ... | ... | 2.00 [5000] | ... | |
| ... | ... | 2.039 [4904] | ... | |
| ν1 + ν4 + ν5 | 2.135 [4682] | 2.135 [4684] | 0 [2] | |
| (C–H sym., trans, and cis bend) | ||||
| ν3 + 2ν4 | 2.222 [4500] | 2.219 [4506] | 0.003 [6] | |
| (C–H asym. stretch, trans bend) | ||||
| Benzene | ν12 + ν1 (C–H aromatic stretch) | 1.673 [5976] | 1.673 [5976]] | 0 |
| (96 K) | ν15 + ν5 (C–H aromatic stretch) | 1.692 [5909] | 1.692 [5910] | 0 [1] |
| ν15 + ν9 (C–H aromatic combination) | 2.144 [4663] | 2.144 [4663] | 0 | |
| ν12 + ν16(C–H aromatic combination) | 2.155 [4640] | 2.155 [4640] | 0 | |
| ν16 + ν5 (C–H aromatic combination) | 2.165 [4617] | 2.165 [4618] | 0 [1] | |
| ν13 + ν1 (C–H aromatic combination) | 2.183 [4580] | 2.182 [4582] | 0.001 [2] | |
| ν13 + ν15 (C–H aromatic combination) | 2.202 [4541] | 2.201 [4543] | 0.001 [2] | |
| ν12 + ν3 Methyl C–H combination) | 2.286 [4374] | 2.285 [4376] | 0.001 [2] | |
| ν12 + ν17 (Methyl C–H combination) | 2.349 [4258] | 2.349 [4258] | 0 | |
Note. Only bands present in either the cocrystal or both the cocrystal and pure component are presented.
Download table as: ASCIITypeset image
Table 5. Cocrystal Spectral Shifts Compared with Values from the Literature. Band Shifts are Reported in Wavenumbers (cm−1) for Easier Comparison with the Literature.
| Temperature (K) | Previous Work | Temperature (K) | This Study | ||
|---|---|---|---|---|---|
| Vibrational Mode | Band Shifts (cm−1) | Vibrational Mode | Band Shifts (cm−1) | ||
| See | C2H2 ν3 band (C–H stretch) | −22 b , c | 144 | 5ν4 + 3ν5 | 26.85 |
| footnote | Trans, and cis bending | ||||
| Jet-cooled | C2H2 C–H stretch | 40 c | 144 | ν1 + ν3(ν2 + ν3 + 2ν4 ) | 41.52 |
| 123 | Acetylenic C–H stretch | 45.64 | |||
| 12–40 | ν4 of C6H6 (C–H bend) | 4.4 a | 108 | C–H stretch of C6H6 | −3.6 |
| Jet-cooled | C–H stretch of C6H6 | No shift within 1 cm−1 3 | 123–144 | C–H stretch of C6H6 | no shift within 1 cm−1 |
| 12–40 | ν5 of C2H2 | 3.2 a | 100 | 5ν4 + 3ν5 | −2.68 |
| Trans and cis bend of C2H2 | |||||
| 12–40 | ν3 of C2H2 | 15.9 a | 93 | 5ν4 + 3ν5 | 10.69 |
| Trans and cis bend of C2H2 | |||||
| 13.1 a | |||||
Notes.
a Sundararajan et al. 2002 (12–40 K). b Böning et al. 2013 (a few Kelvin). c Fujii et al. 2004 (jet-cooled).Download table as: ASCIITypeset image
The sample shows significant optical changes after C2H2 deposition, as shown in Figure 5. When only C6H6 is in the sample dish (Figures 5(a), (c)), the sample consists of separated, spherical, white deposits. However, after C2H2 is added to the C6H6 (Figures 5(b),(d)), the sample's appearance changes drastically. Separate white deposits are no longer present; rather, the sample transforms into an ice-like phase with many new morphological features including linear features, dark separation lines, flattening of the sample, and increased reflectivity. These features are not observed in any experiments with solely C2H2 or C6H6. Knowledge of the unique morphology of the cocrystal may help future Titan surface missions (i.e., Dragonfly) identify cocrystals with the microscopic camera of DragonCam (Lorenz et al. 2017).

Figure 5. Top-down view of C2H2–C6H6 mixture in sample dish showing two different C2H2–C6H6 experiments: (a) and (b) being one, and (c) and (d) being the other. Panel (a) shows the sample at 162 K, before C2H2 was added to the dish, panel (b) shows the sample at 140 K (t = 3), after C2H2 was added to the C6H6 on the dish, cooled, and warmed. Notice the difference in sample appearance and morphology from (a) where the sample lacks defined features, to (b) where distinct separations in the sample start to form. These separations appear as darker "cracks" on the sample surface. Panel (c) shows the sample at 162 K, before C2H2 was added to the dish, and panel (d) shows the sample at, 112 K, after C2H2 was added to the C6H6 on the dish. Notice how both panels (b) and (d) exhibit a more complex morphological structure after both C2H2 and C6H6 have had time to interact with each other on the dish. The white color of the sample is due to the Spectralon® IR reflectance material upon which the sample is deposited.
Download figure:
Standard image High-resolution image4. Discussion
4.1. C2H2 and C6H6 Spectral Changes
The band shifts observed in the C2H2 experiments can be explained by a transition from an ordered, low temperature, orthorhombic form to a disordered, high temperature, cubic form of acetylene's crystal structure (Schwartz et al. 1969; Preston et al. 2010; Hudson et al. 2014). At the lower temperatures, the C2H2 molecules exist in a smaller volume orthorhombic structure where there are few thermal vibrations of the molecules. As the C2H2 is warmed to the slightly larger volume cubic form, the molecules become rotationally disordered, hence the weaker spectral signals. Previous studies on pure C2H2 (Schwartz et al. 1969; Preston et al. 2010) have noted these changes, however at slightly colder temperatures (133 K) than here (139 K). The difference in temperature may be due to differences in experimental setup or the nature of the sample (thin versus thick film), which is good to be aware of when studying acetylene-bearing materials up close. For example, Titan's equatorial dunes have been hypothesized to have a C2H2 component (Lorenz et al. 2006; Lunine & Hörst 2011; Abplanalp et al. 2019). The Dragonfly rotorcraft (Lorenz et al. 2017) will land in Titan's dunes and study their composition up close. Additionally, the presence of crystalline C2H2 in Titan's lower stratosphere has been suggested (Coustenis et al. 1999; Khanna 2005). Our measurements could be used to search for C2H2 in Titan's clouds to better confirm these suggestions.
Changes in temperature do not drastically affect the pure C6H6 spectra, as they do with C2H2. The main observation here is a decrease in reflectance by ∼10%–15% at warmer temperatures. Although the spectra do not change much, knowledge of reflectance variations may still be useful when analyzing Titan surface data from past or future missions.
4.2. C2H2–C6H6 Cocrystal
Given the results from these experiments, we believe that the cocrystal has formed in our combined C2H2–C6H6 experiment (Section 3.3.) through solid–solid interactions between the two molecules. In this experiment, we first observe the transition from two separate molecules (C2H2 + C6H6) to the cocrystal when the sample is below 135 K, which is in the range where the orthorhombic phase of acetylene is stable. Other cocrystals formed with acetylene are stable above 135 K (e.g., acetylene–butane (Cable et al. 2019), while others are only stable up to 115 K (acetylene–ammonia) and 120 K (acetylene-acetonitrile) (Cable et al. 2018, 2020, respectively). This variation in stability ranges for different cocrystals are important to keep in mind for future cocrystal studies in both terrestrial laboratory and Titan in situ environments. While we are not able to investigate the exact crystal structure and orientation of the C2H2–C6H6 cocrystal with IR spectra alone, we assume a 1:1 ratio (benzene:acetylene 45:55 %mol fraction) formation mechanism consistent with the T-shaped arrangement because this is the simplest scenario.
The spectra are characterized by additional vibrational modes from 1.569 to 1.598 μm, and 1.943 to 2.122 μm that are not observed in spectra from either of the individual components (C2H2 or C6H6). Similarly, other cocrystal studies have identified co-crystallization by frequency shifts and new bands using Raman spectroscopy (e.g., (Cable et al. 2019) and IR–UV spectra (e.g., Fujii et al. 2004).
Previous IR spectroscopic studies of C2H2–C6H6 have reported shifts of C2H2 bands by up to 15.9 cm−1 (Sundararajan et al. 2002), 22 cm−1 (Böning et al. 2013; Fujii et al. 2004), and 40 cm−1 upon formation of the cocrystal (Fujii et al. 2004; see Table 5). By comparison, redshifts reported here are 10.69 cm−1 and 26.85 cm−1 for the 5ν4 + 3ν5 mode, and 41.52 cm−1 and 45.64 cm−1 for the 1.548 μm band of the ν1 + ν3(ν2 + ν3 + 2ν4 ) vibrational mode, which agree with values from the literature. C–H aromatic ring first overtone stretching vibrations of C6H6 (Table 2) are not shifted upon initial addition of C2H2, which also corresponds with what is reported in the literature (Fujii et al. 2004).
Furthermore, the optical images of the sample show morphological changes after C2H2 deposition (Figure 5) that are not present in repeated pure C2H2 or C6H6 experiments. These morphological differences may be explained by the change in crystal structure as C2H2 molecules are incorporated into the C6H6. While our experimental techniques do not allow for microscopic measurements of the C2H2–C6H6 crystal structure, repeated observations of new bands, band shifts, and sample morphology changes support the claim that a new phase (i.e., a cocrystal) of C2H2–C6H6 has been identified under Titan-relevant conditions. Microscopic imaging by Dragonfly may be able to distinguish between a cocrystal-blanketed surface and a surface dominated by pure hydrocarbon ices by noting similar "cracked" textural features as observed in our experiments. The morphological changes upon cocrystal formation may allow for easier identification on Titan's surface due to the increased reflectance and roughness observed. Furthermore, many material properties of the cocrystal might differ from simpler hydrocarbon ices, such as mechanical properties which could affect surface weathering and erosion. Further work is needed to characterize the mechanical properties of this new class of minerals on Titan.
4.3. Relevance to Titan
The spectral transitions observed after the solid–solid interaction between C2H2 and C6H6 is interesting because it implies that cocrystals can form relatively easily. Past studies have demonstrated that it is common for acetylene cocrystals to form through solid–solid interactions at Titan temperatures (Cable et al. 2018, 2020). These results have strong implications for Titan's surface, where various combinations of hydrocarbons cover the surface in the solid phase. One pathway to co-crystallization may be found in Titan's equatorial sand seas. It is also possible for cocrystals to form as Titan's ice clouds. Previous works have identified CIRS spectral ice signatures that result from species condensing simultaneously (cocondensation) (Anderson & Samuelson 2011; Anderson et al. 2016). If C2H2 and C6H6 cocondense as a solid on Titan haze particles (i.e., refractory organics), they may co-crystallize in the stratosphere at ∼130 to 140 K before reaching the dune fields. However, there may be opportunity for a more complex cocrystal composition as the haze particles fall through the atmosphere, allowing accretion of more than just C2H2 and C6H6 onto the haze particles (Anderson et al. 2018). Future VIMS studies may be able to search for clouds composed of C2H2 or C6H6 depending on wavelength, altitude, and whether the feature is transient. Given that the C2H2–C6H6 cocrystal forms relatively quickly (within 5 minutes) and is stable under Titan conditions, it is therefore likely that this cocrystal could contribute to Titan's evaporite deposits (Barnes et al. 2011; MacKenzie et al. 2014; Cordier et al. 2016). For example, a layer of solid C6H6 could rest at the bottom of a CH4-dominated lake with C2H2 dissolved. Over time, this CH4 would evaporate, leaving behind a C2H2-enriched evaporite layer which then interacts with the C6H6 to form the cocrystal.
To estimate the thickness of the acetylene–benzene cocrystal deposit that may have accumulated on Titan's surface over 1 Gyr, we use a net production rate of 1.08 × 10¹⁰ molecules m−2 s−1 for benzene (Cordier et al. 2013; Krasnopolsky 2009; Vuitton et al. 2008), which is the limiting factor when compared with the net production rate of acetylene, 1.06 × 10¹³ molecules m−2 s−1 (Vuitton et al. 2019). This equates to approximately 566 moles of benzene per m2 after 1 Gyr. Dividing by the density of the acetylene–benzene cocrystal, 1.01 g cm−3 (123 K, Boese et al. 2003), and multiplying by the molar masses of acetylene and benzene, gives an approximate thickness of around 5 cm for the acetylene–benzene cocrystal. The net production rates for benzene reported in the literature varies; therefore, we view 5 cm as a rough estimate. Cocrystal formation may also be kinetically hindered due to the relatively low production rates in the atmosphere. Given that Dragonfly's DragonCam camera suite can examine surface materials down to a sand grain scale (Lorenz et al. 2017), we predict that Dragonfly may be able to detect the acetylene–benzene cocrystal considering the distinct morphological appearance of cocrystals formed in our experiments, as well as others (e.g., Cable et al. 2014). Additionally, Dragonfly will also carry a laser-desorption ionization (LDI) mass spectrometer (DraMS) that could provide additional compositional information regarding the presence or absence of cocrystals on the surface of Titan.
5. Summary and Conclusions
In this study, we sought to investigate the interactions of the acetylene–benzene aggregate at Titan-relevant temperatures and pressure (∼89–94 K, 1.5 bar) using IR spectroscopy. For the first time under Titan conditions, we have confirmed the formation and stability of the C2H2–C6H6 cocrystal. The cocrystal formed at 135 K and is stable at Titan surface conditions (89–94 K, 1.5 bar). Identification of the cocrystal using FTIR spectroscopy shows band shifts and new bands that deviate from the individual component molecules, as well as drastic changes in sample morphology.
This high resolution NIR spectra of the C2H2–C6H6 cocrystal expands upon previous studies of the C2H2–C6H6 cocrystal to Titan's conditions. First, our experimental study is distinguished because C6H6 and C2H2 were deposited sequentially. This may represent a situation more applicable to Titan, where molecules like C2H2 and C6H6 could cocondense in the atmosphere and may comprise the lake evaporites. Our results also complement past works regarding cocrystal formation conducted at Titan-relevant temperatures (Cable et al. 2014, 2018, 2019; Vu et al. 2014) and with recent modeling (Ennis et al. 2020). Experimental investigations in Titan-like environments could enhance our knowledge of the complex chemistry that occurs in Titan's atmosphere and give us clues to interactions that may occur at Titan's lake evaporite beds. Infrared characterization of the cocrystal formation process under Titan's conditions will also be important for future surface missions like Dragonfly (Lorenz et al. 2017; Turtle et al. 2018) or other Titan mission concepts to understand the composition of the evaporites. Future experimental investigations on the crystal and chemical structures of the C2H2–C6H6 cocrystal using techniques such as Raman spectroscopy and X-ray powder diffraction would be helpful to further understand this unique mineral on Titan.
The authors graciously acknowledge two anonymous reviewers for their invaluable comments and suggestions, Kendra Farnsworth for assistance with thermocouple temperature calibration measurements, Woodrow Gilbertson for mol fraction calculations, Walter Graupner for support in the lab, and Shannon MacKenzie for insight on VIMS detection limits. This work was funded by the NASA Earth and Space Science Fellowship (NESSF) Grant #80NSSC17K0603.
Appendix: Acetone Component
Here, we provide the full spectral range of pure C2H2 (Figure A1); pure C6H6 (Figure A2); a temperature versus time table (Table A1) for the cocrystal experiment in the main text; the full spectral range of the C2H2-C6H6 cocrystal experiment in the main text (Figures A3 and A4); and band center shifts versus temperature (Figure A5) for the cocrystal experiment in the main text. Spectra from repeat cocrystal experiment 1 (Figures A6 and A7) and repeat cocrystal experiment 2 (Figure A8), as well as optical views from repeat experiment 2 (Figure A9) are also presented.
We have also published the raw FTIR spectra for pure C2H2, C6H6, and cocrystal experiments (including both repeated experiments), as well as a reference spectrum of acetone, which can be found at 10.5281/zenodo.4110814.
It should be noted that the C2H2 cylinder used in these experiments is not pure C2H2; rather, it is C2H2 dissolved in acetone ((CH3)2O) for stabilization purposes. While we do not observe any (CH3)2O bands in our "pure C2H2" experiment (Figure 1) or the experiment presented in the main text (Section 3.3.) due to experimental techniques using the cold trap method, it is possible that trace amounts of (CH3)2O were incorporated into one of the repeat experiments. The pure (CH3)2O spectrum is characterized by a sharp doublet centered at 1.677 and 1.694 μm, as well as a broad doublet at 1.732 and 1.780 μm (Figure A10). Singh et al. (2016a) also reports an acetone spectrum with matching bands. These four vibrational modes are observed in our spectra, however, they are shifted from 0.001–0.004 μm when compared with pure (CH3)2O (Figure A10).

Figure A1. Full spectral range from C2H2 experiment presented in this paper .
Download figure:
Standard image High-resolution image
Figure A2. Full spectral range from C6H6 experiment presented in this paper .
Download figure:
Standard image High-resolution image
Figure A3. Full spectral range from C2H2–C6H6 experiment presented in this paper .
Download figure:
Standard image High-resolution image
Figure A4. Full range spectra from C2H2–C6H6 experiment presented in this paper showing cocrystal formation initiates around 135 K (red spectrum), as this is the first appearance of one of the new bands at 1.569 μm.
Download figure:
Standard image High-resolution image
Figure A5. Band center shifts vs. temperature for the C2H2–C6H6 experiment presented in this paper.
Download figure:
Standard image High-resolution image
Figure A6. NIR reflectance spectra from repeat experiment 1 of C2H2–C6H6 (1.5 to 1.85 μm). Spectra are shown in order of increasing time from top to bottom. Cocrystal formation initiated between 136 K and 128 K.
Download figure:
Standard image High-resolution image
Figure A7. NIR reflectance spectra from repeat experiment 1 of C2H2–C6H6 (1.85 to 2.22 μm). Spectra are shown in order of increasing time from top to bottom. Cocrystal formation initiated between 136 K and 128 K.
Download figure:
Standard image High-resolution image
Figure A8. (a) NIR reflectance spectra from repeat experiment 2 of C2H2–C6H6 mixture after both compounds have been deposited. Benzene was deposited from 214 to 176 K (not shown), then acetylene was deposited from 170 to 167 K. The sample was cooled to 94 K, warmed to 136 K (red spectrum), then cooled back down to 93 K. Bands located at 1.585 to 1.780 μm, as well as 1.943 to 2.122 μm are not observed in either of the single component spectra of C2H2 or C6H6. Notice the small band at 1.551 μm in the 136 K spectrum (denoted by arrow). (b), (c) Zoomed comparison among the C2H2–C6H6 mixture (black), C2H2 (dark gray), and C6H6 (light gray) showing new bands from 1.585 to 1.780 μm, as well as 1.943 to 2.122 μm (c).
Download figure:
Standard image High-resolution image
Figure A9. Top-down view of C2H2–C6H6 mixture from repeat experiment 2 in sample dish showing two different optical camera views: (a) and (b) being one, and (c) and (d) being the other. Panels (a) and (c) were taken at t = 138 and t = 139 minutes at 185 K and 184 K, respectively, before C2H2 was added to the dish. Panels (b) and (d) were taken at t = 257 minutes at 112 K, after C2H2 was added to the C6H6 on the dish. Notice the difference in sample appearance and morphology structure from (a) to (b) and from (c) to (d). The progressed sample has a more complex structure and appears to have increased in reflectance. The white color of the sample is due to the Spectralon® IR reflectance material upon which the sample is deposited.
Download figure:
Standard image High-resolution image
Figure A10. Spectrum of acetone (CH3)2O taken at room temperature and pressure.
Download figure:
Standard image High-resolution image
Table A1. Temperature and Time Elapsed Since First Spectrum was Recorded in the C2H2–C6H6 Experiment Presented in this Paper.
| Time Since First Spectrum (min) | Temperature (K) |
|---|---|
| 0 | 144 |
| 6 | 135 |
| 13 | 123 |
| 20 | 108 |
| 26 | 100 |
| 32 | 94 |
| 44 | 106 |
| 57 | 122 |
| 82 | 173 |
| 88 | 151 |
| 95 | 146 |
| 105 | 152 |
| 112 | 158 |
| 129 | 173 |
| 136 | 140 |
| 145 | 109 |
| 168 | 93 |
Download table as: ASCIITypeset image