


Abstract
Convergent evolution is a major topic in evolutionary biology. Low bone cortical compactness (CC, a measure of porosity of cortical bone) in the extant genera of “tree sloths,” has been linked to their convergent slow arboreal ecology. This proposed relationship of low CC with a slow arboreal lifestyle suggests potential convergent evolution of this trait in other slow arboreal mammals. Femoral and humeral CC were analyzed in “tree sloths,” lorisids, koala, and extinct palaeopropithecids and Megaladapis, in comparison to closely related but ecologically distinct taxa, in a phylogenetic framework. Low CC in “tree sloths” is unparalleled by any analyzed clade and the high CC in extinct sloths suggests the recent convergence of low CC in “tree sloths.” A tendency for low CC was found in Palaeopropithecus and Megaladapis. However, lorisids and the koala yielded unexpected CC patterns, preventing the recognition of a straightforward convergence of low CC in slow arboreal mammals. This study uncovers a complex relationship between CC and convergent evolution of slow arboreality, highlighting the multifactorial specificity of bone microstructure.
From an ecomorphological perspective, adaptively convergent morphotypes are expected in phylogenetically distant groups occupying similar niches (Wainwright and Reilly 1994; Muschick et al. 2012). Defined as independently evolved similarity (Stayton 2015), convergence requires the recognition of similar traits in distantly related clades with convergent ecology departing from closely related but ecologically distinct taxa. Mammals are a suitable case to study morphological convergent evolution, since their wide ecological diversity has proven useful for identifying outstanding cases of convergence (McGhee 2011).
Bone microstructure (repartition of bone tissue within a skeletal element) has been demonstrated to reflect life history, physiology, phylogeny, ontogenetic growth, locomotion, and lifestyle in tetrapods (Padian 2011; Ricqlès 2011; Mitchell 2016). Analyzing the shaft of long bones’ (diaphysis) microstructure has successfully been employed to infer paleobiological and ecological aspects of extinct tetrapods (e.g., Germain and Laurin 2005; Arcucci et al. 2019; Bazzana et al. 2020; Chinsamy et al. 2020). Mammals with different lifestyles can be discriminated analyzing microstructural parameters such as bone compactness (e.g. Wall 1983; Fish and Stein 1991). The porosity of cortical bone, or cortical compactness (CC), was quantified in adult extant and extinct xenarthrans’ humeral diaphysis. The two lineages of extant sloths (Choloepus and Bradypus), characterized by a slow arboreal lifestyle (Nyakatura 2012), feature lower CC compared to other similar-sized taxa that conversely follow the generalized mammalian condition of high CC (Montañez-Rivera et al. 2018). Because “tree sloths” are not monophyletic (hence the quotation marks employed herein), this trait was added to the convergent traits related to their independently acquired slow arboreal lifestyle (Nyakatura 2012; Montañez-Rivera et al. 2018). Low CC being observed in other postcranial elements (Montañez-Rivera et al. 2018), a systemic explanation, intrinsically linked to their slow arboreality (i.e., low metabolic rate of “tree sloths”; Pauli et al. 2016; Vendl et al. 2016) was proposed (Montañez-Rivera et al. 2018). Moreover, “tree sloths” distinctive suspensory and vertical climbing was hypothesized as responsible for low CC (Montañez-Rivera et al. 2018). If adaptively driven by slow arboreality and this lifestyle's locomotor and/or physiological features, a low CC can be expected to have converged in other mammals featuring similar ecology.
In addition to “tree sloths,” we analyzed the koala (Phascolarctos cinereus, Marsupialia), “Lorisidae” (arguably representing a paraphyletic group of primates, see Methods), and subfossil Palaeopropithecidae and Megaladapis (Godfrey et al. 2006, Godfrey et al. 2016), with the latter three members of the primate clade Strepshirrhini. Altogether they share suspensory/vertical climbing and low metabolic rates (references in Table 1) and are “slow arboreal.” To provide evidence for convergent evolution, these taxa should share low CC since they independently acquired similar ecological, physiological, and locomotor traits. Conversely, higher CC is expected in close relatives not sharing the slow arboreal features. Thus, beside slow arboreal mammals introduced above, also an ecologically heterogeneous but phylogenetically close sample (“non-slow arboreal”) was studied (Table 1). Noticeably, it includes specimens of extinct sloths from the Patagonian Early Miocene (White 1993; Toledo 2016)
Studied clades with sample sizes (n), cortical compactness (CC) mean values and range of variability, locomotion, and metabolism. All slow arboreal taxa (bold font) share slow suspensory/vertical climbing behavior and low metabolism. Hapalops, Eucholoeops, Prepotherium, Nematherium, and Analcitherium overall made up the “Extinct sloths” group
| Taxon | Humeral n | Femoral n | Mean Humeral CC (%) | Mean Femoral CC (%) | Humeral CC Range (%) | Femoral CC Range (%) | Locomotion (References) | Metabolism (References) |
|---|---|---|---|---|---|---|---|---|
| "/>Xenarthra | ||||||||
| Bradypus sp. | 5 | 5 | 98.36 | 98.39 | 1.70 | 1.15 | Slow arboreal suspensory (Nyakatura 2012) | Low compared to Xenartha (Pauli et al. 2016,; Vendl et al. 2016) |
| Choloepus sp. | 5 | 6 | 97.71 | 97.69 | 2.99 | 2.48 | Slow arboreal suspensory (Nyakatura 2012) | Low compared to Xenarthra (Pauli et al. 2016,; Vendl et al. 2016) |
| Hapalops sp. | 5 | 4 | 99.77 | 99.90 | 0.64 | 0.28 | Semi-arboreal (Toledo 2016) | |
| Eucholoeops sp. | 2 | 2 | 99.90 | 99.92 | 0.04 | 0.04 | Semi-arboreal (Toledo 2016) | |
| Prepotherium sp | 1 | 1 | 99.79 | 99.98 | Terrestrial. Facultative arboreal (Toledo 2016) | |||
| Nematherium sp | 1 | 99.75 | Semi-arboreal. Some digging (Toledo 2016) | |||||
| Analcitherium sp | 1 | 99.92 | Semi-arboreal. Some digging (Toledo 2016) | |||||
| Vermilingua | 14 | 14 | 99.65 | 99.62 | 0.96 | 1.05 | Semi-arboreal (Young et al. 2003; Orr 2005) | In the range of Xenarthra (Vendl et al. 2016) |
| Cingulata | 11 | 12 | 99.84 | 99.84 | 0.29 | 0.27 | Fossorial (Vizcaíno and Milne 2002; Attias et al. 2016) | In the range of Xenarthra (Vendl et al. 2016) |
| "/>Strepsirrhini | ||||||||
| “Lorisidae” | 11 | 11 | 99.70 | 99.81 | 0.83 | 0.42 | Slow arboreal suspensory (Jouffroy and Petter 1990) | Low compared to Strepsirrhini 1988 |
| Galagidae | 9 | 9 | 99.83 | 99.84 | 0.55 | 0.30 | Leaping (Walker 1979) | In the range of Strepsirrhini (Warshaw 2007; Harcourt 2008) |
| Palaeopropithecidae | 5 | 7 | 99.29 | 99.23 | 1.32 | 1.67 | Slow arboreal suspensory (Godfrey et al. 2016) | Inferred as low (Godfrey et al. 2004, Godfrey et al. 2006, Godfrey et al. 2016) |
| “Indriidae” | 11 | 11 | 99.88 | 99.95 | 0.45 | 0.18 | Leaping (Napier and Walker 1967) | In the range of Strepsirrhini (Warshaw 2007; Harcourt 2008) |
| Megaladapis | 4 | 3 | 99.13 | 98.74 | 1.72 | 1.63 | Slow vertical climbing (Godfrey et al. 2016) | Inferred as low (Godfrey et al. 2004, Godfrey et al. 2006, Godfrey et al. 2016) |
| Lemuridae | 10 | 10 | 99.89 | 99.90 | 0.54 | 0.37 | Active arboreal quadrupedalism (Fleagle 2013). Some terrestrial in Lemur catta (Hill 1953) | In the range of Strepsirrhini (Warshaw 2007; Harcourt 2008) |
| "/>Marsupialia | ||||||||
| Phascolarctos cinereus | 6 | 6 | 99.50 | 99.04 | 0.84 | 3.17 | Slow vertical climbing (Grand and Barboza 2001) | Low compared to Marsupialia (Tyndale-Biscoe 2005) |
| Vombatidae | 5 | 5 | 99.68 | 98.82 | 0.34 | 0.59 | Fossorial (Tyndale-Biscoe 2005) | Low compared to Marsupialia (Tyndale-Biscoe 2005) |
Despite the outlined potential for our understanding of convergent evolution, no comparative CC analysis was performed in a wide mammalian sample, representing slow arboreal clades and close relatives with diverging lifestyles, yet. As they are often employed in microstructural analyses (e.g., Laurin 2004; Straehl et al. 2013), we investigated CC in the humerus and the femur. Phylogenetically informed analyses enabled us to identify convergence of CC to slow arboreality and to discuss physiological and locomotor aspects. We expected to find the convergent slow arboreal groups consistently showing lower CC in respect to close relatives.
Methods
SAMPLED COLLECTIONS
One hundred six humeri and 106 femora representing 47 taxa were sampled in ten mammal collections: Museum für Naturkunde, Berlin, Staatliches Museum für Naturkunde, Stuttgart, Zoologisches Forschungsmuseum Alexander Koenig, Bonn, Zoologische Staatssammlung, Munich, all in Germany; Naturhistorisches Museum, Wien, Austria; Muséum national d'Histoire naturelle, Paris, France; American Museum of Natural History, New York, NY, Field Museum of Natural History, Chicago, IL, Yale Peabody Museum of Natural History, New Haven, CT, and Division of Fossil Primates, Duke Lemur Center, Durham, NC, all in the USA. Only non-pathological, non-captive, and adult individuals were included. Adulthood was established assessing the degree of epiphyseal fusion and by bone size for marsupials, given their incomplete epiphyseal fusion through adulthood (Werning 2013a).
DATA ACQUISITION
Bones were scanned using micro-focus computed tomography (μCT) (Phoenix | X-ray Nanotom, GE Sensing and Inspection Technologies GmbH; XYLON FF35-CT-System, YXLON GmbH; Microtomograph RX EasyTom 150; Nikon XTH 225 ST; GE v|tome|x). CC was acquired at mid-diaphysis (suggested as the most informative area of mammalian limb long bones, Laurin 2004), focusing CT scan acquisition on this region and reaching the lowest possible voxel size. The mid-shaft was defined as 50% of the whole bone length (Fig. 1). Image stacks (16-bit tifs) were acquired and the 50% slice was taken, data acquisition on a single mid-diaphyseal slice being a common practice in studies relating lifestyle to microstructure (e.g., Laurin et al. 2004; Germain and Laurin 2005; Kriloff et al. 2008; Canoville and Laurin 2010).
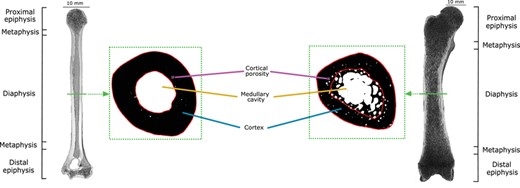
Coronal sections of the humerus of Nycticebus coucang ZMB Mam 84333 (left) and the femur of Bradypus sp. ZMB Mam 33806 (right). A 2D μCT slice was extracted from the mid-shaft of each bone as shown by the green section line. The dotted green rectangles surround the binarised images of the corresponding slices. Cortical compactness (CC) was measured in a cortical region of interest (ROI) shown here as the area circumscribed by the red lines.
DATA PROCESSING
Mid-shaft cross-sections were imported into Fiji (Schneider et al. 2012) and automatically binarized (“Optimize Threshold” function, BoneJ plugin, Doube et al. 2010). Manual thresholding correction was necessary for one humerus and one femur of Palaeopropithecus, due to the presence of dense, non-osseous material identifiable before binarisation. The corresponding area was selected (“Threshold” and “Create Selection” Fiji functions) and deleted (i.e., grey values set to 0), before running “Optimize Threshold.” Post-binarization corrections were performed for about 15% and 25% of the humeri and femora, respectively (Tables S1-S2). CT scan noise, recognized as “bone” by the thresholding within single vacuities (Figure S4) and/or around the periosteal region (Figure S5), was manually deleted after having confirmed its nature by observing images before thresholding and regions contiguous to the mid-shaft.
QUANTIFICATION OF THE CORTICAL COMPACTNESS (CC)
Following Montañez-Rivera et al. (2018), a region of interest (ROI) was selected on each cross section, including cortices and excluding spongiosa and medullary cavity (“Wand (tracing)” Fiji tool; Fig. 1). In about 65% of the humeri and 60% of the femora, the cortex-spongiosa transition was not abrupt (Tables S1 and S2), which required a manual selection (Montañez-Rivera et al. 2018). The transition was located connecting the most external holes considered belonging to the medullary cavity (“Polygon selection” Fiji tool). Bony processes at the mid-shaft level, found in about 35% and 30% of the sampled humeri and femora, respectively (Tables S1 and S2), were excluded by identifying the level of first cortical thinning and spongious bone appearance and using straight lines, perpendicular to the outer cortical surface. Cracks within the cortex were excluded from ROIs. In Figure S1, ROI selection criteria are demonstrated. The intrinsic subjectivity of cortex-spongiosa interface identification can be considered as a methodological limitation of this work. Thus, the interface drawing protocol (Fig. S1) is intended to limit subjectivity, since the gradual spongiosa-cortex transition in 2D sections (without recognizable patterns of vacuity size, shape, and location; Fig. S2 and S3) prevents any automatic recognition. For each ROI, the percentage of bone pixels relative to total area (ratio representing the cortical compactness, CC) and the cortical area (CA, taken as body mass proxy, reliably predicting body size, Ruff 2003) were computed (respectively “Area Fraction” and “Area” routines, “Measure” function of Fiji). Cross-sections with ROIs are shown in Figures S2 and S3. Raw CC and CA values are listed in Tables S1 and S2.
RESOLUTION DEPENDENCY OF CORTICAL COMPACTNESS
μCT stacks were acquired with resolution ranging from 0.0045 to 0.0662 mm (Table S1 and S2). CC depends on resolution, as this determines the size of the captured vacuities. Scanning at higher resolutions (i.e., more precise) is necessary to capture osteocyte lacunae, because their absolute length does not exceed about 0.02 mm in mammals (Huttenlocker and Farmer 2017). Since higher resolutions are reachable for smaller bones, biased lower CC in smaller animals, because of lacunae, could occur. A similar bias (but not resolution-related) is expectable in small mammals, as they exhibit more osteocytes and lacunae (Mullender et al. 1996). However, such biases apparently do not affect our results. As body mass (closely related to size and thus affecting resolution) is not significantly related to CC (see below), negligible effects are suggested. Moreover, smaller species exhibit high CC and no CC-resolution relationship is evident (Appendix S1, Plot S1). Thus, osteocyte lacunae are excluded in the entire resolution range. Likewise, canaliculi (diameter of about 0.001 mm), Haversian canals, and Volkmann's canals are not recognized. In this work, CC only reflects resorption cavities and larger vascular canals.
TIME-TREE FOR PHYLOGENETIC COMPARATIVE METHODS
To account for statistical non-independence due to phylogenetic relationships, a time-tree of the studied species was used to phylogenetically inform the statistical analysis (Fig. 2). We used a Maximum Clade Credibility (MCC) DNA-only node-dated mammals phylogeny taken from the related posterior distribution of the work of Upham et al. (2019) and representing 4098 species. This phylogeny allows to avoid polytomies (Upham et al. 2019). Several adjustments to fit our sample were performed in Mesquite (Maddison and Maddison 2019) and detailed in Appendix S1. The tree used here involves the paraphyly of “Lorisidae” (see Yoder et al. 2001; Poux and Douzery 2004).
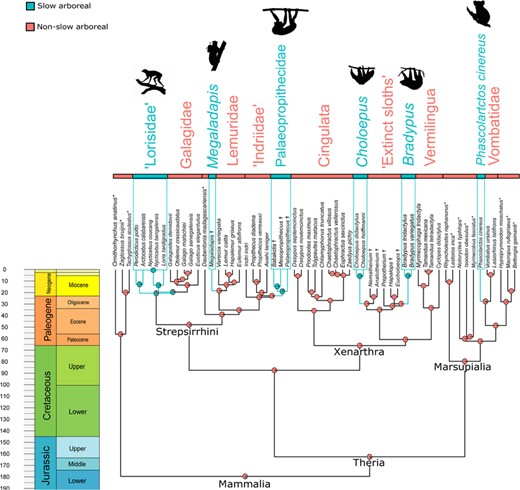
Time-calibrated tree of mammalian taxa here analyzed. Six convergent acquisitions of ‘slow arboreal’ adaptations (light blue branches and rectangles) were reconstructed with Stochastic Character Mapping (Bollback 2006). Species not sampled for the cortical compactness analysis and extinct taxa are indicated with * and ✝, respectively. Figure built with the “geoscalePhylo” function (“strap” R package, Bell and Lloyd 2015).
ANCESTRAL LIFESTYLE RECONSTRUCTION
All statistical analyses were performed in R 3.6.3 (R Core Team 2020). Independent acquisitions of slow arboreal lifestyle were reconstructed with Stochastic Character Mapping (SCM; Bollback 2006). SCM was performed on the sampled taxa and twelve additional species, included to have a wider representation of mammalian lifestyles (three Monotremata, eight Marsupialia and Daubentonia madagascariensis; Fig. 2). We assigned a binary slow arboreal/non-slow arboreal state to each terminal taxon. Slow arboreality being a highly derived lifestyle, it can be assumed that an evolutionary reversal from such ecology is less frequent than its acquisition. Thus, we tested three models: Equal Rates (ER), Unequal Rates_1 and Unequal Rates_2 (UNR_1 and UNR_2, reversion rate from slow arboreality half and one-third of acquisition rate, respectively). Since ER provides the best fit (ΔAICc_UNR_1 = 57.42; ΔAICc_UNR_2 = 80.16, Appendix S1), we used it for SCM (‘make.simmap’ function, ER, 1000 simulations, ‘phytools’ package; Revell 2012).
RELATIONSHIP BETWEEN CORTICAL COMPACTNESS (CC) AND LIFESTYLE
The relationship between humeral/femoral CC and lifestyle (binary categorical variable: non-slow arboreal or slow arboreal) was tested through Phylogenetic Generalized Least Square (PGLS) regressions. For both the bones we performed a phylogenetic ANCOVA, controlling body mass effects adding CA as covariate (“gls” function; method “ML,” “nlme” R package; Pinheiro et al. 2020). We used mean species CC and CA values, both log-transformed. Individuals of extant species cataloged only at the generic level were here excluded and the regressions were phylogenetically informed using Pagel's lambda (“corPagel” function, “ape” R package, Paradis et al. 2004). No significant relationship was found between CC and body mass (p-valuehumerus = 0.45 and p-valuefemur = 0.37). Humeral and femoral CC were visualized through boxplots (“ggplot” function,” “ggplot2” R package; Wickham 2016) and mean CC values mapped on the phylogeny (“contMap” function, “phytools” R package; Revell 2012) (Fig. 3).
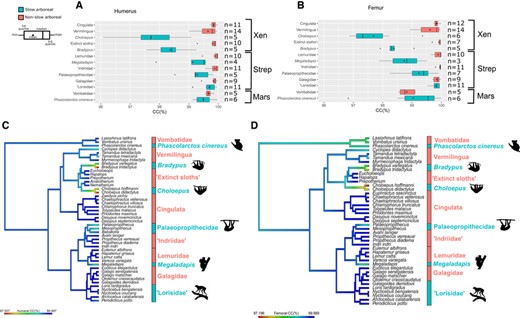
Box-and-whisker plots of humeral (A) and femoral (B) cortical compactness (CC) in each slow arboreal clade as well as their non-slow arboreal close relatives. Phylogenetic maps of the humeral (C) and femoral (D) CC averaged for each group. Abbreviations: Xen, Xenarthra; Strep, Strepsirrhini; Mars, Marsupialia.
Raw data, time tree, R code, and supplementary material are available on Figshare Digital Repository (Alfieri et al. 2020; https://doi.org/10.6084/m9.figshare.12896249.v8).
Results
SCM revealed a high probability of convergent acquisition of slow arboreality in “Lorisidae,” Megaladapis, Palaeopropithecidae, Choloepus, Bradypus, and P. cinereus, referred to as slow arboreal clades hereafter. Since the paraphyly for “Lorisidae” results in Nycticebus and Loris being more closely related to Galagidae than to Arctocebus and Perodicticus, a result of SCM is the ancestral slow arboreal condition for Lorisiformes (“Lorisidae” + Galagidae) with a subsequent reversal to active leaping in Galagidae (Fig. 2).
Humeral and femoral CC are significantly correlated with lifestyle (p-values< 0.001). However, not all slow arboreal clades contribute to the difference and residuals of regressions of humeral and femoral data significantly deviate from normality (Shapiro-Wilk test, p-values < 0.001). Summary results for SCM and PGLSs are reported in Appendix S1.
“Tree sloths,” Palaeopropithecidae and Megaladapis show lower and highly variable humeral and femoral CC, whereas closely related taxa mirror the generalized mammalian condition (Fig. 3A and B). Although evolutionary patterns are revealed (Fig. 3C, D), some of the observed differences in mean CC were <1% (Table 1), due to the small size of vacuities (Fig. S2 and S3). Within Palaeopropithecidae, lower CC is clear in Palaeopropithecus, whereas Babakotia yielded higher CC values (data only for the humerus, 99.65%) and Mesopropithecus shows the humeral pattern (lower CC, 99.2%) contrasting the femoral (higher CC, 99.77%; Fig. 3A, B). With the lowest CC in the whole sample, “tree sloths” exhibit relatively the most extensive and spatially widespread porosity (Fig. S2 and S3). Within xenarthrans, Vermilingua also shows a relatively wide range of CC variation (Table 1), mainly due to low values of Cyclopes didactylus (four individuals with means of CChumerus = 99.3% and CCfemur = 99.2%) and Tamandua mexicana (one individual with CChumerus of 99.11% and CCfemur of 98.95%). Although the cortical vacuities of Cy. didactylus are widespread and reminiscent of “tree sloths,” the porosity of T. mexicana is mainly concentrated toward the medullary cavity, with few vacuities in the outer regions (Fig. S2 and S3).
As for cortical vacuities repartition in subfossil lemurs, although in one femur of Megaladapis it is reminiscent of ‘tree sloths’ (Figure S3), most of the other specimens show a concentration toward the medullary cavity. “Lorisidae” and koala do not evidently differ from closely related non-slow arboreal taxa in mean humeral and femoral CC. In CC variability, “Lorisidae”; mirror their near relatives. An interlimb discrepancy is observed in marsupials, with humeral mean CC higher than the femoral one (Fig. 3). Moreover, the koala shows highly variable CC, especially in the femur (Table 1, Fig. 3A and B). Koala specimens with lower CC show a preferential distribution of the porosity toward the endosteal margin. Conversely, in particularly porous specimens of wombats, vacuities are widespread in the whole cortex (Fig. S2 and S3).
Discussion
CONVERGENT EVOLUTION OF LOW CC IN MAMMALS
Although it is recognized as a ubiquitous process (Conway Morris 2010; McGhee 2011; Parfrey and Lahr 2013), convergence can follow diverse patterns of acquisition associated with each evolutionary innovation (Conway Morris 2010). Hence, the close examination and novel recognition of convergent evolution events enable to clarify modes through which convergence acts, contributing to a general description of this phenomenon. This work adds evidence to understand how bone microstructure may converge in light of functional demands. Analyzing a heterogeneous sample of mammals in a phylogenetic framework, the investigation covers ca. 90 million years of mammalian evolution. According to a central tenet of convergent evolution, the higher the selective pressure is in distantly related ecologically convergent clades, the more similar these groups will be (Conway Morris 2010). Slow arboreality is a highly derived ecology, with specific adaptations. Thus, since previously found in “tree sloths” possibly because of their slow arboreal ecology (Montañez-Rivera et al. 2018), low CC was expected in clades independently acquiring this lifestyle.
Humeral and femoral CC in “tree sloths” was confirmed to be low when compared to other xenarthrans (mirroring the results of Montañez-Rivera et al. 2018) and other more distantly related mammals. Based on a limited sample, Montañez-Rivera et al. (2018) tentatively suggested that the condition of 'extinct sloths' was more reminiscent of that of the general mammalian condition. The larger sample used here allows to substantiate this conclusion. Since high CC is here found in all 'extinct sloths', the low CC in “extant sloths” appears to be part of the set of features the extant sloth genera Bradypus and Choloepus convergently acquired (Nyakatura 2012). While the extinct sloths sampled here belong to three families (Varela et al. 2019), they come from one locality (Patagonian Early Miocene Santa Cruz Formation, 17.5–16.3 million years ago; Bargo et al. 2012; Perkins et al. 2012). Considering the taxonomical and ecological diversity of extinct sloths (Pujos et al. 2017), studying taxa from other ages and geographical contexts may elucidate the pattern of evolution of CC in the clade.
Low CC convergently evolved in the silky anteater (Cy. didactylus), Megaladapis, and palaeopropithecids (mainly Palaeopropithecus), with wide CC variability in the latter two. Slow arboreality was observed in Cy. didactylus (van Tyne 1929; Hayssen et al. 2012; Nagy and Montgomery 2012) and inferred in palaeopropithecids and Megaladapis (Godfrey et al. 2006, Godfrey et al. 2016; Walker et al. 2008; Marchi et al. 2016). For the latter two and Cy. didactylus, postcranial morphological convergences to “tree sloths” are documented (Godfrey et al. 2016; Lewton and Dingwall 2016; Marchi et al. 2016). Distinctly lower CC seems to have been convergently evolved in Bradypus, Choloepus, Cy. didactylus, Palaeopropithecus, and Megaladapis, driven by their slow arboreality.
POTENTIAL DRIVERS OF LOW CC IN MAMMALS
Montañez-Rivera et al. (2018) related “tree sloths” low CC to bone remodeling, through which osteoclasts form resorption cavities and osteoblasts depose secondary bone (Francillon-Vieillot et al. 1990; Barak 2020). Vacuities on μCT slices were paralleled to resorption cavities at various maturation stages on histological sections (Straehl et al. 2013; Montañez-Rivera et al. 2018). “Tree sloths” contrast general terrestrial mammals in which the diaphyseal cortex shifts from low CC in remodeled juvenile structures, to high CC with few resorption cavities and lower remodeling in adults (Francillon-Vieillot et al. 1990). Low CC in adult “tree sloths” suggests intense remodeling still active through adulthood (Montañez-Rivera et al. 2018). Long bone osteo-histological sections of Cy. didactylus, palaeopropithecids, and Megaladapis are not available to date. However, the distribution of vacuities of Cy. didactylus and some specimens of subfossil lemurs are reminiscent of “tree sloths” and the secondary osteons pattern of closest relatives (Warshaw 2007), respectively (Fig. S2 and S3). Thus, the porosity and low CC in Cy. didactylus and subfossil lemurs may also reflect bone remodeling.
Bone remodeling depends on metabolic rates (de Paula and Rosen 2013) and low CC was detected in other “tree sloths” postcranial elements (Montañez-Rivera et al. 2018). Thus, systemic factors, as low metabolism (Pauli et al. 2016; Vendl et al. 2016), were hypothesized to be responsible for extensive remodeling, yielding low CC (Montañez-Rivera et al. 2018). However, this relationship appears counterintuitive, whether bone remodeling is targeted or nontargeted. Targeted remodeling occurs when external loadings cause localized microcracks (Burr 2002). It should inversely relate to metabolism, since the latter is generally higher in more ecologically active species, where bones are subject to higher relative loadings (Mitchell 2016). Non-targeted remodeling, being related to mineral homeostasis (Jowsey 1960) and highly energetically demanding (de Paula and Rosen 2013), is expected to be lower in hypometabolic taxa (Mitchell 2016). Nevertheless, Montañez-Rivera et al. (2018) suggested that heavily remodeled bone in “tree sloths” (Straehl et al. 2013) may be driven by low thyroid activity (reported for Choloepus; Lemaire et al. 1969). Thyroid hormones regulate metabolism (Brent 2012) and bone growth (Gorka et al. 2013) regulation. Thyroidal abnormal functioning may affect bone remodeling, skewing it toward resorption (Gorka et al. 2013). Thus, low thyroid activity in “tree sloths” may allow the maintenance of perennial intense bone remodeling (Montañez-Rivera et al. 2018).
Low metabolism was reported for Cy. didactylus (Nagy and Montgomery 2012) and inferred for palaeopropithecids and Megaladapis (Godfrey et al. 2004, Godfrey et al. 2006, Godfrey et al. 2016). Hence, it potentially plays a role, among the adaptations of slow arboreality. To elucidate the counterintuitive relationship between low metabolism and intense bone remodeling, evidence of low thyroid activity would be needed from silky anteater and extinct subfossil lemurs (obviously unavailable for the latter). Experimental studies, may ultimately clarify the network between thyroidal activity, intense bone remodeling, and low CC. An alternative explanation for the convergent low CC in ‘tree sloths’, Cy. didactylus and subfossil lemurs involving low metabolism can be proposed. Bone resorption is faster than its deposition (1-2 weeks vs. up to several months; Currey 2002). Slow arboreal/hypometabolic mammals with low CC, may be at the upper end of the range between bone resorption and deposition speed. CC would be lowered without an actual increase in bone remodeling rate, but due to resorption cavities being filled very slowly, because of the delayed activity of osteoblasts.
The slow arboreal taxa found with convergent low CC are suspensory (Bradypus, Choloepus, Cy. didactylus and palaeopropithecids, Nyakatura 2012; Granatosky et al. 2014; Marchi et al. 2016) and vertical climbers (Megaladapis, Godfrey et al. 2016). Targeted remodeling relates to microdamage due to external loadings. Humeral and femoral locomotor loads could have triggered different remodeling patterns, lowering CC in slow suspensory/vertical climbers. Humerus and femur being curved bones subject to bending loads, they experience tensile and compressive loadings. Tensile loads are prevalent in suspensory (Nyakatura and Andrada 2013; Granatosky and Schmitt 2017, 2019) and vertical climbers (Hanna et al. 2017). In cortical bone mainly loaded in tension, resorption cavities are larger (Skedros et al. 1994; Nguyen and Barak 2020). Hence, highly tensile loadings in slow arboreal mammals could cause larger resorption cavities and lower CC. However, “tree sloths” osteon area is not significantly larger than expected for their body size (Felder et al. 2017). Similarly, cortical vacuities we observed in other clades are not noticeably larger. Tensile loads also increase compliance, with consequently less energy necessary to start a microcrack (Skedros et al. 1994, Skedros et al. 2004; Reilly and Currey 1999). Higher microdamage would increase targeted bone remodeling, bringing to low CC. While low CC in “tree sloths” was observed in non-appendicular postcranium (Montañez-Rivera et al. 2018), systemic processes can be initiated by various elements (Lieberman 1996; Amson et al. 2018). Quantifying CC in other bones of subfossil lemurs and silky anteaters could clarify the involvement of systemic processes.
UNEXPECTED PATTERNS
Some results remain difficult to explain by the proposed hypotheses. CC in Tamandua mexicana is lower than in Tamandua tetradactyla, despite no major adaptive differences between the two (non-slow) semiarboreal species being reported (Hayssen 2011; Navarrete and Ortega 2011). Moreover, only Palaeopropithecus coherently shows low CC within palaeopropithecids. Babakotia and Mesopropithecus yielded higher CC and/or contrasting interlimb patterns. However, Palaeopropithecus is the most represented palaeopropithecid (with few and poorly preserved specimens for the other two genera) and a single individual of T. mexicana was sampled. Thus, the possibility of biases related to small sample size and specimens’ preservation should be considered.
“Lorisidae” and the koala do not differ in mean CC from their sister clades, Galagidae and wombats. “Lorisidae” and koala are suspensory and vertical climbers, respectively (Jouffroy and Petter 1990; Grand and Barboza 2001), hypometabolic (Rasmussen and Izard 1988; Tyndale-Biscoe 2005) and with reported hypothyroidism (Cowgill and Zeman 1980; Lawson et al. 1996). Despite these and other convergences with “tree sloths” (Grand and Barboza 2001; Amson and Nyakatura 2018), they yielded unexpected CC patterns. Although not detected here (where they follow the general mammalian condition), “Lorisidae” showed distinctive intracortical remodeling patterns on thin-sections ascribed to locomotor loadings (Warshaw 2007). Koala and wombats exhibit humeral CC higher than femoral CC but their CC patterns are probably due to different factors. Although secondary osteons are almost absent from the koala's cortex (Werning 2013b) contrasting slow arboreals, wombats show a highly remodeled cortex (Werning 2013b; Walker et al. 2020). The CC variability of the koala (the widest in the sample) is possibly relatable to a highly variable extension of the primary vascularization, since large vascular canals were observed, especially in the endosteal region (Werning 2013b). The CC pattern in the koala apparently reflects other factors than metabolism or locomotion. Conversely, in wombats, we could find both physiological and mechanical aspects. Being known for energy conserving adaptations to burrowing (Barboza 1993), we ascribe their vacuities to resorption stimulated by low metabolism. Wombats’ humeral microstructure may be explained by physiological and biomechanical adaptations to fossoriality (Walker et al. 2020). To explain their higher humeral CC (vs. femoral CC), metabolic effects could systemically lower CC while biomechanical demands for high CC (due to digging), could locally affect the forelimb.
Conclusions
A previously understudied ecologically driven morphological convergence is here highlighted. Low humeral and femoral CC characterizes slow arboreal mammals, namely Palaeopropithecus, Megaladapis, the silky anteater, and the two genera of extant sloths, Bradypus and Choloepus. A recent event of low CC convergent acquisition in extant sloths is suggested by high CC found in extinct sloths here analyzed. Drivers previously hypothesized for convergent low CC in extant sloths, potentially also apply for the newly identified events of convergence. Low metabolism and suspensory/vertical climbing behavior, intrinsically linked to slow arboreality, may be responsible for low CC. This study provides new evidence of how similarly derived ecologies drive morphological traits to convergent states in distantly related taxa. However, the absence of a clear overall pattern in all analyzed clades points to complex interactions, which potentially prevented convergent evolution. Further analyses could be able to explain why “lorisids” and the koala, featuring the same physiological and locomotor adaptations of other slow arboreal mammals, do not exhibit the same pattern of low CC. This emphasizes the need for an integrative understanding of instances of convergent evolution.
ACKNOWLEDGMENTS
We would like to thank curators and assistant curators who allowed visits to collections and specimens access: Frieder Mayer, Christiane Funk and Anna Rosemann (ZMB), Eva Bärmann (ZFMK), Frank Zachos and Alexander Bibl (NMW), Stefan Merker (SMNS), Anneke van Heteren (ZSM), Guillaume Billet (MNHN), Neil Duncan (AMNH), Sara Ketelsen (AMNH), Vanessa Rhue (YPM-PU), Daniel Brinkman (YPM-PU), Adam Ferguson (FMNH), William Simpson (FMNH), Matt Borths (DPC), and Catherine Riddle (DPC). Moreover, we acknowledge Kristin Mahlow and Martin Kirchner (Museum für Naturkunde, Berlin), Renaud Lebrun (MRI-ISEM, Montpellier), Justin Gladman (SMIF, Durham, NC, USA), April Isch Neander and Zhe-Xi Luo (University of Chicago, IL, USA) for allowing access to Micro-CT scanners, providing precious assistance. We acknowledge the MRI platform member of the national infrastructure France-BioImaging supported by the French National Research Agency (ANR-10-INBS-04, «Investments for the future»), the labex CEMEB (ANR-10-LABX-0004) and NUMEV (ANR-10-LABX-0020). This work was performed in part at the Duke University Shared Materials Instrumentation Facility (SMIF), a member of the North Carolina Research Triangle Nanotechnology Network (RTNN), which is supported by the National Science Foundation (Grant ECCS-1542015) as part of the National Nanotechnology Coordinated Infrastructure (NNCI). The study was funded by Elsa-Neumann-Stipendium (Humboldt-Universität zu Berlin), the German Research Council (Deutsche Forschungsgemeinschaft; grant number AM 517/1-1) and the Kickstarter Program from RTNN (NC, USA).
AUTHOR CONTRIBUTIONS
F.A. collected the sample, acquired, processed, and analyzed μCT data, performed statistical analysis, and drafted the manuscript. All authors designed the study, interpreted the data, and contributed to the writing and editing of the manuscript.
DATA ARCHIVING
Raw data, time tree, R code, and supplementary material are available on Figshare Digital Repository (https://doi.org/10.6084/m9.figshare.12896249.v8). The Museum für Naturkunde (Berlin, Germany) stores raw CT data, making them available upon reasonable request.
CONFLICT OF INTEREST
The authors declare no conflict of interest.
