
Abstract
The present work aims to develop an automated solution for analysis of dimple tensile fracture surfaces. An image processing based technique has been proposed to extract the voids from the fractographic images of dimple fracture surfaces and also to analyse the void features. A two-stage process has been developed to extract the closed contour of the voids. At the first stage a global thresholding is followed by a sequence of processing, like thinning and morphological closing. In the second stage refinement process has been carried out on the large voids based on local characteristics. The proposed technique has been applied on the scanning electron fractographs of tensile fracture surfaces obtained by tensile testing of austenitic stainless steel at four different strain rates. It has been found that the size and density of extracted voids bear systematic relationship with tensile properties of the investigated steel. The average circular diameter with yield strength and tensile strength follows linear relationship. The number density of large voids is found to decrease with increase of strain rate and it also decreases with increase of average circular diameter in a linear manner. Similar nature of variation of tensile ductility has been observed both with strain rate and average circular diameter.
Export citation and abstract BibTeX RIS
1. Introduction
Failure of engineering components during operational lifetime is an important issue. Some of the common types of failure are: overload failure, torsional failure, impact, fatigue, creep and corrosion related failure. The root cause(s) of failure are investigated by examining the fracture surfaces of failed components. When engineering structure/component fails, it leaves certain signatures on the fracture surfaces. The study of these signatures with the aid of Scanning Electron Microscope (SEM) provides valuable information to—(a) understand the failure process i.e., crack initiation and propagation directions; (b) prevailing loading conditions at the time of failure; and (c) underpin the causes of failure etc.
Broadly, failure of components or laboratory specimens is classified as ductile and brittle failure. Most of the mechanisms proposed for explaining various types of failure are based on dislocation interactions among themselves and with other phases/particles and grain boundaries involving complex slip activities and crystallographic orientation relationships [1]. Depending upon microstructure of the material vis-à-vis deformation characteristics of the material ductile failure occurs by void nucleation, void growth and void coalescence leading to the formation of a crack which finally propagates to failure [2–4]. In the complete ductile failure process, microvoid nucleation is the most critical step. During plastic deformation under tensile loading microvoid nucleation occurs at inclusions, second-phase particles, defects, phase interfaces, etc located within the grain interior or in grain boundary under the influence of favourable hydrostatic tensile stress [2, 5–7]. The variability in size, shape, density, distribution and the orientation of the inclusions, second-phase particles or other defects already present and/or generated during progressive plastic deformation gives rise to incompatible deformation and hence there happens scatter in the local fracture stress data [7, 8].
It is important to note that the failure modes, ductile or brittle, are microstructure sensitive. In general, any attempt to increase strength of a material by modulation of microstructure leads to loss in tensile ductility and hence high strength materials fail in a brittle manner as compared to low strength materials. As an example, tendency of low carbon steel to fail in a ductile manner is more than high carbon steel. It should be noted that plastic deformation precedes failure, and microstructure dependent restricted deformation of any material leads brittle failure. Further, besides deformation characteristics the service conditions and the stress state play significant role on the failure mode. It is well-known that low temperature, high loading or straining rate and triaxial state of stress lead to brittle failure even for a material which would otherwise fail in a ductile manner at ambient conditions.
In case of ductile failure the dimples observed in fractographs which are the high resolution SEM images of fracture surface are essentially related with the halves of such voids on fracture surfaces. It is well established that by delaying or suppressing the void nucleation processes there would be an increase in tensile ductility. The contribution of deformation processes in the development of voids is well established. While void growth mechanisms depend on temperature [9], the nucleation voids result from inhomogeneous deformation on a microscale.
There have been many investigations to understand the void nucleation mechanisms in different materials and ultimate fracture originating from these voids. Bandstra et al [3] employed micro-mechanical modelling using finite element analysis to examine the deformation behaviour of micro-structures of HY-100 steel. Image-based multi-hole models have been utilized to identify the significance of the critical features (like size, spacing and clustering) of the voids on the deformation process, void coalescence and failure. Benzerga et al [10] studied the deformation anisotropy and fracture behaviour of medium carbon hot rolled low alloy steel at room temperature using tension and compression tests. Experiments were carried out to characterize the deformation behaviour, and finding out stress state and specimen orientation effects on final fracture. It was found that all damage stages including void nucleation and crack propagation were inherently anisotropic. Chae et al [11] characterized damage accumulation in the form of the volume fractions and void number densities in HSLA-100 steel. Their findings reveals that void growth stage controls the dependence of void volume fraction on strain and void growth stage is sensitive to stress-state that follows the relationship predicted by Rice and Tracey [12]. However, there is an increased influence of stress triaxiality on void growth stage.
Ductile fracture behaviour of 304LN stainless steel at various strain rates has been studied by Das et al [13]. In this study, void morphologies (i.e., void size, void density and void size distribution) of the tensile fracture surfaces were examined. Das et al observed that, the void number density and the strength were higher at lower strain rate but the average circular diameter of voids and the ductility were lower. Further, high strain rates showed a reverse correlation between void features (like, void number density and average circular diameter) and tensile properties of 304LN stainless steel. Das et al [14, 15] also studied the ductile fracture behaviour of copper strengthened High Strength Low Alloy (HSLA) 100 steel under tensile loading. In this investigation, the two-dimensional dimple morphologies of tensile fracture surfaces were quantified and a strong interrelationship between dimple size and density with tensile properties of the investigated steel was reported.
From the above discussion it is apparent that fractographic features extracted by post-mortem analysis of fracture surfaces bear certain relationships with mechanical properties of materials. This, however, requires very careful analysis of the fractographic features.
Quantitative fractography is an analytical tool that provides true estimates of the feature characteristics and topography of fracture surfaces. Image processing techniques are being used for fractographic image analysis to correlate mechanical properties of materials [10–16]. However, in no published reports in this domain the methodologies are well reported. Generally, the image processing tools offer support for fundamental image processing or image analysis operations. Mostly researchers apply sequences of operations as per their requirement. Such tool based solutions are not general in nature. Moreover, devising such a solution also demands the understanding of image processing. It, therefore, necessitates the development of an automated system to study the fracture surface characteristics.
The objective of the present effort is to develop an automated image analyzing procedure so to characterize the tensile fracture surfaces of AISI304 austenitic stainless steel with an aim to correlate the fractographic features with tensile properties of the investigated steel.
2. Methods
As outlined above, it is understood that microstructure of the material concerned, service conditions, like temperature, loading rate etc and also the stress state of the components or specimens bear great influence on fracture type and hence on fracture surface morphology. Quantitative estimation like average circular diameter of voids; void density on the fracture surface etc are very significant in understanding the mechanical properties of materials undergoing ductile fracture. For such quantitative analysis detection of void regions is the most important task.
The present work deals with complete dimple fracture surface which develops from full grown voids of different size. Detecting the void region corresponds to the segmentation problem in image processing. From the grayscale images of fracture surfaces under study, it is observed that voids are in general of low intensity regions and the boundary of a void is of higher intensity. We intend to extract the closed contour of the voids. Thus, the proposed methodology consists of following steps:
- 1.Detection of closed contour of voids
- 2.Refinement of void contour
These steps are detailed in following sections.
2.1. Detection of closed contour of voids
A representative fractograph of dimple fracture surface is shown in figure 1(a). It can be observed that there exists large number of voids separated by white boundaries. Voids are mostly of low intensity. But variation in intensity exists within the voids and also around the boundaries. As a result, simple edge detection technique gives rise to additional edges apart from the boundaries. Hence, we followed the intensity based thresholding method for obtaining the high intensity boundary pixels. But the process did not result in closed boundary. In order to obtain the closed contour (boundary) of the voids, the following steps were adopted
- Intensity based thresholding
- Detection of preliminary contour
- Formation of closed contour of voids

Figure 1. Stepwise output of closed contour detection. (a) sample fractograph, (b) corresponding histogram of the image, (c) output after thresholding, (d) thinned image and (e) detected closed contour.
Download figure:
Standard image High-resolution image2.1.1. Intensity based thresholding
Any intensity based threshold technique can be applied to convert the grayscale image into a binary one. Two levels will correspond to void region and the boundary. Figure 1(b) shows the intensity histogram for the representative fractograph shown in figure 1(a). It is observed that there are two peaks at very low and high intensity levels. A bell shaped distribution is observed for the intermediate range. We relied on Otsu technique [17] to select the threshold. It selects an optimal threshold that maximizes the separability of the resultant classes in grayscale image. Finally, pixels with intensity more than the threshold are represented as black and the other pixels are converted to white. The threshold image of the fractograph shown in figure 1(a) is presented in figure 1(c).
2.1.2. Detection of preliminary contour
In this step the primary goal is to form the initial contour of the voids. The thresholded image shown in figure 1(c) reveals that the boundaries can have discontinuities. Moreover similar intensity value around the boundaries results into thick boundary. Pixels within the voids with higher intensity values may also be erroneously categorized as boundary pixels. From these observations, initially a morphological closing [18] operation has been performed to minimize the discontinuity in boundaries. It is difficult to select an optimal size of structuring element for morphological operation. In the present work 5 × 5 structuring element of square shape has been considered as a larger structuring element may eliminate some small voids, and it has been chosen empirically. After the closing operation, thinning algorithm [18] has been applied to get rid of the thick boundary to make it of single pixel width. The result obtained after thinning operation is shown in figure 1(d). However, even after this step it is observed that the issue of discontinuity is not completely resolved.
2.1.3. Formation of closed contour of voids
At this stage the goal is to obtain the closed contour of voids. For this purpose, the open edge segments have been removed based on component labelling [19]. A component stands for a unit consisting of spatially connected pixels with similar property. The basic principle is that a white pixel is taken as the seed. All its neighbouring white pixels are considered to be part of same component. For every included white pixel the component grows recursively till any black (contour) pixel is encountered. Finally, the component is taken as a void region and outer contour of the component is taken as closed contour of the void. The process further continues by considering a seed from the remaining white pixels which are not part of any component identified so far. When no white pixel is left, component labelling is complete and thereby closed contours of the voids are also extracted. The closed contours thus obtained corresponding to figure 1(a) is shown in figure 1(e).
2.2. Refinement of void contour
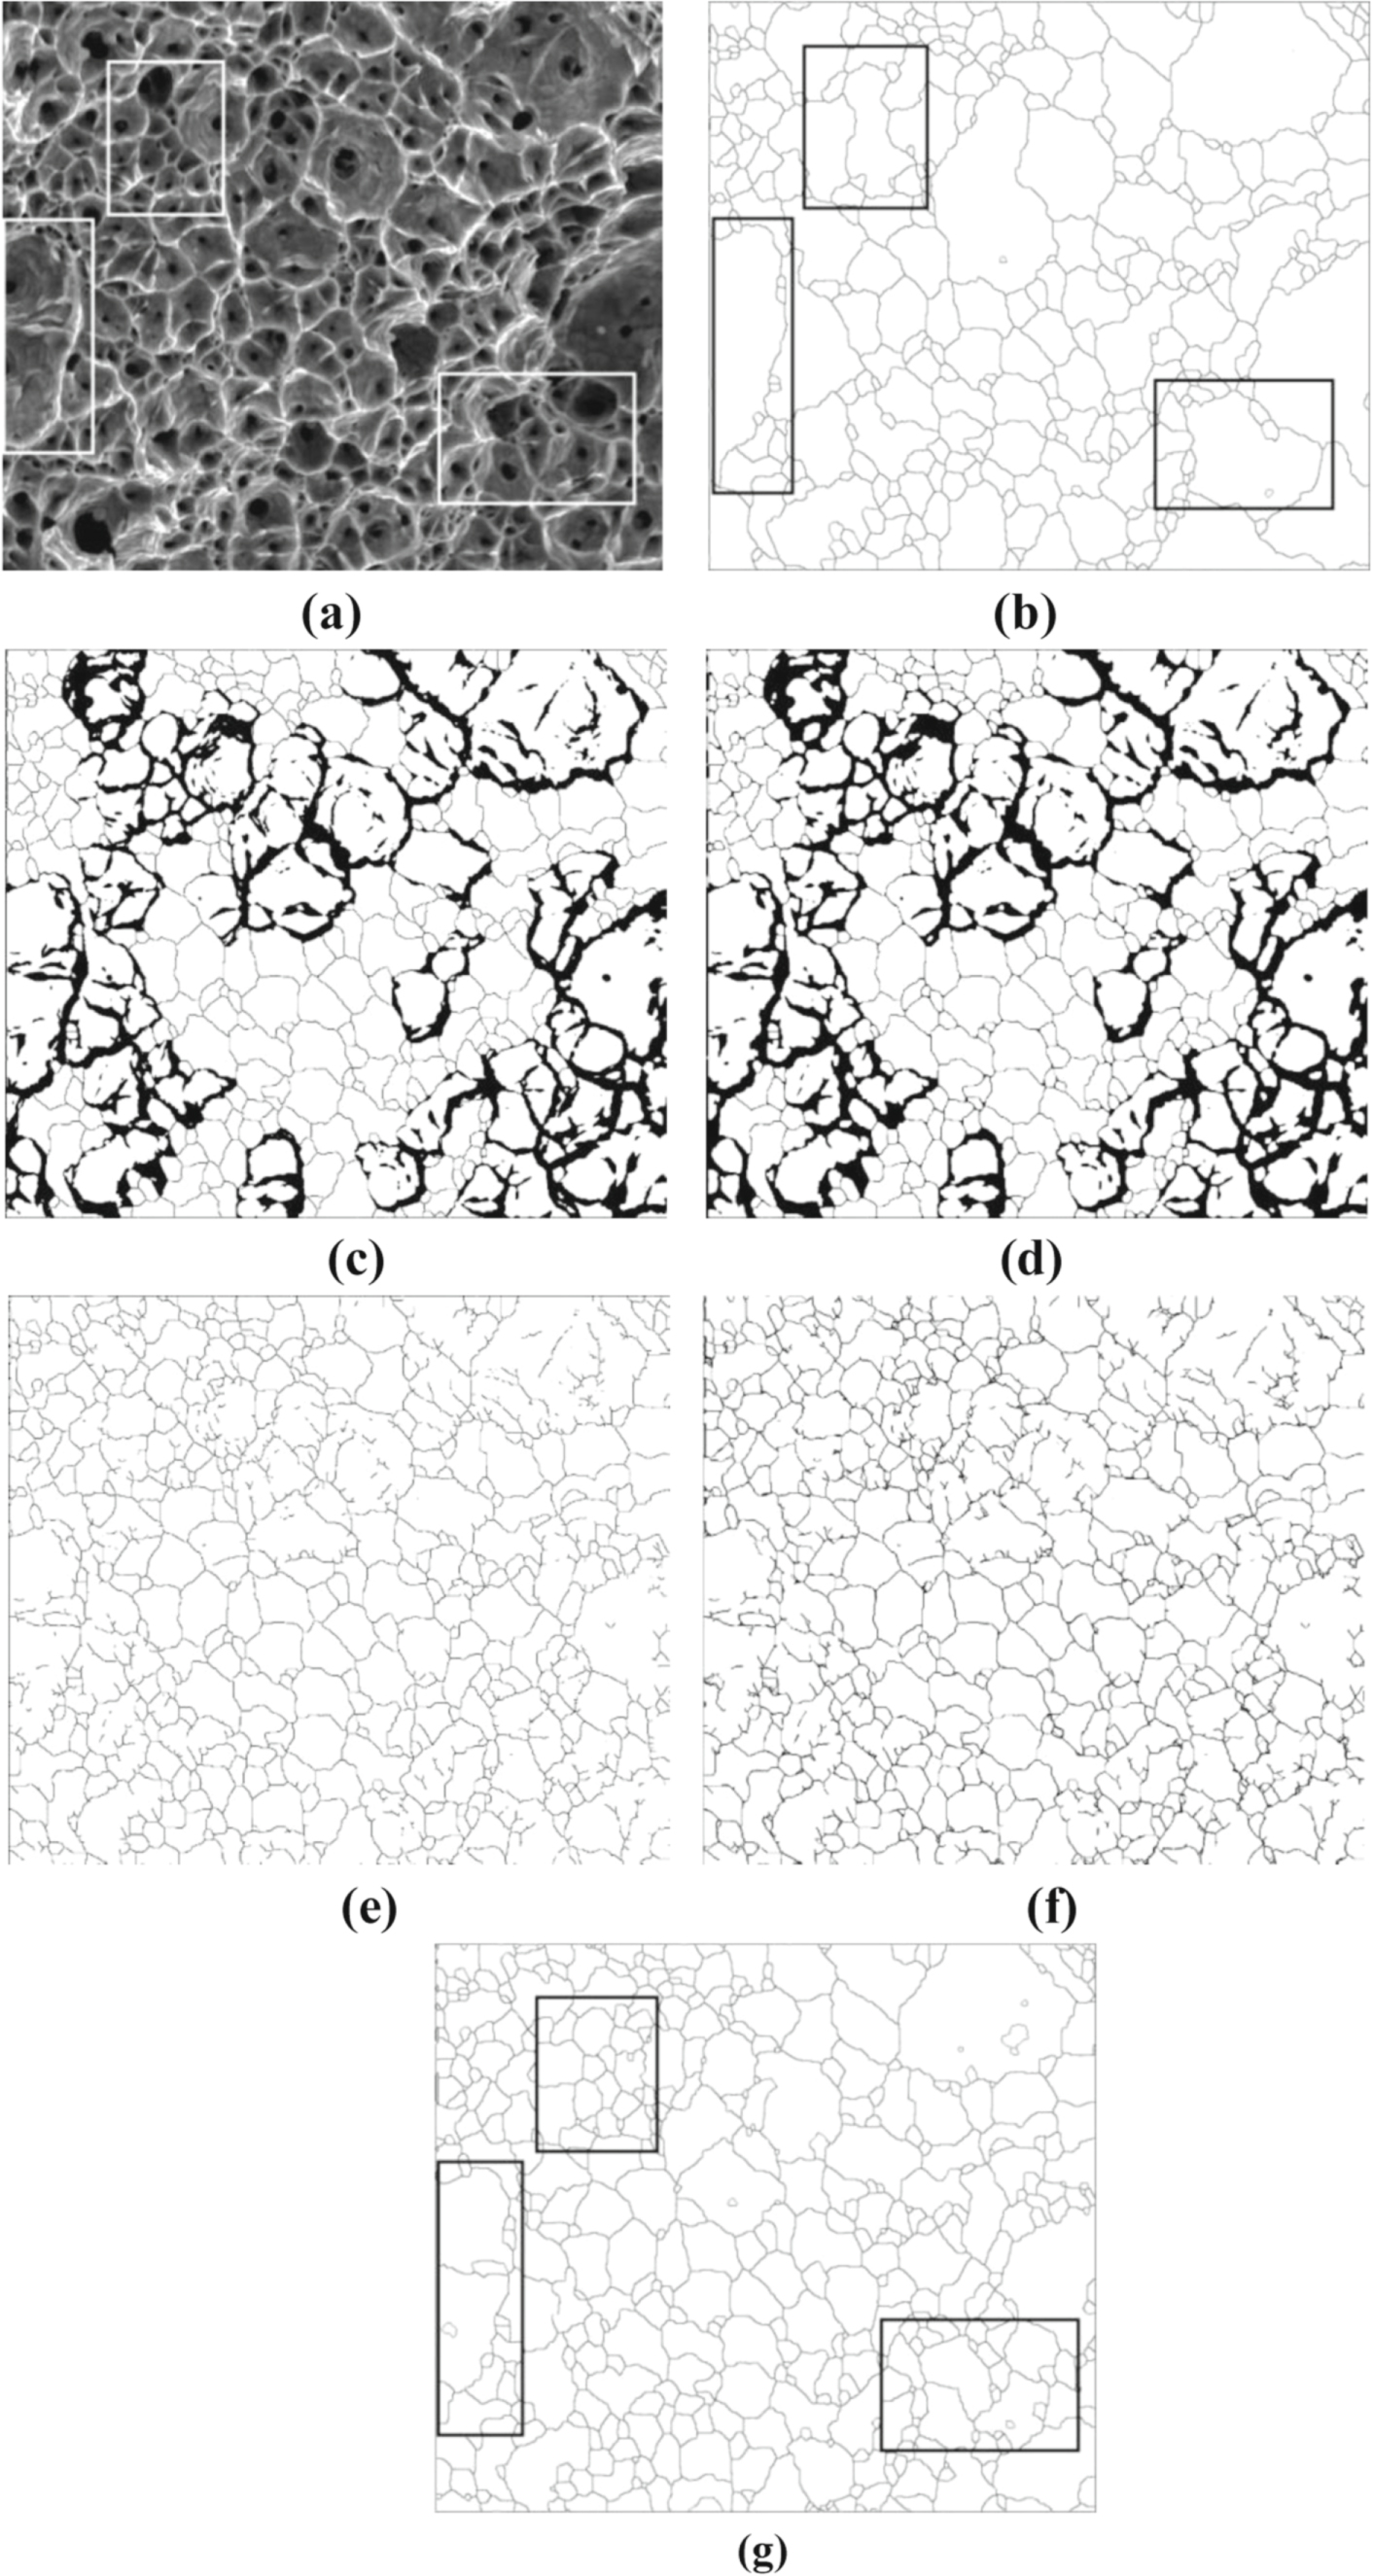
The contour obtained so far is based on the global characteristics of the fractograph. Local intensity and its variation have been ignored. As a result certain weak edges were missed and that resulted into porous contour. In turn, subsequent component labelling may merge multiple neighbouring voids. A representative fractograph and corresponding void contour are shown in figures 2(a) and (b) respectively. Note that, these are same as figures 1(a) and (e) respectively and are presented again for convenience. The marked areas reflect the merging of multiple voids. Hence, it is required to refine the contours by considering the local information. The refinement process is restricted within the large components (voids). The steps of refinement are as follows
- Splitting of large components
- Formation of final contour

Figure 2. (a) Sample fractograph, (b) initial contour of voids with few marked regions which required refinement,(c) output after local thresholding on the large voids, (d) output after closing operation on the large voids, (e) output after thinning, (f) output after linking and (g) refined contour of voids with marked regions after refinement.
Download figure:
Standard image High-resolution image2.2.1. Splitting of large components
The voids obtained so far vary in their sizes. Because of the removal of some local boundaries, erroneously certain large voids are identified. To take corrective measures, large voids (components) are to be defined first. Voids with area more than μ + σ are considered as large void, where μ and σ correspond to mean and standard deviation of the area of the voids. Each of the identified large voids has been considered as the mask on the original grayscale image. On each masked region thresholding, closing and thinning operations as described in sections 2.1.1 and 2.1.2 have been applied. As we focus on local regions, local intensity distribution can be used to identify additional boundary pixels. Stepwise results are shown in figures 2(c)–(e). It is observed that local thresholding results in new boundary regions and subsequent closing connects nearby boundary regions. The thinning step resulted in the boundary edge segments.
2.2.2. Formation of final contour
The new edge segments detected in the large components may not form the closed contour. We refer such edges as open edges. To ensure the division of large voids, linking of the open edges has been attempted following the procedure as highlighted below.
For each open edge, open end point is first determined. An edge pixel with only one more edge pixel in its 3 × 3 neighbourhood is marked as open end point. Let P be an open end point. All the edge points in its K × K neighbourhood are the possible elements with which P can be linked. One among these elements is chosen based on their similarity of gray level intensity. If no edge pixel is found in the neighbourhood then search is continued by increasing K. In our work, initially K was taken as 4 and restricted to 7 for avoiding over splitting. The result of linking step is shown in figure 2(f). Still open edges may exist which could not be linked. Such spurious edge segments were pruned following the component labelling based scheme discussed in section 2.1.3. The final output is shown in figure 2(g). Marked regions indicate the refinement over the initial contours. This methodology has been applied on the fractograph of tensile fracture surfaces of each specimen to obtain the closed contour of the voids present. It is worth noting that proposed methodology remains mostly unaffected by uniform change in illumination. Effect of non uniform change in illumination is also surmounted by the local thresholding during the course of refining process.
Das et al [13] and Kalashami et al [16] have applied image processing techniques in their work to analyse the fracture surfaces. They have used image processing tools. A set of image processing operations like, image enhancement, filtering, thresholding were used by them. But a complete process has not been stated. Thus it is difficult to reproduce their methodology for comparison. However, extraction of closed contour of the voids is not ensured following the steps outlined in those works.
3. Experimental
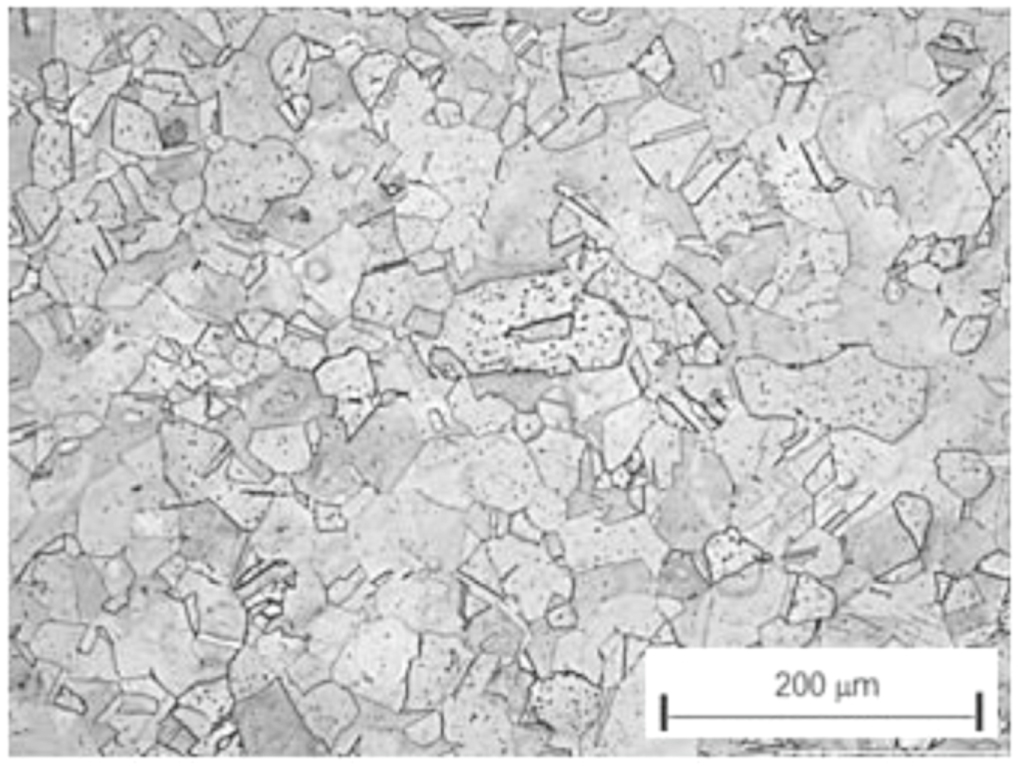
The steel used in the present investigation is a commercial variety 304 austenitic stainless steel. The chemistry of the steel in wt. pct is: C-0.05, Ni-8.0, Cr-18.2, Mn-1.6, Si-0.40, S-0.02, P- 0.02, Mo-0.39, Ti-0.0001. Round section specimen blanks of 14 mm diameter and 120 mm length were solution annealed at 1100 °C for 60 min and then quenched in water at ambient temperature (∼25 °C). Microstructure of the solution annealed specimens was developed following usual metallographic polishing and etching techniques. Etching was done using Glycergia (1 part Glycerol, 3 parts HCl and 1 part HNO3). The polished and etched specimens were observed in optical microscope (Leica DM 2500 M) and the optical image of the microstructure were captured with the help of digital camera, Leica DFC550, interfaced with a personal computer. From these optical images grain size of the investigated steel was measured using ImageJ software.
Tensile specimens were fabricated out of the solution annealed specimen blanks. Tension tests were done under strain-control mode at four different strain rates ranging from 10−1 to 10−4 s−1 in a computer controlled servohydraulic universal testing machine. Instron 8500 R of ± 100 kN capacity at ambient temperature (∼25 °C). The tests were done and data acquisition was accomplished using InstronBlueHill Tensile test software. The tensile fracture surfaces were carefully preserved and examined in a scanning electron microscope (Jeol, JSM6360) under secondary electron imaging mode. These fractographic images were used for developing the automated procedure to quantify different parameters of the voids constituting the tensile fracture surfaces.
4. Results and discussion
Optical microscopy revealed that microstructure of the material consisted of polyhedral grains of austenite with annealing twins dispersed in some grains, figure 3. The two-dimensional average grain size was found as ∼68 microns. Observation of tensile fracture surfaces in SEM revealed that at all strain rates specimens failed in a ductile manner resulting in dimple fracture surfaces. The fractographs of theses dimple tensile fracture surfaces were used to quantify different parameters of the voids constituting the tensile fracture surfaces by applying the proposed technique.

Figure 3. Microstructure of solution annealed 304 stainless steel.
Download figure:
Standard image High-resolution imageTensile test results at different strain rates are shown in table 1. In the present investigation it is observed that while yield strength increases, tensile strength is decreased with increase of strain rate, figure 4. Generally, it is a common belief that both yield and tensile strength are increased with increase of strain rate. However, whether tensile strength would always increase with increase of strain rate in all types of materials is not universally true. There are existing reports where it is found that with increase of strain rate yield strength increases and tensile strength decreases in case of 304 L and 304 steel [20, 21]. In the present investigation, it is found that this variation of yield strength and tensile strength with strain rate follows power relationship with reasonably good correlations (R2 > 0.97). Similar variation of yield strength and tensile strength with strain rate has also been reported by Kundu and Chakraborti [22] in case of 304 stainless steel.
Table 1. Results of tension tests.
| Strain rate (s−1)) | 0.2 pct offset yield strength (MPa) | Tensile strength (MPa) | % Uniform elongation | % Total elongation | % Reduction in area |
|---|---|---|---|---|---|
| 10−4 | 221 | 665 | 76.14 | 88.20 | 84.30 |
| 10−3 | 235 | 622 | 70.94 | 86.00 | 81.70 |
| 10−2 | 264 | 597 | 53.96 | 69.13 | 80.60 |
| 10−1 | 278 | 577 | 51.25 | 67.30 | 75.23 |

Figure 4. Effect of strain rate on the variation of yield strength and tensile strength.
Download figure:
Standard image High-resolution imageWhen considering the ductility parameters (eu, et and R.A) it is observed that the tensile ductility decreases with increase of strain rate. The degree of reduction of uniform and total strain (eu and et) with increase of strain rate is quite substantial with increase of strain rate from 10−4 s−1 to 10−2 s−1. It is interestingly observed that trend in the variation of uniform and total strain with strain rate is exactly same and follows a pattern which shows an upper shelf at low strain rates and a lower shelf at high strain rates with an intermediate transition region, figure 5. Exactly similar behaviour is observed in case of impact toughness variation of ferritic steel with lowering of temperature. Though for all strain rates the investigated steel failed in a ductile manner, the present results indicate that with change in strain rate the fracture surface morphology will also be changed and that will bear a similar correlation with tensile ductility as that observed with strain rate.

Figure 5. Effect of strain rate on the variation of tensile ductility.
Download figure:
Standard image High-resolution imageScanning electron fractographs of the tensile fracture surfaces of the specimens at different strain rates, e.g. 10−1, 10−2, 10−3 and 10−4 s−1 are shown in figures 6(a)–(d) respectively. It is found that failure of specimens occurred through void nucleation and growth irrespective of strain rate and a complete dimple fracture surfaces characteristic of ductile fracture were developed.
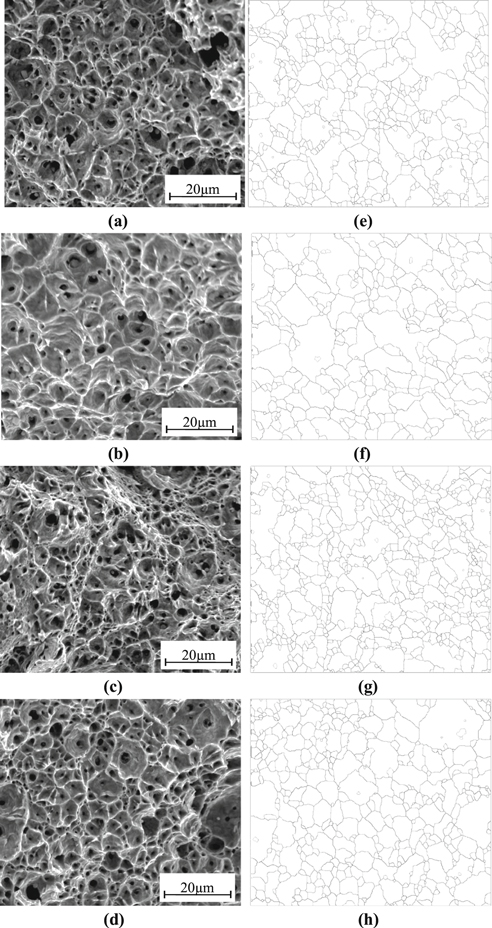
Figure 6. (a)–(d) Ductile fracture surface of stainless steel at strain rate 10−1, 10−2, 10−3 and 10−4 s−1 respectively; (e)–(h) Corresponding void network after application of proposed methodology.
Download figure:
Standard image High-resolution imageThe void networks after application of proposed image processing based methodology corresponding to each of the fractographs (figures 6(a)–(d)), have been shown in figures 6(e)–(h).
It is observed that fracture surfaces contain a number of voids of different sizes. In the present work the variation of average void diameter and number density of voids as a function of strain rate have been studied. To obtain void diameter, first area of a void has been computed. Thereafter, considering the void as circular in shape, its radius and hence the diameter has been estimated. It is found that each of the fractographs consists of very large fraction (0.6 to 0.7) of small voids. Such large fraction of small voids dominates over the large voids in the estimated average void diameter. As a result global average diameter when estimated taking account of all small and large voids lies in a close range (2.11 μm to 2.40 μm) at different strain rates. But, it is worthwhile to mention that the area fraction of these small voids is only 0.17 to 0.24. Hence, to study the variation of average void diameter we considered only the large voids whose diameters are larger than the global average diameter assuming that the tensile properties of the steel under investigation would correspond by the features of those voids that cover more than three-fourth area fraction of the fracture surfaces.
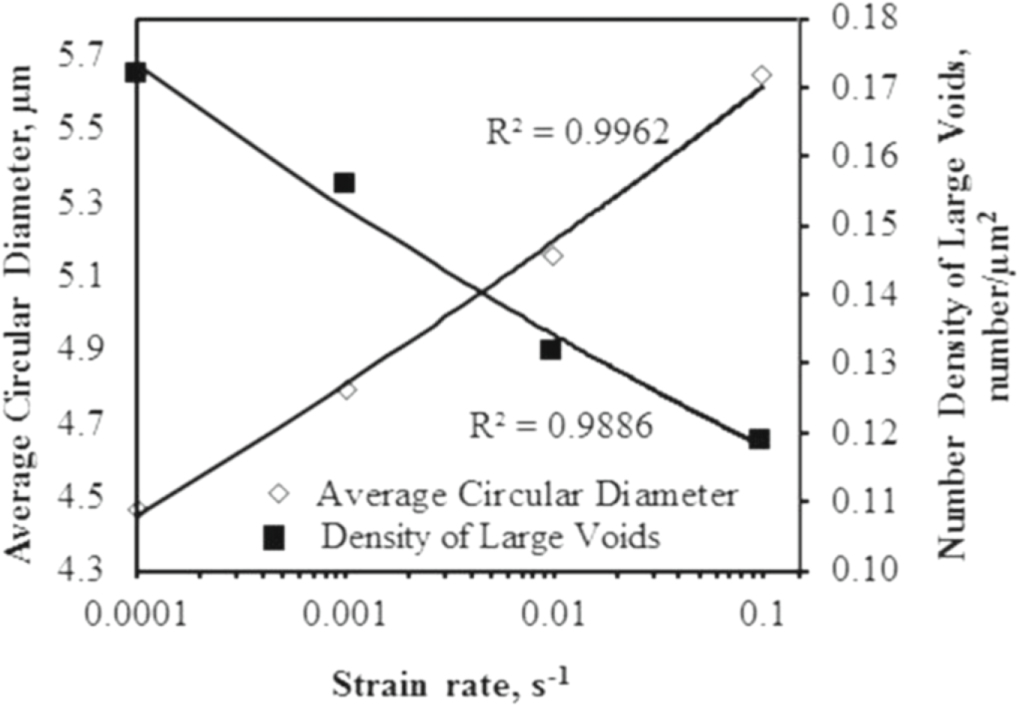
It is found that while the average diameter of the large voids increases with increase of strain rate, the number density of large voids is decreased with strain rates, both following very good power relationship, figure 7. Further, a very beautiful inverse linear relationship with reasonably good correlation is obtained between average circular diameter and number density of large voids as in figure 8. The inverse relationship between number density and average circular diameter of the voids is well expected. But, it is difficult to comment whether the relationship between these two parameters will always be linear in all types of materials and test conditions. In the work of Das et al [13] these two parameters were shown to be related through inverse power relationship in case of 304LN steel.
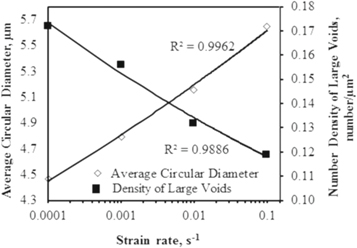
Figure 7. Effect of strain rate on the variation of average circular diameter and number density of voids.
Download figure:
Standard image High-resolution image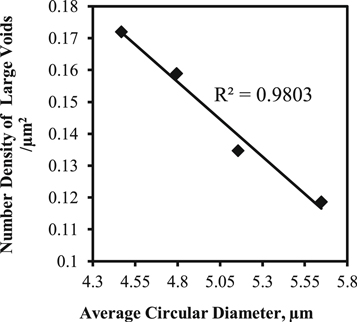
Figure 8. Relationship between number density and average circular diameter of the voids.
Download figure:
Standard image High-resolution imageIn order to see how the void size and density are related with strength and ductility of the investigated steel yield strength and tensile strength have been plotted against average circular diameter and number density of the voids. As shown in figures 9 and 10, it is observed that yield strength and tensile strength linearly varies both with average diameter and number density of voids, but in opposite direction. The tensile ductility parameters of the steel at different strain rates, e.g. uniform and total elongations, have also been plotted against average circular diameter and number density of voids. From figure 11 one can see that the variation of tensile ductility with average circular diameter follows exactly similar pattern as that has been observed with strain rate, figure 5. Because of the inverse linear relationship of the average void diameter with number density of voids (figure 8) the variation of tensile ductility with number density of voids follows almost an opposite pattern (figure 12) to what is shown in figure 11.

Figure 9 Relationship between average circular diameter of the voids and Strength properties.
Download figure:
Standard image High-resolution image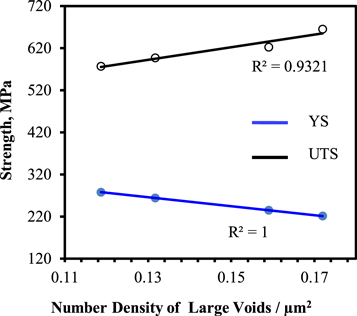
Figure 10 Relationship between number density of large voids and strength properties.
Download figure:
Standard image High-resolution image
Figure 11. Relationship between average circular diameter of the voids and ductility properties.
Download figure:
Standard image High-resolution image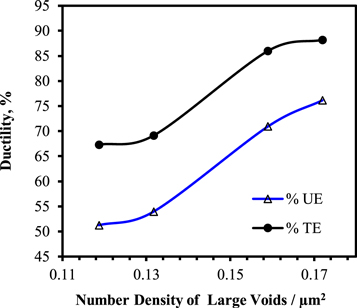
Figure 12. Relationship between number density of large voids and ductility properties.
Download figure:
Standard image High-resolution image
The present results thus show that tensile fracture morphologies can very well correlate the tensile properties. However, for one-to-one correspondence of mechanical properties of different materials under different test conditions, a large data bank is required. The present automated technique to analyse the fractographs can be helpful in this direction. In the present work we have worked only with the images taken at the centre of fracture surface. In future, by capturing the images at different locations of the fracture surface spatial variability of void dimensions may also be studied.
5. Conclusions
The present study leads to the following conclusions –
- i.An automated system based on image processing techniques has been proposed for extracting the voids in fractograph. For routine failure analysis purpose the proposed system does not require intervention of the end user and prior knowledge of image processing is also not essential.
- ii.Present study reveals that void features, like void size and void density at different strain rates bear reasonably good correlations with tensile properties of ductile materials.
- iii.Present results definitely revealed that with increase of strain rate, the investigated steel show the tendency towards brittle failure with reduction of tensile ductility, particularly at strain rates of 10−2 and 10−1 s−1. This phenomenon leads to an increase of average circular diameter of the voids and decrease of number density of large voids.
- iv.The correlation of average circular diameter with yield strength and tensile strength follows similar trend as that of strain rate but in a linear manner. The number density of large voids is found to decrease with increase of strain rate and it also decreases with increase of average circular diameter of voids in linear manner.
- v.The variation of tensile ductility with average circular diameter and strain rate shows exactly similar pattern. But the variation of tensile ductility with number density of voids follows almost an opposite pattern.