Environmental DNA (eDNA) Monitoring of Noble Crayfish Astacus astacus in Lentic Environments Offers Reliable Presence-Absence Surveillance – But Fails to Predict Population Density
 Stein I. Johnsen
 David A. Strand
 Johannes C. Rusch
 Trude Vrålstad2
- 1Norwegian Institute for Nature Research, Lillehammer, Norway
- 2Norwegian Veterinary Institute, Oslo, Norway
- 3Department of Biosciences, University of Oslo, Oslo, Norway
Noble crayfish is the most widespread native freshwater crayfish species in Europe. It is threatened in its entire distribution range and listed on the International Union for Concervation Nature- and national red lists. Reliable monitoring data is a prerequisite for implementing conservation measures, and population trends are traditionally obtained from catch per unit effort (CPUE) data. Recently developed environmental DNA (eDNA) tools can potentially improve the effort. In the past decade, eDNA monitoring has emerged as a promising tool for species surveillance, and some studies have established that eDNA methods yield adequate presence-absence data for crayfish. There are also high expectations that eDNA concentrations in the water can predict biomass or relative density. However, eDNA studies for crayfish have not yet been able to establish a convincing relationship between eDNA concentrations and crayfish density. This study compared eDNA and CPUE data obtained the same day and with high sampling effort, and evaluated whether eDNA concentrations can predict relative density of crayfish. We also compared two analytical methods [Quantitative real-time PCR (qPCR) and digital droplet PCR (ddPCR)], and estimated the detection probability for eDNA monitoring compared to trapping using occupancy modeling. In all lakes investigated, we detected eDNA from noble crayfish, even in lakes with very low densities. The eDNA method is reliable for presence-absence monitoring of noble crayfish, and the probability of detecting noble crayfish from eDNA samples increased with increasing relative crayfish densities. However, the crayfish eDNA concentrations were consistently low and mostly below the limit of quantification, even in lakes with very high crayfish densities. The hypothesis that eDNA concentrations can predict relative crayfish density was consequently not supported. Our study underlines the importance of intensified sampling effort for successful detection of very low-density populations, and for substantiating presumed absence, inferred from negative results. Surprisingly, we found a higher likelihood of eDNA detection using qPCR compared to ddPCR. We conclude that eDNA monitoring cannot substitute CPUE data, but is a reliable supplement for rapid presence-absence overviews. Combined with eDNA analyses of alien crayfish species and diseases such as crayfish plague, this is a cost-efficient supplement offering a more holistic monitoring approach for aquatic environments and native crayfish conservation.
Introduction
Freshwater crayfish are regarded as keystone species and shape the littoral zone in both lotic and lentic environments (Creed, 1994; Momot, 1995). Their presence in aquatic environments, influencing sediment dynamics and benefiting other animals, has also led freshwater crayfish to be characterized as ecosystem engineers and umbrella species (Usio and Townsend, 2001; Reynolds et al., 2013). Furthermore, they are regarded as indicator species for water quality (Sylvestre et al., 2002). In addition, some species of freshwater crayfish are harvested and regarded as delicacies, obtaining high prices in the market (Ackefors, 1998). One of these prized species is the noble crayfish, Astacus astacus, which is indigenous to Europe and the only indigenous species of freshwater crayfish in Norway (Souty-Grosset et al., 2006; Kouba et al., 2014). There are currently about 470 registered Norwegian populations of noble crayfish (Johnsen and Vrålstad, 2017). Along with populations of other native freshwater crayfish species indigenous to Europe, the number of noble crayfish populations has declined dramatically in the last decades. This is mostly due to introduced North-American crayfish species that carry and transmit the crayfish plague pathogen Aphanomyces astaci, but also due to anthropogenic influences such as pollution and habitat loss (Holdich et al., 2009; Kouba et al., 2014). Hence, the noble crayfish is both on the international (Edsman et al., 2010) and the national red list (Henriksen and Hilmo, 2015). The red list status and its importance in freshwater ecosystems has led to the development of surveillance programs aiming to monitor distribution and relative density of noble crayfish (Johnsen et al., 2019). In Norway, as in other countries, estimates of relative density are obtained by trapping crayfish with baited traps (Johnsen et al., 2014). This is relatively time consuming, and in order to increase the number of monitored populations, environmental DNA (eDNA) methodology has recently been included in the Norwegian surveillance programs for both crayfish plague and freshwater crayfish (Johnsen et al., 2019; Strand et al., 2020). The methods are also used in crayfish monitoring studies in Europe (Robinson et al., 2018; Mauvisseau et al., 2019b; Rusch et al., 2020; Troth et al., 2020).
During the past decade, eDNA methods have been increasingly used as monitoring tool for freshwater organisms (Leese et al., 2016; Bylemans et al., 2019; Strand et al., 2019; Goutte et al., 2020). These methods utilize DNA traces in the environment originating from single-celled microorganisms or cells shed from complex organisms in the form of propagules, mucus, abraded epithelial cells and body fluids (Thomsen and Willerslev, 2015). These sources of eDNA are easily caught on a filter or pelleted from a water sample, from which DNA can be extracted and analyzed. Thus, from a water sample, it is possible to detect specific species or even whole communities (Deiner et al., 2017; Bylemans et al., 2019; McElroy et al., 2020). Quantitative real-time PCR (qPCR) or digital droplet PCR (ddPCR) are commonly used for species-specific detection (Rusch et al., 2018; Capo et al., 2019; Mauvisseau et al., 2019a; Strand et al., 2019), and for relative or absolute quantification of target DNA, respectively (Demeke and Dobnik, 2018; Quan et al., 2018), while high-throughput sequencing and metagenomics is used to study whole communities (Thomsen et al., 2012; Hänfling et al., 2016; McElroy et al., 2020). While qPCR is currently the most common platform to analyze eDNA samples using species-specific assays, recent studies suggest that the detection rate of eDNA in environmental samples is higher when using ddPCR compared to qPCR technology (Doi et al., 2015a; Mauvisseau et al., 2019a; Wood et al., 2019; Brys et al., 2020). With ddPCR there is no need for standard curves and ddPCR allows for absolute quantification, even at low levels of DNA copies. Additionally, ddPCR appears to be more robust against PCR inhibition (Doi et al., 2015a; McKee et al., 2015; Mauvisseau et al., 2019a; Brys et al., 2020).
Environmental DNA methods allow for rapid detection of targeted species and are considered a promising monitoring tool for aquatic species surveillance and inventories (Lodge et al., 2012; Thomsen and Willerslev, 2015), including monitoring and discovery of endangered and invasive species (Dejean et al., 2012; Laramie et al., 2015; Strand et al., 2019). Additionally, eDNA methodology is non-invasive compared to more traditional methods where the species itself is caught (Thomsen and Willerslev, 2015). An increasing number of studies show that eDNA monitoring is suitable for acquiring presence/absence information of targeted species (Hempel et al., 2020; Mason et al., 2020; Villacorta-Rath et al., 2020), although “not-detected” data cannot be taken as absolute proof of absence (Rusch et al., 2020). For marine and freshwater fish species, it has also been suggested that eDNA concentrations can be used to estimate population density or biomass of a species (Takahara et al., 2012; Thomsen et al., 2012; Lacoursière-Roussel et al., 2016). For freshwater crayfish, several studies demonstrate the use of eDNA to determine the presence or absence of species (Tréguier et al., 2014; Agersnap et al., 2017; Harper et al., 2018; Strand et al., 2019; Rusch et al., 2020), which is very useful for verification of species presence and species distribution. A few studies have investigated the relationship between population density of targeted crayfish species and eDNA concentration, but so far no or only weak correlations have been reported (Dougherty et al., 2016; Cai et al., 2017; Larson et al., 2017; Rice et al., 2018; Troth et al., 2020). More studies are thus needed to evaluate whether eDNA concentrations can somehow reflect the relative population density of freshwater crayfish species.
Goal of Study
We aimed to make a direct comparison between the traditional monitoring of noble crayfish using baited traps, and targeted eDNA monitoring by means of species-specific qPCR and ddPCR. This will help assess if eDNA yields valid presence/absence data for noble crayfish. We further use occupancy modeling to estimate the probability to detect eDNA of noble crayfish at various population densities, ranging from very low to high density populations. We also explore whether eDNA concentrations in the water correlates with observed relative density of noble crayfish. Finally, we compared the qPCR and ddPCR results and efficiency for eDNA detection of noble crayfish.
Materials and Methods
Study Sites
In total eight lakes in the south-eastern part of Norway were included in this study (Figure 1A and Table 1). These study sites were selected according to an expected range of crayfish abundance, based on results from other projects such as the National surveillance program for noble crayfish (Johnsen et al., 2019). Here, we have available data from several years of trap catches, including estimates of relative density from catch per unit effort data (CPUE). To avoid larger molting periods, which would influence both the catchability of crayfish (Westman and Pursiainen, 1982) and possibly the eDNA concentrations in the water (Laurendz, 2017), six of the locations were sampled after mid-August. Due to the high fishing pressure in Lake Einafjorden and Steinsfjorden, we surveyed these two localities from the 7 to 9th of August 2016.
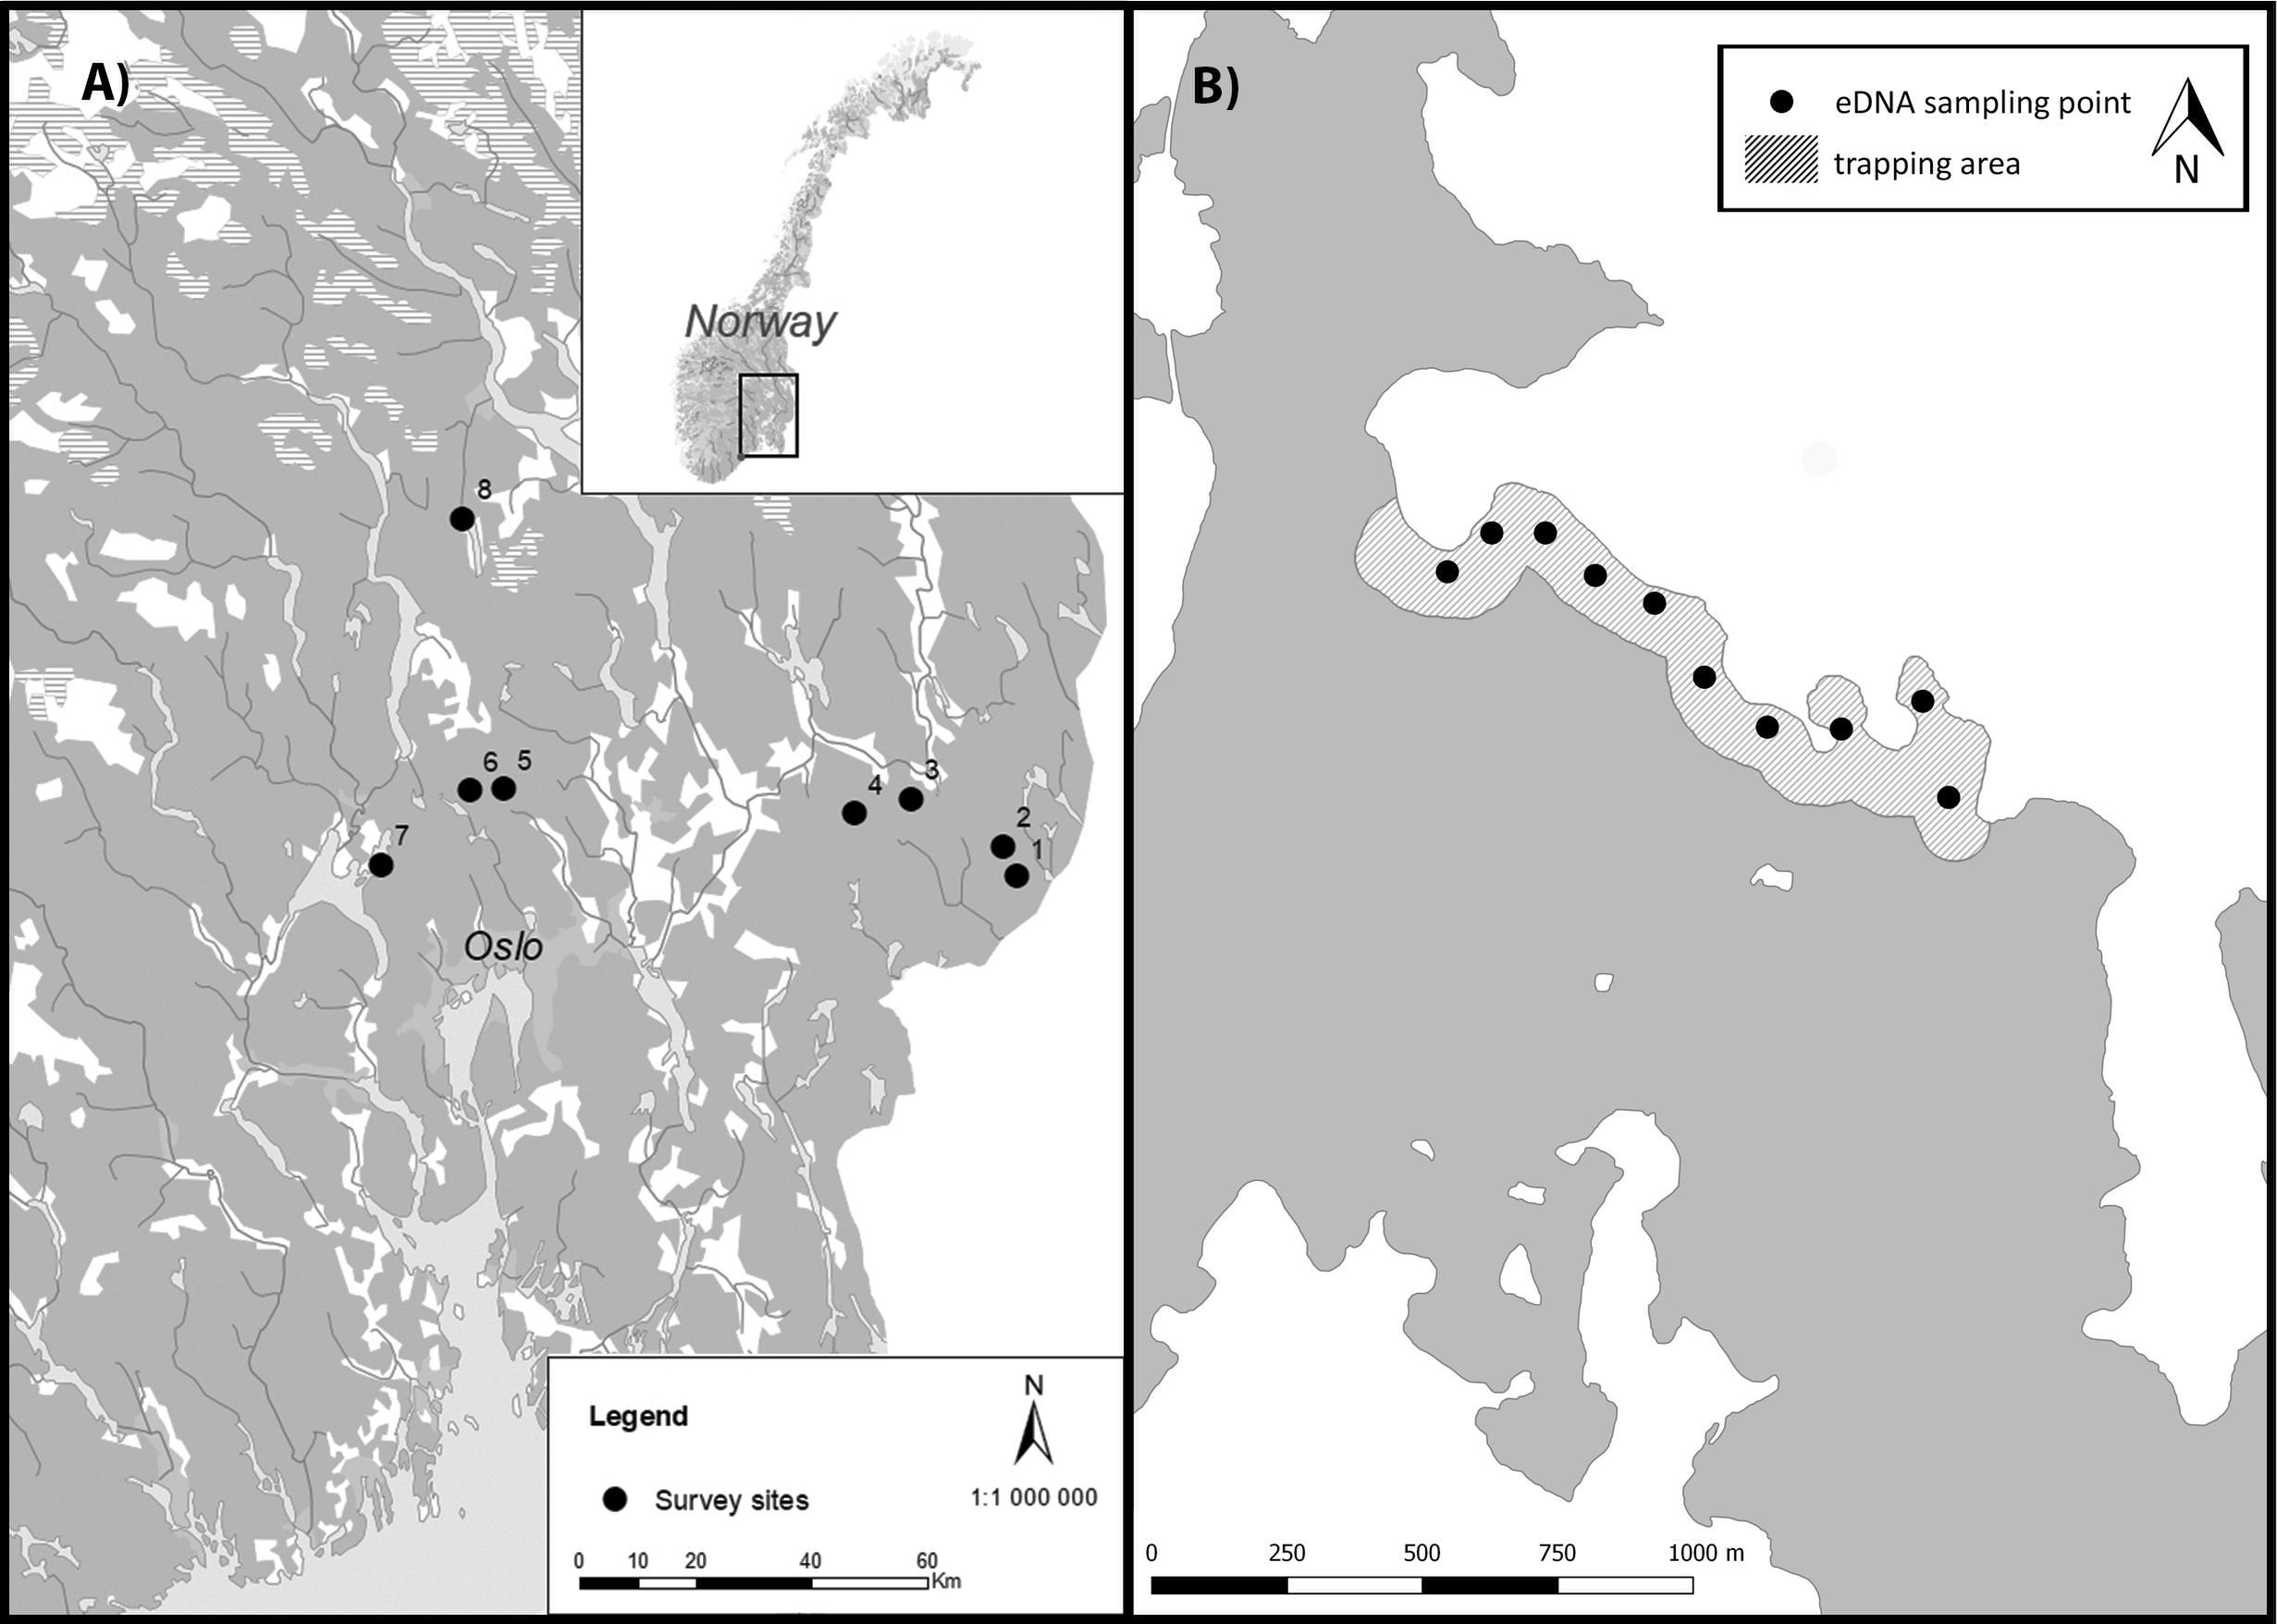
Figure 1. (A) Location of the monitored lakes in Norway. Black dots indicate the lakes and numbers identify the lakes, referring to Table 1. (B) Illustration of sampling transect of crayfish trapping and eDNA sampling at location 8. Here, 50 traps were set along the shoreline in the gray shaded area, and 8–10 filtrated water samples (black dots) were collected from each lake.
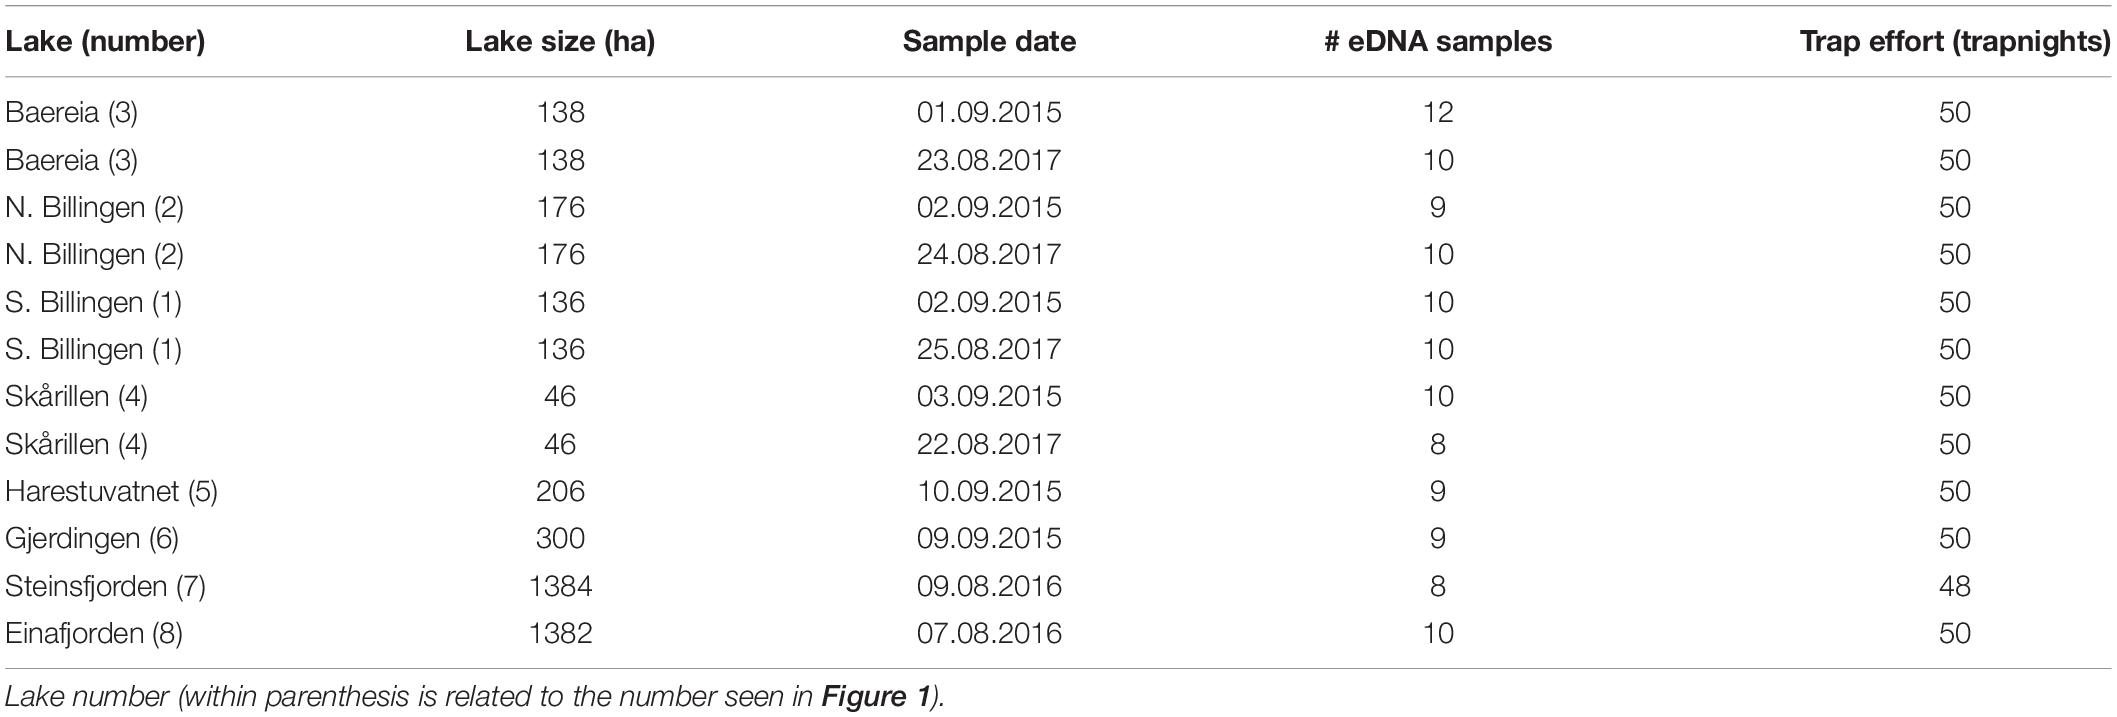
Table 1. Lake and lake size with sample dates and effort of eDNA samples and traps.
Crayfish Trapping
In each lake, 50 funnel LiNi traps with two entrances and 14 mm mesh size were set along the shoreline in the depth interval 0.5–5 m (Table 1 and Figure 1B), in accordance with the methods used in the national monitoring program for noble crayfish (Johnsen et al., 2019). The traps were baited with raw chicken, set in the evening and emptied the next morning. The relative density or CPUE is given as the number of crayfish per trapnight. The number of crayfish caught per trapnight is regarded as a reliable measure of crayfish density with sufficient effort, and even at efforts as low as 15 trapnights (Zimmerman and Palo, 2011; Johnsen et al., 2014).
Water Samples
A total of 8–12 water samples were collected for eDNA analysis from each lake, along the same transect in which the traps were placed (Figure 1B). We filtered up to 5 L per sample, but in some cases less if the filter clogged. In order to avoid any possible contamination or influence of eDNA results from the trapping activity, the water samples were collected and filtered prior to setting the traps, but still on the same day. The samples were filtered directly from the boat using a battery driven peristaltic pump (ES portable sampler, Masterflex, Cole-parmer, Vernon Hills, United States) with tygon tubing (Masterflex) and a 47 mm inline filter-holder (Millipore, Billerica, United States) (Strand et al., 2019). Glass-fiber filters (AP2504700, Millipore) with an effective pore size of 2 μm were used, as in previous studies (Agersnap et al., 2017; Strand et al., 2019; Rusch et al., 2020). The inlet of the tube was attached to a small plastic box weighed down with lead in order to collect water ∼5 cm above the bottom, between 1 and 3 meters depth depending on the shoreline and lake. After filtration, each filter was transferred to a 15 ml falcon tube and stored on ice until return to the laboratory where the filter samples were frozen awaiting DNA extraction.
Extraction of gDNA and eDNA
In order to obtain reference DNA for positive controls and standard dilution series, genomic DNA (gDNA) was extracted from noble crayfish tissue (abdominal muscle) using QIAmp® DNA mini kit with the QIAcube automated DNA extractor (Qiagen) following the manufacturer’s protocol. The DNA concentration was measured using the Qubit 1x dsDNA HS Assay Kit and Qubit 4 Fluorometer (Invitrogen, life technologies) according to the manufacturer’s protocol. Environmental DNA was extracted from the glass fiber filters using an extraction protocol as described in Strand et al. (2019). In short, eDNA samples were lysed in cetyltrimethylammonium buffer (CTAB) and proteinase K at 65°C for 60 min, cleaned and separated using chloroform, precipitated using isopropanol and re-suspended in TE-buffer (pH 8). Due to the large volume of eluate (4 ml) from each sample, the eluates were divided into two subsamples to bypass the volume restrictions caused by centrifuge size. These subsamples were then merged after re-suspension in TE-buffer. During the extraction of DNA, an environmental blank control and an extraction blank control were incorporated in order to measure potential contamination during the DNA extraction step.
qPCR and ddPCR Protocols
gDNA and eDNA extracts were analyzed with a species-specific assay targeting the cytochrome c oxidase subunit I (COI) of noble crayfish published in Rusch et al. (2020): forward primer 5′-CCC CTT TRG CAT CAG CTA TTG-3′, reverse primer 5′-CGA AGA TAC ACC TGC CAA GTG T-3′ and probe FAM-5′ CTC ATG CAG GCG CAT-MGBFNQ. This assay was specifically designed and optimized for both the qPCR and ddPCR platforms. A total of six technical replicates (three undiluted and three 5x diluted) were analyzed from each sample on both platforms (qPCR and ddPCR). The qPCR analysis was performed on a Bio-Rad CFX96 Touch (Bio-Rad, Hercules, CA, United States) in a 25 μL reaction volume. Each reaction consisted of 12.5 μL TaqMan Environmental Master Mix 2.0 (Thermo Fisher Scientific, Waltham, United States), 500 nM of each primer, 250 nM probe, nuclease free water and 5 μl DNA sample. The thermocycling protocol consisted of an initial warming at 95°C for 10 min followed by 50 cycles of 95°C for 15 s and 60°C for 60 s. Four known concentrations of 10-fold diluted genomic DNA (noble crayfish) were run in duplicates as a positive control and standard with known DNA copy numbers (based on absolute quantification of ddPCR) in order to calculate the DNA copies in each reaction (relative quantification) using the manufactures software (CFX Manager v. 3.1.1517.0823).
The ddPCR analysis was performed on a QX200 AutoDG Droplet Digital PCR System (Bio-Rad) in a 22 μl reaction volume. Each reaction consisted of 11 μl ddPCR supermix for probes (no dUTP, Bio-Rad), 900 nM of each primer, 300 nM of probe, 0.6 μl bovine serum albumin (BSA), nuclease free water and 5 μl DNA. Droplets were generated using AutoDG instrument (Bio-Rad), where an emulsion is created with 20 μl of the 22 μl reaction volume, resulting in a 10% loss of DNA template and supermix. After droplet generation, the plates were transferred to a TM100 thermocycler (Bio-Rad) with the following cycling conditions: an initial warming at 95°C for 10 min followed by 45 cycles of 94°C for 30 s and 60°C for 60 s and a final step at 98°C for 10 min to inactivate the enzyme. Ramp rate was set to 2°C/s. The plate was thereafter transferred to the QX200 droplet reader (Bio-Rad) for final analysis. A known concentration of genomic DNA (noble crayfish) was run in duplicate as a positive control. The DNA copies in each reaction were calculated (absolute quantification) using the manufactures software (Quantasoft v.1.7.4.0917).
The environmental blank control and extraction black control from each batch of extracted DNA were included in both the qPCR and ddPCR analysis. Negative blank controls (MilliQ water) were also included on each plate analyzed.
Limits of Detection and Quantification
For the qPCR approach, the limit of detection (LOD) had been established by Rusch et al. (2020) as five copies/qPCR reaction, and followed the criteria that LOD is the lowest concentration that yields a detection probability of 95%, ensuring <5% false negatives (Berdal et al., 2008; Vrålstad et al., 2009). Likewise, the limit of quantification (LOQ) for the qPCR assay has been established as 10 DNA copies/qPCR reaction (Rusch et al., 2020), using the same acceptance level as set for qPCR quantification of the crayfish plague pathogen A. astaci (Vrålstad et al., 2009), with observed standard deviation <0.5 for the Ct-values. Following previous recommendations, a cut-off was set at Ct 41 for the qPCR assay (Agersnap et al., 2017; Strand et al., 2019; Rusch et al., 2020), implying that amplification at or above this value was not considered a positive detection. For each eDNA sample, the following criteria for a positive sample were used: if three or more of the six technical qPCR replicates for a sample were positive below Ct 41, the sample was considered positive.
The same standard dilutions used to estimate the LOQ and LOD for the qPCR assay in Rusch et al. (2020) were analyzed with the ddPCR assay in order to estimate the absolute limit of quantification (aLOQ) and LOD. The aLOQ for ddPCR can be estimated as the lowest copy number of a target within the dynamic range with a relative standard deviation (RSD) of the measured copy number ≤25% (Dobnik et al., 2015). The theoretical LOD, i.e., the lowest concentration that yields a detection probability of 95%, is estimated to be 0.29 copies/μl for ddPCR in the case 17,000 accepted droplets and corresponds to ∼5.8 copies in a 20 μl reaction (Pecoraro et al., 2019). The standard used had a starter concentration of 50 ng/μl of noble crayfish gDNA, and was four-fold diluted to create a dilution series ranging from 12.5 ng/μl (4–1) to 0.00000075 ng/μl (4–13). As ddPCR offers absolute quantification, the ddPCR results from the 3rd fourfold-dilution of gDNA were used as a baseline for the qPCR standard in order to estimate the relative DNA copies in each qPCR reaction. There is no consensus on the number of positive droplets that are required to score a ddPCR replicate as positive, but the threshold is commonly set at 2, 3, or 5 droplets (Dobnik et al., 2015). Since we analyzed six replicates for each sample, and all analyzed blank controls were negative (N = 81), we scored a sample positive when three or more of the six technical ddPCR replicates of the sample had one or more positive droplets. Reactions with total droplet count below 8,000 were excluded.
We estimated the DNA copy numbers per liter water from each sample for both qPCR and ddPCR according to Agersnap et al. (2017) using the equation: CL = [Cr ∗ (Ve/Vr)]/Vw. Here CL = copies of eDNA per liter lake water, Cr = copies of eDNA in reaction volume, Ve = total elution volume after extraction, Vr = volume of eluded extract used in the qPCR/ddPCR reaction, Vw = volume of filtered lake water.
Statistical Analysis
The statistical analyses were performed using RStudio (v.1.3.1073) and R (v.4.0.2). We compared the qPCR and ddPCR reaction estimates of DNA copies from gDNA using a spearman correlation test, and used a generalized linear model (GLM) with the binominal family with logit link logistic to compare detection (TRUE/FALSE) against method (qPCR/ddPCR) and dilution series. We compared the detection frequency of qPCR and ddPCR of DNA from the field samples using a GLM with the binominal family with logit link logistic to compare detection (TRUE/FALSE) against method (qPCR/ddPCR) and CPUE. We used the R package eDNA occupancy to run multiscale occupancy modeling in order to estimate the detection probability of crayfish using the targeted eDNA approach (Dorazio and Erickson, 2018). The multiscale occupancy model estimates (1) the probability of species occurrence at the location (psi or ψ), (2) the conditional probability of occurrence in a water sample given that the species is present at that location (theta or θ), and (3) the conditional probability of detection in a PCR reaction given that the species is present in the sample (ρ) (Dorazio and Erickson, 2018). The models were run separately for the qPCR and ddPCR data sets. For samples with less than three positive technical replicates all replicates were scored as negative, as described above. We first tested the occupancy models with assumed constant parameters. Then we included the factor CPUE into the occupancy modeling in order to investigate how relative crayfish densities influence the detection probability in a water sample (θ). We assumed constant parameters for eDNA occurrence in lakes (psi) and in PCR replicate (p) while the conditional probability of eDNA occurrence in water samples (theta) was assumed to be a function of CPUE. The models were run for a total of 11,000 iterations. We used the equation 1−(1−θ)n ≥ 0.95 to calculate the number of water samples to achieve a 95% detection probability, where θ is the estimated probability to detect crayfish eDNA in a water sample. We also compared (spearman correlation) the mean DNA copies from each field sample from both qPCR and ddPCR with CPUE.
Results
Comparisons of qPCR and ddPCR Assay
Both the qPCR and ddPCR amplified the gDNA standard and there is a significant correlation (R2 = 0.9, p < 2.2e-16) between the estimated DNA copies from the two methods (Figure 2A). There was no significant difference (z = 0.492, p = 0.623, logistic regression) in detection rate between the two methods on the dilution series (Figures 2B,C). The aLOQ for the ddPCR was estimated to be ∼ 40 copies, the last standard dilution where the RSD was ≤25% (Table 2). In the initial ddPCR run several of the positive field samples showed signs of inhibition and lower amplitude of the positive droplets compared to the positive control. Adding BSA to the reaction or diluting the sample (1:5) appeared to improve this issue by increasing the amplitude enough to separate negative from positive droplets. A total of 690 reactions were run both for qPCR and for ddPCR. Here, 33 ddPCR reactions were excluded due to total droplet count below 8,000. Of the remaining 657 ddPCR reactions, 28.5% of the reactions had one or more positive droplets, while 42.6% of the 690 qPCR reactions had a positive amplification below the set cut-off (Cq 41). Both for the qPCR and ddPCR results, most of the reactions were below the LOQ (Figure 3) indicating low concentration of noble crayfish eDNA. None of the environmental blank controls or extraction blank controls displayed any amplification or produced positive droplets. Neither did the negative blank controls display amplification or produce positive droplets.
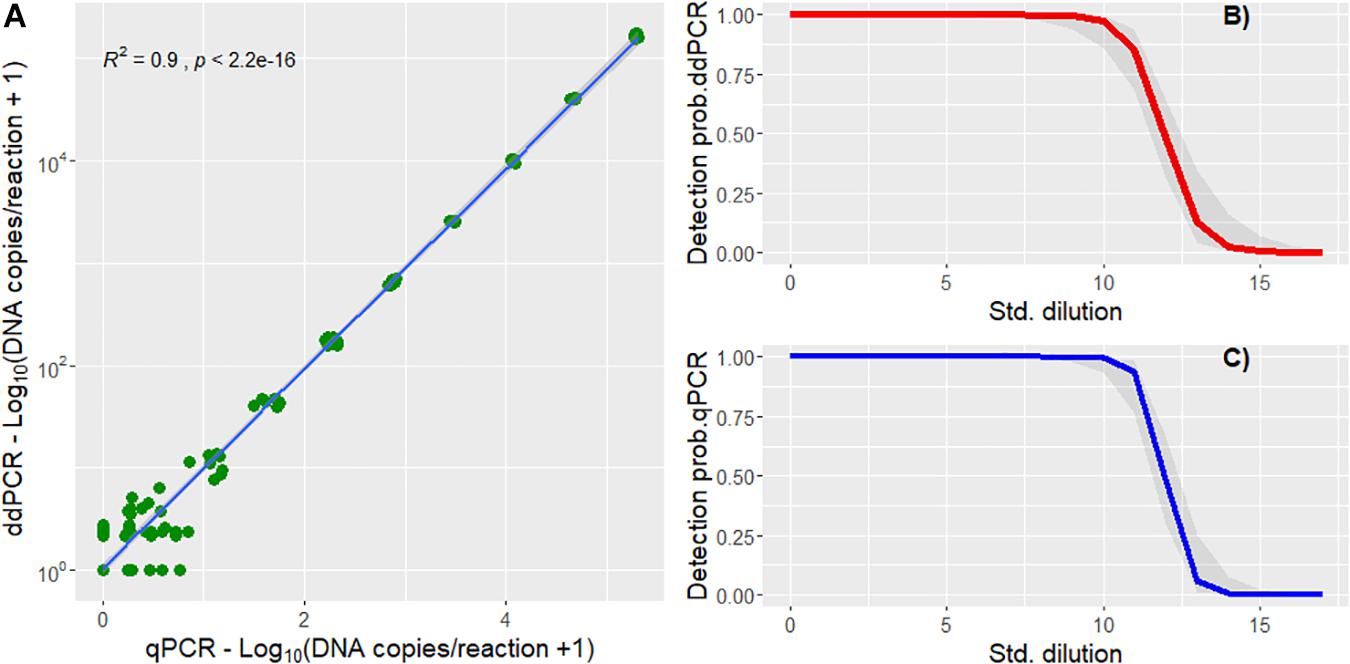
Figure 2. (A) Correlation plot of the estimated DNA copies per reaction of qPCR and ddPCR analysis of gDNA from crayfish tissue using spearman correlation (R2 = 0.9, p < 2.2e-16). (B) Logistic regression curve showing probability of gDNA detection against the dilution series number using ddPCR. (C) Logistic regression curve showing probability of detection against the gDNA dilution series number using qPCR.
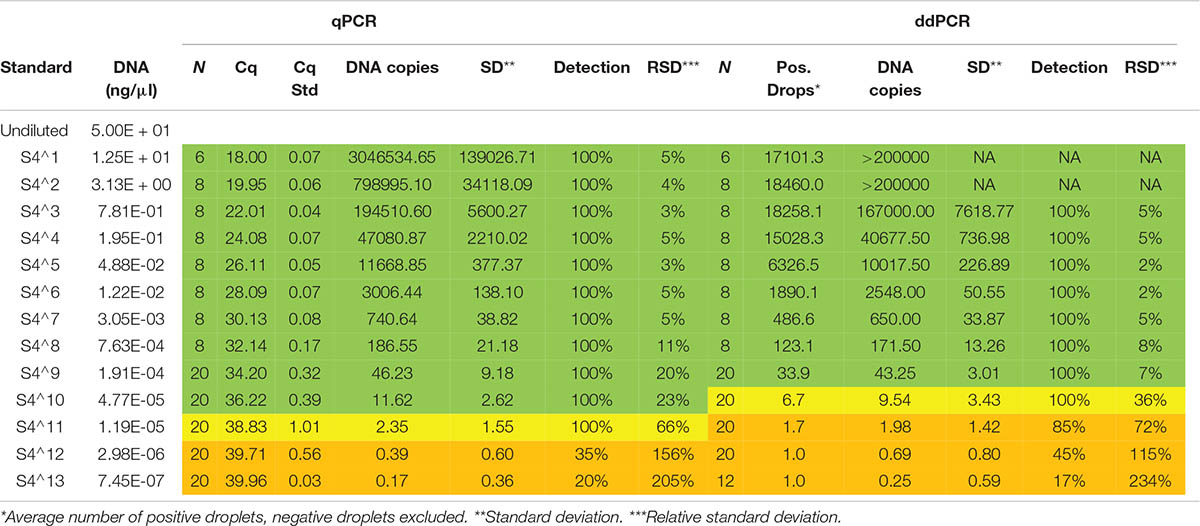
Table 2. The qPCR and ddPCR results for the analysis of the standard dilution used to estimate LOQ and LOD for qPCR (Rusch et al., 2020) and ddPCR (this study) using the same assay.
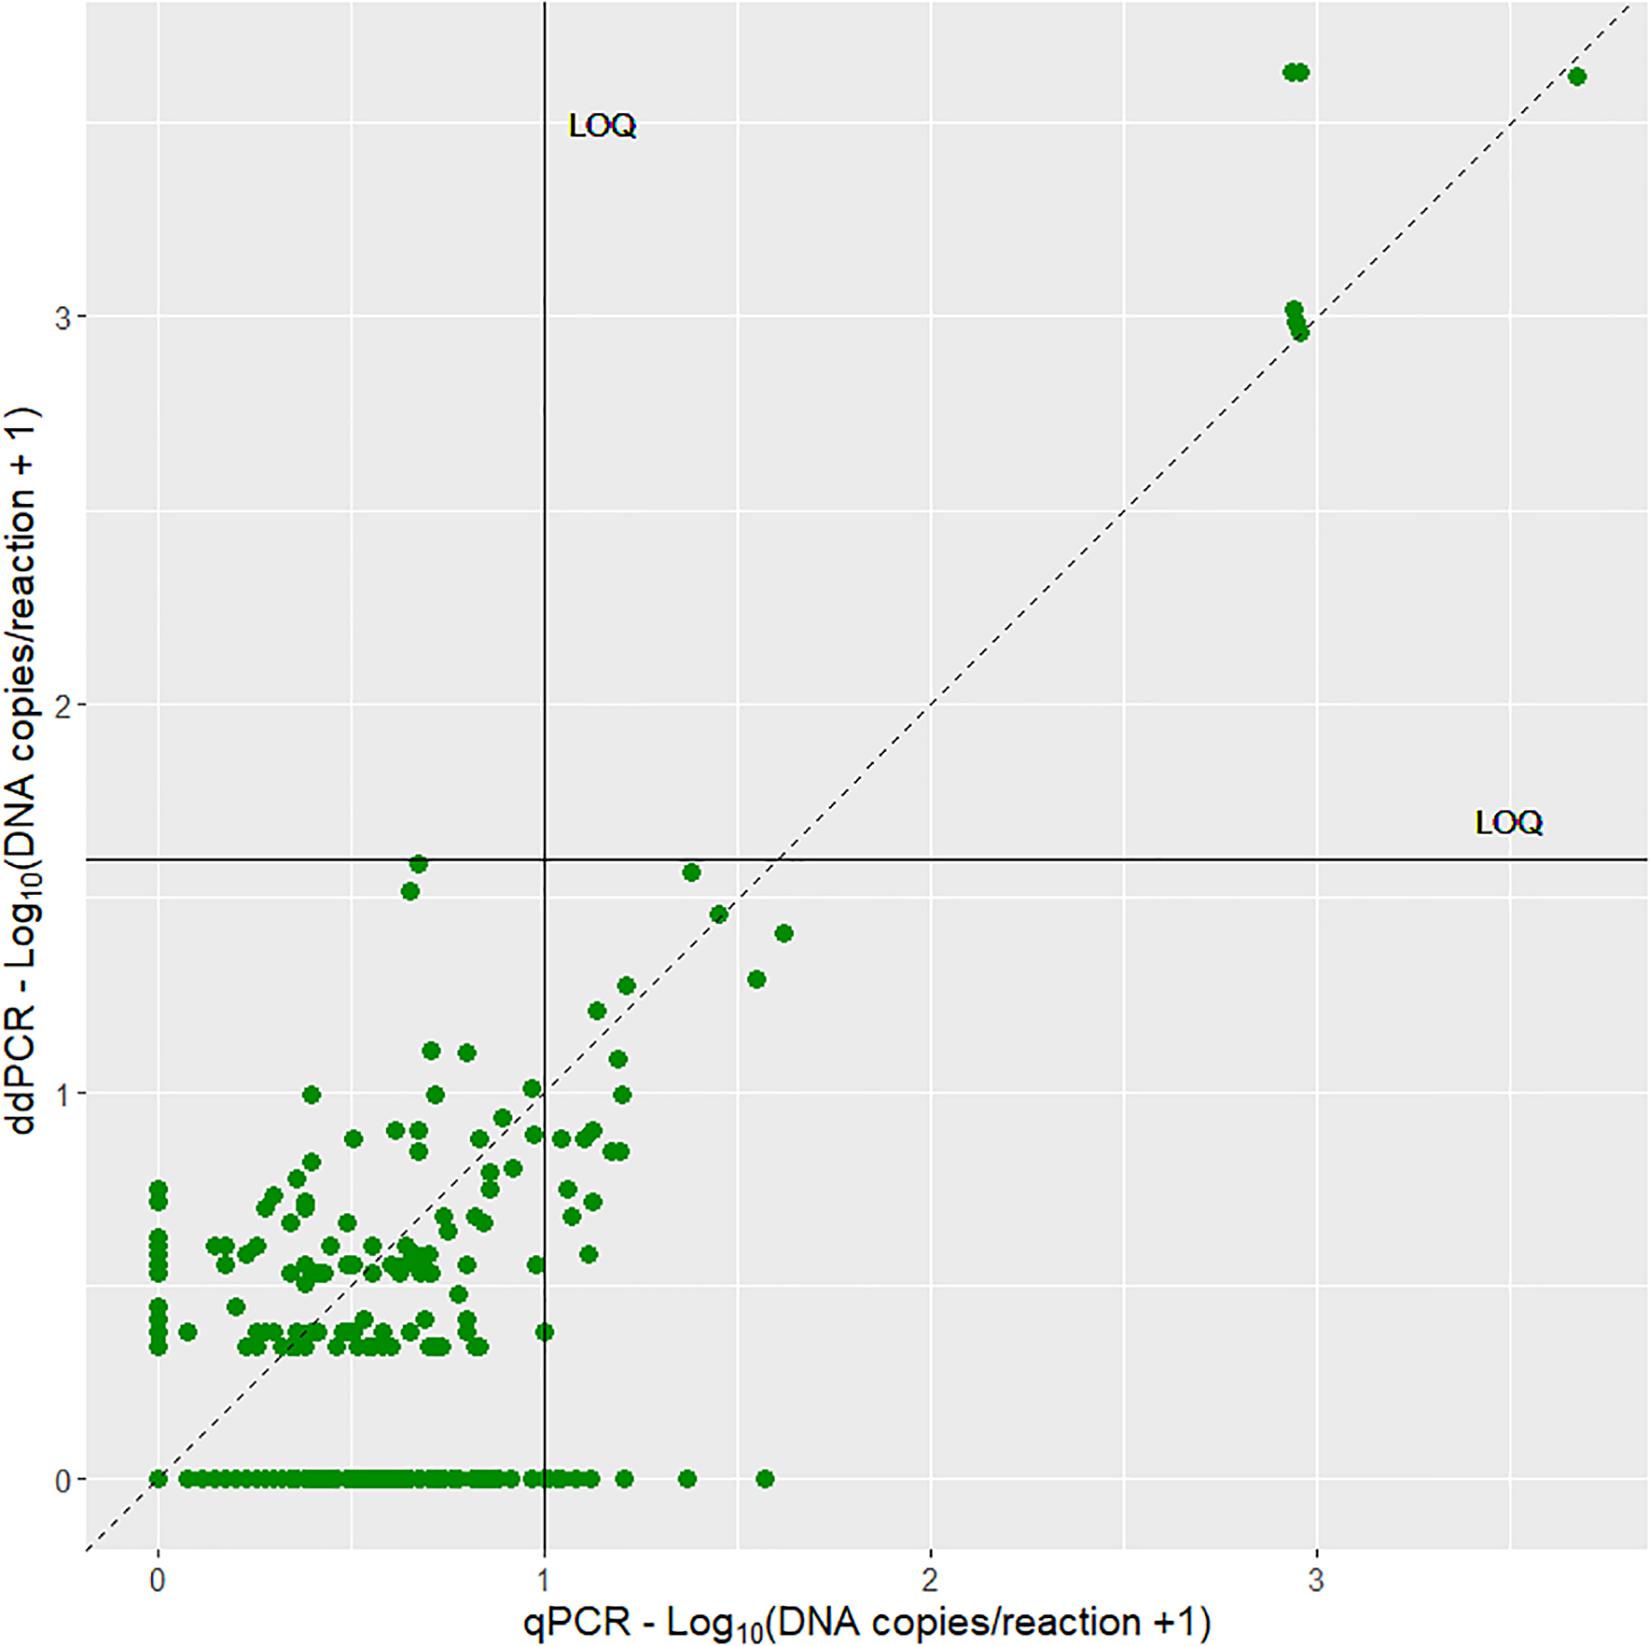
Figure 3. A scatterplot of the estimated DNA copies per reaction of qPCR and ddPCR analysis of eDNA. The stippled line indicates a 1:1 ratio, while the horizontal line and vertical line indicates the LOQ for ddPCR and qPCR, respectively.
Relative Density of Crayfish Compared to eDNA Presence/Absence Data
The CPUE of noble crayfish in the different localities ranged in mean values between 0.08 and 17.52 (Figure 4 and Supplementary Table 1). According to the classification system of the national surveillance program of noble crayfish in Norway (Johnsen et al., 2019), the crayfish populations cover all categories, ranging from “very low density” populations to “very high density” populations (Figure 4). We detected eDNA from noble crayfish in all lakes, but in 2015 we failed to detect noble crayfish eDNA in one of the sampled lakes (Lake Skårillen). In this case, there was very heavy rainfall before and during the sampling. Noble crayfish eDNA was detected in this lake in 2017 (Figure 4). Even in lakes with very low crayfish densities (Figures 4, 5), noble crayfish eDNA had been reliably detected with a qPCR detection frequency ranging from 0.3 to 0.7. The detection frequency of noble crayfish eDNA was significantly higher (z = 4.27, p = 1.93e-05, logistic regression) for qPCR compared to ddPCR (Figure 5A), and the detection frequency increased (z = 4.55, p = 5.46e-06, logistic regression) for both qPCR and ddPCR with increased CPUE (Figure 5B).
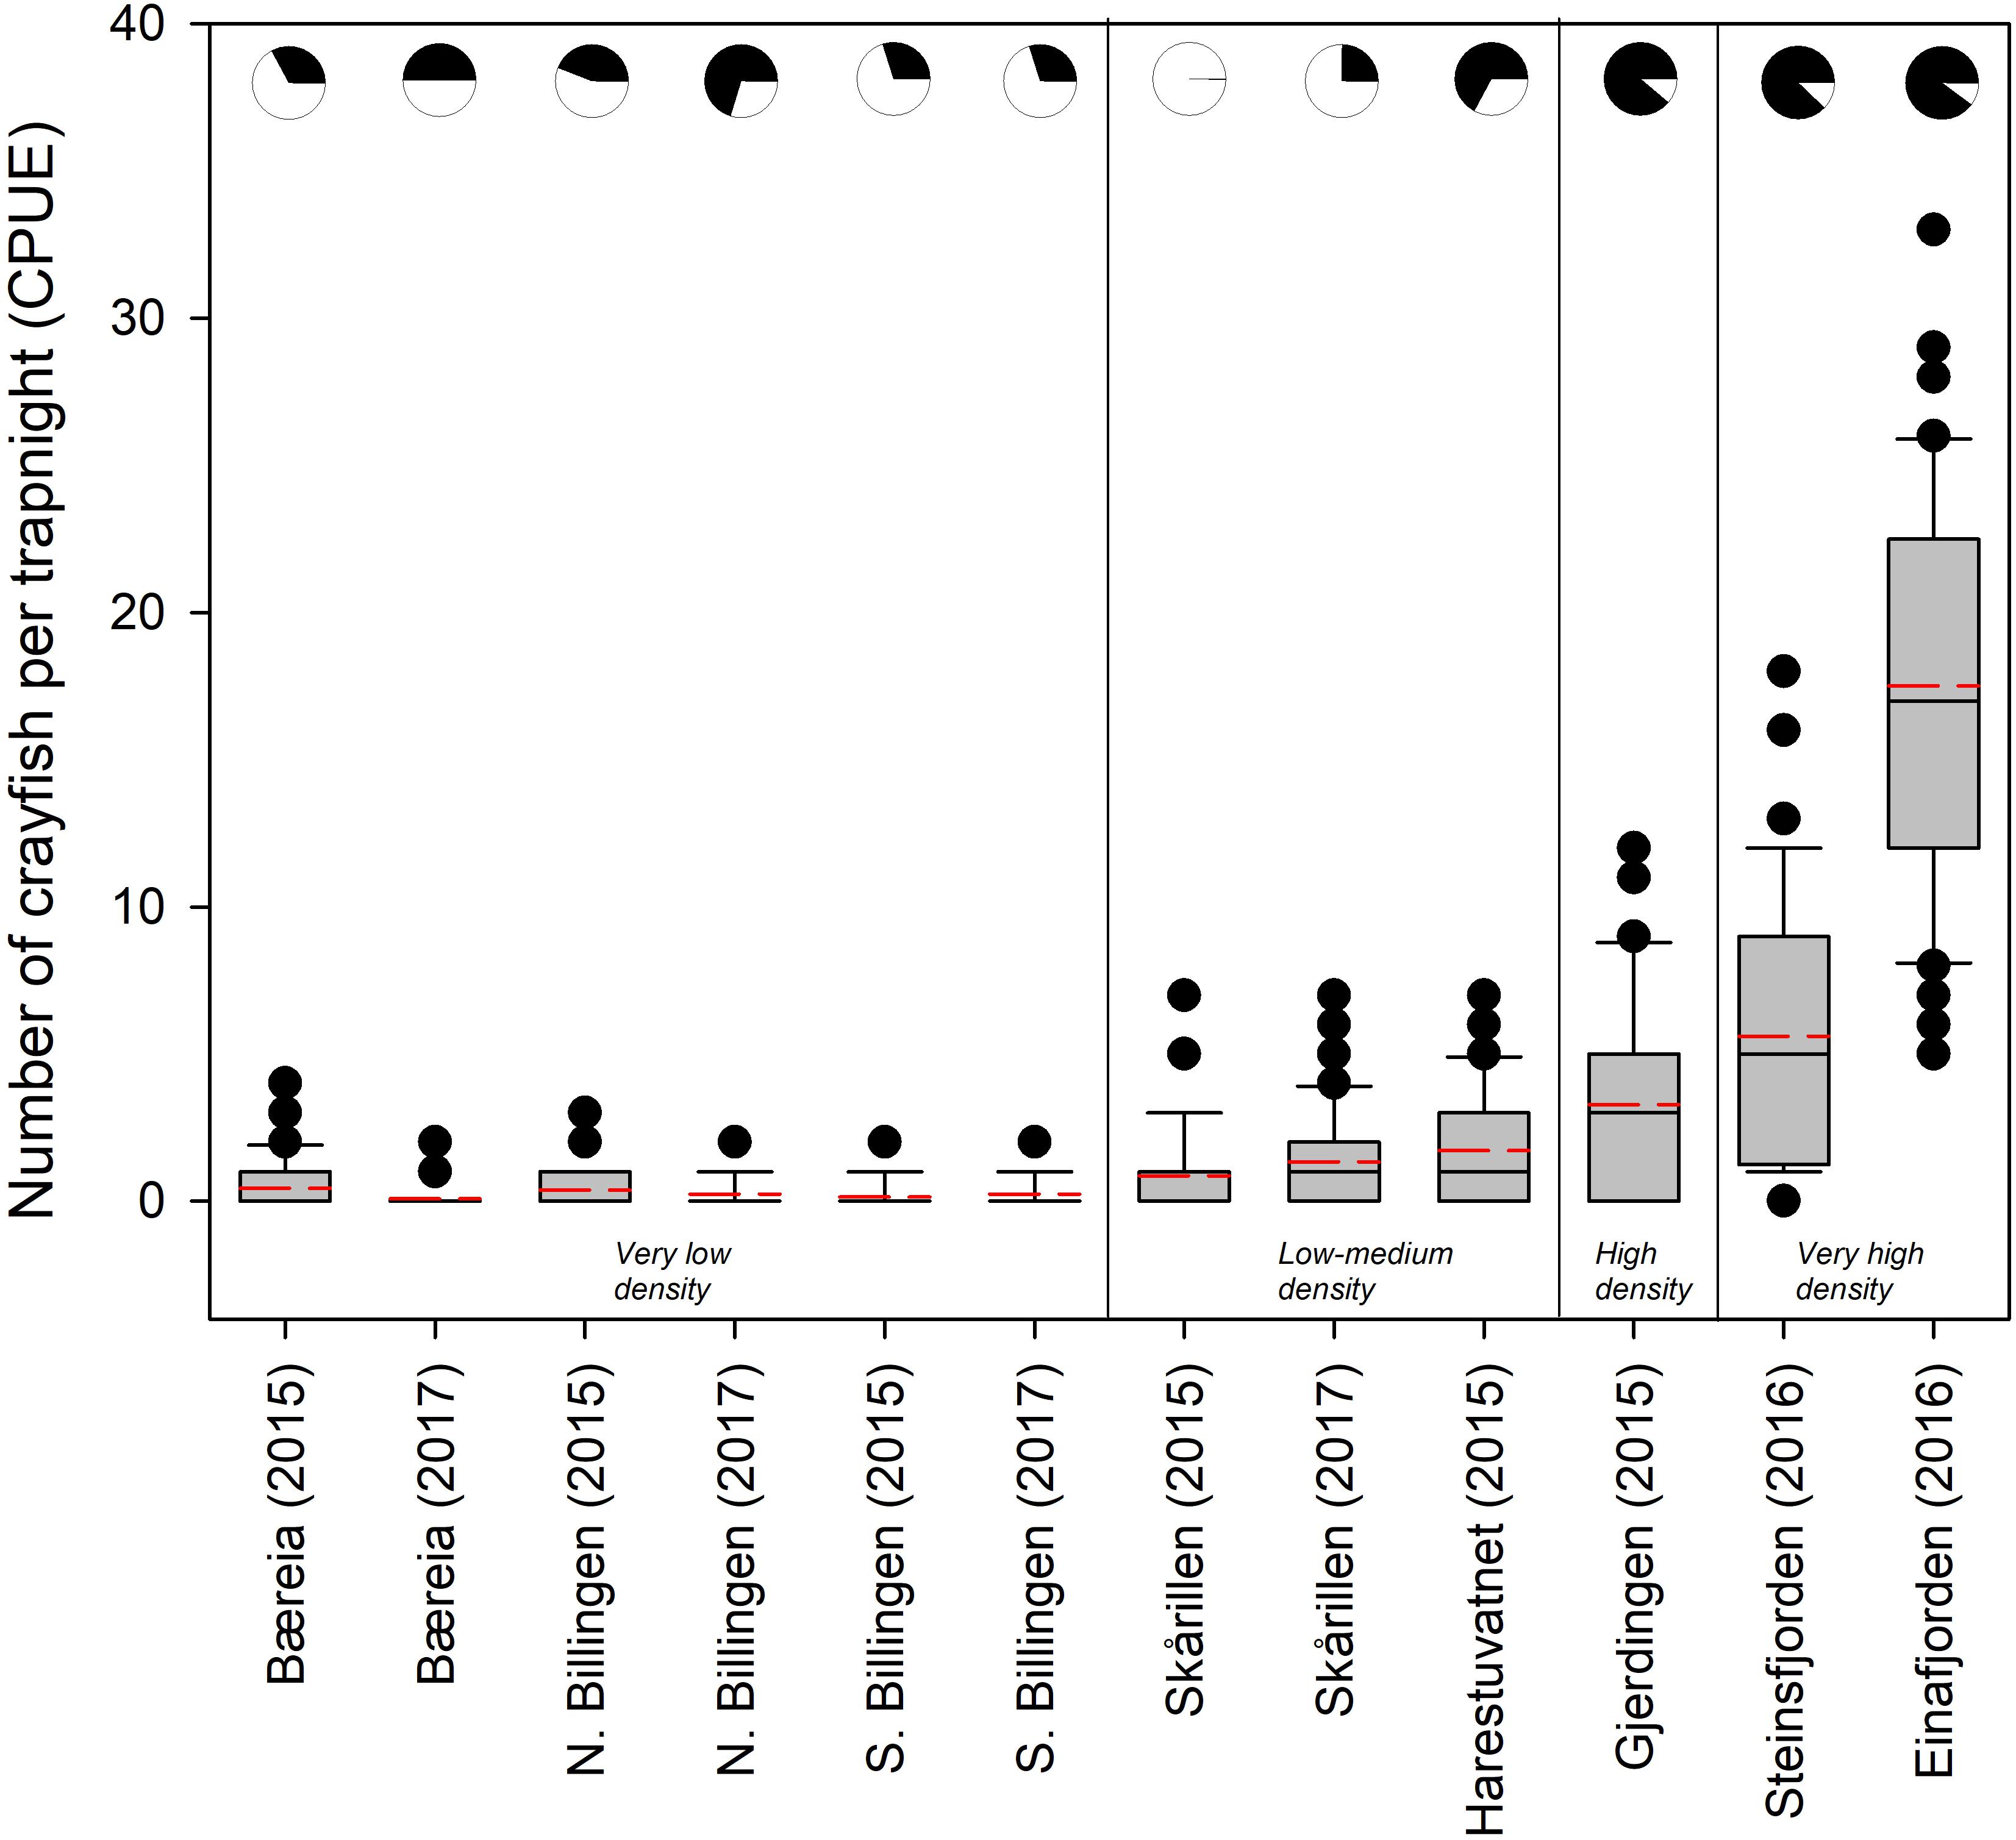
Figure 4. Boxplot showing the number of noble crayfish per trapnight (CPUE) in the eight localities. The plots are based on the number of crayfish caught in the individual traps within the lake. The box contains 50% of the individual trap values, the median and the average values are shown as black and stippled red lines, respectively. The whiskers indicate the 5 and 95 percentiles and the dots (•) show values outside this interval. The pie charts depict the qPCR detection frequency (black part being positive) from the water samples. ddPCR detection frequency is not included. Exact values are given in Supplementary Table 1.
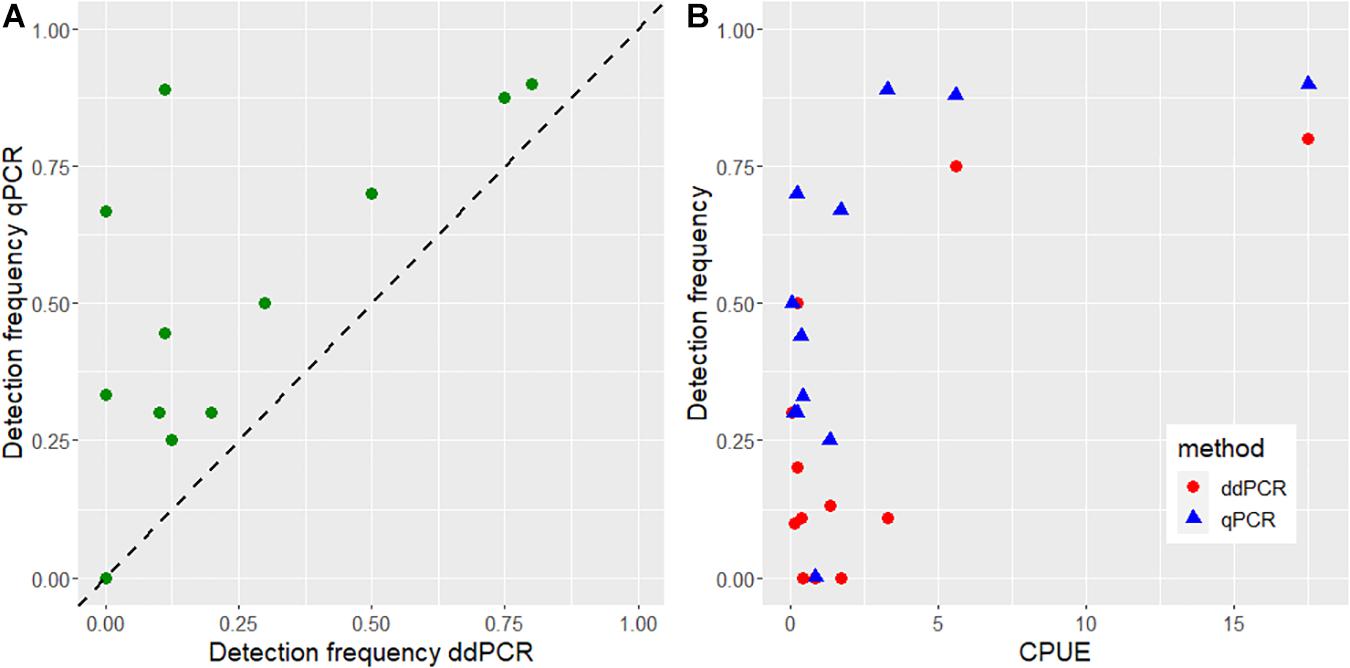
Figure 5. (A) A comparison of the observed detection frequency (proportion of positive eDNA samples in a lake) between qPCR and ddPCR. The dotted line shows the 1:1 ratio. (B) A comparison of the observed detection frequency between CPUE against ddPCR and qPCR.
Occupancy Modeling
The occupancy models with constant parameters (Table 3) also showed that it is more likely to detect eDNA of crayfish using qPCR compared to ddPCR. Including the CPUE as a factor in the occupancy models gives an estimate of detection likelihood in water samples at different relative densities of crayfish, and the likelihood to detect eDNA of noble crayfish in water samples increases with relative densities, both for qPCR and for ddPCR (Figure 6). At all but the highest relative density (CPUE ∼17.52) estimated occurrence of eDNA in a water sample is lower using ddPCR analysis compared to qPCR (Figure 6). For qPCR, the probability of eDNA occurrence is relatively high (around 0.5) even at the CPUE estimates below 1 (Figure 6). At very low to low densities five water samples are sufficient to detect eDNA of noble crayfish with 95% likelihood using qPCR, while 11 to 14 water samples are needed to detect noble crayfish with 95% likelihood using ddPCR (Figure 7).
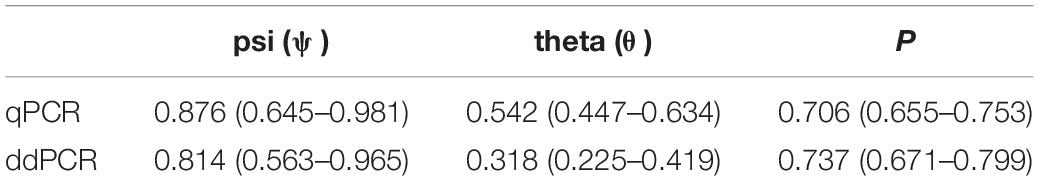
Table 3. The estimated likelihood of occurrence at the location (ψ), in the water sample (θ) or PCR replicate (p) for qPCR and ddPCR using fixed parameters.
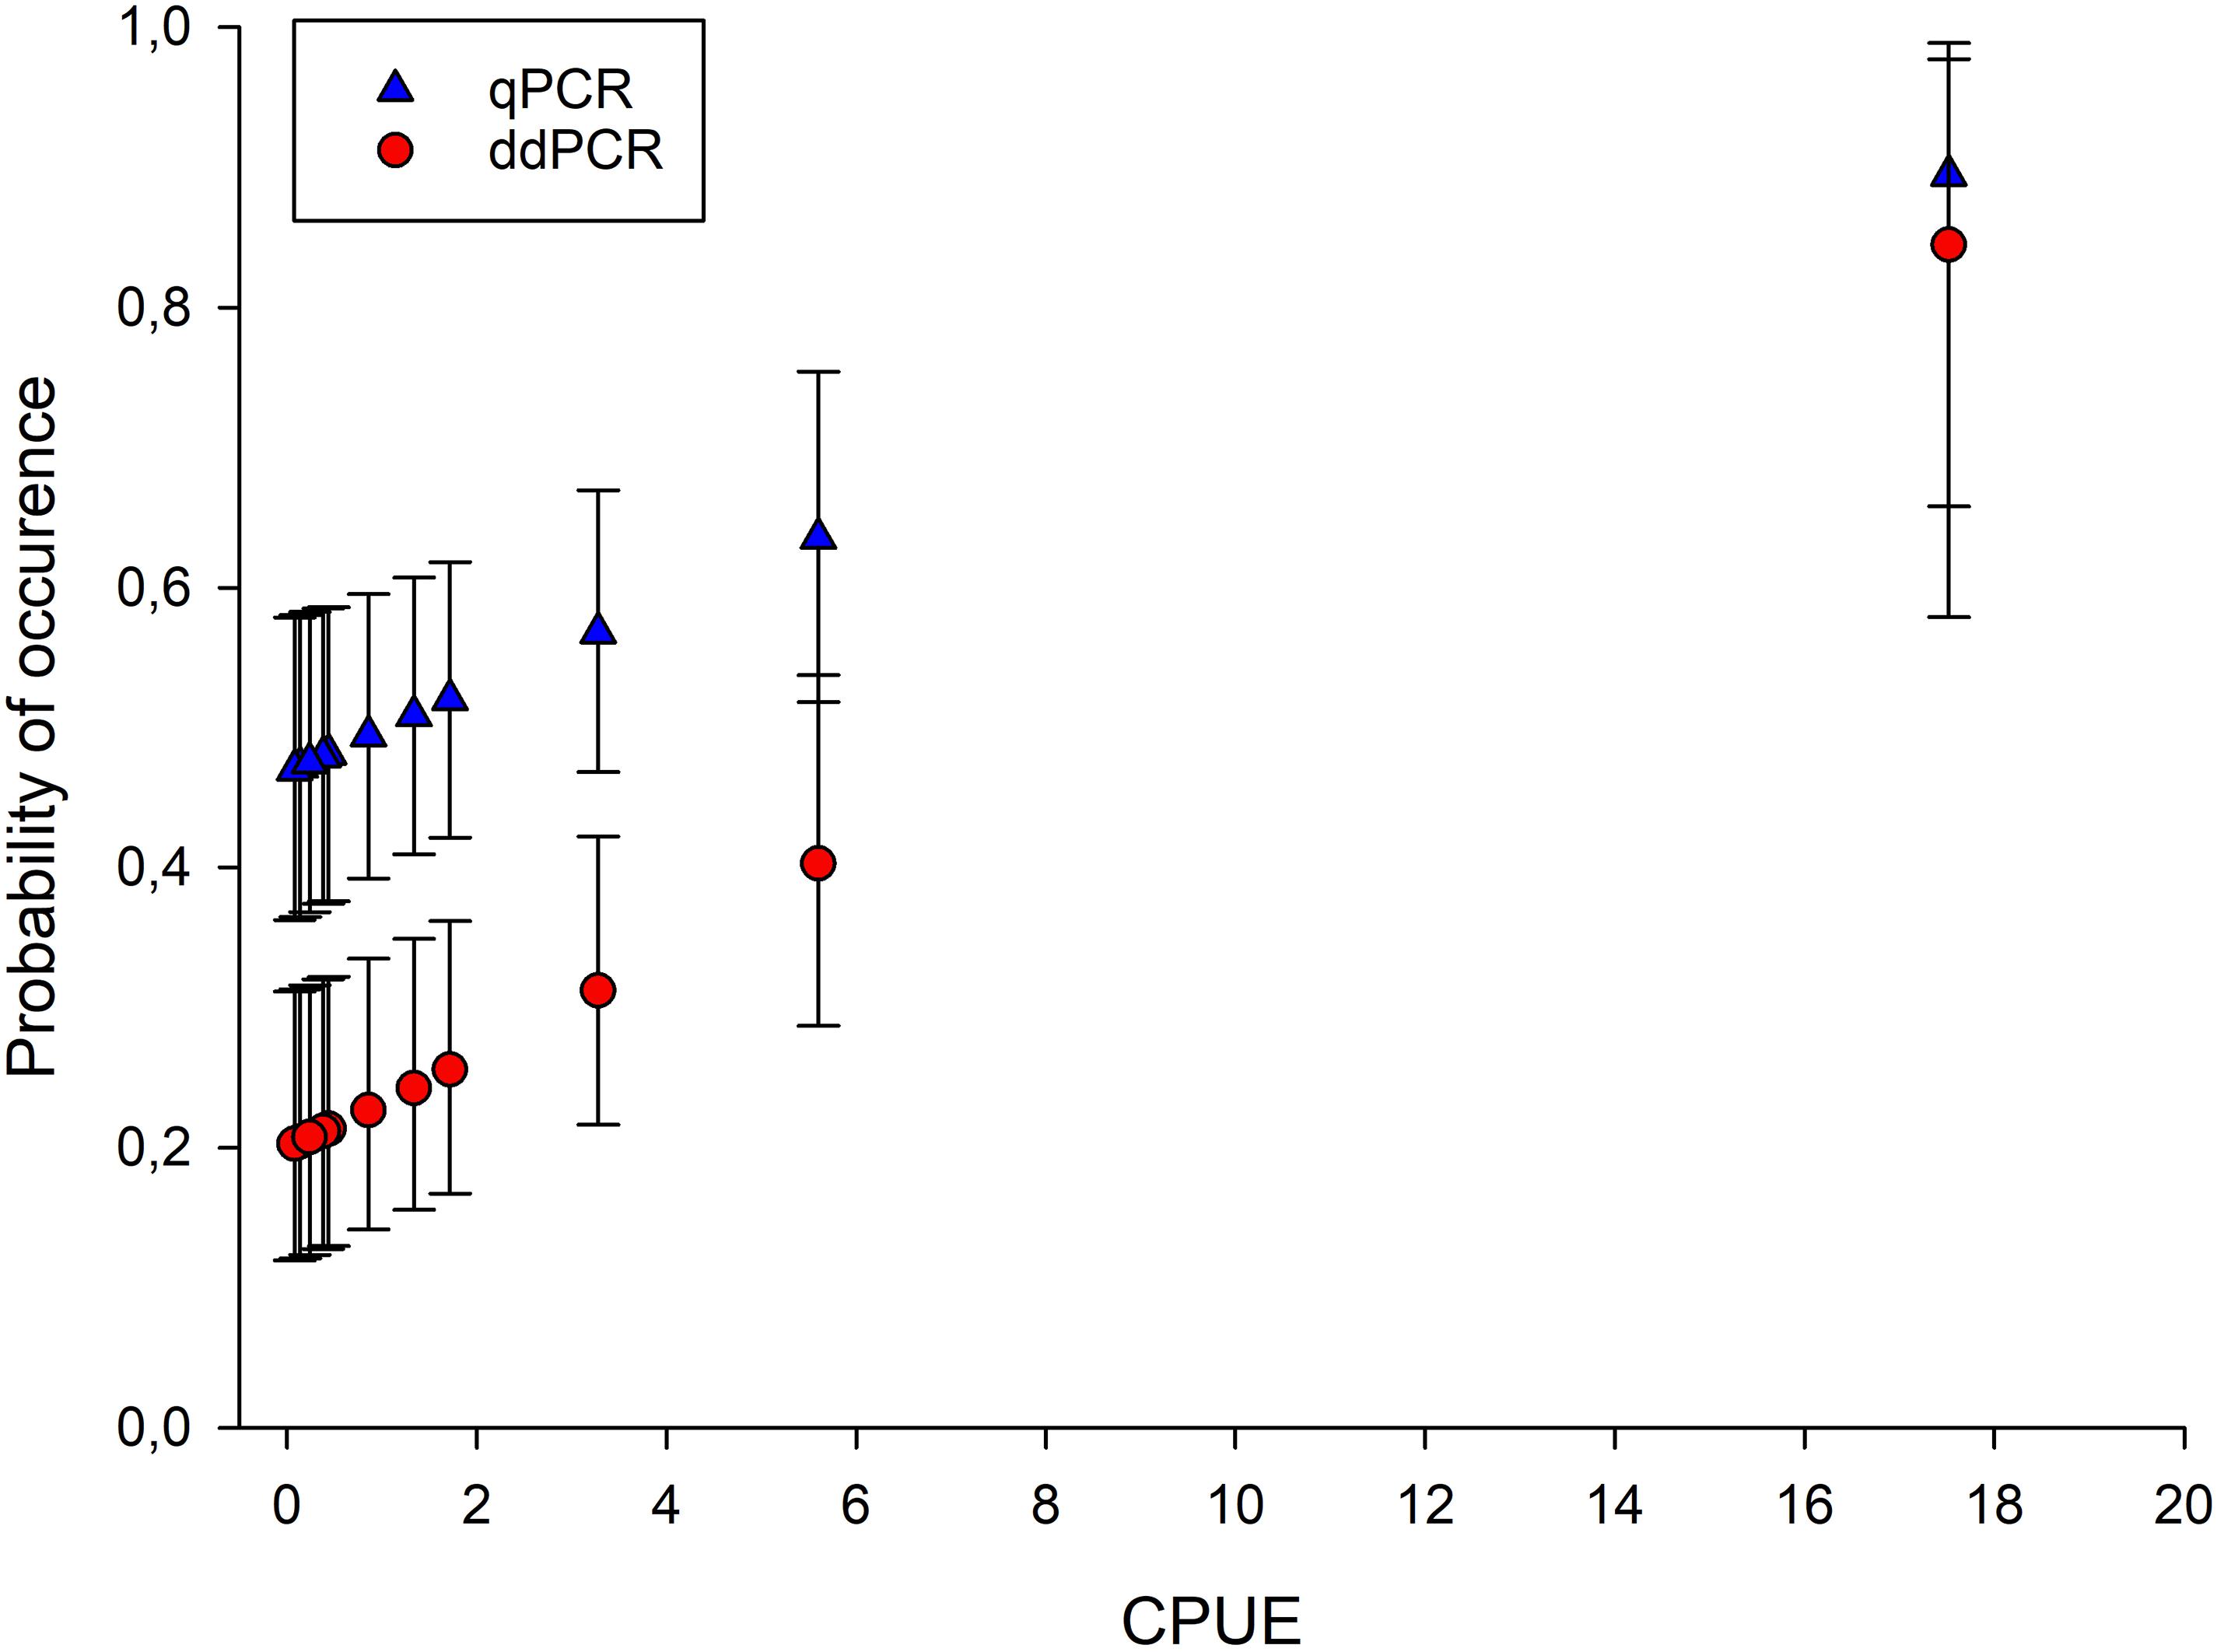
Figure 6. The estimated probability of eDNA occurrence in water samples (θ) using occupancy models where the probability of eDNA occurrence in lakes was assumed to be constant, the conditional probability of eDNA occurrence in water samples was assumed to be a function of CPUE and the conditional probability of eDNA detection in PCR replicate was assumed to be constant.
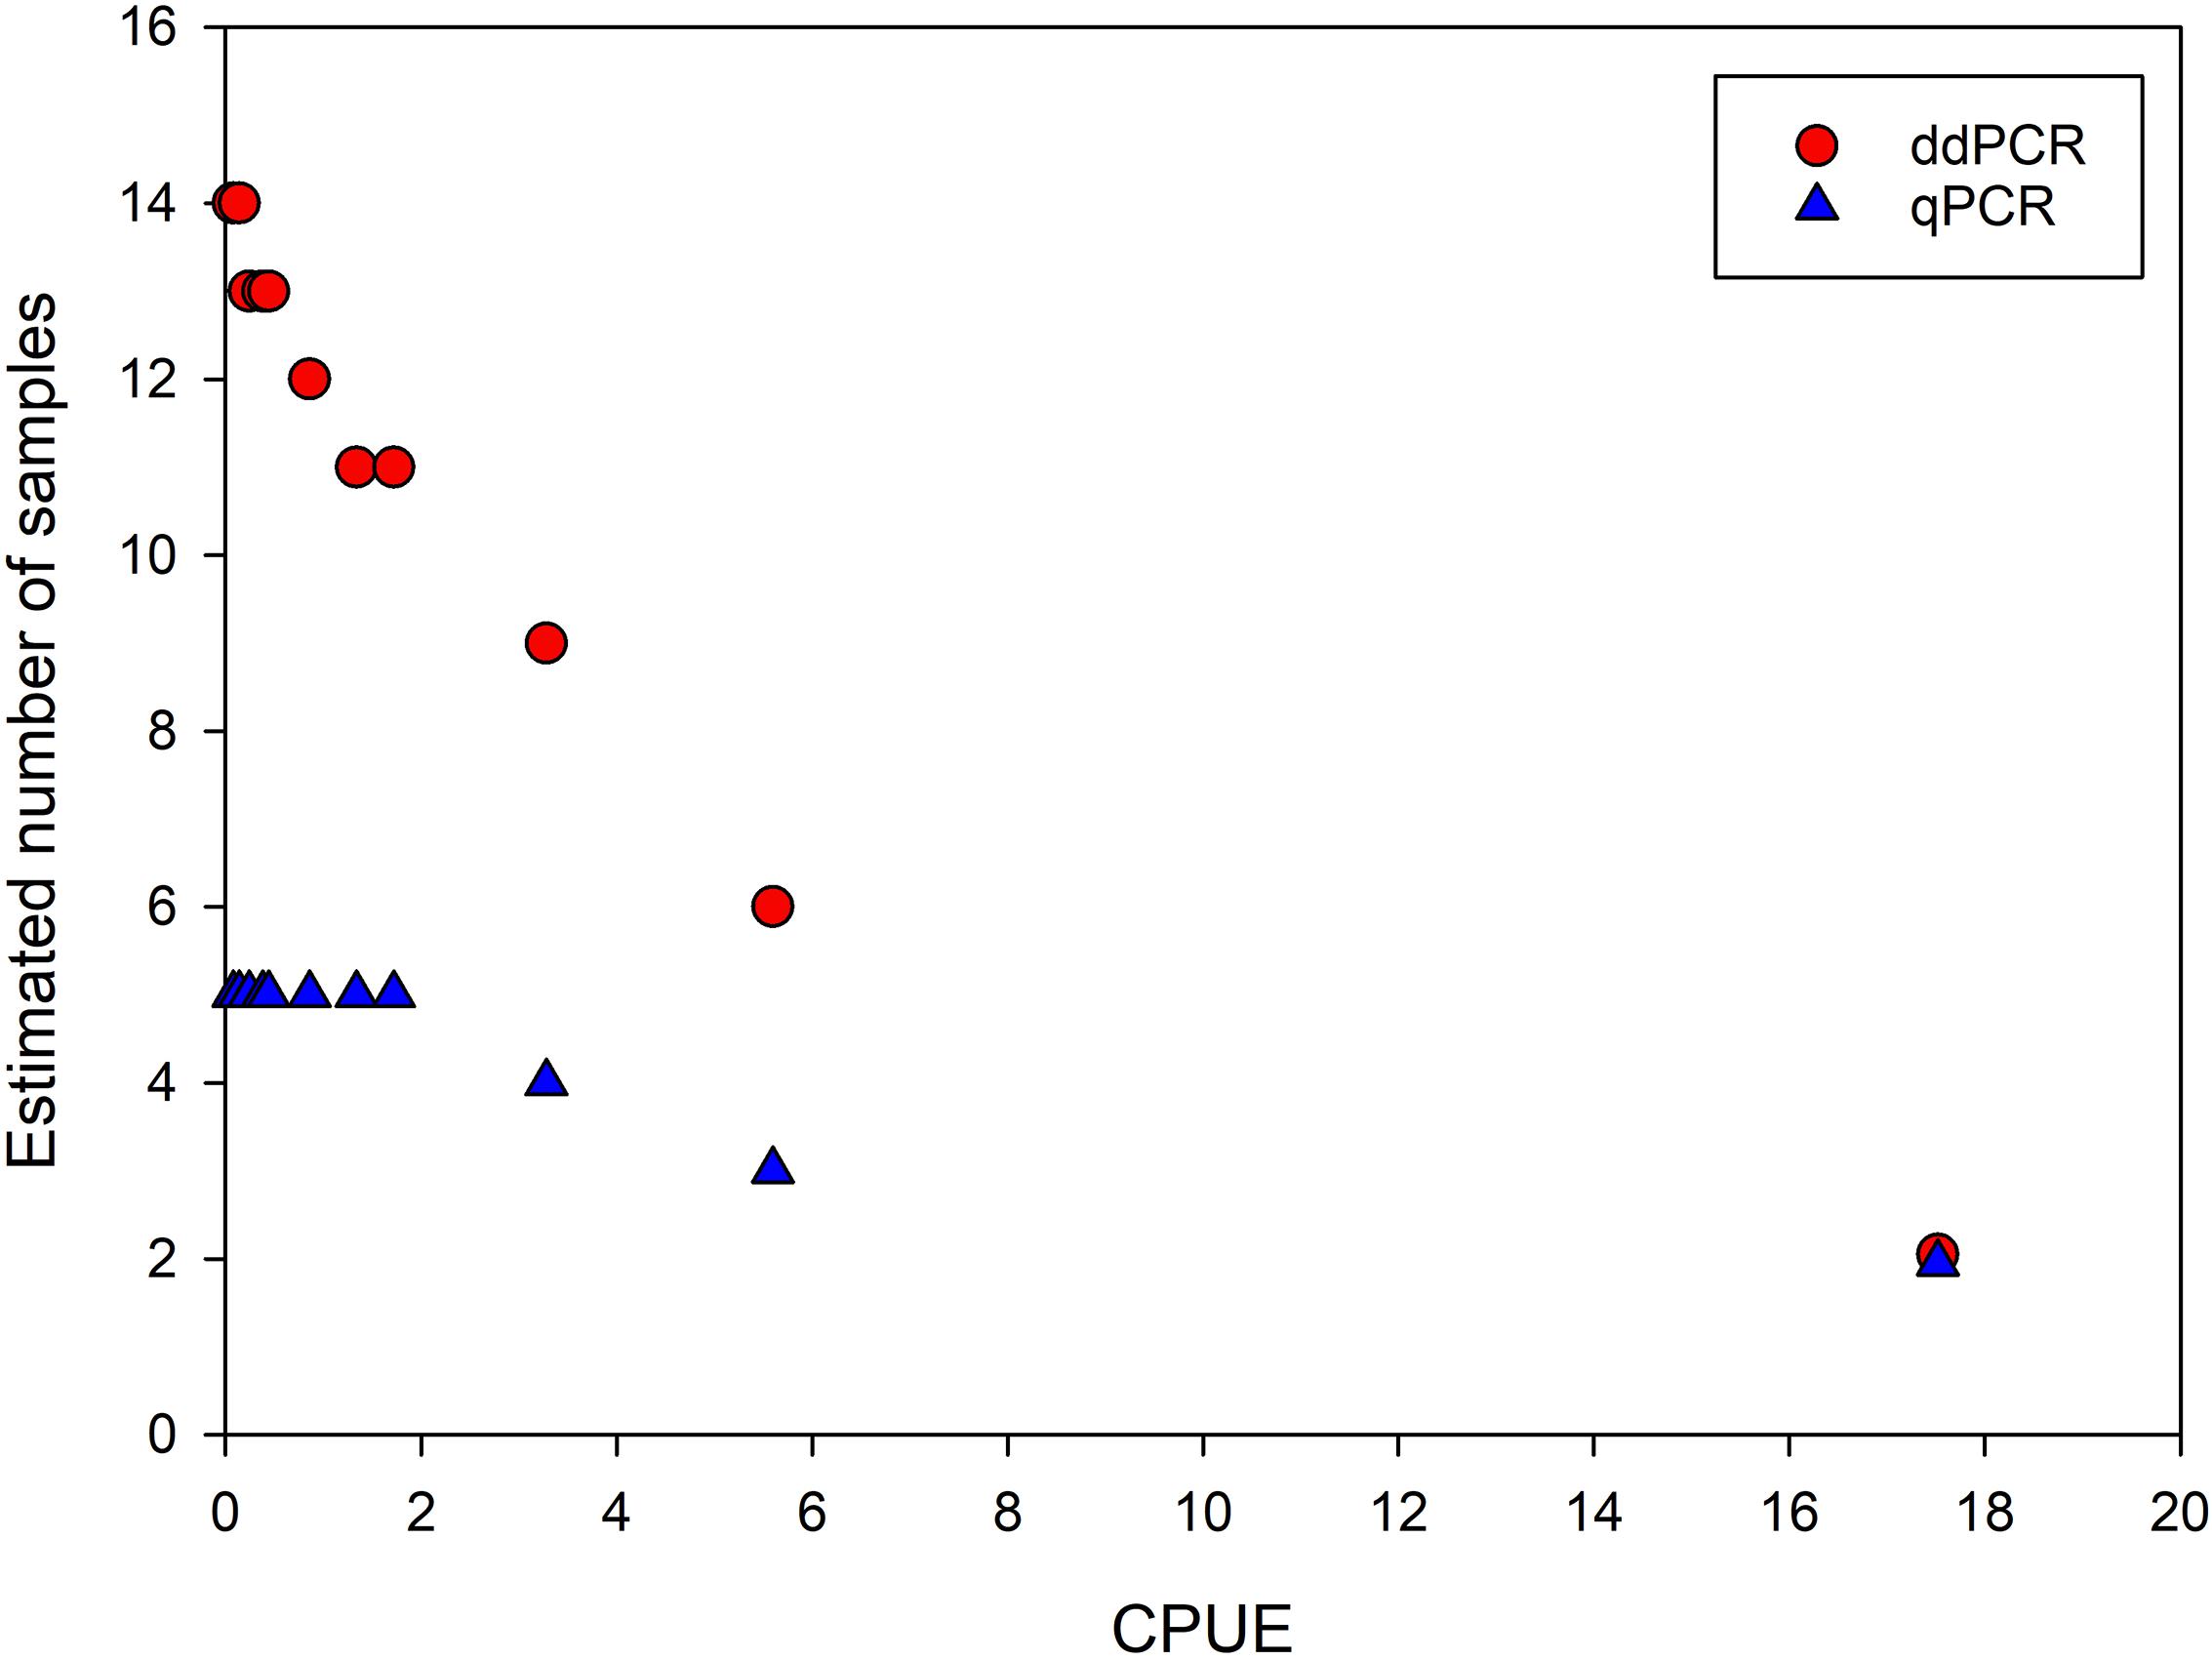
Figure 7. Estimated number of water samples needed to achieve 95% detection likelihood at different relative densities of crayfish (CPUE) for qPCR and ddPCR.
Relative Density of Crayfish Compared to eDNA Copy Numbers
The copy numbers estimated from the qPCR and ddPCR reactions in our study were very low and most of the numbers were below the LOQ (Figure 3). The estimated DNA copy numbers that are below LOQ are unreliable due to high variation when the copy numbers in a sample are low, and thus not suitable for statistical analysis. However, it is not uncommon to see studies where eDNA copy numbers calculated below LOQ are correlated with density (or biomass) estimates. We did a correlation test (spearman) in order to compare DNA concentration in water (DNA copies per liter) to relative density of crayfish (CUPE), and the test showed a very weak positive correlation between eDNA concentrations and CPUE data, both for qPCR and ddPCR results (Figure 8). This result is highly uncertain and interpreted with great caution.
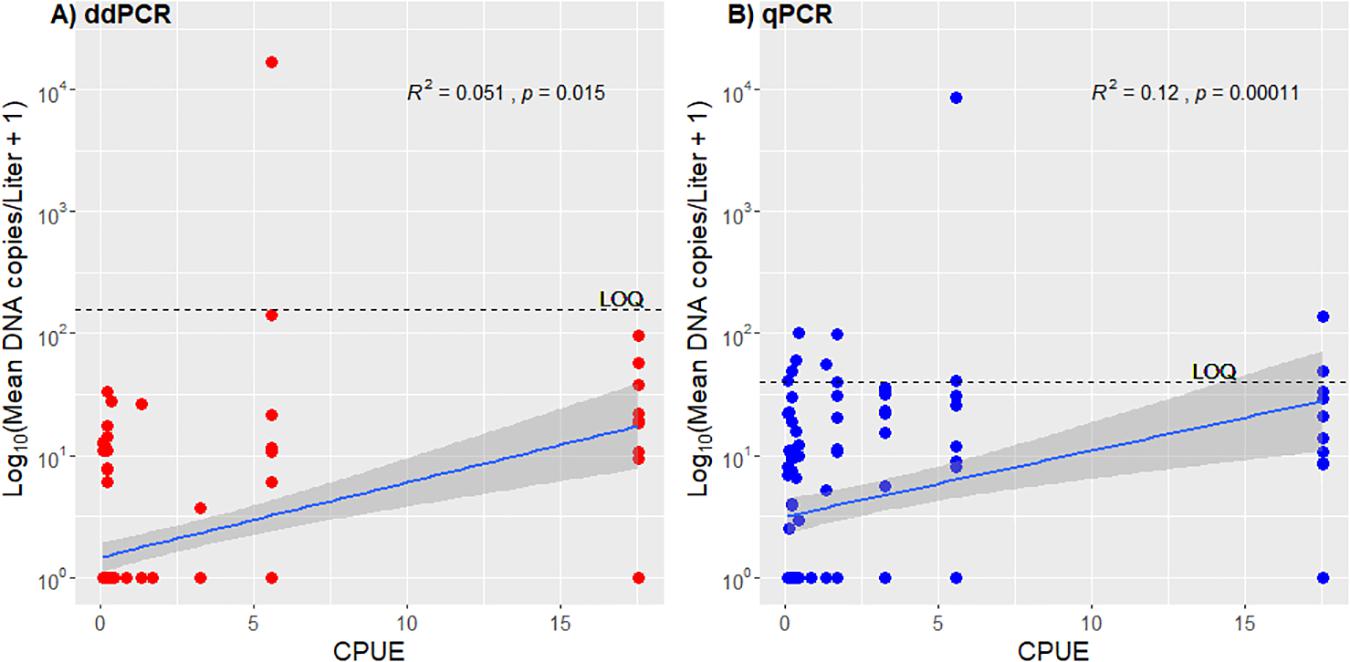
Figure 8. (A) A scatterplot with correlation (Spearman) of the mean DNA copies per liter for each sample from ddPCR plotted against CPUE of crayfish. The horizontal line indicates the LOQ of ddPCR adapted to fit the copies per liter values. (B) A scatter plot with correlation (Spearman) of the mean DNA copies per liter for each sample from qPCR plotted against CPUE of crayfish. The horizontal line indicates the LOQ of qPCR adapted to fit the copies per liter values.
Discussion
Populations of native European noble crayfish are currently being lost at an alarming rate, largely because of North-American invasive crayfish that carry and transmit the crayfish plague pathogen (Holdich et al., 2009; Kouba et al., 2014). There is therefore an urgent need for better, powerful and dedicated conservation and management strategies. This requires solutions derived from understanding, knowledge and measures related to biology, socioeconomics and legal frameworks. Here, efficient monitoring strategies play a key role. In the past decade, eDNA monitoring has emerged as a promising, cost-effective tool for monitoring of endangered and invasive species (Jerde et al., 2011; Lodge et al., 2012) and disease pathogens (Strand et al., 2011, 2014; Gomes et al., 2017) with the potential to simplify and streamline species surveillance (Kelly et al., 2014; Leese et al., 2016). High expectations have been connected to eDNA data as predictors for species distribution, relative density and biomass estimates (Bohmann et al., 2014; Kelly et al., 2014; Doi et al., 2017). However, with the growing body of reports and research, the first optimistic prospects regarding the applicability of eDNA prediction have encountered reality, turning out to vary for different groups of organisms, habitats and choice of methods. Several proof-of-concept studies have shown that eDNA monitoring yields adequate presence-absence and distribution data for crayfish, with a high potential for crayfish surveillance. But, in contrast to some studies focusing on fish (Lacoursière-Roussel et al., 2016; Doi et al., 2017), there are so far few if any studies on crayfish that have established a convincing quantitative relationship between eDNA concentrations in the water and crayfish biomass or density. We have systematically compared traditional trapping methods and eDNA monitoring with a thorough sampling effort. In concordance with other studies (Dougherty et al., 2016; Cai et al., 2017; Larson et al., 2017; Strand et al., 2019; Troth et al., 2020), our results support the assumption that eDNA yields valid presence-absence data, even at very low population densities. However, lakes with low-density crayfish populations require higher sampling effort than commonly used in comparable studies and monitoring programs. We found that the probability of detecting noble crayfish from eDNA samples increased with increasing relative crayfish densities, corroborating similar studies (Dougherty et al., 2016; Larson et al., 2017). However, no significant correlation between noble crayfish eDNA concentrations in the water and relative crayfish density could be established. Thus, our eDNA data does not support the hypothesis that eDNA concentrations can predict relative crayfish density.
Efficiency for eDNA Detection of Noble Crayfish – qPCR Versus ddPCR
It is commonly reported that ddPCR overcomes the challenges connected to inhibitory substances to a higher extent than qPCR, and displays both higher sensitivity and higher quantification accuracy (Dingle et al., 2013; Rački et al., 2014; Zhao et al., 2016), and several studies have highlighted the benefits of ddPCR for eDNA detection (e.g., Doi et al., 2015a; Hunter et al., 2017; Hamaguchi et al., 2018; Mauvisseau et al., 2019a; Brys et al., 2020). However, while ddPCR offers absolute quantification, the variation in estimated copy numbers increases at low numbers, therefore the LOQ of ddPCR is often within the same range as LOQ for qPCR (Dobnik et al., 2015). In our study, the estimated LOQ for qPCR was lower than for ddPCR applying a RSD of 25% for estimated copy numbers. While we observed similar detection sensitivity for qPCR and ddPCR on DNA extracted from crayfish tissue, we had lower detection sensitivity for ddPCR compared to qPCR for the eDNA samples. This contrasts other studies where ddPCR appears to be more sensitive than qPCR for eDNA detection (e.g., Doi et al., 2015b; Hamaguchi et al., 2018; Mauvisseau et al., 2019a; Wood et al., 2019; Brys et al., 2020). In some eDNA samples we observed a reduced amplitude for the ddPCR indicating some inhibition. Although ddPCR is robust against inhibition, high concentrations of PCR inhibitors like humic acids may also inhibit ddPCR. Several qPCR mastermixes are robust against inhibition, including Taqman Environmental Mastermix 2.0 (Strand et al., 2011; Uchii et al., 2019). Thus, the type of qPCR mastermix and its ability to deal with inhibition will highly influence the results in a comparison to ddPCR. Strand et al. (2011) found that Taqman Environmental Mastermix removed close to 100% of the observed inhibition in DNA extracts for different natural water samples including water with high content of humic substances. For ddPCR, we experienced that the relevant ddPCR chemistry (Bio-Rad) had no specific mastermix developed to deal with inhibitory substances in the ddPCR other than the inherent property of ddPCR (partitioning the samples into droplets), making it less sensitive to inhibition. Since noble crayfish habitats in the Northern countries commonly are within or in close vicinity to boreal coniferous forests, the water is commonly rich in humic substances. We believe this could have negatively influenced the detectability for ddPCR in this study. Though we did not include an internal PCR control (IPC), it would be beneficial to use in this type of comparison (Goldberg et al., 2016).
eDNA Detection Probability Compared to Crayfish Population Density
While we reliably detected noble crayfish eDNA in all localities with very low crayfish densities, the detection frequency was often very low. To achieve a 95% detection likelihood, low-density lakes required an estimated five filter samples, corresponding to ∼25 L of water. Thus, the anecdotal “cup of water” (Lodge et al., 2012) or rapid, low-volume sample effort seems insufficient for monitoring low-density crayfish populations. Many other studies have also reported successful eDNA detection of freshwater crayfish at very low densities (Dougherty et al., 2016; Larson et al., 2017; Strand et al., 2019), but often with low detection frequency. Poor detection efficiency can in some studies also be associated with very small water volumes per sample (Tréguier et al., 2014; Dougherty et al., 2016) or the use of ethanol precipitation instead of filtration, which has been shown to be less efficient (Spens et al., 2016; Hinlo et al., 2017; Troth et al., 2020). For several crayfish eDNA studies, consistent comparisons to CPUE data are also deficient or missing (Agersnap et al., 2017; Harper et al., 2018; Mauvisseau et al., 2018; Rusch et al., 2020).
Environmental DNA detection frequency compared to CPUE data, and occupancy modeling, clearly shows a correlation between the eDNA detection probability and crayfish population densities. Very low densities required high sampling effort while the few monitored high-density lakes had a very high detection frequency and required only two samples for a 95% detection probability. Dougherty et al. (2016) also observed that the eDNA detection probability increased with crayfish population density. However, they also found that a cumulative probability of 95% varies with water clarity, where an increase in Secchi disk values drastically lowered the detection probability of Faxonius rusticus eDNA. Rice et al. (2018) found poor relationship between Faxonius eupunctus eDNA-detection probability and crayfish density in a large river system. Instead, they showed a strong relationship between eDNA detection probability and upstream river distance, implying that the probability of detecting F. eupunctus eDNA increased downstream. Downstream eDNA transport may therefore increase the detection probability more than the crayfish population density at the sampling site.
eDNA Concentrations Compared to Observed Relative Density of Noble Crayfish
Stewart (2019) emphasizes that the factors influencing both the eDNA sources (amount of eDNA released from focal taxa) and eDNA sinks (removal of eDNA from the environment) for individual species and aquatic habitats, are manifold and complex, both in space and time. Meaningful comparisons between eDNA concentrations and species density will therefore depend on in-depth knowledge of species biology and habitat, combined with complex modeling (Stewart, 2019). A prerequisite is nevertheless a minimum of correlation in eDNA concentration and density of the target species. We aimed to explore whether eDNA concentrations in the water correlate with observed relative density of noble crayfish. However, even at the highest noble crayfish densities we had very few samples where the eDNA copy number exceeded the LOQ both for qPCR data and for ddPCR data. If the highly uncertain DNA copy numbers obtained below the LOQ are plotted against CPUE, a weak positive correlation is found. Also in other studies where a week positive correlation between eDNA concentrations and crayfish density estimates is observed (Dougherty et al., 2016; Cai et al., 2017; Larson et al., 2017), the eDNA data is rarely above what would be the recommended LOQ (Klymus et al., 2020). Such data must be interpreted with great caution, and we argue that our data is not suited for statistical correlations between eDNA concentrations and relative density of noble crayfish. With our rather intensive sample effort in terms of sample replicates and water volumes, our study is a strong documentation on the missing correspondence between noble crayfish density and noble crayfish eDNA concentrations in the water, at least for the time-window where we did the sampling.
Several factors contribute to why crayfish eDNA copy number is a poor predictor of crayfish density. Abiotic and environmental factors (Stewart, 2019) combined with persistence and degradation of eDNA in the lake (Dejean et al., 2011; Barnes et al., 2014) are universal challenges in eDNA studies. High water flow, heavy rain, clay particles and water turbidity reduce the eDNA detection likelihood (Roussel et al., 2015; Dougherty et al., 2016), which probably explains our failure to detect noble crayfish eDNA after heavy rainfall in one of the lakes. Sampling techniques of crayfish eDNA, including choices of season, depths, volume and filters, and downstream choices of molecular techniques, and ultimately LOD/LOQ stringency, also impact on the results (Hinlo et al., 2017; Hunter et al., 2017, 2019; Strand et al., 2019; Klymus et al., 2020; Troth et al., 2020). Our results might also be prone to downstream analytical issues, e.g., a recent report found that using the same filter type, but a different DNA extraction procedure than we used increases DNA yield and detectability of crayfish and fish eDNA (Fossøy et al., 2020).
Biotic factors, such as seasonality, life cycle and behavioral traits of crayfish (Dunn et al., 2017; Stewart, 2019) are particularly important in the context of why crayfish eDNA concentrations seemingly correlate poorly with crayfish densities. Many biological features might impede eDNA detectability of crayfish compared to for example fish, where correlations between population density and eDNA concentrations are seen (e.g., Doi et al., 2017; Salter et al., 2019; Stewart, 2019). A recent study report from Norway found significantly more DNA from fish compared to crayfish in the same eDNA samples (Fossøy et al., 2020). Crayfish commonly stay buried or hide under rocks during daytime, and their hard carapace emits little if any superfluous mucus or epidermal cells, suggesting reduced emission of DNA to the ambient water compared to many other aquatic organisms (Dougherty et al., 2016; Forsström and Vasemägi, 2016; Mauvisseau et al., 2019b). Spawning and reproduction events are known to increase eDNA signals markedly from aquatic species groups such as fish and amphibians (Stewart, 2019 and references therin). For crayfish, molting periods and spawning periods with elevated aggressive behavior (Moore, 2007), have been found to elevate DNA copy numbers in the water column (Dunn et al., 2017; Laurendz, 2017; Harper et al., 2018). In tank experiments, Dunn et al. (2017) found a correlation between eDNA concentration and abundance of egg-bearing females. Thus, the ovigerous period in the late autumn could be a good period for eDNA correlations to crayfish density. However, in cooler climate such as the Nordic countries, the proportion of egg-bearing females may vary considerably annually, both between and within populations (Taugbøl et al., 1988), which may bias the results. Furthermore, if trying to compare eDNA concentrations and CPUE data during the ovigerous period, possible correlations will probably be biased, as both low temperatures and trap avoidance from berried females will affect the catches (Abrahamsson, 1983). Nevertheless, compared to relatively short-term molting and reproduction events, the relatively long-lasting ovigerous period may at least be a recommendable period for eDNA sampling for confirming presence/absence of freshwater crayfish. In our study, we monitored the crayfish after the molting season and prior to the reproduction- and ovigerous season. In this respect, we might have selected a time window that was recommendable for achieving CPUE data that takes the crayfish biological needs into account, but where crayfish eDNA shedding from the crayfish population was very low.
The Use of eDNA in Monitoring and Conservation of Freshwater Crayfish
Environmental DNA methods are moving toward the stage of being ready for, and sometimes also employed for, biodiversity inventories and monitoring of native or invasive species (Leese et al., 2016; Stewart, 2019; Sepulveda et al., 2020). In Norway, comparative data obtained with eDNA monitoring and traditional methods (cages and trapping) of native noble crayfish, introduced signal crayfish and the crayfish plague pathogen A. astaci, convinced the authorities to include eDNA as a monitoring method (Strand et al., 2019). In 2016, eDNA was officially integrated into the national crayfish plague monitoring program commissioned by the National Food Safety Authorities (Vrålstad et al., 2017), and replaced a controversial cage-surveillance strategy with live, naïve noble crayfish for the monitoring of crayfish plague from 2017 and onward. From 2018, the national surveillance program on noble crayfish also included eDNA monitoring methods, both for noble crayfish and the invasive signal crayfish. With an integrated synergistic approach, including joint fieldwork and sharing of results, the two monitoring programs now focus on the pathogen (A. astaci), and its hosts and carriers [noble crayfish and signal crayfish, see Johnsen et al. (2019)], resulting in a more holistic monitoring approach for noble crayfish and its threats.
Monitoring programs are usually put out to tender, which to varying degrees request and emphasize competence and quality versus costs. If cost-effectiveness is regarded as important, compromises with the number of samples, water volumes and number of sites must often be made to deliver a competitive offer. Consequently, the monitoring programs might not be able to afford a sufficient sampling effort that ensures high probability of detection at very low densities of crayfish, or any other rare or elusive target organism. eDNA monitoring is often promoted as a cost-saving method. These savings might be at the expense of precision and the ability to provide reliable presence-absence data. In cases where the sampling effort is deficient, it must be expected that the absence data covers a large portion of false negatives, and that the prospects of uncovering rare threatened species or the early invasion phase of invasive species will diminish. It is therefore of great importance to develop smarter sampling methods, identify time windows for sampling with elevated eDNA detection probabilities, identify the molecular methods recovering the highest eDNA concentrations from various environmental samples, and at the same time build up acceptance and understanding among the stakeholders and authorities that quality and reliability come at a cost. Saving Europe’s crustaceans, cannot be achieved by saving money on insufficient and cost-effective eDNA sampling strategies.
Conclusion
The use of eDNA in ecological research, monitoring and conservation has grown tremendously in recent years. However, there are several scientists requesting a more balanced appreciation of this method’s strengths and limitations (Thomsen and Willerslev, 2015; Cristescu and Hebert, 2018; Beng and Corlett, 2020). Among the several mentioned aspects requiring more examination is the use of eDNA concentrations to predict relative density or biomass of species (Beng and Corlett, 2020). We found no evidence for a correlation between eDNA concentrations and relative crayfish density with the chosen methods for field sampling, DNA extraction protocol and period of sampling. Combined with previous studies, it seems increasingly clear that eDNA concentrations of a target species cannot replace CPUE data or serve as a proxy for relative crayfish density estimates. Conventional methods are still needed to monitor changes in population size and densities over time, and for providing additional information on length and weight distribution, sex ratio, fecundity, and maturation. However, as eDNA monitoring has proven to detect crayfish reliably even at very low densities, this method is a powerful supplement to monitor the presence or absence of crayfish in a larger number of localities than feasible with the traditional trapping methods. If the eDNA samples are exploited for the monitoring of multiple target species, for example alien crayfish species and diseases that threaten the native crayfish species (Strand et al., 2019; Rusch et al., 2020) it is also possible to implement a more holistic and cost-efficient monitoring approach.
Data Availability Statement
The datasets presented in this study can be found in the Supplementary Material as dataset 1–3.
Author Contributions
DS, SJ, and TV: conception and design of the study. DS, SJ, and JR: carried out the fieldwork. DS and JR: molecular methods development, analyses, and results. DS and SJ: statistics and drafting of the manuscript. All authors contributed to content, editing of the manuscript, and approved the final version.
Funding
This work was funded by the Norwegian Research Council through the project “Targeted strategies for safeguarding the noble crayfish against alien and emerging threats” (TARGET; NFR-243907), the Norwegian Veterinary Institute, the Norwegian Institute for Nature Research, and the Norwegian Environmental Agency.
Conflict of Interest
The authors declare that the research was conducted in the absence of any commercial or financial relationships that could be construed as a potential conflict of interest.
Acknowledgments
We thank Bjørn Spilsberg for help with ddPCR troubleshooting, and Frode Fossøy and Brett K. Sandercock for help with occupancy modeling.
Supplementary Material
The Supplementary Material for this article can be found online at: https://www.frontiersin.org/articles/10.3389/fenvs.2020.612253/full#supplementary-material
References
Abrahamsson, S. (1983). Trappabillity, locomotion, and diel pattern of activity of the crayfish Astacus astacus and Pacifastacus leniusculus Dana. Freshw. Crayfish 5, 239–253.
Ackefors, H. (1998). The culture and capture crayfish fisheries in Europe. World Aquac. Magaz. 29, 18–67.
Agersnap, S., Larsen, W. B., Knudsen, S. W., Strand, D., Thomsen, P. F., Hesselsøe, M., et al. (2017). Monitoring of noble, signal and narrow-clawed crayfish using environmental DNA from freshwater samples. PLoS One 12:e0179261. doi: 10.1371/journal.pone.0179261
Barnes, M. A., Turner, C. R., Jerde, C. L., Renshaw, M. A., Chadderton, W. L., and Lodge, D. M. (2014). Environmental conditions influence eDNA persistence in aquatic systems. Environ. Sci. Technol. 48, 1819–1827. doi: 10.1021/es404734p
Beng, K. C., and Corlett, R. T. (2020). Applications of environmental DNA (eDNA) in ecology and conservation: opportunities, challenges and prospects. Biodivers. Conserv. 29, 2089–2121. doi: 10.1007/s10531-020-01980-1980
Berdal, K., Bøydler, C., Tengs, T., and Holst-Jensen, A. (2008). A statistical approach for evaluation of PCR results to improve the practical limit of quantification (LOQ) of GMO analyses (SIMQUANT). Eur. Food Res. Technol. 227, 1149–1157. doi: 10.1007/s00217-008-0830-831
Bohmann, K., Evans, A., Gilbert, M. T. P., Carvalho, G. R., Creer, S., Knapp, M., et al. (2014). Environmental DNA for wildlife biology and biodiversity monitoring. Trends Ecol. Evol. 29, 358–367. doi: 10.1016/j.tree.2014.04.003
Brys, R., Halfmaerten, D., Neyrinck, S., Mauvisseau, Q., Auwerx, J., Sweet, M., et al. (2020). Reliable eDNA detection and quantification of the European weather loach (Misgurnus fossilis). J. Fish Biol. 1–16. doi: 10.1111/jfb.14315
Bylemans, J., Gleeson, D. M., Duncan, R. P., Hardy, C. M., and Furlan, E. M. (2019). A performance evaluation of targeted eDNA and eDNA metabarcoding analyses for freshwater fishes. Environ. DNA 1, 402–414. doi: 10.1002/edn3.41
Cai, W., Ma, Z., Yang, C., Wang, L., Wang, W., Zhao, G., et al. (2017). Using eDNA to detect the distribution and density of invasive crayfish in the Honghe-Hani rice terrace World Heritage site. PLoS One 12:e0177724. doi: 10.1371/journal.pone.0177724
Capo, E., Spong, G., Norman, S., Königsson, H., Bartels, P., and Byström, P. (2019). Droplet digital PCR assays for the quantification of brown trout (Salmo trutta) and Arctic char (Salvelinus alpinus) from environmental DNA collected in the water of mountain lakes. PLoS One 14:226638. doi: 10.1371/journal.pone.0226638
Creed, R. P. (1994). Direct and indirect effects of crayfish grazing in a stream community. Ecology 75, 2091–2103. doi: 10.2307/1941613
Cristescu, M. E., and Hebert, P. D. N. (2018). Uses and misuses of environmental DNA in biodiversity science and conservation. Ann. Rev. Ecol. Evol. Syst. 49, 209–230. doi: 10.1146/annurev-ecolsys-110617-162306
Deiner, K., Bik, H. M., Machler, E., Seymour, M., Lacoursière-Roussel, A., Altermatt, F., et al. (2017). Environmental DNA metabarcoding: transforming how we survey animal and plant communities. Mol. Ecol. 26, 5872–5895. doi: 10.1111/mec.14350
Dejean, T., Valentini, A., Duparc, A., Pellier-Cuit, S., Pompanon, F., Taberlet, P., et al. (2011). Persistence of environmental DNA in freshwater ecosystems. PLoS One 6:e023398. doi: 10.1371/journal.pone.0023398
Dejean, T., Valentini, A., Miquel, C., Taberlet, P., Bellemain, E., and Miaud, C. (2012). Improved detection of an alien invasive species through environmental DNA barcoding: the example of the American bullfrog Lithobates catesbeianus. J. Appl. Ecol. 49, 953–959. doi: 10.1111/j.1365-2664.2012.02171.x
Demeke, T., and Dobnik, D. (2018). Critical assessment of digital PCR for the detection and quantification of genetically modified organisms. Analyt. Bioanalyt. Chem. 410, 4039–4050. doi: 10.1007/s00216-018-1010-1011
Dingle, T. C., Sedlak, R. H., Cook, L., and Jerome, K. R. (2013). Tolerance of droplet-digital PCR vs real-time quantitative PCR to inhibitory substances. Clin. Chem. 59, 1670–1672. doi: 10.1373/clinchem.2013.211045
Dobnik, D., Spilsberg, B., Kosir, A. B., Holst-Jensen, A., and Zel, J. (2015). Multiplex quantification of 12 European union authorized genetically modified maize lines with droplet digital polymerase chain reaction. Analyt. Chem. 87, 8218–8226. doi: 10.1021/acs.analchem.5b01208
Doi, H., Inui, R., Akamatsu, Y., Kanno, K., Yamanaka, H., Takahara, T., et al. (2017). Environmental DNA analysis for estimating the abundance and biomass of stream fish. Freshw. Biol. 62, 30–39. doi: 10.1111/fwb.12846
Doi, H., Takahara, T., Minamoto, T., Matsuhashi, S., Uchii, K., and Yamanaka, H. (2015a). Droplet digital polymerase chain reaction (PCR) outperforms real-time PCR in the Detection of environmental DNA from an invasive fish species. Environ. Sci. Technol. 49, 5601–5608. doi: 10.1021/acs.est.5b00253
Doi, H., Uchii, K., Takahara, T., Matsuhashi, S., Yamanaka, H., and Minamoto, T. (2015b). Use of droplet digital PCR for estimation of fish abundance and biomass in environmental DNA surveys. PLoS One 10:e0122763. doi: 10.1371/journal.pone.0122763
Dorazio, R. M., and Erickson, R. A. (2018). Ednaoccupancy: an r package for multiscale occupancy modelling of environmental DNA data. Mol. Ecol. Resour. 18, 368–380. doi: 10.1111/1755-0998.12735
Dougherty, M. M., Larson, E. R., Renshaw, M. A., Gantz, C. A., Egan, S. P., Erickson, D. M., et al. (2016). Environmental DNA (eDNA) detects the invasive rusty crayfish Orconectes rusticus at low abundances. J. Appl. Ecol. 53, 722–732. doi: 10.1111/1365-2664.12621
Dunn, N., Priestley, V., Herraiz, A., Arnold, R., and Savolainen, V. (2017). Behavior and season affect crayfish detection and density inference using environmental DNA. Ecol. Evol. 7, 7777–7785. doi: 10.1002/ece3.3316
Edsman, L., Füreder, L., Gherardi, F., and Souty-Grosset, C. (2010). Astacus astacus. IUCN Red List Threat. Spec. 2010:e.T2191A9338388.
Forsström, T., and Vasemägi, A. (2016). Can environmental DNA (eDNA) be used for detection and monitoring of introduced crab species in the Baltic Sea? Mar. Pollut. Bull. 109, 350–355. doi: 10.1016/j.marpolbul.2016.05.054
Fossøy, F., Strand, D. A., Sandercock, B. K., and Johnsen, S. I. (2020). Environmental DNA: Comparison of Sampling Methodology and Laboratory Analysis for Detection of Crayfish and Fish in Freshwater. NINA Report 1778, Norway: Norwegian Institute for Nature Research.
Goldberg, C. S., Turner, C. R., Deiner, K., Klymus, K. E., Thomsen, P. F., Murphy, M. A., et al. (2016). Critical considerations for the application of environmental DNA methods to detect aquatic species. Methods Ecol. Evol. 7, 1299–1307. doi: 10.1111/2041-210x.12595
Gomes, G. B., Hutson, K. S., Domingos, J. A., Chung, C., Hayward, S., Miller, T. L., et al. (2017). Use of environmental DNA (eDNA) and water quality data to predict protozoan parasites outbreaks in fish farms. Aquaculture 479, 467–473. doi: 10.1016/j.aquaculture.2017.06.021
Goutte, A., Molbert, N., Guérin, S., Richoux, R., and Rocher, V. (2020). Monitoring freshwater fish communities in large rivers using environmental DNA metabarcoding and a long-term electrofishing survey. J. Fish Biol. 97, 444–452. doi: 10.1111/jfb.14383
Hamaguchi, M., Shimabukuro, H., Hori, M., Yoshida, G., Terada, T., and Miyajima, T. (2018). Quantitative real-time polymerase chain reaction (PCR) and droplet digital PCR duplex assays for detecting Zostera marina DNA in coastal sediments. Limnol. Oceanogr. Methods 16, 253–264. doi: 10.1002/lom3.10242
Hänfling, B., Lawson Handley, L., Read, D. S., Hahn, C., Li, J., Nichols, P., et al. (2016). Environmental DNA metabarcoding of lake fish communities reflects long-term data from established survey methods. Mol. Ecol. 25, 3101–3119. doi: 10.1111/mec.13660
Harper, K. J., Anucha, N. P., Turnbull, J. F., Bean, C. W., and Leaver, M. J. (2018). Searching for a signal: environmental DNA (eDNA) for the detection of invasive signal crayfish, Pacifastacus leniusculus (Dana, 1852). Manag. Biol. Invas. 9, 137–148. doi: 10.3391/mbi.2018.9.2.07
Hempel, C. A., Peinert, B., Beermann, A. J., Elbrecht, V., Macher, J.-N., Macher, T.-H., et al. (2020). Using environmental DNA to monitor the reintroduction success of the Rhine sculpin (Cottus rhenanus) in a restored stream. Front. Ecol. Evol. 8:81. doi: 10.3389/fevo.2020.00081
Henriksen, S., and Hilmo, O. (2015). Norsk Rødliste for Arter 2015. Artsdatabanken, Norge. Available online at: https://artsdatabanken.no/Rodliste2015/rodliste2015/Norge/16528 (accessed January 9, 2020).
Hinlo, R., Gleeson, D., Lintermans, M., and Furlan, E. (2017). Methods to maximise recovery of environmental DNA from water samples. PLoS One 12:e0179251. doi: 10.1371/journal.pone.0179251
Holdich, D. M., Reynolds, J. D., Souty-Grosset, C., and Sibley, P. J. (2009). A review of the ever increasing threat to European crayfish from non-indigenous crayfish species. Knowl. Manag. Aquat. Ecosyst. 394–395:11. doi: 10.1051/kmae/2009025
Hunter, M. E., Dorazio, R. M., Butterfield, J. S. S., Meigs-Friend, G., Nico, L. G., and Ferrante, J. A. (2017). Detection limits of quantitative and digital PCR assays and their influence in presence-absence surveys of environmental DNA. Mol. Ecol. Resour. 17, 221–229. doi: 10.1111/1755-0998.12619
Hunter, M. E., Ferrante, J. A., Meigs-Friend, G., and Ulmer, A. (2019). Improving eDNA yield and inhibitor reduction through increased water volumes and multi-filter isolation techniques. Sci. Rep. 9:5259. doi: 10.1038/s41598-019-40977-w
Jerde, C. L., Mahon, A. R., Chadderton, W. L., and Lodge, D. M. (2011). “Sight-unseen” detection of rare aquatic species using environmental DNA. Conserv. Lett. 4, 150–157. doi: 10.1111/j.1755-263X.2010.00158.x
Johnsen, S. I., Skurdal, J., Taugbøl, T., and Garnås, E. (2014). Effect of mesh size on baited trap catch composition for noble crayfish (Astacus Astacus). Knowl. Manag. Aquat. Ecosyst. 413, 1–7. doi: 10.1051/kmae/2014013
Johnsen, S. I., Strand, D. A., Rusch, J., and Vrålstad, T. (2019). National Surveillance of Noble Crayfish and the Spread of Signal Crayfish – Presentation of Surveilance Data and Population Status. NINA Report 1590, Norway: Norwegian Institute for Nature Research.
Johnsen, S. I., and Vrålstad, T. (2017). Noble Crayfish (Astacus astacus) – Scientific Investigation and Proposal for Coordination of the Monitoring Programs for Crayfish and Crayfish Plague. NINA Report 1339, Norway: Norwegian Institute for Nature Research.
Kelly, R. P., Port, J. A., Yamahara, K. M., Martone, R. G., Lowell, N., Thomsen, P. F., et al. (2014). Harnessing DNA to improve environmental management. Science 344, 1455–1456. doi: 10.1126/science.1251156
Klymus, K. E., Merkes, C. M., Allison, M. J., Goldberg, C. S., Helbing, C. C., Hunter, M. E., et al. (2020). Reporting the limits of detection and quantification for environmental DNA assays. Environ. DNA 2, 271–282. doi: 10.1002/edn3.29
Kouba, A., Petrusek, A., and Kozák, P. (2014). Continental-wide distribution of crayfish species in Europe: update and maps. Knowl. Manag. Aquat. Ecosyst. 413:5. doi: 10.1051/kmae/2014007
Lacoursière-Roussel, A., Côté, G., Leclerc, V., and Bernatchez, L. (2016). Quantifying relative fish abundance with eDNA: a promising tool for fisheries management. J. Appl. Ecol. 53, 1148–1157. doi: 10.1111/1365-2664.12598
Laramie, M. B., Pilliod, D. S., and Goldberg, C. S. (2015). Characterizing the distribution of an endangered salmonid using environmental DNA analysis. Biol. Conserv. 183, 29–37. doi: 10.1016/j.biocon.2014.11.025
Larson, E. R., Renshaw, M. A., Gantz, C. A., Umek, J., Chandra, S., Lodge, D. M., et al. (2017). Environmental DNA (eDNA) detects the invasive crayfishes Orconectes rusticus and Pacifastacus leniusculus in large lakes of North America. Hydrobiologia 800, 173–185. doi: 10.1007/s10750-017-3210-3217
Laurendz, C. (2017). Impact of Temperature, Food Availability and Lifehistory Stages on the eDNA Emission from Pacifastacus leniusculus and its obligate parasite Aphanomyces astaci. Master thesis, University of Oslo, Oslo.
Leese, F., Altermatt, F., Bouchez, A., Ekrem, T., Hering, D., Meissner, K., et al. (2016). DNAqua-Net: developing new genetic tools for bioassessment and monitoring of aquatic ecosystems in Europe. Res. Ideas Outcom. 2:e11321. doi: 10.3897/rio.2.e11321
Lodge, D. M., Turner, C. R., Jerde, C. L., Barnes, M. A., Chadderton, L., Egan, S. P., et al. (2012). Conservation in a cup of water: estimating biodiversity and population abundance from environmental DNA. Mol. Ecol. 21, 2555–2558. doi: 10.1111/j.1365-294X.2012.05600.x
Mason, D. H., Dysthe, J. C., Franklin, T. W., Williams, C. L., Young, M. K., McKelvey, K. S., et al. (2020). Certain detection of uncertain taxa: eDNA detection of a cryptic mountain sucker (Pantosteus jordani) in the Upper Missouri River, USA. Environ. DNA 1–9. doi: 10.1002/edn3.133
Mauvisseau, Q., Coignet, A., Delaunay, C., Pinet, F., Bouchon, D., and Souty-Grosset, C. (2018). Environmental DNA as an efficient tool for detecting invasive crayfishes in freshwater ponds. Hydrobiologia 805, 163–175. doi: 10.1007/s10750-017-3288-y
Mauvisseau, Q., Davy-Bowker, J., Bulling, M., Brys, R., Neyrinck, S., Troth, C., et al. (2019a). Combining ddPCR and environmental DNA to improve detection capabilities of a critically endangered freshwater invertebrate. Sci. Rep. 9, 1–9. doi: 10.1038/s41598-019-50571-50579
Mauvisseau, Q., Tönges, S., Andriantsoa, R., Lyko, F., and Sweets, M. (2019b). Early detection of an emerging invasive species: eDNA monitoring of a parthenogenetic crayfish in freshwater systems. Manag. Biol. Invas. 10, 461–472. doi: 10.3391/mbi.2019.10.3.04
McElroy, M. E., Dressler, T. L., Titcomb, G. C., Wilson, E. A., Deiner, K., Dudley, T. L., et al. (2020). Calibrating environmental DNA Metabarcoding to conventional surveys for measuring fish species richness. Front. Ecol. Evol. 8:276. doi: 10.3389/fevo.2020.00276
McKee, A. M., Spear, S. F., and Pierson, T. W. (2015). The effect of dilution and the use of a post-extraction nucleic acid purification column on the accuracy, precision, and inhibition of environmental DNA samples. Biol. Conserv. 183, 70–76. doi: 10.1016/j.biocon.2014.11.031
Momot, W. T. (1995). Redefining the role of crayfish in aquatic ecosystems. Rev. Fish. Sci. 3, 33–63. doi: 10.1080/10641269509388566
Moore, P. A. (2007). “Agonistic behavior in freshwater crayfish,” in Evolutionary Ecology of Social and Sexual Systems: Crustaceans as Model Organisms, eds J. E. Duffy and M. Thiel (Oxford: Oxford University Press).
Pecoraro, S., Berben, G., Burns, M., Corbisier, P., De Giacomo, M., De Loose, M., et al. (2019). Overview and Recommendations for the Application of Digital PCR. Luxembourg: Publications Office of the European Union. EUR 29673 EN. doi: 10.2760/192883
Quan, P. L., Sauzade, M., and Brouzes, E. (2018). dPCR: a technology review. Sensors 18:1271. doi: 10.3390/s18041271
Rački, N., Morisset, D., Gutierrez-Aguirre, I., and Ravnikar, M. (2014). One-step RT-droplet digital PCR: a breakthrough in the quantification of waterborne RNA viruses. Analyt. Bioanalyt. Chem. 406, 661–667. doi: 10.1007/s00216-013-7476-y
Reynolds, J., Souty-Grosset, C., and Richardson, A. (2013). Ecological roles of crayfish in freshwater and terrestrial habitats. Freshw. Crayfish 19, 197–218.
Rice, C. J., Larson, E. R., and Taylor, C. A. (2018). Environmental DNA detects a rare large river crayfish but with little relation to local abundance. Freshw. Biol. 63, 443–455. doi: 10.1111/fwb.13081
Robinson, C. V., Webster, T. M. U., Cable, J., James, J., and Consuegra, S. (2018). Simultaneous detection of invasive signal crayfish, endangered white-clawed crayfish and the crayfish plague pathogen using environmental DNA. Biol. Conserv. 222, 241–252. doi: 10.1016/j.biocon.2018.04.009
Roussel, J. M., Paillisson, J. M., Tréguier, A., and Petit, E. (2015). The downside of eDNA as a survey tool in water bodies. J. Appl. Ecol. 52, 823–826. doi: 10.1111/1365-2664.12428
Rusch, J. C., Hansen, H., Strand, D. A., Markussen, T., Hytterød, S., and Vrålstad, T. (2018). Catching the fish with the worm: a case study on eDNA detection of the monogenean parasite Gyrodactylus salaris and two of its hosts, Atlantic salmon (Salmo salar) and rainbow trout (Oncorhynchus mykiss). Parasit. Vect. 11:333. doi: 10.1186/s13071-018-2916-2913
Rusch, J. C., Mojžišová, M., Strand, D. A., Svobodová, J., Vralståd, T., and Petrusek, A. (2020). Simultaneous detection of native and invasive crayfish and Aphanomyces astaci from environmental DNA samples in a wide range of habitats in Central Europe. Neobiota 58, 1–32. doi: 10.3897/neobiota.58.49358
Salter, I., Joensen, M., Kristiansen, R., Steingrund, P., and Vestergaard, P. (2019). Environmental DNA concentrations are correlated with regional biomass of Atlantic cod in oceanic waters. Commun. Biol. 2:461. doi: 10.1038/s42003-019-06968
Sepulveda, A. J., Nelson, N. M., Jerde, C. L., and Luikart, G. (2020). Are environmental DNA methods ready for aquatic invasive species management? Trends Ecol. Evol. 35, 668–678. doi: 10.1016/j.tree.2020.03.011
Souty-Grosset, C., Holdich, D. M., Noël, P. Y., Reynolds, J. D., and Haffner, P. (2006). Atlas of Crayfish in Europe. Paris: Muséum national d’Histoire naturelle.
Spens, J., Evans, A. R., Halfmaerten, D., Knudsen, S. W., Sengupta, M. E., Mak, S. S. T., et al. (2016). Comparison of capture and storage methods for aqueous macrobial eDNA using an optimized extraction protocol: advantage of enclosed filter. Methods Ecol. Evol. 8, 635–645. doi: 10.1111/2041-210X.12683
Stewart, K. A. (2019). Understanding the effects of biotic and abiotic factors on sources of aquatic environmental DNA. Biodivers. Conserv. 28, 983–1001. doi: 10.1007/s10531-019-01709-1708
Strand, D. A., Holst-Jensen, A., Viljugrein, H., Edvardsen, B., Klaveness, D., Jussila, J., et al. (2011). Detection and quantification of the crayfish plague agent in natural waters: direct monitoring approach for aquatic environments. Dis. Aquat. Organ. 95, 9–17. doi: 10.3354/Dao02334
Strand, D. A., Johnsen, S. I., Rusch, J. C., Agersnap, S., Larsen, W. B., Knudsen, S. W., et al. (2019). Monitoring a Norwegian freshwater crayfish tragedy – eDNA snapshots of invasion, infection and extinction. J. Appl. Ecol. 56, 1661–1679. doi: 10.1111/1365-2664.13404
Strand, D. A., Jussila, J., Johnsen, S. I., Viljamaa-Dirks, S., Edsman, L., Wiik-Nielsen, J., et al. (2014). Detection of crayfish plague spores in large freshwater systems. J. Appl. Ecol. 51, 544–553. doi: 10.1111/1365-2664.12218
Strand, D. A., Rusch, J., Johnsen, S. I., Tarpai, A., and Vrålstad, T. (2020). The Surveillance Programme for Aphanomyces astaci in Norway 2019. Annual report, Oslo: Norwegian Veterinary Institute.
Sylvestre, S., Sekela, M., Tuominen, T., and Moyle, G. (2002). Water quality assessment of agricultural and residential run-off using the crayfish Pacifastacus leniusculus in British Columbia, Canada. Freshw. Crayfish 13, 383–395.
Takahara, T., Minamoto, T., Yamanaka, H., Doi, H., and Kawabata, Z. (2012). Estimation of fish biomass using environmental DNA. PLoS One 7:e035868. doi: 10.1371/journal.pone.0035868
Taugbøl, T., Skurdal, J., and Fjeld, E. (1988). Maturity and fecundity of Astacus astacus females in Norway. Freshw. Crayfish 7, 107–114.
Thomsen, P. F., Kielgast, J., Iversen, L. L., Wiuf, C., Rasmussen, M., Gilbert, M. T. P., et al. (2012). Monitoring endangered freshwater biodiversity using environmental DNA. Mol. Ecol. 21, 2565–2573. doi: 10.1111/j.1365-294X.2011.05418.x
Thomsen, P. F., and Willerslev, E. (2015). Environmental DNA – An emerging tool in conservation for monitoring past and present biodiversity. Biol. Conserv. 183, 4–18. doi: 10.1016/j.biocon.2014.11.019
Tréguier, A., Paillisson, J.-M., Dejean, T., Valentini, A., Schlaepfer, M. A., and Roussel, J.-M. (2014). Environmental DNA surveillance for invertebrate species: advantages and technical limitations to detect invasive crayfish Procambarus clarkii in freshwater ponds. J. Appl. Ecol. 51, 871–879. doi: 10.1111/1365-2664.12262
Troth, C. R., Burian, A., Mauvisseau, Q., Bulling, M., Nightingale, J., Mauvisseau, C., et al. (2020). Development and application of eDNA-based tools for the conservation of white-clawed crayfish. Sci. Total Environ. 748, 141394. doi: 10.1016/j.scitotenv.2020.141394
Uchii, K., Doi, H., Okahashi, T., Katano, I., Yamanaka, H., Sakata, M. K., et al. (2019). Comparison of inhibition resistance among PCR reagents for detection and quantification of environmental DNA. Environ. DNA 1, 359–367. doi: 10.1002/edn3.37
Usio, N., and Townsend, C. R. (2001). The significance of the crayfish Paranephrops zealandicus as shredders in a New Zealand headwater stream. J. Crustacean Biol. 21, 354–359. doi: 10.1163/20021975-99990135
Villacorta-Rath, C., Adekunle, A. I, Edmunds, R. C., Strugnell, J. M., Schwarzkopf, L., and Burrows, D. (2020). Can environmental DNA be used to detect first arrivals of the cane toad, Rhinella marina, into novel locations? Environ. DNA 2, 635–646. doi: 10.1002/edn3.114
Vrålstad, T., Knutsen, A. K., Tengs, T., and Holst-Jensen, A. (2009). A quantitative TaqMan (R) MGB real-time polymerase chain reaction based assay for detection of the causative agent of crayfish plague Aphanomyces astaci. Vet. Microbiol. 137, 146–155. doi: 10.1016/j.vetmic.2008.12.022
Vrålstad, T., Strand, D. A., Rusch, J. C., Toverud, Ø, Johnsen, S. I., Tarpai, A., et al. (2017). The Surveillance Programme for Aphanomyces astaci in Norway 2016. Annual report, Oslo: Norwegian Veterinary Institute.
Westman, K., and Pursiainen, M. (1982). Size and structure of crayfish (Astacus astacus) populations on different habitats in Finland. Hydrobiologia 86, 67–72. doi: 10.1007/BF00005789
Wood, S. A., Pochon, X., Laroche, O., von Ammon, U., Adamson, J., and Zaiko, A. (2019). A comparison of droplet digital polymerase chain reaction (PCR), quantitative PCR and metabarcoding for species-specific detection in environmental DNA. Mol. Ecol. Resour. 19, 1407–1419. doi: 10.1111/1755-0998.13055
Zhao, Y., Xia, Q. Y., Yin, Y. P., and Wang, Z. K. (2016). Comparison of droplet digital PCR and quantitative PCR assays for quantitative detection of Xanthomonas citri Subsp citri. PLoS One 11:e0159004. doi: 10.1371/journal.pone.0159004
Keywords: noble crayfish Astacus astacus, eDNA, occupancy modeling, qPCR, ddPCR, CPUE, detection frequency, relative density
Citation: Johnsen SI, Strand DA, Rusch JC and Vrålstad T (2020) Environmental DNA (eDNA) Monitoring of Noble Crayfish Astacus astacus in Lentic Environments Offers Reliable Presence-Absence Surveillance – But Fails to Predict Population Density. Front. Environ. Sci. 8:612253. doi: 10.3389/fenvs.2020.612253
Received: 30 September 2020; Accepted: 17 November 2020;
Published: 07 December 2020.
Edited by:
Ivana Maguire, University of Zagreb, CroatiaReviewed by:
Michael Sweet, University of Derby, United KingdomChloe Victoria Robinson, University of Guelph, Canada
Copyright © 2020 Johnsen, Strand, Rusch and Vrålstad. This is an open-access article distributed under the terms of the Creative Commons Attribution License (CC BY). The use, distribution or reproduction in other forums is permitted, provided the original author(s) and the copyright owner(s) are credited and that the original publication in this journal is cited, in accordance with accepted academic practice. No use, distribution or reproduction is permitted which does not comply with these terms.
*Correspondence: David A. Strand, david.strand@vetinst.no
†These authors have contributed equally to this work