
Abstract
During an earthquake, damages of non-structural components can prevent the safe occupancy of buildings and contribute largely to the global economic losses. Ceiling systems are among the most common non-structural components, since they are widely installed in public buildings, retails and offices. As demonstrated by the failures reported after seismic events worldwide, ceiling joints are often subjected to damage that ultimately leads to collapse of the ceiling system. While perimeter joints have been assessed in many experimental campaigns, there are limited data regarding experimental and numerical characterisation of inner joints. Moreover, the available experimental results are characterized by elasto-fragile behaviour and concern devices which differ in size and type from the mechanical connections commonly manufactured in Europe. In this work a preliminary numerical study on a full-scale suspended ceiling model has been performed to evaluate the main actions on suspended ceiling joints. Moreover, an extensive experimental campaign has been conducted on a type of the so-called “standard” and “seismic” joints, produced in Europe and installed in different typologies of runners. Specimens were subjected to monotonic and cyclic quasi-static tests, using a similar setup to the ones used in Literature to allow a comparison of the performances obtained. Moreover, numerical models of the joints were developed and calibrated on the experimental results. The aim of this work is to evaluate the performance of different types of inner joints and investigate the influence of shape and dimensions of tees to the performance of the connection. The results here presented allows to accurately characterise the behaviour of inner joints and finally enhancing the global seismic behaviour of suspended ceilings.
1 Introduction
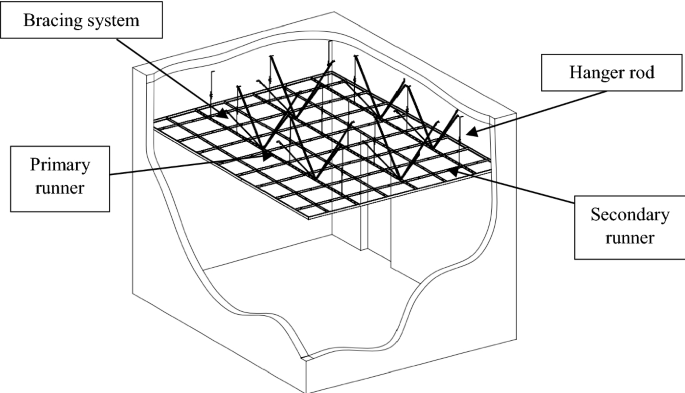
Suspended ceilings are complex building systems that can be divided in different categories according to the configuration of the metal grid and the components that are installed. They can be firstly divided between continuous dry-wall ceiling systems and T-Grid suspended ceilings. In fact, dry-wall suspended ceilings showed high stiffness in past experimental campaigns (Magliulo et al. 2012; Gilani et al. 2017) and the behaviour of their components is not considered influencing the overall performance. In this work, T-Grid suspended ceilings are studied, since this typology is widespread worldwide and performed poorly in many past earthquakes. In Fig. 1 there is a scheme of a typical T-Grid suspended ceiling: a metal grid represents the main structure, that is realised with main and cross runners whose section has T-shape. Cross runners are installed perpendicularly to the main runners and metal, gypsum or other tiles lay on the bottom part of the runners. Hanger wires are installed at a specific spacing on the main runners, with the aim of connecting the grid to the soffit. Finally, wall mouldings are located at the perimeter, in correspondence to the grid height, where the runners can be simply supported or rigidly connected to the mouldings. In suspended ceilings, the most common joints are used to connect cross tees to main tees or cross tees to cross tees. When the span is longer than the maximum length of a main tee, two main tees need to be connected to each other: this typology is defined ‘main runner joint’.

Scheme of a T-grid suspended ceiling
For suspended ceilings installed in seismic areas, lateral bracings can be installed along the main runners. The design of seismic solutions and lateral bracings can change significantly according to the manufacturer and/or the Standards applied in the geographic area of interest. In Fig. 2, the design of a seismic bracing widely installed in Europe is reported. It is realised as an assembly of one bracket screwed to the main runner and four slotted studs, connected to the bracket and to the soffit with screws.

Seismic bracing installed in Europe in buildings with high seismic vulnerability
The most common failures experienced by suspended ceilings include the dislodging or fall of tiles, the rupture of the grid in correspondence of inner joints or connections at perimeter other than the interaction with other components, as lighting systems or sprinkler heads. The failure of inner joints has been reported since the 1994 Northridge earthquake (Fig. 3a) to the 2010–2011 Canterbury earthquakes (Dhakal et al. 2011; MacRae et al. 2011; Dhakal and MacRae 2013). Joints failure, as reported in Fig. 3b), frequently causes the drop of runners from their position (Fig. 3c), with a domino effect on tiles and adjacent portions of ceiling (Fig. 3a). Also the recent 2016 Amatrice Earthquake in Italy induced dislodging and fall of tiles as reported in Perrone et al. (2018).

The failure mechanism associated to inner joints was also reported after some experimental campaigns, confirming both the reliability of tests and the need to better investigate the behaviour of connections. Damage at connections between main and cross runners and critical performance of main runner joints was evidenced in Yao and Chen (2017) and Badillo-Almaraz et al. (2007). The failure of main and cross runner joints led to falling of tiles and was also reported in the experimental campaigns performed by Soroushian et al. (2014, 2016c).
In consequence to the failures observed and as it requires small effort, some experimental campaigns regarding inner connections between runners were developed. In fact, only in the American Standards the characteristics of joints are indicated (ASTM C635/C635M-16, C636/C636M-13, 2013) together with their maximum resistance in tension and compression for areas subjected to earthquakes motions (ASTM E580/E580M-16). However, these prescriptions are only referenced in the ASCE 7-16 Code (2016).
Firstly in New Zealand, Paganotti et al. (2011) highlighted the lack of standards to test connections in tension and compression. This condition leads the researchers to independently set the dimensions of the specimens, eventually affecting the final results. In this experimental campaign, specimens of joints were obtained from the connection of slices of runners. Moreover, specimens were positioned on a vertical wooden board, where the runners were fixed with steel brackets in order to avoid any undesired movement of the runners and address the force on the joint during testing. The failure in tension was caused by tearing of the bayonet (i.e. component of the joint that is connected to the runner) that was attached to the runner with eyelets. Otherwise in compression the joint was characterised by rotation out-of-plane of the bayonets in a buckling phenomenon.
An extensive experimental campaign on suspended ceilings components was developed by Soroushian et al. (2015). In particular, shear and bending tests were performed on the connections in the major and minor directions of the specimens. Each specimen was subjected to monotonic and cyclic tests and the protocol adopted for the latter was specifically designed for non-structural components displacement sensitive. In order to replicate the boundary conditions typical of real-case installations, clamping plates and steel connections were integrated in the test rig. Load was applied on a vertical direction on the specimens, that were obtained connecting two runners placed horizontally to a short portion of runner. The length of specimens, in the horizontal direction, was 30.5 cm for shear tests and 66 cm for bending tests, the small splices placed orthogonally had minimum length. The damage reported after shear tests was tearing of web and flange of the portion of runner, while in the opposite direction the joint bent and the bayonet partially detached from the runner. In both configurations the damage observed at the end of the tests could potentially lead to failure of the ceiling. Additionally, limited rotational strength along both directions were outlined by the results of bending tests. During the final stage of testing, the specimens reported localised damage and partial bending of the joints in the opposite loading direction. While the failure mechanisms of bending tests were not as extensive as shear tests damages, the small dissipation capacity shown by joints could be as well a cause of partial collapse of suspended ceilings. Findings from the experimental campaign led to the conclusion that the loading protocol and typologies of runner didn’t affect the experimental results.
Monotonic and cyclic tests were performed on suspended ceiling joints to investigate their axial capacity (Soroushian et al. 2016a). Main and cross runners were connected to realise the specimen, and both the continuous runner and splices connected by the joint were 30 cm-long. Cyclic tests were conducted according the same protocol described in Soroushian et al. (2015). In compression, buckling was the main cause of failure of the joint, with a minor incidence of tearing of the slot in the perpendicular component. The behaviour observed in tension was elasto-fragile, with tearing of the hook at the end of the plate that ultimately led to permanent bending. Two groups of specimens were defined according to their axial capacity caused by the joint configuration. The last step of the work was the numerical model of the joints, developed with the software OpenSees (Mazzoni et al. 2006). The hysteresis behaviour of the joints and the degradation due to cyclic loading were represented in the model combining the element “zeroLength” element with the uniaxial material “Pinching4”.
Dhakal et al. (2016) continued the work presented in Paganotti et al. (2011) and performed static tests on connections of cross and main runners of two different manufacturing companies. The failures reported in both typologies were tearing of the slot in the transversal runner in tension and buckling of the joint in compression, ultimately causing its compression and deformation. The resistance in compression was higher than in tension in the main runner joints, while the opposite was reported for the joints of cross runners and the behaviour of the joints in their weakest direction of loading was defined critical. The authors also outlined the lack of guidance in the New Zealand Standards regarding the requirements for ceiling joint, despite their recognised fragility. In detail, the Standards (AS/NZS 2785:2000) provide indications for tensile tests but don’t mention any evaluation in compression.
In line with the conclusions of other authors, a deep understanding of the behaviour of suspended ceilings cannot exclude the assessment of their joints. However, the experimental results presented in Literature are not representative of all the available devices worldwide and a generalization of those results could cause misleading findings. Additionally, the latter are characterized by elasto-fragile behaviour, that is not desirable under seismic actions.
The work here presented aims to characterize the behaviour of two typologies of suspended ceiling joints, whose shape and performance significantly differ from all the suspended ceiling joints already investigated in Literature. In order to accurately compare the experimental results, the setup was designed similarly to the previous experimental campaigns on ceiling joints (Soroushian et al. 2016b; Dhakal et al. 2016).
The category “seismic” joints, especially designed to withstand earthquake events, is here compared to “standard” joints. The performance of the latter is discussed and compared to the behaviour of other joints previously tested (Soroushian et al. 2016a; Dhakal et al. 2016). Several preliminary numerical analyses are here presented to evaluate the suitability of the boundary conditions assumed in the experimental tests. Non-Linear Time History analyses are performed on a full-scale numerical model of a suspended ceiling realised with modular panels and placed at the last floor of a steel frame with fundamental period equal to 0.3 s. Many specimens of each configuration were tested in order to correlate the mechanical and geometrical properties of the runners to the overall behaviour of the joint, with focus on the section of the runners. A minimum number of 3 monotonic tests under tension loading and 3 cyclic tests were conducted on each category. Tension tests were also performed on main runner joints to characterise their behaviour. The aim of the cyclic tests was to assess the joints under alternate loading input and a specific protocol was employed.
The experimental results allowed to evaluate the resistance and dissipative characteristics of “standard” and “seismic” joints. Moreover, numerical models were developed for both typologies with the software OpenSees (Mazzoni et al. 2006) and the experimental results were used to calibrate the models and thus enhancing their accuracy.
The general purpose of this work is to present experimental results and numerical models preliminary to future works where analyses will be performed on whole suspended ceiling assemblies using the numerical models here developed. Indeed, the use of the above numerical simulations will allow a more accurate study of the global non-linear behaviour of suspended ceilings. The reliability of whole models will also depend on the ability of numerical joints models to reproduce faithfully the experimental findings. This paper is focused on the demonstration of this topic.
2 Description of the specimens
The connection between main and cross runners or cross runners to cross runners can be realised with two different typologies of joints: ‘standard’ or ‘seismic’. The category of ‘standard’ joints can be applied to many different runners and in this experimental plan “Base24” and “Base15” are investigated. Otherwise, ‘seismic’ joints are applied only to “Base24” runners. Finally, main runner joints belong to “Base24” runners.
The sections of main and cross runners belonging to Base 24 have equal width corresponding to 24 mm. However, the height of main runners is 38 mm while for cross runner is 32 mm (Fig. 4a, b). Additionally, 0.35 mm steel sheet is used to realise main runners, while for the cross runners the thickness of the metal sheet is 0.3 mm.
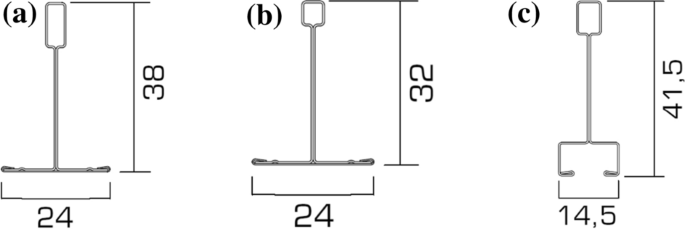
Cross sections: a Base24—main runner, b Base24—cross tee, c Base15—main runner
The standard joint is represented in Fig. 5 and is characterised by a large end fold where is located a notch (defined external notch). On the other side, the seismic joint (Fig. 6) is provided with an end Z fold and the notch is located at the centre of the plate (internal notch). Consequently, the main differences between the two typologies of joints is the shape of the end fold and the position of the notch. These characteristics affect the interlocking capacity of the joints, since for standard joints it depends on the external notch while the Z fold affects the connection of seismic joints. In seismic joints, the internal notch gives an additional contribution to the interlocking resistance.

Base24 standard joint: a isometric view, b assembly, c top view, d left side view, e right side view

Base24 seismic joint: a isometric view, b assembly, c top view, d left side view, e right side view
Base24 main runners have typical length of 3800 mm. For longer spans they are connected to each other with typical joints, illustrated in Fig. 7: the runner ends with a tab that is realized with a hook and a dimple positioned at the end.

Main runner joint: a isometric view, b assembly, c top view, d left side view, e right side view
In Base15 the main and cross runners have the same shape, illustrated in Fig. 4c. The section of the runners is 41.5 mm high and 14.5 mm wide. The particular shape of the bottom of the runner allows to conceal the grid once the tiles are installed. As previously indicated, Base15 is provided only with standard joints, whose shape is identical to the standard joints of Base24 Line. In Fig. 8 detailed pictures of Base15 runners and joints are provided.

Base15 standard joint: a isometric view, b assembly, c top view, d left side view, e right side view
The experimental campaign aims to investigate standard and seismic joints of different categories of runners in addition to main runner joints. A summary of the different categories of specimens is reported in Table 1. Runner type indicates the components realising the assembly tested, where Longitudinal runners are subjected to axial loading and Transversal runners are part of the assembly to better replicate the real conditions of installation; Joint type classifies standard or seismic joints and Label represents the abbreviation adopted in this work to identify the specimens.
3 Preliminary numerical studies
A simplified full-scale numerical model has been implemented to evaluate the magnitude of the actions on the suspended ceiling components and justify the boundary conditions chosen for the experimental tests on joints, presented in Sect. 4. Tests were therefore performed under the assumption of prevalent axial action on joints.
3.1 Full-scale numerical analyses
A modular panel suspended ceiling widely used in Europe has been considered for the numerical analyses performed with Midas Gen software (Fig. 9). Metal tiles with a weight of 5 kg/sqm are set in a grid of metal T-section profiles: base width of 24 mm and height of 38 mm were chosen for main runners and 32 mm for cross runners. Primary runners are installed every 1200 mm, while secondary runners are placed every 600 mm. Primary runners are hung to the soffit with spring hanger rods, whose aim is to carry the weight of the suspended ceiling. Seismic bracings are installed to withstand the seismic action and they are realised according to Fig. 2, where the slope between the studs and the ceiling plane is 45°.
Modular panel suspended ceiling
The dimensions of the suspended ceiling used for the numerical analyses are 2.40 by 4.80 m for a total area of 11.52 sqm and the corresponding seismic mass is 78 kg. The seismic bracing is placed every 6 sqm, therefore two retaining systems are considered for the analyses. The plenum height, i.e. the distance between the tiles intrados and the soffit, is 1 m.
Beam elements are used to model main tees in Y direction, whereas 600 mm length truss elements are used for cross runners in X direction. 600 mm by 600 mm metal tiles are sketched as x-shape assembly with a translational lumped mass in the centre connected to the runners with gap type non-linear springs as suggested in Echevarria (2012) and Zaghi et al. (2016) which allow a maximum displacement equal to 5 mm. The non-linear element allows simulating the perimetral gap between the tiles and the metal profiles of the grid. Truss elements are used to model both the hanger wires and the bracings which are fixed at the soffit. The elastic modulus of the retaining system elements complies with the stiffness measured through cyclic quasi-static tests on this type of system (Fiorin 2017; Brandolese and Scotta 2019). A frictional clip is usually placed at the perimeter to keep the grid runners orthogonal and allow the displacement of the runners along their main axis (Fig. 10). No fixed retaining clips or pop rivets are used at the perimeter and no inner joints were included due to the purpose of simplified modelling.

Perimeter connection for suspended ceilings installed in Europe
A sensitivity analysis of the boundary conditions is performed considering the cases in Table 2. Perimeter elements are modelled as point spring supports placed at the end of each runner with an axial variable stiffness to take into account the influence of the boundary conditions on the transfer of forces between grid elements (Figs. 11, 12). Case-studies 1x and 1y are performed considering perimetral gap non-linear springs which allow a maximum free displacement of 5 mm; whereas case 2 and 3 were analysed with a higher perimetral stiffness which led to perimetral displacement lower than 5 mm.

Full-scale numerical model of the suspended ceilings with unidirectional (X) perimetral links

Full-scale numerical model of the suspended ceilings with unidirectional (Y) perimetral links

Hinges hysteretic behaviour (Brandolese et al. 2019)
According to the Cascade Approach (Filiatrault and Sullivan 2014), the seismic input has been evaluated performing a decoupled analysis of a 2D steel 6-storey supporting structure with a fundamental vibration period of 0.3 s without suspended ceilings and modelled with Opensees Software (Mazzoni et al. 2006). The period of the main structure was chosen to recreate the onerous condition of a building with fundamental period within the plateau of the design response spectrum (Fig. 14a). The steel frame has a total height of 22.2 m and interstorey height equal to 3.7 m. Columns are assumed pendular and the beams are 6 m-long and are considered infinitely rigid. The stiffness of the vertical bracing system was modified in order to obtain the desired vibration period. The storey mass is 28.2t at each floor except for the last floor, where it is 18.3t. The 2D steel frame has been modelled considering a concentrated plasticity modelling approach using beam with hinges elements and the hysteretic behaviour displayed in Fig. 13, that is supposed symmetric.

Design spectra: a ground elastic design spectrum, b floor response spectrum


Case 1X: a beam axial force; b beam shear force; c beam bending moment Mz; d truss axial action
The main structure is subjected to an accelerogram spectrum-compatible with the design spectrum defined at the Life-safety Limit State according to the guidelines provided in Technical standards for buildings (2018). A soil category equal to C and a peak ground acceleration on the soil of type A equal to 0.345 g were considered to obtain the elastic design spectrum. To take into account the subsoil category and topographical conditions a parameter S equal to 1.333 was used (Fig. 14). The sixth-floor acceleration signal obtained with Non-Linear Time History analysis of the main structure is used as input to perform Non-Linear Time History analyses on the suspended ceiling. For the purpose of this work, only horizontal dynamic inputs were considered acting in both main directions X and Y. Figure 14b highlights the elastic floor response spectrum derived from the floor acceleration at the 6th floor of the main structure. Additionally in Table 3 the fundamental periods of the suspended ceiling are reported for each configuration together with the corresponding acceleration, that are obtained from the floor response spectrum in Fig. 14b. The small difference in periods for case studies 1X and 1Y (Table 3) is due to the stiffness asymmetry of the elements of the grid in the initial free displacement configuration (gap equal to 5 mm).
Table 4 summarises the numerical maximum actions acting on profiles, and, as shown in Tables 5 and 6, they are lower than the resisting values.
According to the installation criteria, each 3D bracing system is placed on main runners along Y direction as shown in Figs. 11 and 12. In this configuration, the maximum axial actions on main runners are expected for an earthquake acting in Y direction and are localised near the connection between main runner and 3D constraint system. The axial forces are caused by the “rope effect” of the bracing rod under tension along Y axis. In this configuration also the rods of the constraint systems should be subjected to the highest axial stresses. Differently, when the earthquake acts in the X direction, the maximum shear forces and bending moments are expected on the main runners in correspondence to each 3D bracing. Numerical analyses confirm these aspects: Figs. 16, 18 and 20 highlight the highest axial actions on main runners and rods, whereas in Figs. 15, 17 and 19 the maximum shear forces and bending moments are reported on main runners. Moreover, as the stiffness of the boundary constraints increases, the “rope effect” is reduced together with the axial forces on main runners and rods. They decrease from 132.4 to 6.63 kN on main runners and from 141.69 to 6.26 kN on tense rods (Figs. 16, 18, 20). With the earthquake action along the X direction, the increase of stiffness of the boundary constraints leads to reduction of shear and bending stresses on main runners and limited increase of axial actions on main and cross runners. Shear forces and bending moments decrease from 92.05 to 3.63 kN and from 11,751.23 to 32.75 Nmm respectively; whereas axial actions increase from 9.70 to 33.98 kN on main runners and from 15.24 to 34.14 kN on cross runners (Figs. 15, 17, 19).

Case 1Y: a beam axial force; b beam bending moment Mz; c truss axial action


Case 2X: a beam axial force; b beam shear force; c beam bending moment Mz, d truss axial action

Case 2Y: a beam axial force; b beam bending moment Mz, c truss axial action


Case 3X: a beam axial force; b beam shear force; c beam bending moment, d truss axial action

Case 3Y: a beam axial force; b beam bending moment; c truss axial action
The numerical results displayed from Figs. 15, 16, 17, 18, 19 and 20 highlights that the axial action is the main action on the suspended ceiling grid elements where joints are installed. Moreover, the highest shear and bending values are only located at the connection of the 3D-bracings where no joints are installed. Shear diagrams on main runners due to the seismic action acting in Y-direction have not been plotted as their value is around zero. In light of the numerical results, the experimental tests hereafter presented were performed considering only axial action on joints.

Universal Machine Galdabini Sun 2500: a test setup; b specimen dimensions
4 Experimental tests
4.1 Test setup and procedure
The Universal Machine Galdabini Sun 2500 (see Fig. 21) was used to complete the tests and it can apply load both in tension and compression. In detail, the maximum capacity of the load cell of the machine is 3430 N. Moreover, the installation of the runners recreates the real boundary conditions for the connection (Fig. 21b).

ASTM E580 (2017): installation details for suspended ceilings in buildings with high seismic vulnerability: a rigid connection between grid and trim; b grid simply supported on the trim; c lateral bracing
The axial action on the joint is imposed through the tension/compression action applied to the vertical runner. It is clamped at the edges with vises and cut to a reduced length of 300 mm to prevent buckling phenomena in compression. Similarly to the setup presented in Soroushian et al. (2016a) the upper vise can move and applies the vertical displacement to the top end of the longitudinal runner, while the lower vise realises a fixed connection for the bottom part of the runner.
The imposed displacement was measured by the extensometer installed at the top of the movable vise and monitored with a data acquisition unit. The horizontal profile has length equal to 100–200 mm and it is placed to guarantee the real interlocking of the joint. The transversal tee was maintained in its original position by clamps that were connected to the universal machine with magnets. With this setup, the transversal runners are not allowed to rotate or move horizontally and only the top part of the longitudinal tee can move from its initial location (Fig. 21). Analogous dimensions and boundary conditions have been used in Soroushian et al. (2016a).
For each typology of specimens a minimum number of 3 tension monotonic (label m in Table 7) and 3 cyclic tests (label c in Table 7) were developed in displacement control. The purpose of monotonic tests is to observe the configuration of final damage and evaluate the yielding value for the joint. In case of connections in the Base24 main runners, only tensile monotonic tests were conducted. In fact the behaviour in compression is mainly affected by buckling failure due to the feature of the joint, as the transversal runner is not applied and the two main splices are in contact. Since the joints tested are intended to the European market, the American Standards are not applied neither regarding the testing procedure of suspended ceiling joints (UBC 47-18) or their values of maximum resistance (ASCE 7-16, ASTM C635-C636-E580) and multi-axial loads or misalignment eccentricities (UBC 47-18) were ignored. Joints tested are part of suspended ceiling systems that differ from traditional American systems in relation to: bracing system to withstand seismic actions as described in ASTM E580 (2017a, b see Fig. 22), boundary constraints of main-tee/cross-tee and type/mechanics of the joints themselves.
In detail, European devices do not have compression posts rigidly connected to the main runners (see Fig. 2) and perimetral elements which prevent free displacement of the suspended ceiling (see Fig. 10). Consequently, European systems are more flexible and different actions are transmitted on the joints. In this configuration, joints resist only to tension/compression forces as showed through the numerical analyses in Sect. 3.
The procedure of cyclic testing was modified after the protocol for cyclic quasi-static testing of connections in timber structures (see Fig. 23), that is reported in the Standard EN12512 (CEN 2006). According to the protocol, monotonic tension tests are first performed to identify the value of yielding displacement Vy, that is used to define the amplitude of cycles for cyclic testing. An average value Vy = 4.5 mm was estimated after performing the tension tests and the same amplitude of cycles was maintained throughout the experimental campaign, in order to have a consistent testing procedure. The cyclic test is characterised by two initial adjustment cycles and then three cycles for each amplitude. Tests are performed in displacement control and the velocity of displacement of the vise was set to 5 mm/min.

EN12512 protocol (CEN 2006)
4.2 Test results
4.2.1 Base15 joints
The experimental results and standard deviation values of M-M Stand B15 joints are reported in Table 8, while force–displacement graphs are represented in Fig. 24a, b. The average of the maximum resistance values reached in tension is 365 N for the monotonic tests and 357 N for the cyclic ones.

Force-displacement response of M-M Stand B15 specimens subjected to a monotonic and b to cyclic test
From the graphs it can be observed that the monotonic tests graphically envelop the related cyclic tests and the lower mean value obtained by cyclic tests can be justified by the degradation of the specimens due to repeated loading. In wider terms, the specimens have an elasto-fragile and asymmetrical behaviour, characterised by limited plastic deformation. The average maximum force in compression, equal to − 995.4 N, is 2.8 times greater than the resistance in tension and it is due to the closure of the gap between the elements. No evident failure is shown in compression, where just contact between runners may be observed. The end of test was reached when failure in tension was observed. All the specimens tested reached a value of final displacement ~ 6 mm and, as it can be observed in Fig. 25, tearing of the slot in the transversal tee was the cause of failure for all the specimens. Even if the specimens were identical, large scattering of the results has been observed due to the fragility, and therefore low reliability, of observed failure mode (tearing of slots in tension tests).

Detail of damage on M-M Stand B15 specimen: tearing of the slot in the transversal runner
According to Chopra (1995), the equivalent viscous damping was determined as the ratio between the energy dissipated in a cycle and the available potential energy multiplied by 4π. The third cycle for each amplitude of cycles was chosen to define the equivalent viscous damping.
Values of ductility were also calculated for each specimen subjected to cyclic loading. The procedure included the definition of an envelope curve according to the formulation proposed by Foschi and Bonac (1977). Then, an elasto-perfectly plastic function was defined following the equivalent-energy method described in NTC18 (§ C7.3.4.2). The latter allowed to define the yielding point and the ductility μ, calculated as the ratio between the final displacement and the yielding displacement (Table 9).
As reported in Table 9, the average value of viscous damping ratio is 7.38% for cyclic amplitude equal to 3.375 mm and 8.40% for 4.5 mm. Those values confirm the limited dissipative capacity of the B15 joints. Additionally, the average value of ductility is 1.90.
4.2.2 Base24 Standard joint
The experimental results and standard deviation values of standard joints in Base24 runners are indicated in Table 10, while force–displacement graphs for C-M Stand B24 joints are in Fig. 26a, c and the results for C-C Stand joints are reported in Fig. 26b, d. First, C-M and C-C Stand B24 joints showed similar elasto-fragile behaviour, also analogous to the results obtained by M-M Stand B15. Otherwise, the maximum resistance in tension and compression is higher for C-M Stand B24 joints than C-C Stand B24 joints. This result can be justified since the web of the main runner is wider and thicker if compared to the cross runner’s web, increasing the resistance to tearing of the slot. In detail, C-M Stand B24 joints reach an average resistance value equal to 377.2 N for the monotonic tests and 364.8 N and − 599.4 N, respectively in tension and compression, for the cyclic ones. Whereas C-C Stand B24 joints reach an average resistance value equal to 328.3 N for the monotonic tests and 340.0 N and − 530.8 N, respectively in tension and compression, for the cyclic ones. The results comparison highlights average resistance values for the C-C Stand B24 joints, both in tension and compression, 10% lower than those of the C-M Stand B24 samples.

Force-displacement response of: a C-M Stand B24 joints and b C-C Stand B24 joints subjected to monotonic test; c C-M Stand B24 joints and d C-C Stand B24 joints subjected to cyclic test
The first 6.75 mm cycle in tension was completed by all the specimens, while only one reached the same value in compression.
The details of the damaged configuration are reported in Fig. 27. Failure corresponds to tearing of the slot in the transversal runner for both C-M and C-C Stand B24 joints, as already showed in M-M Stand B15 joints. The resistance reported by C-M and C-C Stand B24 joints subjected to cyclic tests is lower than M-M Stand B15 joints because of the geometry of the runners and their connection at the joint. In fact, the pictures reported in Figs. 5b and 8b highlight that in Stand B24 joints a small gap is realised at the connection with the transversal runners, leading to larger displacements during testing (Table 10).

Failure details: tearing of the slot in the transversal runners, a caused by compression force on the left side of the joint, b caused by tension force on the right side of the joint
The values of average equivalent viscous damping are reported in Table 11. The average equivalent viscous damping for C-M Stand B24 joints is 7.16% for amplitude of cycles equal to 3.375 mm and 5.10% for 4.5 mm. C-C Stand B24 joints reported slightly higher values: 8.81% for 3.375 mm and 6.41% for 4.5 mm. Moreover, the ductility values are 1.41 for M-M Stand B24 and 1.54 for M-C Stand B24. The values of viscous damping and ductility referring to Stand B24 joints are lower than the ones reported by B15 joints, attesting limited dissipation capacity for Standard B24 joints.
4.2.3 Base24 Seismic joint
The value of resistance of Base24 “seismic” joints is expected to be higher than the “standard” ones since this type of technology was designed to improve the seismic joints’ performance. Through the experimental tests this work wants to evaluate their real ductile or fragile behaviour.
In Table 12 the results from monotonic and cyclic tests are indicated, while the force displacement graphs are reported in in Fig. 28. C-M and C-C Seism B24 joints have similar maximum resistance in compression and tension and only for cyclic tests C-M Seism B24 joints showed higher average resistance in tension, that is equal to 1343.3 N.

Force-displacement response of: a C-M Seism B24 joints and b C-C Seism B24 joints subjected to monotonic test; c C-M Seism B24 joints and d C-C Seism B24 joints subjected to cyclic test
All cyclic tests highlighted a clear asymmetric behaviour of the joints with maximum force in compression about 60% lower than in tension.
Figure 28 shows clearly the peak of resistance in tension, corresponding to maximum resistance of ~ 1200 N and displacement equal to 1 mm for monotonic tension tests and 2 mm for cyclic tests. The tension curve shows three changes of slope, corresponding to the changes of stiffness of the specimen. The first and the third sections have similar slope, justified by the contribution of the end Z fold to the resistance. Otherwise, the peak of resistance corresponds to the connection of the inner notch to the other joint and it is visible only for the first cycles since its deformation induced by the repetitive loadings doesn’t allow the notch to be effective.
The behaviour in compression can be observed in Fig. 28c, d. A peak of resistance is reported for the first cycles, but the stiffness rapidly decreases afterwards, as a consequence of the tearing of the slot in the transversal runner.
Additionally, this joint differs from Base24 Standard joints and the others described in literature, because of its shape that allows to keep a residual resistance in tension after the first cycles. In terms of seismic performance, this behaviour is positive as it improves the safety of the joints. In fact, when the joint is in compression, after 2–3 mm of displacement the end Z fold starts to unhook and when subjected to tension forces, it can’t catch the transversal runner again resulting in complete deformation of the end z fold (see Fig. 29a). The joint unhooks completely in correspondence of 4.5 mm of displacement in compression.

Details of the damaged configuration of Seism B24 joints: a deformation of the end Z fold due to repetition of cycles; b tearing of the slot in the transversal runner
In Fig. 29 the damage on the joints during cyclic tests is reported and it appears similar for both C-M Seism B24 and C-C Seism B24 specimens. For both categories, the joints reach failure with final tearing of the slot, that also corresponds to complete deformation of both end z fold and internal notch.
The experimental results highlighted two mechanisms: initially the seismic joints show an elasto-fragile behaviour characterized by a strong increment in resistance due to the internal notch. This is followed first by a drop in resistance and then by hardening behaviour until reaching the maximum residual resistance that is insured by the Z fold.
Significant values of equivalent viscous damping and ductility could not be defined because of the trend of the cycles that resulted in a high resistance peak.
The results of cyclic tests presented in this work show an initial similar behaviour to the American ones presented in Soroushian et al. (2016a) in which the axial capacity of suspended ceiling joints of an American manufacturer was tested with monotonic and cyclic tests using the experimental rig in Fig. 30a. Conversely from the experimental setup herein presented, the horizontal runners were constrained between two steel plates instead of using clamps fixed to the machine support with a magnet. The protocol for the cyclic tests was the same as the previous experimental campaign regarding suspended ceiling joints (Soroushian et al. 2015). In compression, failure was related to the buckling of the joint and only in few cases, tearing of the slot in the perpendicular member was observed. In tension, tearing of the hook located at the end of the plate was observed until it reached complete permanent bending. Specimens were divided in two groups depending on their axial capacity due to the joint condition. The larger-capacity group reached in cyclic tests a maximum strength equal to 3113 N in tension and 1560 N in compression at 1.2 mm of displacement. The small-capacity group reached a maximum strength both in tension and compression equal to 1780 N at 1 mm displacement.

The maximum resistance values obtained in this work are lower than 2.3 times in tension and 4 times in compression compared with the American large-capacity devices. American joints are subjected to higher stresses, therefore a high resistance value is required. In fact, unlike European devices, American suspended ceiling systems are usually linked at the perimeter with stiffer restraint systems such as pop rivets which induce greater stresses on the constitutive elements. Moreover, the American devices presented in Soroushian and the European typologies herein displayed have a peak of tensile strength and a subsequent strength decrease and a high asymmetric behaviour in tension and compression. Conversely, after the strength reduction, the American devices do not exhibit the residual stiffness that characterizes the seismic typology of European joints herein discussed.
Other tests on suspended ceiling joints are available in Dhakal et al. (2016) who developed monotonic static tests in cross tee connections other than main tee connections, from two different providers of suspended ceilings in New Zealand. The experimental setups for tensile and compression monotonic tests are displayed in Fig. 30b, c respectively. A lower vise keeps one end of the vertical runner blocked while the upper vise imposes a vertical displacement to the other end in the test rig for tensile monotonic tests. Moreover, the horizontal runners are not fixed at the edges. The setup for compression tests was performed with a piece of 15 mm-thickness laminated veneer lumber. Eight steel angles of 50 mm length are screwed on the lumber to keep the T-section profiles orthogonal. Vertical main runners are loaded by the machine. For both typologies of specimens, failure in tension was caused by tearing of the slot in the transversal runner, but no information is given about the post-peak behaviour of joints, whereas in compression buckling of the joint caused compression and deformation of it. For main tee joints, the resistance in compression was higher than in tension, while the opposite was reported for cross tee joints. In fact, the behaviour of cross tee connections in compression and main tee connections in tension was found to be critical. Cross-tee element connections (type 2) showed a maximum compressive strength of 860 N whereas in tension, the maximum value reached 1290 N which is comparable to the C-C Seism B24 ones. Main-tee splices exhibited a lower tensile strength equal to 1020 N and higher compressive strength of 2420 N compared to the European ones.
4.2.4 Base24 Main Runner joint
The results obtained from monotonic tension tests on main runner joints are reported in Table 13. The results show high variability and elasto-fragile behaviour, with peak of resistance in correspondence of 1–2 mm of displacement (Fig. 31). The collapse mechanism is illustrated in Fig. 32 and corresponds to complete tearing of the dimple.

Force-displacement response of M Main B24 joints specimens

Detail of damage of the dimple
5 Comparison of the experimental results
Table 14 resumes and compares the average values from experimental results. In cyclic tests the different standard joints were characterized by a comparable strength in tension. The C-M Stand B24 joints exhibited the maximum tension resistance value equal to 364.8 N due to the greater thickness and width of the Main runners’ web compared to the Cross runners’ ones and to the shape of the cross section. On the other side, in compression, the M-M Stand B15 joints were characterized by a peak of resistance of − 995.418 N, a value 1.66 and 1.88 times greater than, respectively, C-M and C-C Stand B24 joints. The testing results for C-M Stand B24 joints have the highest values of standard deviation (~ 19.5%), comparable only to the value obtained by B15 joints in compression. All the specimens were characterized by an asymmetric behaviour due to the higher resistance values obtained at the closure of the gap in compression and an elasto-fragile behaviour in tension with no residual resistance.
The cyclic tests on the seismic joints highlighted comparable strength value in tension and a standard deviation equal to a maximum of 13.2%. Similarly in compression the maximum values of force are comparable and the maximum standard deviation is 14.3%. The different geometrical details of the seismic joints compared to the standard ones involved a strongly asymmetric behaviour characterized by a peak in tension equal to about 1200 N, a value about 2.5 times higher than the values obtained in compression. The tests highlighted a tensile resistance of the seismic joints about 3.4 times greater than the standard ones. Whereas, in compression, the seismic joints reached a maximum force value 20% lower than the standard ones.
The behaviour of standard joints is similar to the initial behaviour of seismic ones and is marked by the tearing of the slot of the perpendicular runner. Conversely, standard joints do not exhibit any residual resistance after the peak of resistance, that is instead insured by seismic joints. In the standard joints the failure is associated to minimal damage at the notch whereas in seismic joints the failure is reached when the Z fold unfolded completed at the end of the test. There is no evidence of damage in compression, whose action however causes the unlocking of the fold of both seismic and standard joints. The difference in average standard deviation between standard and seismic joints can be justified by their different geometry, as seismic joints have less tolerance in the design of their joints compared to standard ones.
Finally, M-Main B24 joints highlighted a high variability in the results and an average value of resistance in tension equal to 954.56 N. An elasto-fragile behaviour due to the tearing of the dimple also characterized these joints.
6 Numerical models of the joints
A hysteresis numerical model was realised with the software OpenSees and calibrated on the experimental results obtained previously presented.
The numerical model of standard joints was realised combining one truss element with the material model Pinching4 (available in the software) in order to replicate the nonlinear behaviour of the joints (Mazzoni et al. 2006).
The parameters that characterise Pinching4 are described in detail in Mazzoni et al. (2006) and allow to describe both the compression and tension domain of the cyclic behaviour. Moreover, hardening and softening characteristics were considered in addition to the decaying of mechanical properties caused by the repetition of cycles. However the material doesn’t consider stiffness and strength degradation. In the area of hysteretic models, several publications are available for parameter estimation, e.g. Noël and Kerschen (2017).
Differently from the previous numerical model, for Seismic Base24 joints two springs in parallel were chosen to accurately represent the experimental behaviour. In detail, a truss element with hysteretic material model (Mazzoni et al. 2006) was used to reproduce the peak of resistance in tension observed experimentally, while pinching4 material model was assigned to the second spring. The elements used in the simulations were fixed at one extreme and free to flow to the opposite side. The numerical models were subjected to displacement-controlled reversed cyclic analysis in order to replicate the experimental loading history. The parameters were defined to obtain a faithful representation of the experimental results and the most significant experimental cycles were considered, as described in the following paragraphs.
6.1 Base15
The numerical model for the Standard Base15 joints was calibrated fitting the experimental capacity curves and the maximum amplitude of the cycles was chosen equal to 4.5 mm, that corresponds to the experimental near-collapse condition. In Table 15, the parameters selected for the pinching4 material model are reported.
As it can be observed in Fig. 33a, the numerical model accurately reproduces the experimental curves of the specimen M-M Stand B15_3c. Moreover, Fig. 33b shows that the difference in terms of accumulated energy at near collapse condition is less than 5%.

Numerical calibration B15 joint (M-M Stand B15 3c test): a hysteresis cycles comparison; b accumulated hysteretic energy comparison
6.2 Base24 Standard
The specimens used for testing of Base24 Standard joints are reported in Table 16. In analogy with the previous case, the numerical truss element that represents Standard Base24 was calibrated on the experimental results obtained. The last cycle considered for both specimens has maximum displacement equal to 3.75 mm.
6.2.1 C-M Standard B24
In Table 17, the parameters selected for the pinching4 material model for C-M Standard joints are reported and the specimen selected for the calibration is C-M Stand B24_3c.
In Fig. 34a, experimental and numerical cycles are compared and show a good correspondence. In Fig. 34b the graphs indicate a local overestimation (30%) of the numerical values for the first cycles, while the average difference is less than 10%.

Numerical calibration C-M Standard B24 joint (C-M Stand B24_3c test): a hysteresis cycles comparison; b accumulated hysteretic energy comparison
6.2.2 C-C Standard B24
In Table 18, the parameters selected for the pinching4 material model for C-C Standard joints are reported and the specimen selected for the calibration is C-C Stand B24_2c. The comparison of the hysteresis cycles and the accumulated hysteretic energy are described in Fig. 35a, b. According to the results, there is a good correspondence of strength, stiffness and energy dissipation between numerical and experimental values. Moreover, Fig. 35b shows that the numerical results don’t overestimate the experimental results and their average deviation is less than 5%.

Numerical calibration C-C Standard B24 joint (C-C Stand B24_2c test): a hysteresis cycles comparison; b accumulated hysteretic energy comparison
6.3 Base24 Seismic
The specimens used for testing Base24 Seismic joints are reported in Table 19. The numerical model that was adapted to describe their behaviour is characterised by two springs in parallel, with hysteretic material model and pinching4.
As described in the previous sections, the behaviour of seismic joints is more articulated than standard joints. In detail, they show a peak of resistance in tension and tearing of the slot in compression, followed by secondary mechanisms. Consequently, the numerical model of the seismic joints was calibrated considering only the first-order resistance mechanisms.
6.3.1 C-M Seismic B24
Tables 20 and 21 report the parameters selected for the pinching4 material model for C-M Seismic joints and the specimen selected for the calibration is C-M Seism B24_3c. As shown by Fig. 36a, b, numerical and experimental values have a good correspondence. Moreover, the deviation value of local results that is indicated in the energy graph is 20% with an average value discrepancy of less than 10%.

Numerical calibration C-M Seism B24 joint (C-M Seism B24_3c test): a hysteresis cycles comparison; b accumulated hysteretic energy comparison
6.3.2 C-C Seismic B24
Tables 22 and 23 report the parameters selected for the pinching4 material model for C-C Seismic joints and the specimen selected for the calibration is C-C Seism B24_3c.
The numerical model accurately reproduces the behaviour of the seismic joint and is able to capture the main resistant mechanisms. As a consequence of the calibration of the peak in resistance, the numerical model underestimates the energy (Fig. 37).

Numerical calibration C-C Seism B24 joint (C-C Seism B24_3c test): a hysteresis cycles comparison; b accumulated hysteretic energy comparison
7 Conclusions
Preliminary numerical analyses were performed on a full-scale model of a suspended ceiling realised with modular tiles to verify that the axial actions are predominant on joints. Then, experimental tests were performed on standard and seismic joints, other than joints connecting main runners, all manufactured and installed in Europe. The yielding point and the final damage in tension were evaluated with monotonic tension tests, while cyclic quasi static tests were developed to evaluate the overall behaviour of the joints when alternate loading was applied. The purpose of this work was to assess and compare the experimental behaviour of standard and seismic joints, whose shape and mechanics differ from the ones described in literature. Moreover, the joints tested were installed in different typologies of runners so that the factors contributing to the global behaviour could be identified.
Standard joints demonstrated elasto-fragile behaviour, characterised by good values of strength but limited ductility. Seismic joints are instead marked by an initial high resistance value, that corresponds to approximately four times the tensile maximum resistance when compared to standard joints. This result can be justified by the contribution of the internal notch that is installed on seismic joints. Conversely from other joints tested, after failure of the notch, seismic joints highlighted a residual resistance which allows to reach a displacement capacity comparable to standard joints and improve the seismic performance in terms of safety assessment.
In compression the behaviour is critical, particularly for Base24 specimens, since they showed high strength degradation after the first cycle.
The joints connecting main runners in Base24 specimens reported high variability of results. This can be associated with the geometry of the joints, that doesn’t facilitate the proper locking of the runners causing lack of repeatability in this operation.
Regarding seismic joints, the aim of their design is to withstand seismic action with high resistance rather than a ductile mechanism. However, the shape of the joint allows to exploit a residual resistance which increases its displacement capacity. Nevertheless, a new design could be provided to the seismic joints in order to achieve higher values of resistance in compression and a dissipative behaviour. Similarly to seismic joints, a change in the design of standard joints could improve their behaviour in compression. Finally, the design of main runner joints should be reviewed in order to achieve more consistency in their connection details, that could ultimately reduce the variability in the experimental results.
The experimental results reported that the geometry of the runners slightly affects the behaviour of the joints. In detail, the tests on Base15 joints outlined smaller displacements in compression than Base24 joints. Furthermore, the tensile resistance is correlated to the properties of the transversal runners, since the final damage corresponds to tearing of the slot. In conclusions, since the experimental results of identical joints installed in different runners have only small difference, the contribution of the geometry and mechanical characteristics of the runners can be neglected. Numerical models were developed for the joints tested and their calibration resulted in a good correspondence with the experimental results. Numerical models of joints are intended to be included in detailed numerical modelling of complete suspended ceilings. Therefore, this work provides the basis for a parametric numerical investigation on suspended ceilings to further investigate their seismic behaviour. The results here presented could be used in sensitivity analyses, where the influence of the performances of joints on the global behaviour of suspended ceilings could be established.
References
American Society for Testing and Materials International (2013) C636/C636M-13. Standard practice for installation of metal ceiling suspension systems for acoustical tile and lay-in panels, PA, USA
American Society for Testing and Materials International (2017) C635/C635M-17. Standard specification for manufacture, performance, and testing of metal suspension systems for acoustical tile and lay-in panel ceilings, PA, USA
American Society for Testing and Materials International (2017) E580/E580M-17. Standard practice for installation of ceiling suspension systems for acoustical tile and lay-in panels in areas subject to earthquake ground motions, PA, USA
American Society of Civil Engineers (2016) ASCE/SEI 7-16. Minimum design loads for buildings and other structures, vol 7, chapter 13: seismic design requirements for non-structural components, American Society of Civil Engineers, USA
Badillo-Almaraz H, Whittaker AS, Reinhorn AM (2007) Seismic fragility of suspended ceiling systems. Earthq Spectra 23(1):21–40. https://doi.org/10.1193/1.2357626
Brandolese S, Scotta R (2019) Numerical dynamic analyses of suspended ceilings with an innovative bracing system. In: Proceeding of the 4th international workshop on seismic performance of non-structural elements (SPONSE), May 22–23, 2019, Pavia, Italy
Brandolese S, Fiorin L, Scotta R (2019) Seismic demand and capacity assessment of suspended ceiling systems. Eng Struct. https://doi.org/10.1016/j.engstruct.2019.05.034
Chopra AK (1995) Dynamics of structures: theory and applications to earthquake engineering. Prentice Hall, Englewood Cliffs
Dhakal RP, MacRae G (2013) Ceiling systems design and installation lessons from the canterbury earthquakes. In: Proceedings of the 10th international conference on urban earthquake engineering, March, 1–2, 2013, Tokyo, Japan
Dhakal RP, MacRae GA, Hogg K (2011) Performance of ceilings in the February 2011 Christchurch earthquake. Bulletin of the New Zealand Society for Earthquake Engineering, vol 44, no 4
Dhakal RP, MacRae GA, Pourali A, Paganotti G (2016) Seismic fragility of suspended ceiling systems used in NZ based on component tests. Bulletin of the New Zealand Society for Earthquake Engineering, vol 49, no 1
Echevarria A, Zaghi AE, Soroushian S, Maragakis EM (2012) Seismic fragility of suspended ceiling systems. In Proceedings of the 15th world conference on earthquake engineering. September 24–28, 2012. Lisbon, Portugal
European Committee for Standardization (CEN) (2006) EN 12512—timber structures—test methods—cyclic testing of joints made with mechanical fasteners, Brussels, Belgium
Filiatrault A, Sullivan T (2014) Performance-based seismic design of non-structural building components: the next frontier of earthquake engineering. Earthq Eng Eng Vib 13(1):17–46
Fiorin L (2017) PhD thesis: seismic assessment of suspended ceilings through cyclic quasi-static tests, University of Padua, Italy
Foschi RO, Bonac T (1977) Load slip characteristic for connections with common nails. Wood Sci Technol 9:118–123
Gilani ASJ, Reihorn A, Ingratta T, Glasgow B, Lavan O (2008) Earthquake simulator testing and evaluation of suspended ceilings: standard and alternate perimeter installations. In: Proceedings of structures congress 2008. April 24–26, 2008. Vancouver, British Columbia, Canada, pp 1–10
Gilani ASJ, Takhirov SM, Straight Y (2017) Evaluation of seismic performance of suspended ceiling systems using dynamic testing and finite element analysis. In: Proceedings of the 16th world conference on earthquake engineering, January 9–13, 2017, Santiago Chile, Chile
MacRae GA, Hair J, Dhakal RP (2011) Ceiling damage in the 2010 Canterbury earthquake. In: Proceedings of joint 8th center for urban earthquake engineering (CUEE) and 8th international conference on earthquake engineering (ICEE) conference proceedings, pp 7–8
Magliulo G, Pentangelo V, Maddaloni G, Capozzi V, Petrone C, Lopez P, Talamonti R, Manfredi G (2012) Shake table tests for seismic assessment of suspended continuous ceilings. Bull Earthq Eng 10(6):1819–1832. https://doi.org/10.1007/s10518-012-9383-6
Mazzoni S, McKenna F, Scott MH, Fenves GL (2006) The open system for earthquake engineering simulation (OpenSEES) user command-language manual
Ministero delle Infrastrutture e dei Trasporti (2018) Technical standards for buildings, Ministerial Decree of 17 January, 2018
Noël JP, Kerschen G (2017) Nonlinear system identification in structural dynamics: 10 more years of progress. Mech Syst Signal Process 83:2–35
Paganotti G, MacRae GA, Dhakal RP (2011) Development of typical NZ ceiling system seismic fragilities. In: Proceedings of ninth pacific conference on earthquake engineering (PCEE), April 14–16, 2011, Auckland, New Zealand, pp 14–16
Perrone D, Calvi PM, Nascimbene R, Fischer EC, Magliulo G (2018) Seismic performance of non‑structural elements during the 2016 Central Italy earthquake
Soroushian S, Rahmanishamsi E, Ryu KP, Maragakis EM, Reinhorn AM (2014) A comparative study of sub-system and system level experiments of suspension ceiling systems. In: Proceedings of the 10th U.S. national conference on earthquake engineering frontiers of earthquake engineering, July, 21–25, 2014, Anchorage, Alaska
Soroushian S, Maragakis EM, Jenkins C (2015) Capacity evaluation of suspended ceiling components, part 1: experimental studies. J Earthq Eng 19(5):784–804. https://doi.org/10.1080/13632469.2014.998354
Soroushian S, Maragakis M, Jenkins C (2016a) Axial capacity evaluation for typical suspended ceiling joints. Earthq Spectra 32(1):547–565. https://doi.org/10.1193/123113EQS301M
Soroushian S, Rahmanishamsi E, Ryu KP, Maragakis M, Reinhorn AM (2016b) Experimental fragility analysis of suspension ceiling systems. Earthq Spectra 32(2):881–908
Soroushian S, Zaghi AE, Rahmanishamsi E, Itani AM, Pekcan G (2016c) Response of a 2-story test-bed structure for the seismic evaluation of nonstructural systems. Earthqu Eng Eng Vib 15(1):19–29. https://doi.org/10.1007/s11803-016-0302-8
Yao GC, Chen WC (2017) Vertical motion effects on suspended ceilings. In: Proceedings of the 16th world conference on earthquake engineering, January 9–13, 2017, Santiago Chile, Chile
Zaghi AE, Soroushian S, Echevarria Heiser A, Maragakis M, Bagtzoglou A (2016) Development and validation of a numerical model for suspended-ceiling systems with acoustic panels. J Architectural Eng 22(3):04016008
Funding
Open access funding provided by Università degli Studi di Padova within the CRUI-CARE Agreement.
Author information
Authors and Affiliations
Corresponding author
Additional information
Publisher's Note
Springer Nature remains neutral with regard to jurisdictional claims in published maps and institutional affiliations.
Rights and permissions
Open Access This article is licensed under a Creative Commons Attribution 4.0 International License, which permits use, sharing, adaptation, distribution and reproduction in any medium or format, as long as you give appropriate credit to the original author(s) and the source, provide a link to the Creative Commons licence, and indicate if changes were made. The images or other third party material in this article are included in the article's Creative Commons licence, unless indicated otherwise in a credit line to the material. If material is not included in the article's Creative Commons licence and your intended use is not permitted by statutory regulation or exceeds the permitted use, you will need to obtain permission directly from the copyright holder. To view a copy of this licence, visit http://creativecommons.org/licenses/by/4.0/.
About this article

Cite this article
Fiorin, L., Brandolese, S. & Scotta, R. Experimental and numerical assessment of suspended ceiling joints. Bull Earthquake Eng 19, 919–962 (2021). https://doi.org/10.1007/s10518-020-00935-8
Received:
Accepted:
Published:
Issue Date:
DOI: https://doi.org/10.1007/s10518-020-00935-8