- Research
- Open access
- Published:
Extreme learning with chemical reaction optimization for stock volatility prediction
Financial Innovation volume 6, Article number: 16 (2020)
Abstract
Extreme learning machine (ELM) allows for fast learning and better generalization performance than conventional gradient-based learning. However, the possible inclusion of non-optimal weight and bias due to random selection and the need for more hidden neurons adversely influence network usability. Further, choosing the optimal number of hidden nodes for a network usually requires intensive human intervention, which may lead to an ill-conditioned situation. In this context, chemical reaction optimization (CRO) is a meta-heuristic paradigm with increased success in a large number of application areas. It is characterized by faster convergence capability and requires fewer tunable parameters. This study develops a learning framework combining the advantages of ELM and CRO, called extreme learning with chemical reaction optimization (ELCRO). ELCRO simultaneously optimizes the weight and bias vector and number of hidden neurons of a single layer feed-forward neural network without compromising prediction accuracy. We evaluate its performance by predicting the daily volatility and closing prices of BSE indices. Additionally, its performance is compared with three other similarly developed models—ELM based on particle swarm optimization, genetic algorithm, and gradient descent—and find the performance of the proposed algorithm superior. Wilcoxon signed-rank and Diebold–Mariano tests are then conducted to verify the statistical significance of the proposed model. Hence, this model can be used as a promising tool for financial forecasting.
Introduction
Stock market behavior is typically uncertain and time-varying in nature, being highly associated with market volatility and non-linearity. When the market reacts to current political and other macroeconomic factors, it behaves arbitrarily. As such, due to its complex and dynamic nature, stock market prediction has been considered a challenging task for stakeholders. Achieving better prediction accuracy with less input data and a less complex model architecture is the key objective of market analysts. However, in reality, this is a critical, demanding, and challenging job. In this context, volatility is a widely accepted practical measure of risk for defining uncertainty in the financial market. While most market variables are largely unpredictable, certain characteristics of volatility can increase the accuracy of forecasted values. Volatility of an asset describes the spread of outcomes for a variable, thus playing an imperative role in various financial applications. The key usage of volatility is approximately calculating the value of market risk. Volatility is known to be stochastic and time-varying in nature. Therefore, a wide range of methods is in use to forecast and manage volatility risk.
To this end, various statistical and computational models have been established by observing the concealed laws of real stock data. As stock data do not follow a fixed pattern, statistical models can not reflect their nonlinearity. As such, numerous soft computing methodologies have been proposed during past few decades, including artificial neural networks (ANNs), fuzzy systems, and evolutionary optimization algorithms. These advancements help model dynamic and multivariate nonlinear systems in terms of stock volatility prediction. For instance, the use of ANNs in modeling economic systems is rapidly expanding, as they recognize the nonlinear correlation present in historical stock data. The most widely used ANNs for financial time series prediction include multilayer perceptron (Wang et al., 2012; Xi et al., 2014), radial basis functional network (Shen et al., 2011), and higher order neural networks such as functional link artificial neural network (Majhi et al., 2009; Nayak et al., 2012) and Pi-Sigma neural networks (Nayak et al., 2016). Stock market return forecasting is demonstrated by Zhong and Enke (Zhong & Enke, 2017; Zhong & Enke, 2019). To analyze the relationship between minimum cost and maximum return, a generalized soft cost consensus model under a certain degree of consensus is proposed by Zhang et al. (Zhang et al., 2019). The effect of retail investor attention on stock price crash risk is demonstrated by Wen et al. (Wen et al., 2019). A survey of existing researches and methodologies on assessment and measurement of financial systemic risk combined with machine learning technologies is carried out by Kou et al. (Kou et al., 2019) and, Nayak and Misra (Nayak & Misra, 2018). Group decision making and a multi-criteria decision making approach for economic interpretations are found in research works by Kou et al. (Kou et al., 2012) and Chao et al. (Chao et al., 2019). A multi-criteria decision making-based approach for clustering algorithm evaluation in the domain of financial risk analysis is proposed by Kou et al. (Kou et al., 2014).
The performance of ANN-based forecasting models mainly depends on network structure and the learning algorithm. Gradient descent-based back propagation learning is a widespread technique used in ANNs. However, it has a slow convergence rate, becomes trapped in the local minima, and has imprecise learning rate, which make the model time consuming and add computational overhead (Fernández-Navarro et al., 2012). To overcome these limitations, a novel algorithm called extreme learning machine (ELM) was proposed by Huang et al. (Huang et al., 2006; Huang et al., 2012). ELM chooses the weight of connections between the input variables and the neurons in the hidden layer at random. The output weights are determined analytically as a substitute to iterative fine-tuning. Several recent studies use ELM for various real applications, such as time series prediction (Grigorievskiy et al., 2014), sales forecasting (Sun et al., 2008), financial time series forecasting (Dash et al., 2014), electricity load forecasting (Zhang et al., 2013; Yap & Yap, 2012), and power system economic dispatch (Yang et al., 2013). However, a literature review indicates two important issues associated with ELM:
The possibility of inclusion of non-optimal weights and bias of the hidden nodes may affect output weights.
The random initialization of hidden node parameters such as the number of hidden nodes may have an important impact on network performance.
To address the first issue, several researchers adopted evolutionary learning techniques, such as genetic algorithm (GA), particle swarm optimization (PSO), differential evolution (DE), harmony search (HS), as well as their variants to pre-train the ELM to reach the optimal solution. Several combinations of these models, such as GA-based ELM (Aha, 1992), PSO-based ELM (Han et al., 2013; Han et al., 2011), DE-based ELM (Zhu et al., 2005), Cuckoo Search-based ELM (Mohapatra et al., 2015), and HS-based ELM (Huang et al., 2012) have already been proposed and their efficiency demonstrated. These models not only have improved accuracy but also ensure system stability. However, to the best of our knowledge, no study addresses the second issue.
Chemical reaction optimization (CRO) is a recent advancement in meta-heuristic paradigm, having a wider success in a large number of application areas, as proposed by Lam and Li (Lam & Li, 2010). CRO loosely combines the properties of natural chemical reactions with mathematical optimization and is characterized by fast convergence capability, requiring fewer tunable parameters. Please refer articles in (Nayak et al., 2017; Nayak et al., 2015; Alatas, 2012) for more details on CRO and its applications. Unlike other optimization techniques, CRO does not need many parameters to be specified at the beginning, but only the number of initial reactants is necessary for implementation. As the initial reactants are scattered over a feasible global search expanse, optimal solutions can be obtained with limited iteration, thus leading to significant reduction in computational time. We construct a learning framework by combining the advantages of ELM and CRO, which simultaneously optimizes the weight and bias vector, as well as the number of hidden neurons of a single layer feed-forward neural network (SLFN) without compromising prediction accuracy.
This study proposes extreme learning with CRO, that is, an ELCRO-based forecasting model for financial time series. The model includes both the extreme learning ability of ELM and the fast convergence capability of CRO, hence representing the nonlinearity present in stock data. However, ELCRO does not attempt to change the basic properties of ELM, but rather optimizes the number of hidden neurons, weight, and bias vector of a SLFN-based model without compromising forecasting accuracy. The best combination of these three parameters is decided by ELCRO on the fly without human intervention. The performance of the proposed method is then compared with that of three other models: PSO-ELM, GA-ELM, and GD-ELM.
The rest of the article is organized as follows. The ELM is described in more detail in Extreme learning machine and CRO in Learning techniques. The proposed ELCRO is presented in ELCRO. The analysis and experimental results are summarized in Experimental results. Finally, Conclusions concludes.
Extreme learning machine
As discussed in the previous section, ELM considers random weights and biases for hidden neurons and analytically determines output weights. An alternative to iteratively tuning these weights is the generalized inverse operation of the hidden layer output. The relationship between output vector Oj and input vector xj is given as:
where wi = [wi1, wi2, ⋯, win]T, i = 1, 2, ⋯, Nh is the weight vector between input neurons(n = number of input neuron) and the ith hidden neuron; βi = [βi1, βi2, ⋯, βim]T is the output weight vector connecting the ith hidden neuron with the output neurons; bi is the bias of the ith hidden neuron; Nh is the total number of hidden neurons; m is the number of output neuron; and N is the number of training samples.
Output weight vector βi is obtained by solving Hβ = Y, where:
In general, Nh ≪ N (i.e., the number of hidden nodes is considerably lower than the number of training samples). Therefore, H is non-square and may be a non-singular matrix in most cases. Hence, there may not exist wi, bi, βi satisfying Eq.(2), meaning the SLFN can be trained by finding the least square minimum norm solution \( \hat{\beta} \) of (2) as follows:
The minimum norm least square solution of Eq.(2) is calculated as follows:
Where H+ is the pseudo inverse or Moore–Penrose inverse of H. Prospective readers may refer to (Zhong & Enke, 2019; Zhang et al., 2019) for more details on ELM.
Learning techniques
This section briefly describes the three basic evolutionary learning techniques used in this study, namely CRO, PSO, and GA.
Chemical reaction optimization
CRO is a meta-heuristic proposed by Lam and Li (Lam & Li, 2010), inspired from natural chemical reactions. The concept mimics the properties of natural chemical reactions and slackly combines it with mathematical optimization techniques. A chemical reaction is a natural phenomenon of transforming unstable chemical substances to stable ones through intermediate reactions. A reaction starts with unstable molecules with excessive energy. Then, the molecules interact with each other through a sequence of elementary reactions and yield products with lower energy. During a chemical reaction, the energy associated with a molecule changes with the change in intra-molecular structure and becomes stable at one point, that is, the equilibrium point. The termination condition is verified by performing a chemical equilibrium (inertness) test. If the newly generated reactant has a better function value, it is included and the worse reactant excluded, and otherwise, a reversible reaction is applied. The literature includes several applications of CRO for classification and financial time series prediction (Nayak et al., 2017; Nayak et al., 2015; Alatas, 2012).
The two major components of CRO are i) molecule, as the basic manipulated agent, and ii) elementary chemical reactions, as the search operators.
Molecule
The basic manipulated agent in CRO is the molecule, similar to the individual in optimization techniques. An alteration in molecular structure triggers another potential solution in the search space. The energy associated with a molecule is termed as kinetic energy (KE) and potential energy (PE). A transformation of a molecule m to m' is only possible if PEml ≤ PEm + KEm. KE helps a molecule shift to a higher potential state and provides the ability to avoid local optima. Hence, more favorable structures may be found in future alterations. In CRO, the inter conversion between the KE and PE among molecules can be achieved through a few elementary chemical reactions similar to the number of steps in optimization techniques. As the algorithm evolves, the molecules have an increasingly energy state and ensure convergence.
Elementary chemical reaction
Some elementary chemical reactions are used as search operators in CRO. Different chemical reactions are applied as operators for the exploration as well as the exploitation of the search space. These reactions may be divided into two categories: monomolecular (one molecule takes part in the reaction) or bimolecular (two molecules take part in chemical reaction). Monomolecular reactions (Redox1 and Decomposition) assist in intensification, while bimolecular reactions (Synthesis, Redox2 and Displacement) can lead to diversification. Here, the chemical reactions are explained considering the binary encoding of molecules.
Decomposition reaction
A decomposition reaction occurs when a molecule splits into two fragments on collision with the wall of the container. The products are quite different from the original reactants. Generally, we represent the decomposition of a molecule m into \( {m}_1^{\prime } \) and \( {m}_2^{\prime } \) as follows:
We examine every value of m. If m(i) is equal to one, its value is copied to \( {m}_1^{\prime }(i) \), and the \( {m}_2^{\prime }(i) \) value is set at random. If m(i) is equal to zero, its value is copied to \( {m}_2^{\prime }(i) \), and the \( {m}_1^{\prime }(i) \) value is set at random. Since \( {m}_1^{\prime } \) and \( {m}_2^{\prime } \) are different, they can be treated as two different solutions in the search space and may increase the exploration capability of the CRO. Reaction \( m\to {m}_1^{\prime }+{m}_2^{\prime } \) is acceptable only if \( PE\left({m}_1^{\prime}\right)+ PE\left({m}_2^{\prime}\right)> KE(m)+ PE(m) \).
Redox1 reaction
In this reaction, a molecule is allowed to collide with the wall of the container. This is also called an on-wall-ineffective collision. As a result, a small change occurs in the molecular structure. A new product m′ is formed by flipping a random bit of m as follows:
Chemical system m → m′ is acceptable if KE(m) + PE(m) < PE(m′), and is otherwise rejected.
Synthesis reaction
In a synthesis reaction, two molecules m1 and m2 synthesize to form a single product m′ with much that is significantly different from the original molecule. The reaction can be expressed as follows:
Here, the corresponding bit values of the reactants are compared. If there is a match, the bit value of any molecule is copied to the product. If they do not match, either the bit value of m1 or m2 will be randomly copied. The new chemical system m1 + m2 → m′ is acceptable if KE(m1) + KE(m2) + PE(m1) + PE(m2) < PE(m′).
Redox2 reaction
In this type of reaction, two molecules m1 and m2 are reacting with each other to produce two new products \( {m}_1^{\prime } \) and \( {m}_2^{\prime } \). This can be represented as follows:
We select two random points within 1 and the length of the reactant. Then, the bit values between these points are swapped to obtain two new products. If KE(m1) + KE(m2) + PE(m1) + PE(m2) < PE(m1′) + PE(m2′), chemical system m1 + m2 → m1′ + m2′ will be accepted or otherwise rejected.
Displacement reaction
In case of a displacement reaction, two new molecules are formed as products of the collision of two reactants. The reaction can be represented as follows:
We compare the corresponding bit values of the two reactants. We swap these bit values to produce new products. If KE(m1) + KE(m2) + PE(m1) + PE(m2) < PE(m1′) + PE(m2′), chemical system m1 + m2 → m1′ + m2′ will be accepted and otherwise rejected.
Under the reactant update step, a chemical equilibrium test is performed. If the newly generated reactants yield a better function value, the new reactant set is included and the worse reactant is excluded, similar to reversible chemical reactions. The reactants are updated according to their enthalpy (fitness value). The CRO is then terminated when the termination criterion (e.g., maximum number of iterations or threshold error value) has been met.
CRO is more robust and uses fewer tunable parameters as compared to other optimizations (Lam & Li, 2010; Alatas, 2012). It only requires the number of initial reactants. In this work, we use binary encoding for reactants and the uniform population method for initial population generation. The initial reactants are evenly initialized in the feasible searching space. As such, all vectors in a space can be obtained as a linear combination of elements of the base set. Absence of one element in the base set creates a reduction in that dimension corresponding to this element. Therefore, it is important that the initial reactants must contain reactants that hold each element of the base set. Additionally, the initial reactants must be regular and hold the base set. The uniform population method used to generate the initial reactant pool is defined by Algorithm 1. The overall process of CRO algorithm is shown in Fig. 1.


Chemical reaction optimization process
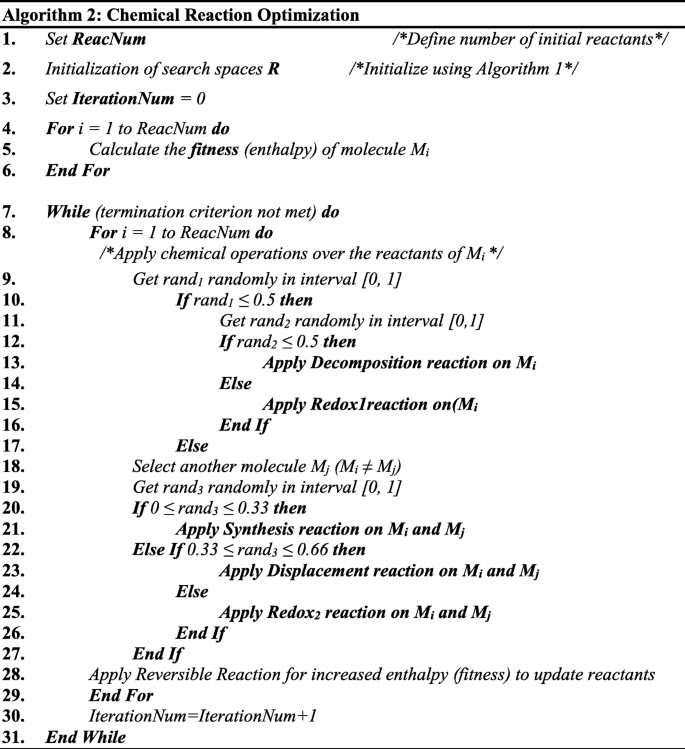
Variants of many nature-inspired evolutionary algorithms have been proposed and applied to solving nonlinear problems. However, their performance varies by dataset. According to the “no free lunch theorem,” there is no single state of the art constraint handling technique that can outperform all others in every problem. Hence, choosing a suitable optimization technique for solving a particular problem involves numerous trials and errors. The efficiency of these optimization techniques is characterized by tuning parameters. For better convergence of an algorithm, suitable fine-tuned parameters are required. To search for the global optimum solution, the algorithm requires an appropriate selection of parameters, which makes the use of algorithm difficult. Hence, an optimization technique requiring fewer parameters, a small number of computations, as well as a good approximation capability is best. CRO is one such technique. These facts motivated us to adopt CRO. The pseudo code for CRO is presented by Algorithm 2.
Particle swarm optimization
PSO is a swarm intelligent-based popular metaheuristic (Kennedy & Eberhart, 1995; Eberhart et al., 1996) that simulates the social behavior of bird flocking, insects, and fish schooling. The search operation of PSO starts with a set of randomly initialized swarms or particles. Each particle can be seen as a candidate solution in the search space. A particle is related to an adaptable velocity (position change) according to which it moves in the search space and has a memory, remembering the best position it has ever visited. It moves towards the best solution with the adjustment of the trajectory of each particle towards its best location and also towards the best particle of the population for each generation. It is simple to implement and has the ability of quickly converging to an optimal solution, and hence is popular for solving multidimensional problems. In PSO, the individuals of a swarm communicate their information and adjust positions and velocities using their group information (Babaei, 2013). In this way, the initial solution propagates through the search space and progressively moves towards the global optimum over a number of generations. The standard PSO algorithm mainly consists ofthree computational steps:
- 1.
Initialize the positions and velocities of particles;
- 2.
Update the position of each particle;
- 3.
Update the velocity of each particle.
Considering a multidimensional problem, let the ith particle at the kth instant move in a D dimensional search space associated with a position Pi and velocity Vi as follows:
The position and velocity of the particle at the (k + 1) th instant can be manipulated as follows:
where c1 and c2 are two constants called acceleration coefficients. Specifically, c1 is the cognitive parameter and c2 is the social parameter. The rand generates a random number in range [0, 1] and wi is the inertia weight for the ith particle; pbesti and gbesti are the local and global bests of the ith particle, respectively.
Genetic algorithm
Genetic algorithms are another popular metaheuristic for a population of probable solutions in the form of chromosomes (Goldberg, 1989; Holland, 1975). They attempt to trace the optimal solution through the process of artificial evolution. The principle is based on biological evolutionary theory and is used to solve optimization problems through encoding a parameter as a replacement for another parameter. It follows the repeated artificial genetic operations: evaluation, selection, crossover, and mutation. Generally, the GA process consist the following basic steps:
- 1.
Initialization of the search node randomly;
- 2.
Evaluation of individual fitness;
- 3.
Application of selection operator;
- 4.
Application of crossover operator;
- 5.
Application of mutation operator;
- 6.
Repetition of the above steps until convergence.
ELCRO
This section describes the proposed ELCRO approach. A SLFN is used as the base model. The model output of SLFN with Nh hidden nodes, N distinct samples (xi, targeti), and activation function f(x) is calculated as per Eq. (1). Term wi ∙ xj represents the inner product of wi and xj.The error computed by the model from these N training samples is = \( \sum \limits_{j=1}^N\left\Vert {y}_j-{target}_j\right\Vert \). SLFN based forecasting model is shown in Fig. 2.

SLFN based forecasting
Now, the training process of SLFN can be viewed as finding the optimal wi, βi, and bi so that the error function will be minimal, that is, minimize the error function:
The value of βi is calculated as per Eq. (4). The model adopts both the extreme learning ability of ELM and fast convergence capability of CRO, hence representing the nonlinearity of stock data. As previously stated, ELCRO does not attempt to change the basic properties of ELM, but rather optimizes the number of hidden neurons and the weight and bias vector for the hidden layer without compromising prediction accuracy. Parameters wi and bi and the number of hidden nodes (Nh) are optimized by CRO. Each molecule (individual) in the CRO represents a potential combination of (wi, bi, Nh) for the SLFN. We used binary encoded molecules for CRO. Each weight or bias is encoded into a binary string of 17 bits. Each hidden neuron is encoded with a single binary value (1 or 0). A value of 1 indicates the presence of a hidden neuron, and 0, its absence. The output weight matrix is computed using Eq. (4). The model output is compared with the actual output or target. The absolute difference between the model estimation and target is considered the error value or enthalpy, that is, the fitness value of the respective molecule. The lower the enthalpy (error) of a molecule, the better its fitness is. The process is applied to all molecules of the reactant pool. CRO applies different chemical reactions as search operator to achieve both intensification and exploitation in the search space. In successive iterations, the molecules with lower fitness (enthalpy) values are replaced by better fit molecules and the reactant pool gradually achieves inertness. Here, using the enthalpy value only as the selection criteria is inappropriate. The efficiency of ELM is greatly influenced by the number of hidden neurons. We also observed the network tends to have lower training time with smaller input sizes (n) without compromising prediction accuracy. For two molecules having the same enthalpy value, the selection strategy considered the one resulting in smaller (n/enthalpy) or (Nh/enthalpy) values based on some probability. The high-level ELCRO training algorithm is presented by Algorithm 3.

Experimental results
This section discusses the analysis process and experimental results. The experiments were carried out using BSE stock data for prediction of one-day-ahead volatility. The daily closing prices for each transaction day were collected from https://www.bseindia.com/indices/. The indices were collected from April 2, 2012 to November 24, 2017. There were 1400 data points in the time series out of which 950(April 2, 2012 to January 29, 2016) were used for training the model and the remaining 450 for testing. The daily closing indices and daily returns of the BSE are shown in Fig. 3. All experiments are carried out in MATLAB-2015, with Intel® core TM i3 CPU, 2.27 GHz processor, and 2.42 GB memory size.

Daily closing prices and daily return of BSE index
Usually, neural network-based models are stochastic in nature. To circumvent the biasness of the model, we conducted the experiments 20 times with the same model architecture and parameters and the same input data. The average of the 20 experiments is considered the performance of the model.
The stock return series are generated from stock index prices as rt = (lnPt − ln Pt − 1) × 100, where rt represents the continuously compounded rate of stock returns from time t-1 to t. Pt represents the daily stock closing price of the day t and Pt-1the daily stock closing price of the day t-1. The volatility for day t is calculated as follows:
Where, Nd is the number of days before the nearest expiry option.
The mean absolute percentage error (MAPE) and average relative variance (ARV) are performance metrics and calculated as per Eqs. (7) and (8), respectively. The closer the value of MAPE is to zero, the better is the prediction ability of the model. If the ARV value of the forecasting model is equal to 1, it is same as considering the mean of the financial time series. The model is considered to be performing the worst compared to the mean if the ARV value is greater than 1. However, the model can be considered as performing better than simply calculating the mean if its ARV value is less than 1. Hence, the closer the value to 0, the more accurate the model tends to be.
The objective is to find a model that yields the lowest forecasting error. As neural network-based models perform better with preprocessed data, before feeding the input signals to the model, we normalized the original closing prices data using the sigmoid normalization technique as suggested in (Nayak et al., 2014). For our experiment, the simulated parameters of the learning algorithms are summarized in Table 1.
Generally, ANN-based models require a sufficient number of examples for training, as training the model with an inadequate number of examples may reduce its approximation and generalization abilities. Improper training does not lead to optimal solutions. However, excess training examples makes the model over fitting and need enormous training time. Therefore, the generalization capacity of a neural-based model is greatly influenced by the training data volume. One approach to generate training patterns from the time series is sliding a window of fixed size over the series. Deciding the window size is a matter of experimentation.
First, we conducted experiments on conventional ELM-based SLFN for volatility forecasting. The performance of the model is tested with different input sizes (n) and different number of hidden neurons (Nh). The MAPE values from training and testing and training times for 10 different combinations of input size and hidden neurons are summarized in Table 2. It can be observed that the MAPE and training time are highly influenced by the number of hidden neurons and volume of input data. For example, the MAPE value from testing is 0.1850722 for Nh = 22 and 0.6400580 for Nh = 8. Considering the lowest input size of 6 and the number of hidden neurons as 16, the MAPEs generated during training and testing are 0.032006 and 0.036507, respectively.
In the next phase, we employed evolutionary optimization techniques (i.e., CRO, PSO, and GA) to simultaneously optimize the synaptic weight vector (w), bias value (b),and number of hidden neurons (Nh) of the SLFN model. The optimal parameters are decided by the evolutionary techniques instead of selecting them through experimentation. The search process starts with random w, b, and Nh values; gradually moves toward better locations in the search space; and finally lands at optimal values on convergence.
The performance of the proposed approach is compared with those of three other forecasting models. The comparative models are PSO-based ELM (PSO-ELM), GA-based ELM (GA-ELM), and a conventional gradient descent-based ELM (GD-ELM). The training and testing datasets for are the same all models. The models are developed in a way similar to ELCRO. The MAPE and ARV values obtained from the models are summarized in Table 3. The error values are presented separately for the training and test data. The best error values are shown in bold. It can be observed from Table 3 that the ELCRO achieves the best MAPE and ARV values. These best error statistics are obtained by ELCRO with input size 5 and 14 hidden neurons. The estimated volatilities by the models against the actual values are separately plotted in Figs. 4, 5, 6, 7, 8, 9, 10 and 11 for training and test datasets.

Estimated v/s actual volatility by ELCRO during training

Estimated v/s actual volatility by ELCRO during testing

Estimated v/s actual volatility by PSO-ELM during training

Estimated v/s actual volatility by PSO-ELM during testing

Estimated v/s actual volatility by GA-ELM during training

Estimated v/s actual volatility by GA-ELM during testing

Estimated v/s actual volatility by GD-ELM during training

Estimated v/s actual volatility by GD-ELM during testing
Similarly, the four models are employed to forecast the daily closing prices of the BSE index. The MAPE and ARV values obtained during training and testing are summarized in Table 4. The best error statistic values are shown in bold. The ELCRO approach outperforms to others. The performances of the models are compared in terms of training time. The time consumed during training and testing is summarized in Table 5.The computation time of ELCRO is smaller than those of the other models. This confirms the faster convergence of ELCRO.
Statistical significance test
Two statistical tests, namely the Wilcoxon signed rank and Diebold–Mariano tests (Diebold & Mariano, 2002; Nayak et al., 2018), are conducted to verify the statistical significance of the proposed model. The Wilcoxon signed rank test returns the probability value of a paired, two-sided test for the null hypothesis that the difference of the proposed and comparative models comes from a distribution with zero median. The logical value of h = 1 indicates a rejection of the null hypothesis. The Diebold–Mariano test is a pair wise comparison of two time series models for different levels of accuracy. At the 5% significance level, if the statistic falls beyond ±1.965, the null hypothesis of no difference will be rejected. The statistics for the Wilcoxon signed rank test are summarized in Table 6 and those for the Diebold–Mariano test are summarized in Table 7. These results support that the proposed ELCRO method is significantly different from the other methods under consideration.
Conclusions
This study proposes an extreme learning with CRO, that is, the ELCRO approach for training of a SLFN. The model is applied to predict the daily volatility of BSE stock. The model adopts both the extreme learning ability of ELM and the fast convergence capability of CRO. Hence, it captures well the nonlinearity of stock data. ELCRO optimizes the number of hidden neurons and the volume of input signals without compromising the prediction accuracy of the SLFN-based forecasting model. First, 10 different combinations of numbers of hidden neurons and input size are experimentally selected for ELCRO, and the corresponding error signals and execution times are observed. The prediction accuracy is highly influenced by input size and the number of hidden neurons. Second, we employ ELCRO to determine the optimal weight vector along with input size and number of hidden neurons. The best combination is decided by ELCRO on the fly without human intervention. ELCRO is suitable to train a SLFN for stock volatility forecasting. The performance of ELCRO is compared with those of PSO-ELM, GA-ELM, and GD-ELM and found superior. Additionally, the statistical testing results confirm that the proposed model performs significantly better than the other models. The work in this article can be extended by exploring other evolutionary learning methods, as well as applications to other domains.
Availability of data and materials
The datasets analyzed and experimented during the current study are available at https://www.bseindia.com/indices/, which openly available. The source of datasets is highlighted in subsection 5.
Abbreviations
- ANN:
-
Artificial Neural Network
- BSE:
-
Bombay Stock Exchange
- CRO:
-
Chemical Reaction Optimization
- DE:
-
Differential Evolution
- ELCRO :
-
Extreme Learning with CRO
- ELM:
-
Extreme Learning Machine
- FLANN:
-
Functional Link Artificial Neural Network
- GA:
-
Genetic Algorithm
- GA-ELM:
-
Genetic Algorithm based ELM
- GD-ELM:
-
Gradient Descent based ELM
- HS:
-
Harmony Search
- MAPE:
-
Mean Absolute Percentage of Error
- MLP:
-
Multilayer Perceptron
- PSO:
-
Particle Swarm Optimization
- PSO-ELM:
-
Particle Swarm Optimization based ELM
- RBFN:
-
Radial Basis Functional Network
- SLFN:
-
Single Layer Feed forward Network
References
Aha DW (1992) Tolerating noisy, irrelevant and novel attributes in instance-based learning algorithms. Int J Man Machine Stud 36(2):267–287
Alatas B (2012) A novel chemistry based metaheuristic optimization method for mining of classification rules. Expert Syst Appl 39(12):11080–11088
Babaei M (2013) A general approach to approximate solutions of nonlinear differential equations using particle swarm optimization. Appl Soft Comput 13:3354–3365
Chao X, Kou G, Peng Y, Alsaadi FE (2019) Behavior monitoring methods for trade-based money laundering integrating macro and micro prudential regulation: a case from China. Technol Econ Dev Econ 25:1–16
Dash R, Dash PK, Bisoi R (2014) A self adaptive differential harmony search based optimized extreme learning machine for financial time series prediction. Swarm Evol Comput 19:25–42
Diebold FX, Mariano RS (2002) Comparing predictive accuracy. J Bus Econ Stat 20(1):134–144
Eberhart RC, Simpson P, Dobbins R (1996) Computational intelligence PC tools. Academic
Fernández-Navarro F, Hervás-Martínez C, Ruiz R, Riquelme JC (2012) Evolutionary generalized radial basis function neural networks for improving prediction accuracy in gene classification using feature selection. Appl Soft Comput 12(6):1787–1800
Goldberg D (1989) Genetic algorithms in search, optimization, and machine learning. Addison Wesley
Grigorievskiy A, Miche Y, Ventelä AM, Séverin E, Lendasse A (2014) Long-term time series prediction using OP-ELM. Neural Netw 51:50–56
Han F, Yao HF, Ling QH (2011) An improved extreme learning machine based on particle swarm optimization. In: International Conference on Intelligent Computing. Springer, Berlin, pp 699–704
Han F, Yao HF, Ling QH (2013) An improved evolutionary extreme learning machine based on particle swarm optimization. Neurocomputing 116:87–93
Holland J (1975) Adaptation in natural and artificial systems. The University of Michigan Press, Ann Arbor
Huang GB, Zhou H, Ding X, Zhang R (2012) Extreme learning machine for regression and multiclass classification. IEEE Transact Syst Man Cyber Part B (Cybernetics) 42(2):513–529
Huang GB, Zhu QY, Siew CK (2006) Extreme learning machine: theory and applications. Neurocomputing 70(1–3):489–501
Kennedy J, Eberhart R (1995). Particle swarm optimization. In Proceedings of ICNN'95-International Conference on Neural Networks. IEEE, Vol. 4, pp. 1942-1948
Kou G, Chao X, Peng Y, Alsaadi FE, Herrera-Viedma E (2019) Machine learning methods for systemic risk analysis in financial sectors. Technol Econ Dev Econ 25:1–27
Kou G, Lu Y, Peng Y, Shi Y (2012) Evaluation of classification algorithms using MCDM and rank correlation. Int J Inform Technol Decis Making 11(01):197–225
Kou G, Peng Y, Wang G (2014) Evaluation of clustering algorithms for financial risk analysis using MCDM methods. Inf Sci 275:1–12
Lam AY, Li VO (2010) Chemical-reaction-inspired metaheuristic for optimization. IEEE Trans Evol Comput 14(3):381–399
Majhi R, Panda G, Sahoo G (2009) Development and performance evaluation of FLANN based model for forecasting of stock markets. Expert Syst Appl 36(3):6800–6808
Mohapatra P, Chakravarty S, Dash PK (2015) An improved cuckoo search based extreme learning machine for medical data classification. Swarm Evol Comput 24:25–49
Nayak SC, Misra BB (2018) Estimating stock closing indices using a GA-weighted condensed polynomial neural network. Financ Innov 4(1):21
Nayak SC, Misra BB, Behera HS (2012) Index prediction with neuro-genetic hybrid network: a comparative analysis of performance. In: 2012 International Conference on Computing, Communication and Applications (ICCCA). IEEE, pp 1–6
Nayak SC, Misra BB, Behera HS (2014) Impact of data normalization on stock index forecasting. Int J Comp Inf Syst Ind Manag Appl 6:357–369
Nayak SC, Misra BB, Behera HS (2015) Artificial chemical reaction optimization of neural networks for efficient prediction of stock market indices. Ain Shams Eng J 8:371–390
Nayak SC, Misra BB, Behera HS (2016) Fluctuation prediction of stock market index by adaptive evolutionary higher order neural networks. Int J Swarm Intel 2(2–4):229–253
Nayak SC, Misra BB, Behera HS (2017) Artificial chemical reaction optimization based neural net for virtual data position exploration for efficient financial time series forecasting. Ain Shams Eng J 9:1731–1744
Nayak SC, Misra BB, Behera HS (2018) ACFLN: artificial chemical functional link network for prediction of stock market index. Evol Syst 10:1–26
Shen W, Guo X, Wu C, Wu D (2011) Forecasting stock indices using radial basis function neural networks optimized by artificial fish swarm algorithm. Knowl-Based Syst 24(3):378–385
Sun ZL, Choi TM, Au KF, Yu Y (2008) Sales forecasting using extreme learning machine with applications in fashion retailing. Decis Support Syst 46(1):411–419
Wang CP, Lin SH, Huang HH, Wu PC (2012) Using neural network for forecasting TXO price under different volatility models. Expert Syst Appl 39(5):5025–5032
Wen F, Xu L, Ouyang G, Kou G (2019) Retail investor attention and stock price crash risk: evidence from China. Int Rev Financ Analysis 65:101376
Xi L, Muzhou H, Lee MH, Li J, Wei D, Hai H, Wu Y (2014) A new constructive neural network method for noise processing and its application on stock market prediction. Appl Soft Comput 15:57–66
Yang H, Yi J, Zhao J, Dong Z (2013) Extreme learning machine based genetic algorithm and its application in power system economic dispatch. Neurocomputing 102:154–162
Yap KS, Yap HJ (2012) Daily maximum load forecasting of consecutive national holidays using OSELM-based multi-agents system with weighted average strategy. Neurocomputing 81:108–112
Zhang H, Kou G, Peng Y (2019) Soft consensus cost models for group decision making and economic interpretations. Eur J Oper Res 277:964–980
Zhang R, Dong ZY, Xu Y, Meng K, Wong KP (2013) Short-term load forecasting of Australian National Electricity Market by an ensemble model of extreme learning machine. IET Gen Transmis Distribut 7(4):391–397
Zhong X, Enke D (2017) Forecasting daily stock market return using dimensionality reduction. Expert Syst Appl 67:126–139
Zhong X, Enke D (2019) Predicting the daily return direction of the stock market using hybrid machine learning algorithms. Financ Innov 5(1):4
Zhu QY, Qin AK, Suganthan PN, Huang GB (2005) Evolutionary extreme learning machine. Pattern Recogn 38(10):1759–1763
Acknowledgements
The authors are grateful to the editor and anonymous reviewers for their valuable suggestions which helped in improving the quality of this paper. The authors are also thankful to the Southwestern University of Finance and Economics for providing open access.
Funding
Not applicable, No funding available.
Author information
Authors and Affiliations
Contributions
SCN (first author) designed the forecasting model, analyzed and interpreted data, conducted experiments, discussed the results and wrote the article. BBM (second author) explored the research area and was a major contributor in writing the manuscript. The author(s) read and approved the final manuscript.
Corresponding author
Ethics declarations
Competing interests
The authors declare that they have no competing interests.
Additional information
Publisher’s Note
Springer Nature remains neutral with regard to jurisdictional claims in published maps and institutional affiliations.
Rights and permissions
Open Access This article is distributed under the terms of the Creative Commons Attribution 4.0 International License (http://creativecommons.org/licenses/by/4.0/), which permits unrestricted use, distribution, and reproduction in any medium, provided you give appropriate credit to the original author(s) and the source, provide a link to the Creative Commons license, and indicate if changes were made.
About this article

Cite this article
Nayak, S.C., Misra, B.B. Extreme learning with chemical reaction optimization for stock volatility prediction. Financ Innov 6, 16 (2020). https://doi.org/10.1186/s40854-020-00177-2
Received:
Accepted:
Published:
DOI: https://doi.org/10.1186/s40854-020-00177-2