- Research
- Open access
- Published:
A comparative analysis of the OECD/INFE financial knowledge assessment using the Rasch model
Empirical Research in Vocational Education and Training volume 11, Article number: 8 (2019)
Abstract
Based on Item Response Theory, and more specifically the Rasch model, the financial knowledge domain included in the OECD/INFE adult financial literacy assessment conducted in 2015 was evaluated. This was done in order to determine whether the measurement instrument, in its existing design, could be classified as an International Large-scale assessment (ILSA), suitable for within countries and for comparison across countries. The development cycle of the OECD/INFE assessment was briefly presented to portray the conditions necessary to ensure that successful measurement would lead to action. Based on the first phase of the analysis, the suitability of the data for the Rasch model was established and the applicability of the instrument to country-specific analysis was confirmed. However, the differential item function (DIF) exploration determined that the assumption that item difficulties are homogeneous across the various countries does not hold, therefore confirming the utility of this study. The results highlighted the greater risk associated with the traditional ranking of results rather than with sophisticated analyses, as traditional approaches could result in misdiagnosis of problem areas on instruments which might not be comparable across countries. Based on the results, it does not seem that the OECD/INFE adult financial knowledge assessment adhere to the requirements of being classified an ILSA.
Background
The benefits of being financially literate are extensively reported on in academic and policy circles, with areas covered over the past few years including retirement planning (Alessie et al. 2011; Lusardi and Mitchell 2007), wealth creation (Zinni 2013) and inequality (Lusardi et al. 2017). The rise in inequality in particular is highlighted by the World Economic Forum in The Global Risks Report 2017, in which it is stated that “Growing income and wealth disparity is seen by respondents as the trend most likely to determine global developments over the next 10 years” (WEF 2017). In light of the evidence provided by Lusardi et al. (2017) that inadequate financial knowledge is a key determinant of wealth inequality, every effort should be made to ensure that consumers around the world achieve the optimal level of financial knowledge as a possible mechanism to reduce inequalities.
Since 2002, progress has been made in the measurement of financial literacy across a number of countries, culminating in the 2017 review focusing specifically on the G20 countries (OECD 2017). From a policy perspective, the 2017 review of financial literacy resulted in institutions such as the OECD foregrounding financial literacy’s geo-political, cross-national as well as contextual importance within broader social concerns, such as global inequality. In 2010, the establishment of the OECD/International Network on Financial Education (OECD/INFE) was formalised (Atkinson 2011; Kempson 2009). According to the OECD (2016), concerted efforts to address the areas of financial education, financial consumer protection and, of increasing importance, financial inclusion are the three main initiatives needed to empower individuals and ensure overall stability of the world’s financial systems. Leading organisation that undertake such interventions, which in this case is the adopted OECD/INFE instruments, however, need to ensure that the initiatives are trustworthy and credible, and do not exacerbate the very local and global pressures points that they seek to address. In an effort, therefore, to measure the level of financial literacy, both the OECD and the World Bank have in recent years embarked on diverse projects to measure issues of financial literacy in a comprehensive manner. The aim of these international measurements is to assist policymakers in identifying areas in relation to important pressure points and to identify vulnerable groups that require attention and focused interventions.
If financial literacy assessment is conducted by means of a suitable internationally comparable instrument, countries are able to benchmark themselves, identify common patterns and work together to find solutions to similar problems. However, given the heterogeneity and localised, diverse contexts of the respondents both across and within countries, it is vital that both local and international measurement instruments actually measure what they profess to measure, and that the results are reliable, valid and fully comparable. These methodological criteria are normatively and ethically expected of any credible study, more especially for international large-scale assessments studies (ILSA) that are widely administered to sample respondents, across the globe and the equality-inequality continuum. As stated by Kirsch et al. (2013), ILSA studies have “expanded in scope over time in response to increasing concern about the distribution of human capital and the growing recognition that skills contribute to the prosperity of nations and to better lives for individuals in those nations”. Given the ethics, and dependence, of a variety of stakeholders on the information collected in these ILSAs, Lietz et al. (2017) suggest that these large-scale assessments should be robust and useful, of high quality, technically sound, have a comprehensive communication strategy and be useful for education policy.
The OECD/INFE has conducted two international large-scale assessments of adult financial literacy in 2011 and 2015 respectively. The third is in 2019. More specifics regarding the instrument design are discussed only briefly, in “Guiding principles for implementing an international large-scale assessment” section, in that the development of the instrument itself forms the context for the study, and not the unit of analysis. The extant assessment, however, that set out to measure financial knowledge (as a sub-component of financial literacy, see Fig. 1) and included eight determinant questions, is the focal unit of the study. Thirty countries participated in the assessment, totalling 51,650 respondents (OECD 2016). Unfortunately, not all of the data from all of the participating countries were available at the time of writing, but the analysis based on the data available from 11 of the 30 countries nevertheless, provides some seminal guiding results, which may be refined and extrapolated in future work, when the outstanding data from the remaining 19 countries are available.

The OECD/INFE adult financial literacy assessment framework. This figure illustrates the positioning of the financial knowledge domain amongst the other domains included in the OECD/INFE adult assessment
Research questions
The OECD applied the Rasch model technique to the Programme for International Student Assessment (PISA) assessment. The Rasch model makes provision for the analysis of the respondents’ responses to the set of items and compares the respondents’ abilities with the difficulty of the question bank thereby inculpating the psychometric appropriateness of the financial knowledge assessment instrument. Capitalising on this existing work, the author sets out to extend the body of knowledge on the use of the Rasch as applied to ILSA, and therefore make an applied and theoretical contribution. The article reports on the first attempt to apply the Rasch model to the OECD/INFE adult financial literacy assessment for the purposes of assessing its validity as a comparative instrument for international application. The unit of analysis is the psychometric quality and comparability across countries of the OECD/INFE financial knowledge assessment questions, as opposed to instrument design. Given the heterogeneity of the respondents and local contexts both across, and within, the participating countries, this article outlines the validation of the measurement instrument of the financial knowledge domain in the OECD/INFE adult financial literacy assessment. This article will therefore extend the literature on the evaluation of international large-scale assessments with the application of psychometric tests (namely the Rasch) as an evaluation measurement. This article is, furthermore, in contrast to the traditional league tables and average scores applicable to Classical Test Theory (CTT), which has been found to have limitations (Kunovskaya et al. 2014). Given that another wave of the assessment of financial literacy across the OECD/INFE member countries is in 2019, the results gained through this novel lens could provide some suggestions for enhancement of the international large-scale assessment instrument.
This article’s overarching aim, therefore, is an ‘assessment’ of an assessment, using the Rasch, as a novel means to assess, and the OECD/INFE financial knowledge assessment. The appropriateness of the Rasch model will be evaluated through the examination of the item fit statistics. By means of differential item functioning (DIF), further validity evidence of the comparable cross-country results is explored to determine to what extent the underlying OECD/INFE assessment framework of financial knowledge be confirmed with the limited set of seven questions. By means of IRT, and more specifically the Rasch model, the following research questions were explored:
-
A.
To what extent is there evidence of the internal validity (e.g. reliability, item fit) of the OECD/INFE adult financial knowledge assessment?
-
B.
Does the OECD/INFE adult financial knowledge assessment provide an invariant measure across adults in participating countries?
The remainder of the article is structured as follows: the first section will provide a synopsis on some guiding principles for the development of international large-scale assessments. The remaining sections will then discuss the methodology followed in preparation for the analysis of the international comparability, as is described in the analysis and results section. Lastly, a discussion of the results, and some limitations, of the study as well as recommendations for future assessments are provided.
Guiding principles for implementing an international large-scale assessment
Lietz et al. (2017) provide some insights to the key areas (or steps) that are required to be taken into account in the implementation of large-scale assessments to ensure the reliability and validity of the results obtained. Lietz et al. (2017)’s 13 key areas are in also line with the four steps as suggested by Kirsch et al. (2013) and these four steps will form the basis of the brief discussion of the development of the OECD/INFE financial literacy adult assessment in the remainder of this section.
Step 1: Policy questions
According to Kirsch et al. (2013), the first step in the development cycle of a large-scale assessment is usually motivated by policy questions to determine the objectives of the assessment: the “who” and “what” that is to be tested. Based on the generic nature of the policy objectives across the OECD/INFE member countries, a Financial Literacy Measurement Sub-group (hereafter referred to as the Measurement Sub-group) was established by the OECD/INFE tasked to develop and implement an internationally comparable survey to obtain data on financial literacy and capability (Kempson 2009).
Therefore, during the conceptualisation of the assessment, the OECD/INFE Measurement Sub-group debated on the target audience of the survey, given policy considerations. After reviewing several scenarios, the Measurement Sub-group recommended that all adults aged 18 and over, with no upper age limit should be included in the sample frame. However, as is common practice in national surveys, people living in residential institutions, such as care homes, hospitals or prisons were excluded as well as people living in extremely sparely populated areas. (Atkinson and Messy 2011; Kempson 2009; OECD 2015).
In terms of policy, terminology is always contentious. The Measurement Sub-group opted for the term financial literacy and to mean ‘a combination of awareness, knowledge, skill, attitude and behaviour necessary to make sound financial decisions and ultimately achieve individual financial wellbeing.’ (Atkinson and Messy 2012; OECD 2011, 2013, 2015).
The Measurement Sub-group thus determined ‘who’ and ‘what’ concerns for the assessment.
Step 2: Assessment frameworks and instrument design
To ensure the internationally comparability of an assessment, it is essential to have agreement on the concept to be measured. Agreement should also be achieved in the operationalisation of the concept through the development and application of a measurement instrument that provides fully cross-country comparable results (Kirsch et al. 2013; Lietz et al. 2017). Informed by the definition of financial literacy, the suggested assessment framework is illustrated in Figs. 3 and 4. This assessment framework was the result of various rounds of input from OECD/INFE members, international academics and experts from national statistical offices guided by established principles, which determined that the three overarching domains of financial knowledge, behaviour and attitudes should be the focus of the measurement instrument. In addition to the three financial literacy domains, the decision was made to include financial inclusion as well as socio-demographic information to address some broader policy objectives.
The Measurement Sub-group (OECD 2016) selected questions to operationalise the measure of ‘financial knowledge’ on their basis to assess different aspect of the basic knowledge that are widely considered to be useful to individual when making financial decisions. Some of these questions originated from the efforts of Lusardi and Mitchell (2009), Van Rooij et al. (2007, 2011). Aiming to measure financial literacy and assess its relationship with financial decision-making, Van Rooij et al. (2007) differentiated between basic financial knowledge and sophisticated financial knowledge as indicators of financial literacy. According to them, households display basic financial knowledge when they have some understanding of concepts such as interest compounding, inflation and the time value of money. In their measurement of financial literacy, sophisticated financial knowledge relates the households understanding of the difference between bonds and stocks, the relationship between bond prices and interest rates and the basics of diversification. As the measurement objective of the selected questions are to gain insights to households’ understanding of basic financial concepts, this relates to Bloom’s revised taxonomy (Krathwohl 2002) of the factual knowledge that is required from households as indicative of their acquaintance of the basic elements pertaining to financial decision-making. Although it might seem that these questions are not sufficient to measure the full financial knowledge domain, this issue will be returned to later during the assessment of the measurement instrument ability to be used as an ILSA. Suffice to state that both the questionnaire developers and the Measurement Group went to great lengths to ensure sound measurement instrument development practices were applied.
Step 3: Methodological advances
The OECD/INFE adult financial literacy assessment applied a CTT as their predominant measurement paradigm. It is imperative to ensure that the results provided are fair to participants across all countries based as evaluated by the psychometric qualities of the Rasch analysis. Based on the distribution results of the financial knowledge score obtained in the OECD/INFE assessments, the conclusion was reached that each question in the set of financial knowledge questions differentiated sufficiently between high and low achievers by a combination of easy and more difficult problems, providing a good level of discrimination (Atkinson and Messy 2011; OECD 2016). However, the authors do indicate that in the second assessment, for example, Hong Kong, Korea, the Netherlands and Norway have relatively large proportions answering all the questions correctly and suggest that more difficult questions could be considered in future to differentiate better in these countries (OECD 2016).
Step 4: Enhanced analysis and interpretation of data
The literature in assessing the measurement instruments themselves, specifically pertaining to financial literacy, is moving away from the CTT to incorporate more advanced IRT techniques, such as the Rasch model (Knoll and Houts 2012; Kunovskaya et al. 2014). Rather than limiting the assessment to the classical test theory models that focus primarily on measuring individual differences (Kirsch et al. 2013), the alternative assessment method, the Rasch method is proposed that will focus on the performance of national populations rather than individual respondents. The Rasch model is an ability measurement technique that has been widely used in education, and is recommended as one of the best approaches to performing worldwide evaluation processes (Serrão and Pinto-Ferreira 2015).
It is also important to note that the ability of the subset of questions to fully measure the ‘financial knowledge’ construct is not the purpose of the OECD/INFE assessment instrument, as ‘it should not be assumed that the seven principles covered by financial education are sufficient to equip individuals with all the knowledge that they need’ (OECD 2016). Furthermore, the purpose of this article is not to develop a new instrument but rather to assess the current instrument, thus the purpose of the discussion, was only to provide a general understanding of the questions used to assess financial knowledge for purposes of the Rasch analysis, which is the focus of this article. The point should however be emphasised, as highlighted in step 2, that the measurement instrument development process followed by the Measurement Sub-Group demonstrates that the process endeavoured to abide to best practice and drew on the best expertise around the world to provide the necessary information to address the pertaining policy objectives.
Methodology
The focus of this article is to evaluate the psychometric quality and comparability across countries of the OECD/INFE financial knowledge assessment questions as presented in Annexure B using IRT. Based on nonlinear models between the measured latent variable and the item response, IRT enables independent estimation of item and person parameters and local estimation of measurement error. These properties of IRT are also the main theoretical advantages of IRT over CTT. Compared with classical test theory, a Rasch model (and other IRT models) provides the distinct benefit of a Wright map (also referred to as a person-item map. The visual appeal of this map enriches understanding and interpretation in suggesting to what extent the items cover the targeted range of the underlying scale and whether the items align with the target population (Progar and Sočan 2008; Cappelleri et al. 2014).
Sample and procedure utilised for the ILSA-and subsequent secondary analysis
The secondary data utilised for the evaluation of the applicability of OECD/INFE measurement to be classified as a successful ILSA were collected by participating countries in 2015 by means of personal in-home surveys. Respondents had to be 18 years of age or older, but not older than 79 years of age. The characteristics of 15,936 respondents across 11 (out of 30) countries are provided in Table 1. Data from Austria, Brazil, Canada, Croatia, Finland, Hungary, Hong Kong, Jordan, Russia, South Africa and the United Kingdom were used in this article. These countries provide quite a diverse distribution across various classifications, for example: (i) development phase as reflected by the Global Competitive Index (GCI), the Human Development Index (HDI), the United Nations World Economic Situation and Prospects (WESP) classification and the International Monetary Fund’s World Economic Outlook (WEO) Groups; (ii) global membership (OECD country and G20 membership); and (iii) income groups as categorised by the World Bank. Countries included in this study did not constitute a homogeneous group but instead represented a range, as countries with a high level of development such as Austria, Canada, Finland, Hong Kong and the United Kingdom as well as transitional countries such as Brazil, Croatia, Hungary, Jordan, the Russian Federation and South Africa participated. These interviews generated datasets for 11 countries.
Using the datasets of the 11 countries, therefore, provided the opportunity for the author of this article to use secondary data analysis to determine the psychometric qualities of the measurement instrument based on the 7 financial knowledge questions. This enabled the authors to assess whether the datasets were indeed internationally comparable and applicable, as is currently indicated in the traditional league tables based on average scores.
The mean age distribution was relatively equal, ranging from 41 to 48 years. Except for the respondents from Jordan, approximately 20% of the respondents were between 18 and 29 years of age; however, almost 50% of the respondents from Jordan were in the 18 to 29 years of age category. Regarding the top end of the age categories Jordan was once again the exception, with very few respondents above the age of 60 (only about 5%, compared with 20% to 30% in the other countries). Jordan was also the exception when it came to gender distribution, being the only country for which there were more males than females in the realised sample. The highest education attainment of the majority of respondents in Brazil, Croatia, Hungary and South Africa was secondary or less, whereas almost 50% of the respondents from Canada had a post-school qualification.
Statistical analyses
To analyse the data based on the Rasch model, the WINSTEPS® measurement computer program (Linacre 2017a) version 4..0 was utilised. The evaluation of the quality of the OECD/INFE financial knowledge assessment was done in three phases:
-
i.
Assessment of whether the fundamental assumption of unidimensionality of the set of financial knowledge questions holds true: The assumptions and adequacy of the Rasch model for responses to the financial knowledge questions in the OECD/INFE measurement was tested. In Fig. 2, the structure of the unidimensional model is displayed, consisting of the expected number of items that should load to the composite factor of financial knowledge.
For the purposes of the Rasch model, the seven questions were recoded to reflect a dichotomous nature, as indicated in “Appendix A”. One of the fundamental assumptions of the Rasch model is that the response probability of each respondent (or person) to each question (or item) is a function of the ratio of a person’s ability to the item difficulty (Kunovskaya et al. 2014). The probability of the correct response of a person j to an item i is given by
$$P_{ij } \left( {x_{ij} = 1} \right) = \frac{{exp(\theta_{j - } \beta_{i} )}}{{1 + exp(\theta_{j - } \beta_{i} )}}$$(1)where xij is the response of person j to item i, θj is the latent ability of person j, and βi is the difficulty of item i.
Fig. 2 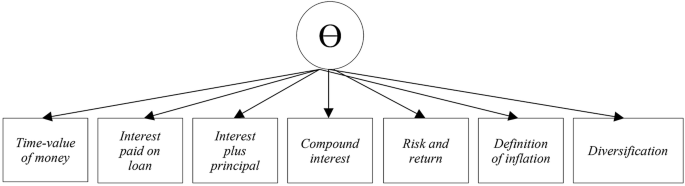
Unidimensional Rasch model: financial knowledge measurement instrument. The structure of the unidimensional model is displayed, consisting of the expected seven items that should load to the composite factor of financial knowledge
-
ii.
Indices of the fit of the data to the model: Through the application of the Rasch model, item fit and difficulty estimates for each country, including person- and item reliability and separation indices were calculated to evaluate the set of individual items. The four indices measure, respectively, the replicability of person ordering we could expect if this sample of persons were given another parallel set of items measuring the same construct, the replicability of item placement along the pathway if these same items were given to another sample of the same size that behaved in the same way, the spread of ability across the sample so that the measures demonstrate a hierarchy of ability/development and lastly the number of standard errors of spread among the items(the spread or separation of items on the measured variable).
-
iii.
Psychometric appropriateness of the measurement instrument: Over and above the data fit indices, the psychometric appropriateness of the instrument to distinguish between the person ability and item difficulty were also provided. In addition to the identification of the specific item that was the most difficult for all the samples across all the countries, different item difficulty hierarchies were also identified across the countries based on the item fit orders. The results of the cross-national comparison were further enhanced through the review of the Wright maps of each country: these provided a combined view of item difficulty and person ability. The results of the Wright maps clearly indicate different person ability patterns in relation to the items.
-
iv.
Exploration of evidence of differential item functioning (DIF) between the countries: In order to determine whether the measurement items were biased as a function of a specific attribute, a DIF analysis was conducted. Measurement bias among various attributes can be evaluated in a DIF analysis, for example gender, racial or language (Boone et al. 2014, p. 274). However, given the aim of the OECD/INFE assessment being comparability across countries, the DIF was limited to determine whether the financial knowledge measurement items behave differently across a heterogeneous group of countries. This additional exploration is necessary to determine whether the assumption that item difficulties are homogeneous across the different countries is in fact true.

Results of the Rasch model
Unidimensionality
Starting with phase one, the following section will first determine whether the data satisfied the fundamental assumption of the Rasch model of unidimensionality. Wright’s Unidimensionality Index, based on the ratio of the real (misfit inflated) standard errors divided by the model standard errors, was used (Wright 1994). Unidimensionality can be assumed if the value is above .9, while values of .5 and below indicates multidimensionality. The index values are reflected in Table 2. The results indicate an index value above .9 for all countries, signalling unidimensionality.
A Rasch residual-based principal component analysis (PCA) was also conducted to confirm unidimensionality. The results from this type of PCA are more indicative than definitive indicators (Linacre 2017b). Secondary dimensions are identified in the data by breaking down the observed residuals. The analysis identifies any common variance among those aspects of the data that remained unexplained or unmodeled by the primary Rasch measure. Eigenvalues above 2 for the first contrast typically indicate the presence of multiple dimensions and associations between data (Linacre 2017b). A PCA performed on the residuals demonstrated first contrast eigenvalues smaller than 2, ranging from 1.56 (Jordan) to 1.99 (Croatia). It was thus confirmed that the unidimensionality assumption for the Rasch model held for all 11 countries.
Model fit assessment
Boone et al. (2014) and Linacre (2017b) provide guidance regarding the adequacy assessment process, starting with an evaluation of how well the data conform to the Rasch model, in other words, the model fit assessment. To determine the model fit, Linacre (2017b) suggests that the mean square fit statistic (infit) has an expectation of 1 and the standarised fit statistic should approximate a theoretical mean of 0. If we apply these guidelines, the results in Table 3 suggest that the data do fit the model reasonably well, as the mean square was 1.0 or close to 1 (.98 or .99) in each country (column 3) and the standardised statistic (column 4) was 0 for all countries except Hungary, for which it was nevertheless close to 0 (− .1).
In Rasch terms, Winstep provides several key reliability indices, as indicated in Table 4. It is important to note that for the purposes of the reliability evaluation, the author agrees with Boone et al. (2014) regarding the standard procedures regarding the exclusion of extreme persons or outliers (i.e. those respondents who had either nothing correct, or everything correct). In the case of a person having everything correct, it is not possible to gauge from the assessment how much more knowledgeable the person really is—was the assessment the plateau of their knowledge, or do they actually know a lot more about the topic?—resulting in an infinite error estimation. This infinite error size does not assist in the assessment of the differentiating ability of the instrument, and therefore the 48 extreme people (South Africa—33; Croatia—1; Russia—8; Austria—6), are excluded in the reliability assessment.
According to Linacre (2017b), the reliability index can be interpreted in a way similar to the more well-known Cronbach Alpha indicator and is not indicative of the quality of the data, but rather of the reproducibility of the instrument. As these values are influenced by large sample sizes, and all the samples comprised 1000 respondents or more, it is necessary to consider the separation index which indicates the number of standard errors of spread among the persons (or items).
The estimated person reliability (Table 4) in all 11 countries was very low, at between 0 and .36 which are below 2. Low values of person reliability might indicate a narrow persons’ ability range, or may be related to the small number of items on the test. The person separation estimates are indicative of the sensitivity of the test instrument for distinguishing between high and low performers (Linacre 2017b). Separation estimates can range from 0 to infinity, with a higher value being preferred (Boone et al. 2014). Person separation estimates for the test in each country (Table 5) were less than 2 for all countries, meaning that the test instrument was not sensitive enough to distinguish between high and low performers. The results could have been influenced by the exclusion of the outliers. The measure of the effect of this exclusion is however beyond the scope of this article.
The item reliability indices were good with all values above .9. On the other hand, item separation estimates are used to verify the item hierarchy, with low estimates signalling that the sample was not big enough to precisely locate the items on the latent variable (Linacre 2017b). The separation values of the items were however, high, ranging much higher than the threshold value of 3, between 12.38 and 30.93, and indicated a large spread of the items along the item difficulty hierarchy.
The item reliability index and the item separation index values for all countries thus indicated replicability and a spread of items across the item hierarchy as the item reliability indices are above .9 and the item separation indices are above 3. However, the person reliabilities (less than .8 and the separation indices (below 2) highlight that that the test were not sensitive enough to distinguish between high and low performers across all countries.
The root mean square error, RMSE, is a further measure of a lower limit to the reliability of measures based on this set of items for this sample. A value close to 0 indicates a good fit. Low RMSE values for items were observed for all the countries, thereby indicating reliability of item estimates. The RMSE values for persons were very high (between 1.08 and 1.33) (Table 5) and signalled that the data were not an adequate fit. The RMSE results are thus in alignment with the results of the person and item reliability and separation indices.
Psychometric appropriateness of the measurement instrument
Item fit and difficulty estimates
Following the model fit assessment, the next step in the adequacy assessment entailed evaluation of the item fit and difficulty estimates to identify unexpected patterns. The item fit statistics and the measure order, an estimate of item difficulty, of items on the test are summarised in Table 5,Footnote 1 where the items are arranged from the most (largest positive logit value) to the least difficult (largest negative logit value). According to Linacre (2017b), the difficulty of an item is defined as “the point on the latent variable (unidimensional continuum) at which its high and low categories have equal probability of being observed.” The reported logit values for the difficulty of items are arranged in Table 61 from the most to the least difficult items.
The difficulty spread of the items as per Table 5 was between 3.67 (highest difficulty measure (Hungary)) and − 3.21 (lowest difficulty measure (Finland)). Both of these values are above the − 3 to + 3 logit range, indicating behaviour outside the range that indicates a “balanced” test. An item difficulty measure above 3 for question 6 was recorded for Jordan, Hong Kong and Brazil, indicating behaviour that deviated more than expected. Furthermore, it is clear from the analysis in Table 6 that no two countries had a similar item difficulty pattern. The only common feature was that the composite question 6 was the most difficult item across all countries, and question 4 was the easiest across 7 of the 11 countries.
In terms of the outfit MNSQ for all items reported, items outside the acceptable range (< .75 or > 1.3) (Bond and Fox 2014) were observed for each country. Table 6 shows items that overfit (which indicate too little variation and a too determined response pattern) as well as items that underfit (too much variation and a too haphazard response pattern). It is important to note that both question 5 (8 out of the 11 countries) and question 6 (5 out of the 11 countries) were indicated as items that overfit, while item questions 7a (5 out of the 11 countries) and question 3 (time value of money) (4 of the 11 countries) were indicated as items that underfit.
Wright maps (also referred to as person–item maps) provide critical insights into person’s achievement and item difficulty graphically demonstrated on one logit scale. Person fit statistics, provided in Table 4, also require further investigation of the person ability distributions for each country. In Figs. 3 and 4, the person ability distribution is indicated by the # in the section above the line and the item numbers (QK3 to QK7c) below the line shows the distribution of the set of questions. Lower person measures and lower item difficulties are presented on the left-hand side of the Wright map. Higher knowledgeable respondents and items that are more difficult are presented on the right-hand side of the Wright map. The letter ‘M’ is indicative of the mean difficulty score (the top one indicating the mean score for the group of respondents for the specific country) and the bottom one indicating the mean logit for the seven items. The letters ‘S’ and ‘T’ respectively indicate one and two standard deviations from the mean. Finally, ‘0’ indicated that participants with an average ability compared with the rest of the respondents had a 50% probability of answering an item of average difficulty correctly. Figures 3 and 4 presents the Wright maps with all items and respondents for the 11 countries under review.

Wright maps: financial knowledge assessment. Wright maps portray the two dimensions of (i) ability of the respondents and (ii) difficulty of the questions on one illustration. The placement of the respondents ability compared to the difficulty of the questions give an indication of how closely (or not) the participants abilities are compared to the difficulty of the measurement instrument

Wright maps: financial knowledge assessment. Wright maps portray the two dimensions of (i) ability of the respondents and (ii) difficulty of the questions on one illustration. The placement of the respondents ability compared to the difficulty of the questions give an indication of how closely (or not) the participants abilities are compared to the difficulty of the measurement instrument
The Wright map (Figs. 3 and 4) shows some misalignment of persons and items for the majority of the countries where the average person position was at a higher point on the logit scale than the average item position. For countries such as Austria, Finland, Hong Kong, Hungary, Russia and the United Kingdom there seems to be mistargeting between the distribution of persons and items on the maps, demonstrated by the high number of persons whose positions were above where the financial knowledge items were measuring. The misalignment was the greatest for Hong Kong, indicating that the questions might be too easy for respondents from there. The Wright map shows that for Brazil, Croatia and South Africa the test matched well with the abilities of the samples. For Hong Kong, Austria, Russia and Finland, the test is also potentially too easy. For the rest of the countries, namely Canada, Hungary, Jordan and The United Kingdom the map also shows that the test was relatively easy, but to a lesser extent.
The results up to now indicated that although the data for each country fitted the Rasch model, large differences were observed in terms of both the item difficulty order and misalignment of persons and items on the Wright maps (Figs. 3 and 4) across countries. This indicated the need for further exploration of the differences across countries. DIF was subsequently used to determine whether the assumption that item difficulty was homogeneous across the countries under review could be deduced.
Results of the assessment of the homogeneity of item difficulty across countries
Test item bias or DIF determine whether an item measures equally for different subgroups. A biased or DIF item is one for which the probability of success is not the same for equally able test takers from different subgroups. Ertuby and Russel (1996), as quoted by De Beer (2004), suggest that because of their greater sophistication, IRT procedures provide the best results for detecting cultural differences on particular items. The null hypothesis that differences are due to chance alone was tested, and the results shown in Table 7. The null hypothesis is rejected for each item, indicating that the observed DIF was not due to chance alone for all 7 items.
Statistical significance tests such as DIF tests are, however, always of doubtful value in a Rasch context because differences can be statistically significant, but far too small to have any impact on the meaning, or practical use, of the measures. Both statistical significance and substantive differences are needed before action should be considered. In order to determine substantive differences (> .5), Figs. 3 and 4 shows the DIF SIZE, which is the difference between the DIF MEASURE for a country and the AVERAGE DIFFICULTY (MEASURE) for each item across all the countries. The DIF measure is the item difficulty for each country and the average difficulty is the overall difficulty of an item for all countries combined.
It is clear from Table 8 that there are substantive differences across all the questions, especially regarding question 7b (the definition of inflation) which reported difference across 7 of the 11 countries. In contrast, question 7a (risk and return) had the least substantive difference with only two countries, Croatia and Hong Kong reporting significant differences. Through more detailed analysis of the DIF size for each question (see Figs. 5, 6, 7, 8, 9, 10, 11), the differences across countries become more evident. A straight line presents the baseline difficulty, and the DIF size is plotted for each country. An absolute value of above .5 indicates a substantive difference.

DIF size: question 3—time value of money

DIF size: question 4—interest paid on loan

DIF size: question 5—interest plus capital

DIF size: question 6—compound interest

DIF size: question 7a—risk and return

DIF size: question 7b—inflation

DIF size: question 7c—diversification
Figure 5 indicates that for QK3, the ‘time value of money’ question, the average difficulty measure indicated a value of .5. The DIF size for Jordan, Canada, the United Kingdom and South Africa were positive, indicating that respondents found the question more difficult than the average difficulty for all countries combined, with South Africa and the United Kingdom experiencing the question as the most difficult. Croatia experienced the question as being at exactly the same difficulty level as the average difficulty of all countries combined. The countries that experienced the question as less than the average difficulty are Finland, Brazil, Russia, Hungary, Hong Kong, Canada and Austria, with Finland experiencing the question as least difficult.
Regarding QK4 (Fig. 6), relating to the ‘interest paid on loan’ question, the average difficulty measure indicated a value of − 1.5, suggesting that the question was much easier than QK3. Similar to QK3, the DIF size for Jordan and South Africa were positive, indicating that they experienced this question as being more difficult than the average difficulty for all countries combined. Whereas Brazil experienced QK3 as less difficult, the same is not true in the case of QK4. On the other side of the scale, of all the countries, Finland experienced the question as the least difficult. Hong Kong and Austria, with similar results, were almost on par with the average difficulty across all countries.
The difficulty across all countries regarding the concept of compound interest (QK6—Fig. 8) is evident, with the average difficulty measure being at 2.5—up from .4 with reference to the concept of simple interest alone (QK5—Fig. 7). As the result of QK6 was calculated based on the respondent having both QK5 and QK6 correct, the mistargeting regarding compound interest is worrisome.
However, in contrast to the previous question, the spread of the difficulty measurement across all countries is fairly limited for QK6, and so compound interest seems to be problematic across all countries which support the results of Table 7 and Fig. 8.
The average difficulty measure for both QK7a (Risk and return—Fig. 9) and QK7b (Inflation—Fig. 10) was just below − 1.5, thus indicating that these two questions were relatively easy compared with QK6 (Fig. 8).
QK7c (Diversification—Fig. 11) was the only question for which the average difficulty measure across all countries was 0, indicating that this question was on par.
Based on the examination of the DIF size per question, substantive differences are evident across all the questions. Based on the DIF size of 2.6, QK6 was by far the most difficult questions for respondents across all the countries. In contrast, QK 4 was much easier with a DIF size of − 1.44. The number of countries reporting substantive differences also differed per question, ranging from 2 countries (QK7a and QK7b) to 6 countries (QK7b).
Although the data conformed to the unidimensionality test for purposes of the Rasch model, the preceding DIF results being indicative of substantive differences among the responses to the question prompted the question of construct validity. It was therefore decided to revert to CTT, namely optimal scaling to reassess the dimensionality of the seven questions for each country due to the binary nature of the data as the data was recoded for purposes of the Rasch analysis. In optimal scaling numerical quantifications are assigned to the categories of each variable, thus allowing standard procedures to be used to obtain a solution on the quantified variables.
The optimal scale values are assigned to categories of each variable based on the optimizing criterion of the procedure in use. Unlike the original labels of the nominal or ordinal variables in the analysis, these scale values have metric properties. The optimal quantification for each scaled variable is obtained through an iterative method called alternating least squares in which, after the current quantifications are used to find a solution, the quantifications are updated using that solution. The updated quantifications are then used to find a new solution, which is used to update the quantifications, and so on, until the criterion is reached that signals the process to stop. As the aim of the analysis was data reduction and the optimal scaling level was multiple nominal, multiple correspondence analysis were conducted to determine the dimensionality.
Multiple correspondence analysis quantifies nominal (categorical) data by assigning numerical values to the cases (objects) and categories so that objects within the same category are close together and objects in different categories are far apart. Each object is as close as possible to the category points of categories that apply to the object. In this way, the categories divide the objects into homogeneous subgroups. Variables are considered homogeneous when they classify objects in the same categories into the same subgroups. As all the variables have multiple nominal scaling levels, multiple correspondence analysis is identical to categorical principal components analysis. The results are shown in Table 9.
The results in Table 9 indicates that a two dimensional structure was observed for all countries, except for SA and the UK where a three dimensional structure was observed. The numbers 1, 2 and 3 in Table 9 indicate the factor on which a specific item load. Brazil and Hong Kong displayed a factor structure where the same items load onto the two respective dimensions. Canada and Croatia also had a similar two-dimension factor structure but not the same structure as that of Brazil and Hong Kong. Thus, although the results indicated two dimensions, the questions determining the two dimensions were not consistent across the countries.
Discussion of results
The importance and value of ILSAs has been well documented, but the importance of ensuring that the interpretation of the outcomes is both absolutely and comparatively correct led to the assessment of the OECD/INFE financial literacy measurement instrument, but more specifically the financial knowledge domain, reported on in this article. It is evident from the discussion on the development of the assessment framework and the operationalisation exercise conducted by the OECD/INFE Measure Subgroup that a lot of effort was taken in the design and development of the comprehensive measurement instrument to ensure valid and reliable results. Based on the salient features of test development in large-scale assessments, the instrument developers aspired to construct validity to measure basic financial knowledge but was challenged with limiting the length of the overall assessment. Brevity, respondent fatigue on the one hand had to be balanced with construct validity and policy objectives on the other hand. Given that one of the aims of the OED/INFE ILSA was to provide benchmarks against countries can compare themselves, questions were selected to be indicative but not confirmatory of full coverage of the various topic domains. This also holds true for the financial knowledge assessment which is the focus of this article.
Braun (2013) reflects that countries involved in ILSAs should reflect upon and review the implications for their own jurisdiction, and the results of the Rasch model clearly support this notion. Based on the Rasch model applied in this article, it was evident that the datasets utilised in the assessment of the OECD/INFE of adult financial knowledge assessment do adhere to the foundational assumption of unidimensionality, thereby paving the way for the comprehensive review of the quality of the measurement instrument focused on the limited questions measuring financial knowledge.
However, in terms of the model fit assessment, the data do fit the Rasch model reasonable well, but the reliability indices employed do indicate a mismatch between the respondents to the assessment and the item difficulty across the various questions. Based on the item difficulty evaluation in conjunction with the person and item distribution from a narrow to a broad band based on the Wright maps across the logit scale, the measurement instrument was shown to be not necessarily as discriminating as one would expect. Evaluation of the results for each country provides confirmation that for certain countries the survey instrument might be on par, but for a country such as Hong Kong, the items appeared to be too easy to really distinguish between higher and lower achievers—the majority of the respondents found the questions very easy. The measurement of the effect of the exclusion of the outliers (those who achieved 0 and 7), especially in the case of Hong Kong, was not determined in this article but could have an impact on the reported results and should be considered in future analysis of the utilisation of this assessment instrument.
Given the exclusion of the outliers, the instrument does not necessarily assist the Hong Kong government in identifying problematic areas that would require additional financial knowledge in the Hong Kong context. Compared with other countries (similar to the traditional ranking exercise), there is clearly a mistargeting between the difficulty of the questions and the ability of the respondents. The opposite is possibly true for the South African respondents, with the majority of the respondents experiencing the questions as too difficult in relation to their ability. The reasons for the discrepancy in the financial knowledge results (person ability versus item difficulty) might be attributed more to a lack of the underlying required competencies such as numeracy rather than to the lack of financial knowledge per se. Thus, although it seems that there is evidence of internal validity of the OECD/INFE adult financial knowledge assessment in terms of the reliability and item fit assessment, the results are not as convincing as one would have expected.
By means of the evaluation of the psychometric appropriateness of the measure instrument, further problems regarding the comparability of the results were identified. In terms of the item fit and difficulty estimates, compound interest (QK6) was the most difficult question across all countries but are respondents more informed regarding nominal interest. Given the importance of compound interest for both debt and savings, this important issue should be taken into consideration across measurement as well as financial education initiatives. Households with high-debt levels might not understand the implications of compound debt on their long-term repayments. By understanding the benefits of compound interest over time, household could achieve much higher levels of financial security, should they start saving early enough.
However, focusing on the quality of the individual questions to provide reliable and valid results required for a cross-country assessment, the DIF results do not support the cross-country assessment. High levels of variance across the financial knowledge assessment questions among the participants in the different countries were experienced. The average difficulty of the individual questions differed from − 1.44 to 2.6, but as illustrated in Figs. 5, 6, 7, 8, 9, 10, 11, no consistent pattern regarding the distribution amongst the various countries could be identified. This result was pre-empted by the inconsistent patterns reported in over- and underfit assessments as well.
Faced with the high level of invariance, the decision was made to reassess the dimensionality of the seven questions. Through the application of multiple correspondence analysis is was determined that more than two, and even three dimensions for South Africa and the United Kingdom, were detected across the various countries. None of the countries reflected a single dimension. This result could be influenced by the nature of the underlying questions as the first four questions were multiple choice compared to the true/false options of the last three questions. The two dimensions (as per Table 9) for Brazil, Canada, Croatia and Hong Kong strongly reflects that nature of the question scales (i.e. first four versus the last three) and thus might be influenced by the framing of the question and not necessarily by the content assessment.
The overall assessment, informed by the psychometric evaluation, emphasises that the current set of financial knowledge questions should be reconsidered and possible be adapted for purposes of an international large-scale assessment.
Notes
More comprehensive information is available from the author on request.
Abbreviations
- CTT:
-
Classical Test Theory
- DIF:
-
differential item functioning
- EGRA:
-
Early Grade Reading Assessment
- G20:
-
group of twenty
- GFLEC:
-
Global Financial Literacy Excellence Center
- HDI:
-
Human Development Index
- ILSA:
-
international large-scale assessments
- IRT:
-
Item Response Theory
- OECD:
-
Organisation for Economic Co-operation and Development
- OECD/INFE:
-
Economic Co-operation and Development/International Network for Financial Education
- PASEC:
-
Programme for the Analysis of Education Systems
- PCA:
-
principal component analysis
- PIRLS:
-
Progress in International Reading Literacy Study
- PISA:
-
Programme for International Student Assessment
- RMSE:
-
root mean square error
- TIAA:
-
Institute Teachers Insurance and Annuity Association of America Institute
- TIMMS:
-
Trends in International Mathematics and Science Study
- WEF:
-
World Economic Forum
- WEO:
-
International Monetary Fund’s World Economic Outlook
- WESP:
-
United Nations World Economic Situation and Prospects
References
Alessie RJM, Van Rooij MCJ, Lusardi A (2011) Financial literacy and retirement planning in the Netherlands. J Pension Econ Finance 10(4):527–545. https://doi.org/10.1016/j.joep.2011.02.004
Atkinson A (2011) Measuring financial capability using a short survey instrument: Instruction manual. University of Bristol, Bristol
Atkinson A, Messy F (2011) Assessing financial literacy in 12 countries: an OECD/INFE international pilot exercise. J Pension Econ Finance 10(4):657–665. https://doi.org/10.1017/S1474747211000539
Atkinson A, Messy F (2012) Measuring financial literacy: results of the OECD/International Network on Financial Education (INFE) pilot study. 15. https://doi.org/10.1787/5k9csfs90fr4-en
Bond T, Fox CM (2014) Applying the Rasch model: fundamental measurement in the human sciences, 3rd edn. Routledge, New York
Boone WJ, Staver JR, Yale MS (2014) Rasch analysis in the human sciences. Springer, Berlin
Braun H (2013) Chapter 8: prospects for the future: a framework and discussion of directions for the next generation of international large-scale assessments. In: Von Davier M et al (eds) The role of international large-scale assessments: perspectives from technology, economy, and educational research. Springer, London, pp 149–160
Cappelleri JC, Lundy JJ, Hays RD (2014) Overview of classical test theory and item response theory for quantitative assessment of items in developing patient- reported outcome measures. Clin Ther 36(5):648–662. https://doi.org/10.1016/j.clinthera.2014.04.006.Overview
De Beer M (2004) Use of differential item functioning (DIF) analysis for bias analysis in test construction. SA J Ind Psychol 30(4):52–58
Ertuby C, Russel RJH (1996) Dealing with comparability problem of cross-cultural data. In: Paper presented at the 26th international congress of psychology, Montreal, 16–21 August 1996
Kempson E (2009) Framework for the development of financial literacy baseline surveys: a first international comparative analysis. 1. http://dx.doi.org/10.1787/5kmddpz7m9zq-en
Kirsch I, Lennon M, Von Davier M, Gonzalez E, Yamamoto K (2013) Chapter 1: On the growing importance of international large-scale assessments. In: Von Davier M et al (eds) The role of international large-scale assessments: perspectives from technology, economy, and educational research. Springer, London, pp 1–11
Knoll MAZ, Houts CR (2012) The financial knowledge scale: an application of item response theory to the assessment of financial literacy. J Consum Aff 46(3):381–410. https://doi.org/10.1111/j.1745-6606.2012.01241.x
Krathwohl DR (2002) A revision of bloom’s taxonomy: an overview. Theory into practice. 41(4). https://pdfs.semanticscholar.org/b479/833ef239f84f904085089b8a434c6346cd48.pdf. Accessed 11 May 2018
Kunovskaya IA, Cude BJ, Alexeev N (2014) Evaluation of a financial literacy test using classical test theory and item response theory. J Fam Econ Issues 35(4):516–531. https://doi.org/10.1007/s10834-013-9386-8
Lietz P, Cresswell JC, Rust KF, Adams RJ (2017) Implementation of large-scale education asessments. In: Lietz P, Cresswell JC, Rust KF, Adams RJ (eds) Implementation of large-scale education assessments. Wiley, Hoboken, pp 1–25
Linacre JM (2017a) Winsteps® Rasch measurement computer program. Winsteps.com, Beaverton
Linacre JM (2017b) Winsteps® Rasch measurement computer program User’s Guide. Winsteps.com, Beaverton
Lusardi A, Mitchell OS (2007) Baby Boomer retirement security: the roles of planning, financial literacy, and housing wealth. J Monetary Econ 54(1):205–224. https://doi.org/10.1016/j.jmoneco.2006.12.001
Lusardi A, Mitchell OS (2009) How ordinary consumers make complex economic decisions: financial literacy and retirement readiness, NBER Working Paper Series. 15350. https://doi.org/10.1142/s2010139217500082
Lusardi A, Michaud P, Mitchell OS (2017) Optimal financial knowledge and wealth inequality. J Political Econ 125(2):431–477
OECD (2011) Measuring financial literacy: questionnaire and guidance notes for conducting an internationally comparable survey of financial literacy. http://www.oecd.org/daf/fin/financial-education/49319977.pdf. Accessed 10 Jan 2018
OECD (2013) OECD/INFE toolkit to measure financial literacy and inclusion GuIDaNCE, COrE quEstIONNaIrE aND supplEmENtary quEstIONs. Available at: http://www.oecd.org/daf/fin/financial-education/TrustFund2013_OECD_INFE_toolkit_to_measure_fin_lit_and_fin_incl.pdf. Accessed 20 Jan 2018
OECD (2015) 2015 OECD/INFE toolkit for measuring financial literacy and financial inclusion. http://www.oecd.org/daf/fin/financial-education/2015_OECD_INFE_Toolkit_Measuring_Financial_Literacy.pdf. Accessed 10 Jan 2018
OECD (2016) OECD/INFE international survey of adult financial literacy competencies. Paris, Paris
OECD (2017) measuring financial literacy—OECD. http://www.oecd.org/finance/financial-education/measuringfinancialliteracy.htm. Accessed 25 Jan 2018
Progar Š, Sočan G (2008) An empirical comparison of item response theory and classical test theory. Horizons Psychol 17(3):5–24
Serrão A, Pinto-Ferreira C (2015) PISA—models and the reality. In: Pixel (ed.) The future of education international conference—5th edition. Florence
Van Rooij M, Lusardi A, Alessie R (2007) Financial literacy and stock market participation. 13565. http://www.nber.org/papers/w13565. Accessed 20 Aug 2018
Van Rooij M, Lusardi A, Alessie R (2011) Financial literacy and stock market participation. J Fin Econ 101(2):449–472
World Economic Forum (WEF) (2017) The global risks report 2017. 12th Edition. Geneva, Switzerland. http://www3.weforum.org/docs/GRR17_Report_web.pdf. Accessed 23 Jan 2018
Wright BJ (1994) Rasch factor analysis. In: Conference proceeding at the annual meeting of the Midwestern Educational Research Assocation. https://files.eric.ed.gov/fulltext/ED380476.pdf. Accessed 25 Jan 2018
Zinni MB (2013) Identifying drivers for the accumulation of household financial wealth. 264. http://papers.ssrn.com/paper.taf?abstract_id=2214962. Accessed 20 Aug 2018
Authors’ contributions
Sole author, assisted by in-house statistician. The author read and approved the final manuscript.
Competing interests
The author declares no competing interests.
Availability of data and materials
As a member of the OECD/INFE research group I have access to the data used in the analysis. Should other parties wish to use the data, permission should be obtained from the OECD/INFE.
Consent for publication
I am the only author to the paper and therefore approve the manuscript for submission. This manuscript has not been published or submitted for publication elsewhere.
Ethical approval and consent to participate
Given the secondary nature of the data, no direct contact with the original participants was made. However, ethical approval for the project was obtained from the Ethical Committee of the College of Accounting Sciences, Unisa before embarking on the study. Approval was also obtained from the OECD/INFE for usage of the secondary data.
Funding
No external funding was obtained for the project. Internal support from the University of South Africa was utilised, such as the services of a statistician.
Publisher’s Note
Springer Nature remains neutral with regard to jurisdictional claims in published maps and institutional affiliations.
Author information
Authors and Affiliations
Corresponding author
Appendix A
Appendix A
The financial knowledge test.
See Table 10.
Rights and permissions
Open Access This article is distributed under the terms of the Creative Commons Attribution 4.0 International License (http://creativecommons.org/licenses/by/4.0/), which permits unrestricted use, distribution, and reproduction in any medium, provided you give appropriate credit to the original author(s) and the source, provide a link to the Creative Commons license, and indicate if changes were made.
About this article

Cite this article
de Clercq, B. A comparative analysis of the OECD/INFE financial knowledge assessment using the Rasch model. Empirical Res Voc Ed Train 11, 8 (2019). https://doi.org/10.1186/s40461-019-0083-1
Received:
Accepted:
Published:
DOI: https://doi.org/10.1186/s40461-019-0083-1