The Two-Minute Walk Test in Persons with Multiple Sclerosis: Correlations of Cadence with Free-Living Walking Do Not Support Ecological Validity


 ,
,
Abstract
:1. Introduction
2. Materials and Methods
2.1. Inclusion and Exclusion Criteria
2.2. Two-Minute Walk Test
2.3. Free-Living PA
2.4. ActiGraph wGT3X-BT and Data Processing
2.5. Ethical Approval and Written Consent
3. Results
4. Discussion
4.1. Limitations
4.2. Implications for Future Research
5. Conclusions
Author Contributions
Funding
Conflicts of Interest
References
- World Health Organization. Atlas: Multiple Sclerosis Resources in the World 2008; World Health Organization: Geneva, Switzerland, 2008. [Google Scholar]
- Heesen, C.; Böhm, J.; Reich, C.; Kasper, J.; Goebel, M.; Gold, S. Patient perception of bodily functions in multiple sclerosis: Gait and visual function are the most valuable. Mult. Scler. J. 2008, 14, 988–991. [Google Scholar] [CrossRef] [PubMed]
- Goldman, M.D.; Marrie, R.A.; Cohen, J.A. Evaluation of the six-minute walk in multiple sclerosis subjects and healthy controls. Mult. Scler. J. 2008, 14, 383–390. [Google Scholar] [CrossRef] [PubMed]
- Motl, R.W.; Suh, Y.; Balantrapu, S.; Sandroff, B.M.; Sosnoff, J.J.; Pula, J.; Goldman, M.D.; Fernhall, B. Evidence for the different physiological significance of the 6-and 2-minute walk tests in multiple sclerosis. Bmc Neurol. 2012, 12, 6. [Google Scholar] [CrossRef] [Green Version]
- Scalzitti, D.A.; Harwood, K.J.; Maring, J.R.; Leach, S.J.; Ruckert, E.A.; Costello, E. Validation of the 2-minute walk test with the 6-minute walk test and other functional measures in persons with multiple sclerosis. Int. J. MS Care 2018, 20, 158–163. [Google Scholar] [CrossRef] [Green Version]
- Gijbels, D.; Eijnde, B.; Feys, P. Comparison of the 2-and 6-minute walk test in multiple sclerosis. Mult. Scler. J. 2011, 17, 1269–1272. [Google Scholar] [CrossRef]
- Streber, R.; Peters, S.; Pfeifer, K. Systematic review of correlates and determinants of physical activity in persons with multiple sclerosis. Arch. Phys. Med. Rehabil. 2016, 97, 633–645.e629. [Google Scholar] [CrossRef]
- Andrade, C. Internal, External, and Ecological Validity in Research Design, Conduct, and Evaluation. Indian J. Psychol. Med. 2018, 40, 498–499. [Google Scholar] [CrossRef]
- Gijbels, D.; Alders, G.; Van Hoof, E.; Charlier, C.; Roelants, M.; Broekmans, T.; Op’t Eijnde, B.; Feys, P. Predicting habitual walking performance in multiple sclerosis: Relevance of capacity and self-report measures. Mult. Scler. J. 2010, 16, 618–626. [Google Scholar] [CrossRef]
- Stellmann, J.; Neuhaus, A.; Götze, N.; Briken, S.; Lederer, C.; Schimpl, M.; Heesen, C.; Daumer, M. Ecological validity of walking capacity tests in multiple sclerosis. PLoS ONE 2015, 10, e0123822. [Google Scholar] [CrossRef] [Green Version]
- Anstasopoulou, P.; Shammas, L.; Hey, S. Assessment of human gait speed and energy expenditure using a single triaxial accelerometer. In Proceedings of the 2012 Ninth International Conference on Wearable and Implantable Body Sensor Networks, London, UK, 10–12 May 2012; pp. 184–188. [Google Scholar]
- Motl, R.W.; Weikert, M.; Suh, Y.; Sosnoff, J.J.; Pula, J.; Soaz, C.; Schimpl, M.; Lederer, C.; Daumer, M. Accuracy of the actibelt® accelerometer for measuring walking speed in a controlled environment among persons with multiple sclerosis. Gait Posture 2012, 35, 192–196. [Google Scholar] [CrossRef]
- Agiovlasitis, S.; Motl, R.W. Step-rate thresholds for physical activity intensity in persons with multiple sclerosis. Adapt. Phys. Act. Q. 2014, 31, 4–18. [Google Scholar] [CrossRef] [PubMed]
- Shema-Shiratzky, S.; Gazit, E.; Sun, R.; Regev, K.; Karni, A.; Sosnoff, J.; Herman, T.; Mirelman, A.; Hausdorff, J.M. Deterioration of specific aspects of gait during the instrumented 6-min walk test among people with multiple sclerosis. J. Neurol. 2019, 266, 3022–3030. [Google Scholar] [CrossRef]
- Bennett, S.E.; Bromley, L.E.; Fisher, N.M.; Tomita, M.R.; Niewczyk, P. Validity and reliability of four clinical gait measures in patients with multiple sclerosis. Int. J. MS Care 2017, 19, 247–252. [Google Scholar] [CrossRef] [PubMed] [Green Version]
- Rossier, P.; Wade, D.T. Validity and reliability comparison of 4 mobility measures in patients presenting with neurologic impairment. Arch. Phys. Med. Rehabil. 2001, 82, 9–13. [Google Scholar] [CrossRef] [PubMed]
- Gabrys, L.; Thiel, C.; Tallner, A.; Wilms, B.; Müller, C.; Kahlert, D.; Jekauc, D.; Frick, F.; Schulz, H.; Sprengeler, O. Akzelerometrie zur erfassung körperlicher aktivität. Sportwissenschaft 2015, 45, 1–9. [Google Scholar] [CrossRef]
- Motl, R.W.; Sandroff, B.M.; Sosnoff, J.J. Commercially available accelerometry as an ecologically valid measure of ambulation in individuals with multiple sclerosis. Expert Rev. Neurother. 2012, 12, 1079–1088. [Google Scholar] [CrossRef]
- Motl, R.W.; Pilutti, L.; Sandroff, B.; Dlugonski, D.; Sosnoff, J.J.; Pula, J. Accelerometry as a measure of walking behavior in multiple sclerosis. Acta Neurol. Scand. 2013, 127, 384–390. [Google Scholar] [CrossRef]
- Sosnoff, J.J.; Socie, M.J.; Boes, M.K.; Sandroff, B.M.; Motl, R.W. Does a waist-worn ActiGraph accelerometer quantify community ambulation in persons with multiple sclerosis? Age 2012, 46, 23. [Google Scholar] [CrossRef] [Green Version]
- ActiGraph LLC. User Guide. Actigraph wGT3X-BT + ActiLife. Revision 2. Available online: https://s3.amazonaws.com/actigraphcorp.com/wp-content/uploads/2019/02/04090339/ActiGraph_wGT3X-BT_UserGuide_02012019_Revision2_FINAL.pdf (accessed on 13 August 2019).
- Kratz, A.L.; Fritz, N.E.; Braley, T.J.; Scott, E.L.; Foxen-Craft, E.; Murphy, S.L. Daily Temporal Associations Between Physical Activity and Symptoms in Multiple Sclerosis. Ann. Behav. Med. 2018, 53, 98–108. [Google Scholar] [CrossRef]
- Engelhard, M.M.; Patek, S.D.; Lach, J.C.; Goldman, M.D. Real-world walking in multiple sclerosis: Separating capacity from behavior. Gait Posture 2018, 59, 211–216. [Google Scholar] [CrossRef]
- Neven, A.; Vanderstraeten, A.; Janssens, D.; Wets, G.; Feys, P. Understanding walking activity in multiple sclerosis: Step count, walking intensity and uninterrupted walking activity duration related to degree of disability. Neurol. Sci. 2016, 37, 1483–1490. [Google Scholar] [CrossRef] [PubMed]
- Comber, L.; Galvin, R.; Coote, S. Gait deficits in people with multiple sclerosis: A systematic review and meta-analysis. Gait Posture 2017, 51, 25–35. [Google Scholar] [CrossRef] [PubMed]
- Knaier, R.; Höchsmann, C.; Infanger, D.; Hinrichs, T.; Schmidt-Trucksäss, A. Validation of automatic wear-time detection algorithms in a free-living setting of wrist-worn and hip-worn ActiGraph GT3X+. BMC Public Health 2019, 19, 244. [Google Scholar] [CrossRef] [PubMed]
- Migueles, J.H.; Cadenas-Sanchez, C.; Ekelund, U.; Nyström, C.D.; Mora-Gonzalez, J.; Löf, M.; Labayen, I.; Ruiz, J.R.; Ortega, F.B. Accelerometer data collection and processing criteria to assess physical activity and other outcomes: A systematic review and practical considerations. Sports Med. 2017, 47, 1821–1845. [Google Scholar] [CrossRef] [PubMed]
- Sandroff, B.M.; Motl, R.W.; Pilutti, L.A.; Learmonth, Y.C.; Ensari, I.; Dlugonski, D.; Klaren, R.E.; Balantrapu, S.; Riskin, B.J. Accuracy of StepWatch™ and ActiGraph accelerometers for measuring steps taken among persons with multiple sclerosis. PLoS ONE 2014, 9, e93511. [Google Scholar] [CrossRef] [PubMed]
- Toth, L.P.; Park, S.; Pittman, W.L.; Sarisaltik, D.; Hibbing, P.R.; Morton, A.L.; Bassett, D. Effects of brief intermittent walking bouts on step count accuracy of wearable devices. J. Meas. Phys. Behav. 2019, 2, 13–21. [Google Scholar] [CrossRef]
- Casey, B.; Coote, S.; Galvin, R.; Donnelly, A. Objective physical activity levels in people with multiple sclerosis: Meta-analysis. Scand. J. Med. Sci. Sports 2018, 28, 1960–1969. [Google Scholar] [CrossRef]
- ActiGraph LLC. Documentation: Low Frequency Extension Explained. Available online: https://actigraphcorp.force.com/support/s/article/Low-Frequency-Extension-Explained (accessed on 2 September 2019).
- Feito, Y.; Garner, H.R.; Bassett, D.R. Evaluation of ActiGraph’s Low-Frequency Filter in Laboratory and Free-Living Environments; DigitalCommons@ Kennesaw State University: Kennesaw, GA, USA, 2015. [Google Scholar]
- Cain, K.L.; Conway, T.L.; Adams, M.A.; Husak, L.E.; Sallis, J.F. Comparison of older and newer generations of ActiGraph accelerometers with the normal filter and the low frequency extension. Int. J. Behav. Nutr. Phys. Act. 2013, 10, 51. [Google Scholar] [CrossRef] [Green Version]
- Filli, L.; Sutter, T.; Easthope, C.S.; Killeen, T.; Meyer, C.; Reuter, K.; Lörincz, L.; Bolliger, M.; Weller, M.; Curt, A. Profiling walking dysfunction in multiple sclerosis: Characterisation, classification and progression over time. Sci. Rep. 2018, 8, 4984. [Google Scholar] [CrossRef]


| Variable | Sample (N = 20) |
|---|---|
| Age | 44.2 ± 12.2 (26–63) |
| Gender | |
| female | 15 (75%) |
| male | 5 (25%) |
| EDSS 1 (N = 18) | 3.1 ± 1.4 (1–6) |
| Duration of disease | 9.1 ± 7.7 (1–32) |
| Disease course | |
| RRMS 2 | 14 (70%) |
| SPMS 3 | 4 (20%) |
| PPMS 4 | 2 (10%) |
| Free-living PA 5 | |
| Measurement days | 6.7 ± 0.9 |
| Daily wear time | 14H 21M ± 01H 52M |
| 2MWT 6 | |
| steps | 229.9 ± 45.2 (96–297) |
| Distance in meter (N = 19) | 179.6 ± 54.5 (44.1–253.5) |
| Steps per day | 13,304 ± 4280 (6813–20,395) |
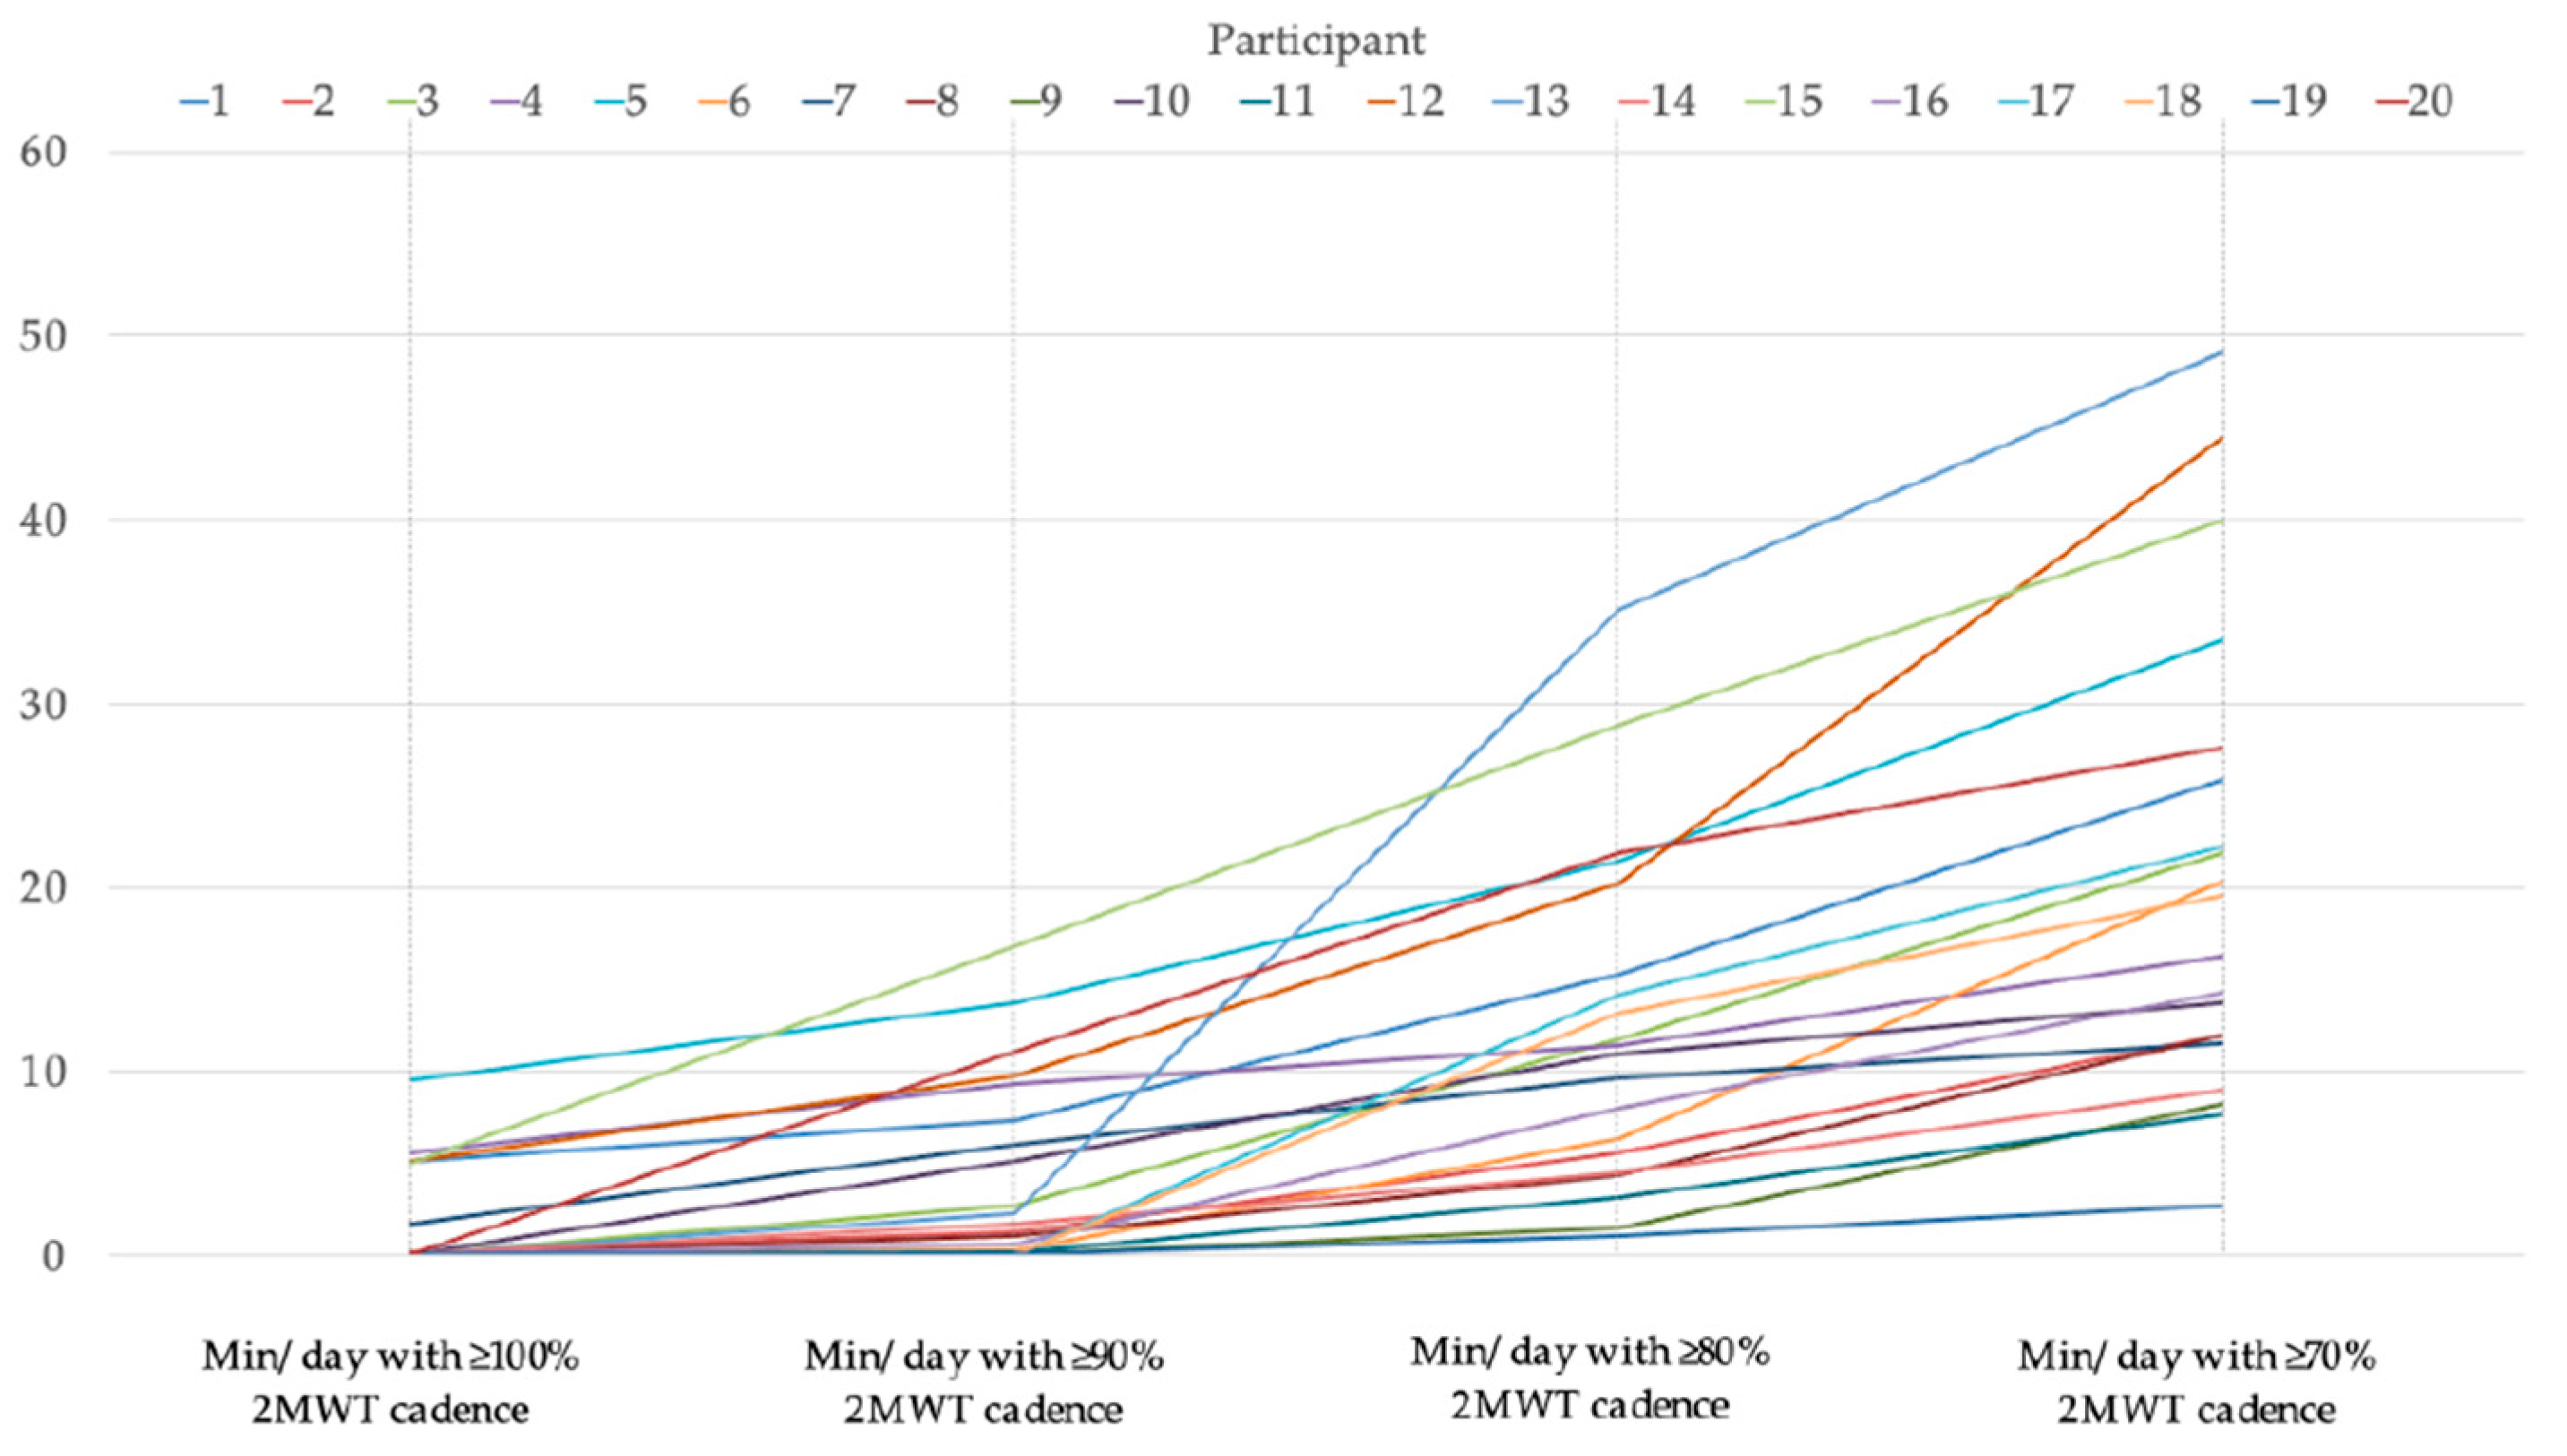
| Variable | Minutes per Day with at Least % of 2MWT Cadence | |||
|---|---|---|---|---|
| 100% | 90% | 80% | 70% | |
| N | 6 | 13 | 20 | 20 |
| Mean | 5.4 ± 2.5 | 6.8 ± 5.1 | 12.4 ± 9.2 | 20.6 ± 12.8 |
| Minimum | 1.7 | 1 | 1 | 2.7 |
| Maximum | 9.6 | 16.9 | 35.1 | 49.1 |
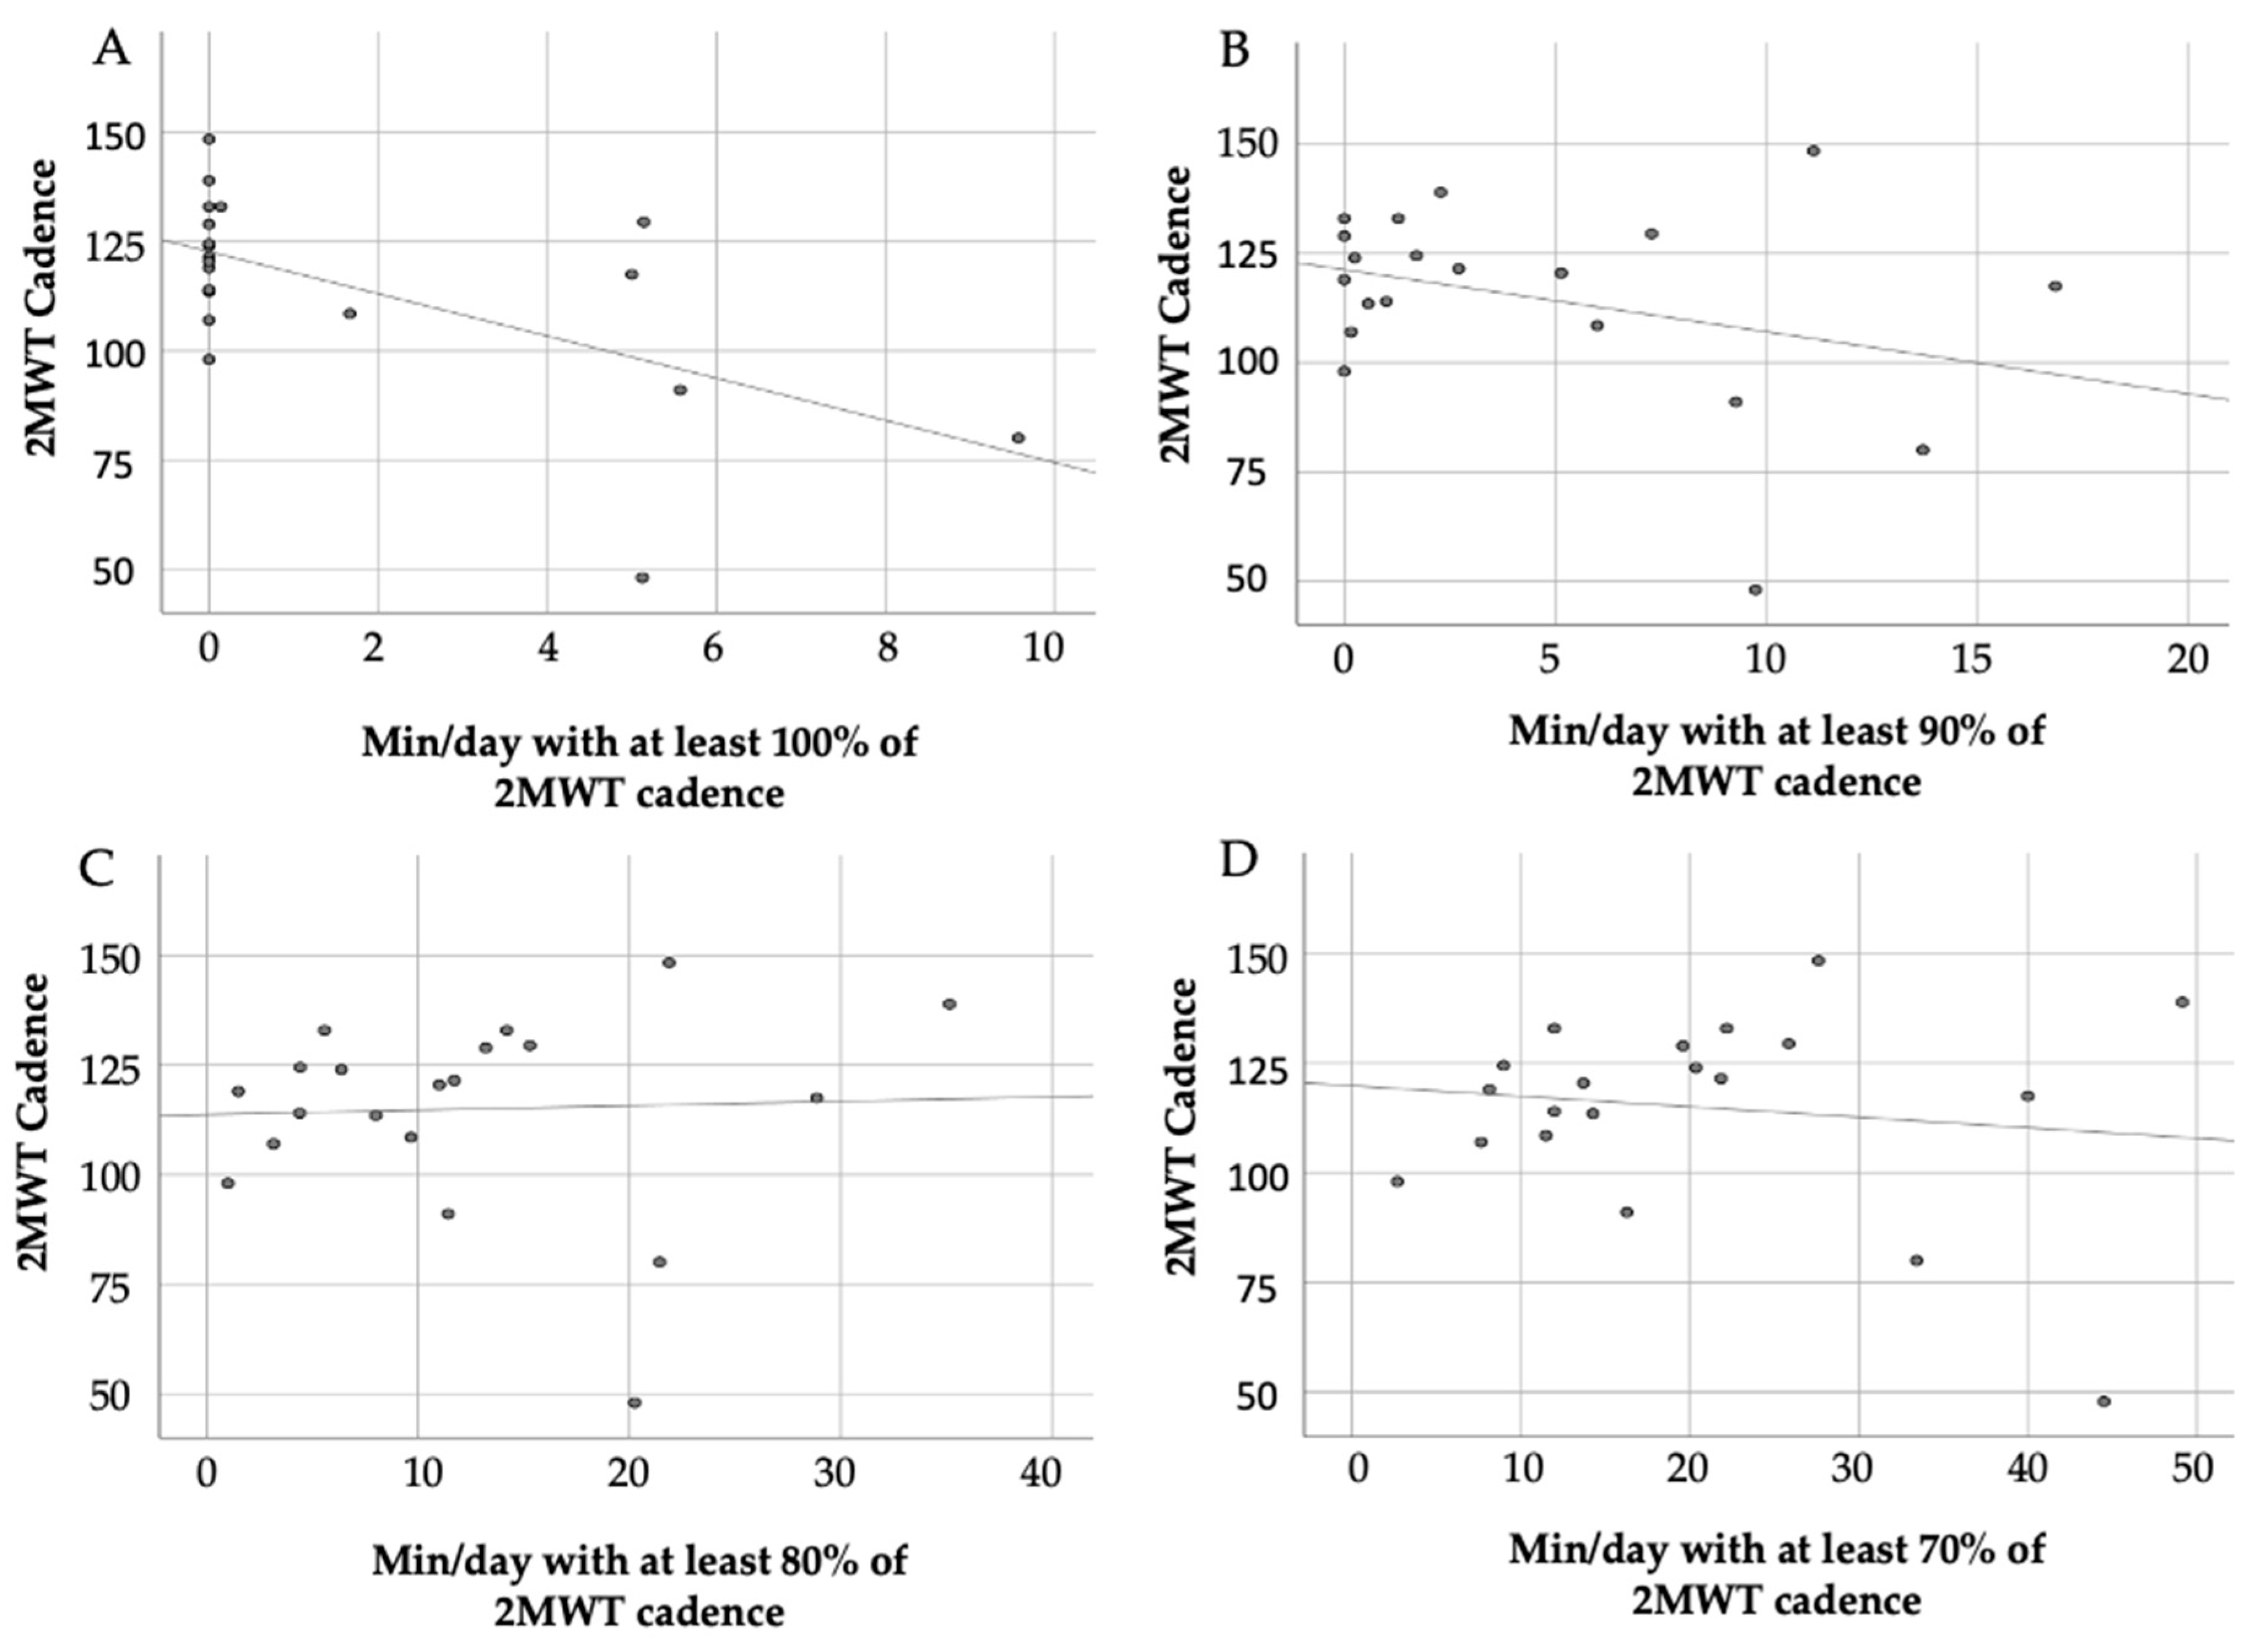
| Variable N = 20 | Cadence 2MWT ρ (p-Value) |
|---|---|
| Minutes per day with at least 100% of 2MWT cadence | −0.416 (p = 0.068) |
| Minutes per day with at least 90% of 2MWT cadence | −0.169 (p = 0.475) |
| Minutes per day with at least 80% of 2MWT cadence | 0.265 (p = 0.276) |
| Minutes per day with at least 70% of 2MWT cadence | 0.224 (p = 0.343) |
Publisher’s Note: MDPI stays neutral with regard to jurisdictional claims in published maps and institutional affiliations. |
© 2020 by the authors. Licensee MDPI, Basel, Switzerland. This article is an open access article distributed under the terms and conditions of the Creative Commons Attribution (CC BY) license (http://creativecommons.org/licenses/by/4.0/).
Share and Cite
Karle, V.; Hartung, V.; Ivanovska, K.; Mäurer, M.; Flachenecker, P.; Pfeifer, K.; Tallner, A. The Two-Minute Walk Test in Persons with Multiple Sclerosis: Correlations of Cadence with Free-Living Walking Do Not Support Ecological Validity. Int. J. Environ. Res. Public Health 2020, 17, 9044. https://doi.org/10.3390/ijerph17239044
Karle V, Hartung V, Ivanovska K, Mäurer M, Flachenecker P, Pfeifer K, Tallner A. The Two-Minute Walk Test in Persons with Multiple Sclerosis: Correlations of Cadence with Free-Living Walking Do Not Support Ecological Validity. International Journal of Environmental Research and Public Health. 2020; 17(23):9044. https://doi.org/10.3390/ijerph17239044
Chicago/Turabian StyleKarle, Viktoria, Verena Hartung, Keti Ivanovska, Mathias Mäurer, Peter Flachenecker, Klaus Pfeifer, and Alexander Tallner. 2020. "The Two-Minute Walk Test in Persons with Multiple Sclerosis: Correlations of Cadence with Free-Living Walking Do Not Support Ecological Validity" International Journal of Environmental Research and Public Health 17, no. 23: 9044. https://doi.org/10.3390/ijerph17239044