
Abstract
Stromboli is an active, open conduit mafic volcano, whose persistent mild Strombolian activity is occasionally punctuated by much stronger explosions, known as paroxysms. During summer 2019, the volcano unexpectedly produced one such paroxysm on July 3, followed by intense explosive and intermittent effusive activity culminating in a second paroxysm on August 28. Visual observations and the analysis of the fall deposits associated with the two paroxysms allowed us to reconstruct ballistic exit velocities of up to 160 m s−1. Plume heights of ~ 8.4 km and 6.4 km estimated for the two events correspond to mass eruption rates of 1.1 × 10⁶ kg s−1 and 3.6 × 10⁵ kg s−1, respectively. This is certainly an underestimate as directional pyroclastic flows into which mass was partitioned immediately formed, triggering small tsunamis at the sea entrance. The mass of ballistic spatters and blocks erupted during the July 3 event formed a continuous cover at the summit of the volcano, with a mass calculated at ~ 1.4 × 10⁸ kg. The distribution of fall deposits of both the July 3 and August 28 events suggests that pyroclasts characterized by terminal fall velocities < 10–20 m s−1 remained fully suspended within the convective region of the plume and did not fall at distances closer than ca 1700 m to the vent. Based on the impulsive, blast-like phenomenology of paroxysms as well as the deposit distribution and type, paroxysms are classified as basaltic Vulcanian in style. The evolution of the summer 2019 eruptive events was not properly captured within the framework of the alert level system which is focused on tsunamigenic processes, and this is discussed so as to provide elements for the implementation of the reference scenarios and an upgrade of the system to take into account such events. In particular we find that, although still largely unpredictable, at least at operational time scales, and not necessarily tsunamigenic, Vulcanian eruptions and the subsequent evolution of the eruptive phenomena should be considered for the alert level system. This serves as a warning to the implementation of alert systems where the unexpected needs to be taken into account, even at systems that are believed to be relatively “predictable” as is the case at many persistently active, open vent mafic systems.
Introduction
Open conduit mafic volcanoes, such as Etna, Kilauea and Yasur, usually show weak and very small volume explosive activity, rarely interrupted by poorly understood and largely unpredictable larger explosions (e.g. Andronico et al. 2014; Houghton et al. 2017; Simons et al. 2020). Stromboli is one such volcano and probably the most iconic of this type of open conduit mafic volcanoes, where the “normal” Strombolian activity (Mercalli 1907), comprising repeated events sending ballistics to heights of tens to a few hundreds of metres, usually up to 10–30 events per hour (e.g. Barberi et al. 1993; Patrick et al. 2007; Ripepe et al. 2008), is occasionally interrupted by much larger explosive eruptions which can send plumes to heights of a few kilometres and feed pyroclastic flows. These explosive eruptions have been referred to as “paroxysms” by Barberi et al. (1993), a terminology that has been largely used in subsequent literature. Defining and classifying these larger eruptions, and understanding their source conditions and mechanism, as well as associated eruption dynamics, has thus become a major challenge (e.g. Harris and Ripepe 2007a; Houghton et al. 2013; Freret-Lorgeril et al. 2018). Parametric and phenomenological definition of weak explosive styles is not easy, and many authors have proposed different ways to its classification (e.g. Walker 1973; Harris and Ripepe 2007a; Houghton et al. 2013; Bonadonna et al. 2016). Among such eruptive styles, paroxysms lack of a clear definition and have sometimes been described within the family of violent Strombolian activity (i.e. “single violent Strombolian episode” in Taddeucci et al. 2015). However, the violent Strombolian activity describes prolonged of mild explosivity usually lasting for days, to build scoria cones plus relatively thick and scoria fall deposits, dispersed well away from the cone itself (e.g. Walker 1973; Calvari and Pinkerton 2004; Pioli et al. 2008). Such activity thus displays a substantially different eruption style and deposit characteristic with respect to the short-lived, impulsive style of paroxysms that have occurred at Stromboli (Barberi et al. 1993; Rosi et al. 2013). For these reasons, Taddeucci et al. (2015) commented that the term paroxysm “remain somewhat ambiguous and local”. For example, Andronico and Pistolesi (2010) used “small-“ to “large-scale” paroxysms to qualitatively illustrate the large variations in intensity and dispersal that higher than “normal” explosive activity (cf. Barberi et al. 1993) may produce at Stromboli (see also Bertagnini et al. 2008). Calvari et al. (2006) and D'Auria et al. (2006) have alternatively described such paroxysmal events as Vulcanian, as for the 2003 paroxysm at Stromboli, as it impulsively cleared a vent that had been blocked for 3 months prior to the event.
During the summer of 2019, Stromboli volcano produced two paroxysmal eruptions, 2 months apart, on July 3rd and August 28th. Both paroxysms occurred from the summit crater area in open-conduit conditions, producing short-lived buoyant columns and pyroclastic density currents partly flowing over and partly entering the sea, to trigger small and rapidly attenuating tsunamis. The July 3 paroxysm was unexpected and was preceded by an activity instrumentally considered normal Strombolian (cf. Ripepe et al. 2008). The only precursory phenomena recognized was ground deformation started just 10 min before the eruption (Giudicepietro et al. 2020).
Mechanisms generating paroxysms at Stromboli are highly debated and still very poorly understood. They invariably involve the eruption of two magmatic components. The first is a deep (ca 10 km) and volatile rich aphyric magma, usually known as LP (low porphyritic) magma (Métrich et al. 2005; Francalanci et al. 2008; Bertagnini et al. 2011), and which is responsible for the intensity of the eruption (cf. Rosi et al. 2006). The second is a highly crystalline and partially degassed magma, known as HP (high porphyritic), representing the magma resident in the shallow plumbing system (Métrich et al. 2005; Francalanci et al. 2008; Bertagnini et al. 2011).
Conceptual models to explain how paroxysms are triggered include the top-down decompression of the deep LP magma as a result of the progressive effusive withdrawal of the shallow plumbing system, as observed during the 2003 and 2007 events (Calvari et al. 2011), and also suggested by Rittmann (1931) to explain the 1930 event; in contrast, melt inclusion data have been used as evidence for a bottom-up trigger for the same 2003 event (Métrich et al. 2005). The two resulting scenarios are substantially different in terms of eruption precursors as the first involves a progression of events leading to the paroxysm, while the second accounts for their sudden occurrence.
The two 2019 paroxysms occurred during the main holiday season on Stromboli island, when the local population was at its yearly maximum, comprising not only the ca. 400 residents but also day trippers and tourists staying on the island, which can increase the number of people by up to an order of magnitude (Regione Siciliana 2019). National and international media reported on one person who died during the July 3 event, due to exposure to smoke and heat from bush fires triggered by incandescent ballistics that reached very low-lying ground in the southern part of the island, near the village of Ginostra (Fig. 1). The July 3 paroxysm occurred in the afternoon, just 2–3 h before the usual time when the trekking excursions reach the summit, and when tourist boats wait in the evening just below the Sciara del Fuoco, a few hundred metres from the coast, to view the nightly eruption show. Should the eruption have occurred just a few hours later, the toll of human lives would have been dramatically higher.

3D perspective view of Stromboli volcano and main localities (image from Google Earth Pro V. 7.3.3.7786 (7/7/2019) Stromboli 38°47′33.89″N, 15°12′46.75″E, European Space Imaging 2020. http://www.earth.google.com [August 19, 2020]); NE, C and SW indicate the northeast, central and southwest crater areas, respectively. H indicates the summit helipad at 850 m a.s.l; S is the location of the Skyline webcam at 750 m a.s.l. The box shows the location of Stromboli and the Aeolian islands within their submarine volcanic context (modified from Pensa et al. 2019)
Other open conduit volcanoes, such as Villarrica (Chile) and Yasur (Vanuatu) are, like Stromboli, among the most visited volcanoes in the world, due to their persistent, mild explosivity which allows visitors and scientists to access the summits and to make very close direct observations of the explosions, usually in safe conditions. However, a lack of full understanding and of preparedness to unheralded paroxysmal activity may cause injuries or death.
The authors of this contribution were the only volcanologists on the island during the July 3 paroxysm. The authors also had the opportunity to witness the evolution of the volcanic activity during the preceding month, in a series of summit excursions between June 1 and July 2, a period that included a major explosion on the night of June 25.
In this paper, we document the physical distribution of ballistics and plume fallout deposits of both the July 3 and August 28, 2019 paroxysms, and we reconstruct the main physical characteristics of the eruptions, based on observations, deposit dispersal and grain size. We also document the main petrographic features of the erupted materials. We discuss the data in the framework of the current understanding of the style of activity at Stromboli and propose the use of “basaltic/mafic Vulcanian” to describe the eruption style, deposit type and distribution known up to now simply as paroxysm. We also draw some conclusions that may be of use for the scientific community and civil protection authorities to manage volcanic hazard and risk at Stromboli, with possible general implications for other open conduit volcanic systems.
Geological and volcanological framework
Stromboli Island (924 m a.s.l.) is the upper part of a ca. 3-km-high stratovolcano which rises from the Tyrrhenian seafloor (Fig.1) (Pensa et al. 2019). It has had persistent eruptions of volatile-rich high-potassium (HK) to shoshonitic basaltic magma (Métrich et al. 2001) over the past 1400–1800 years (Rosi et al. 2000, 2013). For the reconstruction of the < 200 ka stratigraphy and magmatic evolution of the subaerial portion of Stromboli volcano, the reader is referred to the detailed work of several research groups (Rosi 1980a; Pasquare’ et al. 1993; Francalanci et al. 2013) and geological maps (Rosi 1980b; Hornig-Kjarsgaard et al. 1993; Lucchi et al. 2013).
Here we focus on the volcanological framework and the main features associated with the most recent eruptive activity.
Until the summer 2019 paroxysms, the elliptical terrace crater area (presently at ca 780 m a.s.l.; this and all other elevations reported in this text and related supplementary materials are based on the Digital Elevation Model associated with Google Earth) had been divided into three main sectors, termed the SW, Central and NE craters. Most of the tephra produced by explosions fall around these craters, and/or are deposited/roll along the Sciara del Fuoco collapse depression, sometimes reaching the coastline.
Normal explosive Strombolian activity is associated with mild explosions, usually classified as coarse ballistic-dominated (type 1 in Patrick et al. 2007), ash dominated (type 2 in Patrick et al. 2007) or a continuous active degassing (puffing; Harris and Ripepe 2007b; Ripepe et al. 2008). Occasionally gas-dominated eruptions occur, classified as type 0 (Leduc et al. 2015). Ordinary activity is occasionally interrupted by effusive activity, which may last for hours to months, and by much higher intensity and impulsive explosions: from small-scale paroxysms (also called major explosions, Barberi et al. 1993) to large-scale ones, which usually involve various vents in the crater area. The former affect only the upper part of the volcano, whereas the latter can extensively cover the summit and the upper flanks of the volcano with continuous layer(s) of tephra and affect the coastal settlements (e.g. Riccò 1907; Rittmann 1931; Barberi et al. 1993; Bertagnini et al. 1999, 2008, 2011; Pistolesi et al. 2008, 2011).
Over the last 120 years, 20 paroxysmal events occurred at Stromboli, 16 times in the twentieth century between 1906 and 1959, with the 1930 one considered as being the most energetic (Bertagnini et al. 2011). Paroxysms resumed after a 44-year period in 2003 and 2007 (Rosi et al. 2013), before the 2019 events. In 1930, and possibly in 1916, two paroxysms occurred in close succession and without significant precursory phenomena (e.g. Imbò 1928; Rittmann 1931; Abbruzzese 1935). In contrast, the well monitored and described April 5, 2003, and March 15, 2007, events occurred during complex and prolonged eruptive phases revealed by the progressive increase in all monitoring and observational data associated with an increased intensity of the Strombolian activity. This led to summit effusive activity, and eventually to the lateral injection and opening of effusive vents along the Sciara del Fuoco, and the clogging of the summit vents (e.g. Ripepe et al. 2005; Carapezza et al. 2004; Barberi et al. 2009; Aiuppa et al. 2009; Giordano and Porreca 2009; Calvari et al. 2006, 2008).
During the last ≈ 2000 years, several stratigraphic units have been generated mainly by summit explosive activity, with only one eccentric eruption along the NE flank of Stromboli (San Bartolo lava) (Lucchi et al. 2019). It is of note that the recent history of Stromboli has been characterized by a major change in magma composition: from the high-K shoshonites erupted since 10 ka, to dominantly shoshonitic basalts and shoshonites (and minor high-K basalts and basaltic–andesites; Francalanci et al. 2013). The present activity, since about the eighth century AD, is characterized by two different types of magmas known as HP and LP magmas, which display variable degrees of crystallization and gas contents, although characterized by similar bulk compositions (Bertagnini et al. 2008). High-porphyritic, black and dense scoriae associated with ordinary Strombolian activity characterize the HP magma (end member). Low-porphyritic and highly vesiculated pumice associated with paroxysms and some of the major explosions characterize the LP magma. During paroxysms, mingling between HP and LP magmas commonly occurs (Bertagnini et al. 2008, 2011), and the coexistence of HP dark scoriae and LP (or golden) pumices is the distinctive field characteristic of the deposits from the explosive paroxysmal activity. The two magma types have been extensively studied, and we refer to the most recent literature for the appropriate chemical and petrological knowledge (Métrich et al. 2001, 2005; Bertagnini et al. 2008; Francalanci et al. 2008, 2013; Landi et al. 2009; Di Stefano et al. 2020). HP magmas characterize the lava effusions as well as the ordinary explosive activity.
In the last two decades, both petrological studies and geophysical investigations (Métrich et al. 2010; Patanè et al. 2017) suggest that the present Stromboli feeding system is polybaric extending down to about 10 km in depth, with multiple small storage horizons and an upper portion permanently filled by HP magma.
Methods
Observational data
Direct observations were made by the authors in the month preceding the July 3 paroxysm, during five summit excursions, the last climb made on July 2. The authors stayed on the island, in Stromboli village, after this last climb, and witnessed the July 3 paroxysm and subsequent activity until July 8. Information deriving from personal direct observation, photos and videos includes the general features of the eruptive phenomena and the approximate timing of the succession of the events observed. This information has been combined with interviews with individuals who also witnessed the paroxysm from different locations. Seven interviews were aimed at collecting and verifying information on the main phenomena observed on July 3 from Ginostra village (Fig. 1), such as the duration and extent of ballistic fall and pumice fall. Three interviews were carried out with people who were swimming and saw the effects of the tsunami on the Stromboli side. A further five people shared their photo records and videos (Figs. 2 and 4). The authors contacted two people on the island during the August 28 eruption to have them measure the duration of the pumice fall on Stromboli village at Scari harbour and to take a sample of the fall deposit at Piscità (locations in Fig. 1). In addition, a large amount of photos and videos recorded by tourists at different times and from many different viewpoints on the island, offshore and from nearby islands have become readily available on the Internet and have provided an invaluable amount of information on the eruption phenomena and dynamics. Some of this material has been used as the basis for Figs. 3, 5, 6 and 7. The chronograms of Figs. 3, 5 and 7 were retrieved from frames of videos extracted every 1 or 2 s, with the approximate initiation of the eruption taken as time 0, as observable on the video itself. Frames were rectified and overlapped; colours were enhanced before redrawing the outline of the eruptive plume and pyroclastic flows, taken as the edge of the observable main colour contrast between the pyroclastic mixture and the ambient surroundings (either the sky or the volcanic edifice). Scaling was approximated by using the known elevations of recognizable topographic features, such as Il Pizzo (918 m a.s.l.) and the crater terrace (780 m a.s.l.) (see Fig. 1). Corrections to the perspective were made with the aid of Google Earth, by locating the viewpoint for each video or photo as accurately as possible. Redrawings provide mostly 2D information; three-dimensional effects, such as the expansion of the cloud and the fallout of spatter clasts towards the video camera in Fig. 5a, could be estimated by correctly locating the position of known topographic features and with the aid of 3D measures in Google Earth Pro V. 7.3.3.7786 (Fig. 5b). Similarly, it was possible to draw the approximate outer extent of ballistic fall out across the edifice (Figs. 8 and 12) by locating the sites of bushfires visible on images and videos, which were triggered by incandescent bombs on landing.

(a, b, c) Photos of the early phases of the Vulcanian column that developed at 14:45 UTC on July 3, 2019, from Stromboli village taken a few seconds after the first explosion (courtesy of Silvia Zorra Frenquelli; (d) the “mushroom” shape of the column, with nearly vertical edges rapidly transitioning into an expanded vortex top, is typical of the underexpanded jet phase of Vulcanian plumes; the dark cloud rising above the summit rim to the right of the main column is the ash cloud of the developing pyroclastic density currents on the Sciara del Fuoco; the dark ground hugging cloud to the left represents a slide of incipiently welded spatter from the summit, which formed a glowing avalanche down Rina Grande (photo courtesy of Gabriele Scognamiglio)

Chronogram of the July 3 rising plume and of pyroclastic density currents along the Sciara del Fuoco derived from frames of video available at https://youtu.be/FVVg08fjL-Y (last access 03 September, 2020). Note the thickening of the head of the first pdc at 38 s after entering the sea. Black squares indicate the tip of the two main visible ballistics fingers exiting from the initial expanding bulb at 4 s. Ballistics begin to fall into water at 20s within a range indicated by the two larger squares and keep falling for a few seconds reaching the largest range at 25 s, indicated by the smaller squares
The heights of the July 3 and August 28 columns in Fig. 6 were obtained by redrawing images taken from Panarea island, i.e. far enough away to minimize the error of view angle but close enough for the volcanic edifice (924 m a.s.l.) to still be easily visible and used as a reference for scaling. The column height was corrected for the error of view angle by calculating first the angle α between the horizontal distance from the view point and Stromboli (L = 16 km for the image used in Fig. 6a and 20 km for the image used in Fig. 6b) and the edifice elevation (He = 0.9 km) as α = tan−1(He/L); then the angle β from the view point to the top of the column Ht was calculated as α times the ratio of the apparent height of the column Hta and He, which makes it possible to calculate the “true” height from sea level as Hts = tan(β) L and finally the height of the column Ht by subtracting the elevation of the crater terrace, 780 m, from Hts (see Supplementary material S2). Note that errors were introduced due to the expansion of the umbrella cloud, which may have resulted in an overestimation of the spreading towards the view point. The selection of images was made to take this into account to minimize possible errors, and it was made easier by there being only very mild winds locally (http://clima.meteoam.it/).
Field data
The field survey was aimed at collecting samples for geochemistry and for grain size, componentry and thickness of fall deposits.
Field work on the July 3 eruption deposits was conducted immediately after the event, from July 4 to 8, before the fallout material was removed and reworked. The village of Ginostra and its surroundings, i.e. the section of the island affected by ballistic and pumice fallout, were surveyed below 250 m a.s.l. as the intense bushfires made it very difficult to make reliable observations above this altitude. The northern flank of the island was inspected up to 500 m a.s.l. due to restrictions to climbing higher. The proximal deposits of the July 3 eruption were accessed later, in two field campaigns in early September 2019 and in June 2020. Field measurements were taken at 39 localities.
The sampling of the August 28 eruption deposits was performed in early September 2019, just a few days after the event, and before major rainfalls had completely cleared and/or reworked the deposits. Field work included a climb to the summit. Field measurements and sampling were carried out at 29 localities.
Coordinates of measurement and sampling localities are reported in Supplementary material as file .kml (S3a,b). Sampling of continuous pumice lapilli fall was made by total removal of the deposit on a standard area 40 cm by 40 cm (Fig. S1 in supplementary material). Density of clasts was calculated by immersion of dried and carefully wrapped samples and by measuring volume and weight (Table S4 in supplementary material). Grain size analyses were carried out after drying samples by hand sieving (Table S5 in supplementary material). Petrographic analyses to assess the porphyricity and vesicularity of juvenile clasts were performed using a petrographic microscope on 30-μm polished thin sections and by point and area counting.
Exit velocities of ballistic clasts were calculated using Eject 1.4 free software (Mastin 2001). Data used for running the software calculated the equivalent diameter of the clast, the clast density, the landing distance from vent, the difference in elevation of landing point with respect to the vent and, where possible, the approximate timing of landing (Table S6 in Supplementary material).
Observational data of the summer 2019 Stromboli eruptions
Period between June 1 and July 3 (including the major explosion on June 25)
The summit of Stromboli was visited on June 1, when the activity was very mild and ordinary, with a few explosions per hour of types 1 (bomb-dominated) 2a (ash-and-bomb-dominated) and 2b (ash-dominated) (Patrick et al. 2007).
The summit was visited again on June 20 and 23, during the International Summer School of Volcanology organized by the Italian Association of Volcanology (AIV; www.aivulc.it), when the explosive activity, though still within the limits of normal eruptions, had visibly increased in frequency and intensity. In particular, during an exercise with the students conducted by A. Harris (personal comm.), thermal cameras recorded more than fifty thermal transients (explosions) in 1 h. Juveniles were ejected to heights of hundreds of metres. All terrace crater areas were active; the NE crater was dominated by type 2 explosions with subordinate type 1; the central crater area was dominated by almost continuous puffing and spattering; the SW crater was dominated by type 1 explosions which were constructing a narrow hornito up to 10 m in height; and between the SW and central craters, close to the Sciara del Fuoco, one vent with no rim produced gas-dominated explosions (similar to type 0 in Leduc et al. 2015), characterized by strong detonations lasting up to 2 min, with narrow gas jets reaching 200–300 m in elevation above the crater, with almost no juveniles involved (Fig.S1a in Supplementary material).
During the night of June 25, a major explosion occurred from the central crater, launching incandescent ballistics over and across the Pizzo, some of which rolled down the Rina Grande slope, reaching and setting fire to the vegetation at ca. 500 m a.s.l.
The summit was then visited on June 26. The major explosion was directional as almost no ballistics were seen along the ascent climb track. Southwards from the summit, we observed and sampled both lithic blocks and dark spatter bombs made of HP magma associated with impact craters up to some tens of cm deep (Fig. S1b and Supplementary material). Large bombs and blocks were scattered along the descent track with a southerly dispersal. The central crater rim was littered with large lithic blocks, and the crater floor was levelled out and covered by large coalescing spatter clasts (Fig. S1c in Supplementary material). At the centre of the crater floor, two open vents were continuously puffing and spattering from large gas bubbles bursting at the surface. Within the SW crater area, the hornito reached some tens of metres in height with a stable morphology on a large base. The frequency, intensity and style of activity observed on June 26 persisted in a similar way to that observed on June 20 and 23, including very strong gas-dominated explosions, which we visually and acoustically measured with the aid of a watch to last more than 1 min.
On July 2, the summit was visited again at night. The explosions were as frequent and intense as in the preceding period. In particular, the central crater area was the site of continuous and intense spattering; the hornito in the SW crater area reached the dimensions of a scoria cone and issued frequent type 1 lava fountains a few hundred metres in height, slightly directed towards the south, and so rich in juvenile material that the associated heat wave was clearly perceived from the observation point at the summit (Fig.S1d in Supplementary material). Lapilli and bombs ejected by the directional high fountain reached very close to a location just below the Pizzo, where tourists were sitting watching the eruption. No gas-dominated (type 0) explosions were witnessed on July 2.
According to available public reports of monitoring activity (www.lgs.geo.unifi.it; www.ct.ingv.it), the entire period described was within the range of ordinary Strombolian activity, and accordingly the alert level for the civil protection was green.
The July 3 paroxysm
On the afternoon of July 3, we heard two very strong, closely spaced detonations, with no perceivable precursor, followed by the formation and rise of a dark pyroclastic plume above the summit craters (Fig. 2 and Fig. S1e in Supplementary material). Ballistics were launched down the volcano slope as low as 500 m a.s.l. along the N flank above Stromboli village, and below 200 m a.s.l., partly hitting Ginostra village, and starting fires that lasted days (Figs. S1f,g in Supplementary material). From Stromboli village, some tens of seconds after, it was possible to observe the rise of an ash cloud associated with pyroclastic flows along the Sciara del Fuoco (Fig. 2d and Fig. S1e in Supplementary material). A small tsunami, signalled by the formation of eddies in the seawater, was observed reaching the Ficogrande beach ca 1–2 min after the ash cloud was seen. Some tourists, who were swimming, told us of a strong seaward current which made it impossible for them to reach the seashore for some seconds.
The eruption started at 14:45, with only a very short-term instrumental precursor, recorded as an inflation of the edifice which lasted 10 min before the eruption (Giudicepietro et al. 2020; see also LGS 2019a).
The record of the Skylineweb camera placed at 750 m a.s.l. (see Fig. 1 for location; https://www.youtube.com/watch?time_continue=9&v=nqgzMc46Ft0&feature=emb_logo) shows a significant increase in degassing from both the NE and SW crater areas, starting about 30 s prior to the explosion and also of rolling stones down the Sciara del Fuoco from the central-NE craters, probably related to a small effusion.
Analysis of selected images and videos from the many available on the web makes it possible to reconstruct several important aspects of the eruption (Figs. 3, 4, 5, 6 and 7). The early explosion expanded radially and already 1 s after the onset it reached elevations comparable with the Pizzo (Figs. 3 and 4), corresponding to a speed of ≥ 140 m s−1 (as the crater elevation is 780 m and that of Pizzo 918 m a.s.l.), in agreement with reconstructed radial distances reached in the first 2 s (Fig. 5) and indicating that the explosion was overpressured and occurred at/above the vent. The expanding bulb for the first 5 s had an aspect ratio < 1 (height/width) and was slightly asymmetric seaward likely due to the breaching of the SW crater, with visible fingers associated with large ballistics (Fig. 4). Afterwards a vertical jet started to rise (Fig. 3).

Spectacular photo taken from a sailing boat near Ginostra, a few seconds after the onset of the July 3 paroxysm. Note the finger jets driven by large westward directed ballistics, exiting radially from the lower spherical bulb and the vertical jet issuing from its top (photo courtesy of Saloua Rinauro). Comparison with the chronogram of Fig. 3 indicates that the photo was taken ca 7–8 s after the onset of the explosion

(a) Chronogram of the first 3 s of expansion of the July 3, 2019 paroxysm, redrawn from the recording of the Skyline webcamera (https://www.youtube.com/watch?v=DjUEkqUfq0g, last access 03 September, 2020). Red polygons indicate dm- to m-sized spatter clast fallout and their fall timing which crossed the view space of the videocamera between 7 and 14 s. The camera is located at 750 m a.s.l. whose location is given by the yellow S in (b), with an approximate view opening given by the two small yellow segments. The pre-paroxysm gas plume issuing from the NE crater was displaced by the expanding blast at 2 s. (b) Approximate reconstruction of the early radial expansion of the pyroclastic jet, based on (a), showing that in the first second the jet expanded at lateral velocity well above 100 m s−1, likely >140–150 m s−1, later decreasing; red dots indicate the area of dm- to m-sized spatter clast fallout and their fall timing which crossed the view space of the videocamera between 7 and 14 s; coloured lines on topography are 3D projections of circles of increasing radius from vent (red star) of 100, 200, 300, 400 and 500 m. Base images for both (a) and (b) are from Google Earth Pro (V. 7.3.3.7786 [7/7/2019] Stromboli 38°47′33.89″N, 15°12′46.75″E, European Space Imaging 2020. http://www.earth.google.com [August 19, 2020]). The central crater between the SW and NE craters is not indicated

Comparison of the maximum column height from scaled photos taken from Panarea island on (a) July 3 from https://gsud.cdn-immedia.net/2019/07/D-j4VU4W4AARNEw-379x505.jpg, last access 03 September, 2020)(photo taken from a sailboat just south of Basiluzzo islet at ca 16 km from Stromboli) and (b) August 28 (frame at minute 2 of a video courtesy of Natale Giunta, taken from Panarea harbour located at 20 km from Stromboli, also available at https://www.facebook.com/watch/?v=414890392565888, last access 03 September, 2020). Photos do not represent equivalent times relative to eruption onset, but their maximum plume heights

Chronogram of the two pyroclastic flows formed on August 28 along the Sciara del Fuoco, redrawn from frames of video available at https://www.youtube.com/watch?v=RPKgS3sPP1Y (last access 03 September, 2020). Volcano edifice image taken from Google Earth Pro V. 7.3.3.7786 (7/7/2019) Stromboli 38°47′33.89″N, 15°12′46.75″E, European Space Imaging 2020. http://www.earth.google.com [August 19, 2020]
A rain of ballistics started on the upper part of the Sciara del Fuoco, and the visual record of the Skylineweb camera placed at 750 m a.s.l. shows the fall of dm-sized incandescent spatter slabs directly ahead of the camera, starting 7 s after the explosion and lasting for at least 7 s (Fig. 5). The largest (m-sized) ballistics can be tracked as fingers departing westward from the expanding bulb with a large range of exit angles and reaching the sea between 20 and 30 s after eruption onset (Figs. 3 and 4).
At the same time, from the radially expanding jet along the Sciara del Fuoco, a first clearly visible head of a pyroclastic flow formed between 12 and 14 s after the beginning of the eruption at roughly two thirds of its elevation (ca 500 m a.s.l.; Fig. 3). At 18 s, a second pyroclastic flow appeared on the upper part of the Sciara del Fuoco from the central crater area. At 30 s, the pyroclastic flow reached the sea (Fig. 3). At 38 s, a second pyroclastic flow reached the sea (Fig. 3), while the first pyroclastic flow rapidly inflated its head as it travelled over the sea (Fig. 3). The average velocity down the volcano slope is estimated at ca 50 m s−1 (Table 1). Significant amounts of floating pumice from both the pyroclastic flows and direct fall into the water formed pumice rafts at the sea surface all around the island (Fig. S1i in Supplementary material).
The eruptive column rose quite vertically and cylindrically, reaching 1 km above the vent in 10 s (Figs. 2 and 3), i.e. at an average rise speed of 100 m s−1. Convective uprise started immediately above developing a classic mushroom shape (Fig. 2d). The umbrella cloud reached a maximum elevation estimated at around 8.4 km (Fig. 6), spreading towards the SW. The ash cloud that had detached from the pyroclastic flows rose and progressively merged with the convective ascending cloud.
Witnesses interviewed at Ginostra village describe the fallout lasting about 35–45 min ending with a rain of wet ash (see Fig.S1j in supplementary material), likely from the pyroclastic flow ash cloud. By contrast we witnessed no fallout at Stromboli village on the northern side of the island.
During the evening of July 3, the authors witnessed the effusion of a small and poorly fed lava flow from the NE and Central crater area down the Sciara del Fuoco, which quickly broke up into a rolling, incandescent autobreccia as it travelled down to the sea.
The day after, three small, steaming brown deltas could be seen at the base of the Sciara del Fuoco corresponding to the sites where pyroclastic flows had entered into the sea, likely representing their deposits (Fig. S1k in supplementary material).
Photos taken by INGV personnel from a helicopter on July 5 (courtesy of S. Branca), as well as a satellite image taken on the July 7 (Google Earth Pro V. 7.3.3.7786 (7/7/2019) Stromboli 38°47′33.89″N, 15°12′46.75″E, European Space Imaging 2020. http://www.earth.google.com [August 19, 2020]), show that the crater rim of the SW and central crater areas had been deeply modified as a consequence of the July 3 explosion, being destroyed and lowered by tens of metres in the Sciara del Fuoco direction (westward), suggesting a control on the directionality of the explosion. These images also show that spatter clasts formed a continuous cover at the summit especially towards the west-southwest (Fig. 9), while these became scattered towards the NE, just below the Pizzo along the ascent track. Incandescent slides (glowing avalanches; Fig. 2d) formed from the welded to incipiently welded spatter covered the summit, one of which was very elongated along the Rina Grande and was related to the bushfires triggered downslope (Fig. 9).
Period between July 3 and August 28
The authors remained on the island until July 8. The activity after the paroxysm was dominated by very high intensity Strombolian eruptions, with a frequency of explosions of several tens per hour, and very high fountains that could also be seen from Stromboli village, which can only happen when fountains exceed ca. 300 m in elevation. Explosions were commonly heard from Stromboli village, including shaking of the ground and acoustic pressure waves (on the island, these are often evidenced by the slamming of doors and windows). Frequent ash fallout on Ficogrande and Piscità was reported, especially during the first 10 days of August.
The onset of effusive activity from the SW-central crater area was witnessed by the authors on the evening of July 8, which then lasted almost continuously until the August 28 paroxysm (see reports on lgs.geo.unifi.it). However, during this time-span, the lava effusion rarely reached the lower part of the slope and the sea, since it was poorly fed and constantly broken by autobrecciation processes that produced rolling and accumulation of lava debris at the base of the Sciara del Fuoco, completely burying the deposits of the July 3 pyroclastic flows.
The Regional Civil Protection prohibited people from climbing the volcano above 400 m in elevation, as well as sea navigation beneath the Sciara immediately after the July 3 paroxysm (DRPC 2019). The alert level was raised to yellow and remained so for the entire period preceding and including the following paroxysm on August 28.
The August 28 paroxysm
On August 28 at 10:17 UTC, a second paroxysm occurred from the summit crater area (Giudicepietro et al. 2020), producing a buoyant column ca 6.4 km in height (Fig. 6) and directional pyroclastic flows down the Sciara del Fuoco (Fig. 7; Table 1). Like for the July 3 event, the explosion was preceded by a short-term, 7.5 min inflation of the edifice (Giudicepietro et al. 2020).
Phenomena associated with the paroxysm were rather similar to those described for the July 3 event. Analysis of photos and videos available on the Internet shows that the first jet was fairly vertical from the start, with an aspect ratio (height/width) > 1 and rapidly increasing, and therefore different to the initial radial expansion shown by the July 3 explosion. Two pyroclastic flows formed in rapid succession down the Sciara del Fuoco from the central crater, which moved rapidly downslope at an average speed of 50 m s−1 before reaching the sea (Fig. 7), where both the change in slope, the rapid sedimentation and the interaction with the water induced the inflation of the head and a deceleration. Images and videos show that the pyroclastic flows spread over the sea surface for more than 500 m before the associated ash cloud fully detached and lofted (see https://www.youtube.com/watch?v=RPKgS3sPP1Y).
A small tsunami was induced by the entrance of the pyroclastic flows into water (LGS 2019b).
Incandescent ballistics landed as low as 400 m a.s.l. towards Stromboli village and caused bush fires all around the island. The distribution of ballistics reconstructed from available photos and videos is less asymmetric compared to that of July 3 (cf. Figs. 9 and 13). The plume spread towards the N-NE. Stromboli village and all the northern sector of the island were affected by pumice lapilli and ash fallout, which lasted 33 min according to an eyewitness, A. Esposito from INGV (personal comm.).
According to the surveillance bulletin, the August 28 eruption was less energetic with respect to the July 3 event (LGS 2019b).
Period after August 28 paroxysm
After the paroxysm, the intensity of the Strombolian explosive activity remained very high until August 29, when a major explosion occurred (LGS 2019c). On August 30, a lava flow reached the sea.
The authors visited the island and the summit between September 4 and 8. The activity was Strombolian, with type 1 and type 2 explosions from the NE crater area and the almost unified central-SW area, in which a new scoria cone had formed.
The Civil Protection raised the alert level to orange on August 31 (http://www.protezionecivile.gov.it/media-comunicazione/comunicati-stampa/-/content-view/view/1125496, last access 03 September, 2020) and returned it to yellow on November 7, 2019 (http://www.protezionecivile.gov.it/attivita-rischi/rischio-vulcanico/vulcani-italia/stromboli/videoconferenze-su-stato-di-attivita-e-livelli-di-allerta, last access 03 September, 2020).
Field data
Juvenile types, petrographic and chemical features
Juvenile clasts from both the July 3 and August 28 paroxysms are of two distinct types: black/dark porphyritic scoriae and olive-brown (golden) aphyric pumice (Figs. 8 and 10), similar to those commonly erupted over the past few centuries, and known as HP (highly porphyritic) and LP (low porphyritic) products, respectively. They are shoshonitic basalt to HK basalt in composition (Bertagnini et al. 2008).

Some examples of juvenile clasts of the July 3, 2019, basaltic Vulcanian eruption at Stromboli: (a) twisted HP scoria bomb; (b) inflated HP scoria bomb; (c) LP inflated pumice bomb; (d) highly vesicular interior of LP bomb; (e) mingled LP pumice and HP scoria bomb (at the top of the sample); (f) mingled LP and HP bomb, with almost equal proportions. Note that LP bombs are very fragile and are usually broken into angular clasts on impact, whereas HP scoria are not
Analysed HP scoriae show no or little petrographic difference to products erupted during ordinary Strombolian activity. The coexistence of HP scoriae and LP pumices is the distinctive field characteristic of the deposits from paroxysmal activity (Bertagnini et al. 2011) and is identified for both the July 3 and August 28 events, whereas the major eruption of June 25 erupted only HP material.
HP scoria samples show highly porphyritic, seriate textures (40–60 vol% of pheno- and micro-phenocrysts) with a microcrystalline groundmass. The mineral assemblage is almost identical in all samples and consists of plagioclase as the most abundant phase (20–40 vol%), clinopyroxene (10–15 vol%) and olivine (≤ 10 vol%) phenocrysts, associated with plagioclase micro-phenocrysts and microlite-bearing glassy groundmass. Glomeroporphyritic aggregates up to 5–6 mm in diameter are rather common.
Lithological-textural features of HP scoriae are quite variable especially considering vesicularity and shape of the clasts, ranging from poorly vesiculated (or microvesiculated) to extremely vesiculated, with an aspect close to slag from a foundry; bombs are frequently flattened (spatter) to spindle/fusiform and exhibit cauliflower textures, sometimes internally inflated and with breadcrust features (Fig. 8a, c).
LP pumice samples exhibit weakly porphyritic seriate textures (3–10 vol% of phenocrysts, typically 5–6 vol%) with a glassy groundmass. Phenocrysts are largely represented by plagioclase. Of note, LP pumices from the 28 August paroxysm show rather frequently the presence of mm-sized clinopyroxene phenocrysts. These crystals are usually considered to be xenocrysts (Bertagnini et al. 2008).
Lithological-textural features of LP pumice show (Fig. 8b, d) the following: (a) bombs with external golden surface and a black lustre inside, with large coalescent bubbles; (b) extremely vesiculated bombs characterized by a single large internal cavity; (c) highly vesicular tube-like clasts; and (d) platy and externally golden, microvesiculated clasts.
An intermediate juvenile type is present in the deposits of the two paroxysms, made of variably mingled HP and LP magma types (Fig. 8e). The scale of mingling appears finer in the August 28 juveniles, where mm- and sub-mm LP and HP domains are mixed together with twisted to stretched shapes.
HP scoria has been found coating ballistic lava blocks (Fig. 8f).
July 3 paroxysm
Size and distribution of fallout deposits
Figure 9 summarizes the distribution of fallout deposits collected in the field, together with data from available photographic material described previously. Ballistic spatter clasts form a continuous cover at the summit which is asymmetric towards the Fossetta area (Fig. 10a, c). The total area of cover is about 0.35 km2. The maximum equivalent diameter of the measured spatter is 200 cm in the Fossetta area (Fig. 9), where the cover is commonly made up of the superposition and welding of two to four large spatter clasts showing an internal stratigraphy made up of predominantly HP spatter at the base and LP spatter at the top (Fig. 10d, e). HP spatter is the largest in size and constitutes the greater part of the continuous cover, qualitatively 2/3 of the total, with LP spatter scattered between or atop HP spatter clasts (Fig. 10b, d and S1n in Supplementary material S1). The total thickness of the continuous spatter cover is rather uniform, from 30 to 40 cm, and only thickens where the steep slopes allowed for rheomorphic downslope flowage (Fig. 10f). Large ballistic lava blocks litter the summit region in association with spatter clasts. Their maximum dimension reaches the equivalent diameter of 171.7 cm in the Fossetta area, where some are coated with HP scoria and some are shattered and form large impact craters (Fig. 10c). A visual evaluation of their average occurrence suggests that they constitute 1–5% of the deposit (Fig. 10c). The spatter and block cover becomes discontinuous at distances of 500 m from the vent in the SW direction (Fossetta area) and 350 m in the NE direction, where, at the 850 m a.s.l. helipad (Fig. S1n in Supplementary material), the maximum spatter diameter is still 107.7 cm, rapidly decreasing to 18.7 cm along the final section of the climb track to the summit. Taking into account the ca 0.35 km2 area of continuous cover and a uniform thickness of 30 cm, the total volume is 0.01 km3, which, for the average density value of the most frequent HP spatter (Table S2) gives a mass in the order of 1.4 × 10⁸ kg, which, even though it does not account for the pumice fallout and the pyroclastic flow deposits, is comparable to the order of magnitude erupted in the 2003 event (Pistolesi et al. 2008).

Isopleth of maximum size and distribution map of the July 3 deposits. Volcano edifice image taken from Google Earth Pro V. 7.3.3.7786 (7/7/2019) Stromboli 38°47′33.89″N, 15°12′46.75″E, European Space Imaging 2020. http://www.earth.google.com [August 19, 2020]. Legend: (1) crater; (2) thickness of the total spatter cover (values in cm); (3) spatter size and isopleth (values in cm); (4) lava block size (values in cm); (5) HP and LP bomb size and isopleth (values in cm); (6) pumice lapilli size and isopleth (values in cm); (7) limit of total spatter cover; (8) glowing avalanche detachment and deposit; (9) limit of visible ballistics offshore; (10) limit of visible ballistics on-shore; (11) directions of incandescent rolling stones

Main features of the continuous spatter and lava block cover at the summit of Stromboli, related to the July 3 2019 eruption: (a) extension of the continuous cover on Il Pizzo delimited by the yellow line; the craters are to the left; note the large HP spatter in the foreground; (b) large lava ballistic block in the Fossetta area, coated by HP scoria; note the abundant presence of ballistic lava blocks scattered in the continuous spatter cover; (c) typical appearance of the spatter cover made by the superposition of two to four spatter clasts, with HP types at the base, just south of Pizzo area; (d) superposition of HP and LP spatter in the Fossetta area; (e, f) small scale rheomorphic avalanche deposits of HP spatter which drain back towards the Fossetta area from the steep slopes of the Vancori ridge (see Fig. 1 for location)
Ballistic bombs were collected below 250 m a.s.l. in the southern sector of the island and below 500 m a.s.l. in the northern sector. These are made of variably vesicular juvenile material, ranging from highly vesicular LP pumice, to moderately vesicular LP and variably mingled HP clasts. Their maximum clast size (expressed as an average of the three maximum diameters) collected is 27 cm in diameter at the Punta dei Corvi locality and at similar elevations just to south (Fig. 9 and Fig. S1l in Supplementary material). Shapes are generally subspherical to ellipsoidal and/or twisted (Fig. 8), although the LP pumice in particular was frequently observed to have been broken into smaller angular pieces on landing, around poorly defined impact craters (Fig. 8d). By contrast, denser HP bombs always preserved their shape (Fig. 8a) and in places could be linked to their impact craters. Lava blocks shattered and coated with HP scoria, up to 37.3 cm in equivalent diameter, have been also found near Ginostra up to 1.4 km in a WSW direction from the crater area (Fig. S1l in Supplementary material), indicating a clear southwesterly asymmetry of ballistic block distribution. The isopleths of both ballistic spatter and bombs are also asymmetrical with a westerly dispersal axis, in agreement with observations of the geometry of the jet and of ballistics falling offshore, described in the previous section. Reconstruction of the elevation of ballistic landings from the analysis of photos available on the Internet matches the reconstructed geometry of the isopleths in Fig. 9.
A continuous and measurable lapilli fallout deposit was restricted to the surroundings of Ginostra village, at elevations < 250 m a.s.l., where the deposit was well preserved on the roofs of houses, on the harbour pier, roads and other flat surfaces (Figs. S1i,j in Supplementary material). This fall deposit is dominated by frothy and olive-brown, angular LP pumice lapilli, subordinate HP dark scoria lapilli, minor lava accidental lithics and coarse ash. The maximum measured thicknesses of the pumice lapilli fall was 1.5 cm, i.e. more or less the diameter of a single clast.
Isopleths of the pumice lapilli fall deposit, though relatively poorly constrained by the actual distribution of the deposit, show a SW dispersal axis, which is different to that from the ballistic dispersal. Ginostra village appears therefore to have been affected by two distinct components of fallout: (i) the scattered ballistic bombs and (ii) the continuous lapilli fall. The northern part of the island was not affected by the lapilli fall.
Measured densities of the pumice LP components range from 500 to 700 kg m−3. The density of the scoria HP components ranges from 900 to 1500 kg m−3 (Table S4 in supplementary material). Based on a Dense Rock Equivalent density of 2850 kg m−3 (Pistolesi et al. 2008), the vesicularity ranges from 0.82 and 0.75 for the LP pumice and from 0.68 and 0.47 for the HP scoria.
Grain size distribution of analysed samples is bimodal, with the mode of the coarser Gaussian population between 2 and 8 mm in diameter (see supplementary material S3a,b for locations and Table S4 for data). The fine-grained population increases southwards (GIN7). Median (MdΦ) and sorting (σv) parameters derived from the cumulative plot of grain size distribution conform to fall deposition (Figs. 11a, c). Considering the limitations due to available outcrop area, the total grain size distribution, calculated by averaging the results of each sample, clearly shows the bimodal distribution with a coarse main mode at 4 mm related to a rather platykurtic distribution, and a secondary mode at 0.125 mm (Fig. 12a). It must be noted that sampling limitations may also affect the shape of the reconstructed distribution (Costa et al. 2016; Pioli et al. 2019). However, the presence of a fine ash tail mode is consistent with our observation of a late rain of ash over Ginostra, likely the result of deposition from the wet co-pdc ash cloud.

Cumulative weight % versus grain size for the (a) July 3 and (b) August 28 pumice fall deposits; dotted lines indicate the 16th, 50th and 84th percentiles; (c) Plot of Median (MdΦ) versus standard deviation (σv) for both the July 3 and August 28 deposits. Values are typical of fall deposits (Walker 1971) and the July 3 deposits are on average coarser and less well sorted than those of the August 28. Dotted lines enclose the field in which 99% of known fall deposits are plotted, whereas the dotted-dashed line encloses 92% of them

Total grain size distributions as (a) histogram and (b) cumulative distribution, for both the July 3 and August 28 deposits
August 28 paroxysm
Size and distribution of fallout deposits
Figure 13 summarizes the distribution of fallout deposits collected in the field combined with data from available photographic material described above. Ballistic clasts at the summit that can be clearly identified as being associated with the August 28 paroxysm appear mainly to be blocks of accidental lava lithics. The criteria used in the field to distinguish blocks emplaced on August 28 were the presence of associated impact craters producing brittle deformation in the underlying continuous spatter cover from July 3. It proved to be more difficult to identify spatter clasts which could be associated with certainty with the August 28 explosion, probably due to the fact that there were very few. Scattered bombs that show a quenched crust also at the base resting on the welded spatter from July 3 have tentatively been attributed to August 28. The scarcity of pyroclasts and ballistics from August 28 in the summit area is consistent with the observed dominantly vertical geometry of the explosive jet. The maximum lava block diameter (expressed as the average of the three maximum diameters of the clast) measured is 86 cm near the summit, decreasing to 23 cm at the 850 m a.s.l. helipad.

Isopleth of maximum size and distribution map of the August 28 deposits (values in cm). Volcano edifice image taken from Google Earth Pro V. 7.3.3.7786 (7/7/2019) Stromboli 38°47′33.89″N, 15°12′46.75″E, European Space Imaging 2020. http://www.earth.google.com [August 19, 2020]
Along the northern flank of the volcano, at elevations lower than 500 m a.s.l., ballistic bombs were made of variably vesicular juvenile material, ranging from highly vesicular LP pumice, to moderately vesicular LP and variably mingled HP clasts (Fig. S1q in Supplementary material). Shapes are generally subspherical to ellipsoidal and/or twisted. Some bombs larger than 15 cm were still incandescent when they landed and were able to start bushfires as low as 400 m a.s.l.
The isopleths of the ballistics, although poorly constrained in the southerly direction, appear asymmetrical with a northerly dispersal axis, in agreement with the reconstruction of the elevation of ballistic landings from the analysis of photos available on the Internet (Fig. 13).
A continuous and observable lapilli and ash fallout deposit was restricted to the northern slope of the volcano at elevations < 300 m a.s.l., covering Stromboli town, where the deposit was well preserved on roofs of houses, roads and other flat surfaces. At higher elevations, no continuous lapilli fall cover was identified. The componentry of the fall deposit is very similar to that erupted on July 3, composed of frothy and olive-brown, angular LP pumice, subordinate HP dark scoria and minor lava accidental lithics. The ratio of LP/HP component decreases northwards. The measured thickness of the pumice fall is ca 2 mm near Stromboli harbour, decreasing westwards.
Isopleths of the pumice lapilli fall deposit, though relatively poorly constrained by the actual distribution of the deposit, show a NE dispersal axis, which is different to the ballistic dispersal.
The deposit distribution along the northern slope of the volcano, similar to that observed along the southern slopes for the July 3 deposit distribution, shows distinct components of fallout, well described in a diagram of maximum size versus distance, where distinct segments can be identified related to (Fig. 14): (i) the proximal region of scattered blocks and bombs which outcrop in the proximal areas to a distance of ca 1600–1700 m from vent and (ii) the distal continuous cover of lapilli fall which outcrop farther than 1700 m from vent. Note that, taking into account the uncertainties related to the limited number of data available, the proximal region may be further subdivided into proximal and medial regions based on the slope of the enclosing segments (Fig. 14). This way it is possible to recognize the region of ballistic landing (proximal) from that related to the fallout of pumice lapilli from the buoyant plume (distal) and a possible intermediate region (medial). The southern part of the island was not affected by the lapilli fall.

Plot of maximum diameter versus distance for the August 28 deposits; the black dashed line shows the two segments associated with scattered ballistics and continuous pumice lapilli cover respectively; the grey-dotted line is to indicate the possible existence of proximal and distal subsets within the ballistics
Median (MdΦ) and sorting (σv) parameters derived from the cumulative plot of grain size distribution (see S3b in Supplementary material for locations and Table S4 for data) conform with fall deposition (Fig. 11c). The total grain size distribution is bimodal, with the coarse main mode at 0.5 mm and a normal Gaussian distribution (Fig. 12a). The fine-grained population is made of fine ash (≤ 0.063 mm). Also in this case, it must be taken into account that the shape of the reconstructed distribution may in part be affected by sampling limitations (Costa et al. 2016; Pioli et al. 2019).
Eruption parameters
Exit velocities
The ballistic clasts used for modelling exit velocities are those surveyed and measured along the volcano flank, for which distance reached and density of the clast are well defined. While exact landing time is not known, direct observations, witness accounts and comparison with available photo and video material online indicate that the rain of ballistics started a few seconds after the eruption and lasted in the order of some tens of seconds. In particular the video recording of the Skyline webcam on July 3 allows the landing time of spatter slabs at distances of less than 600 m from vent to be constrained (i.e. the distance of the videocamera, Fig. 5) from 7 to 14 s after the onset of the eruption and shows that the shape of spatter was rather flat already during flight (Fig. 5). Figure 3 provides a rough estimate of the timing of entrance of ballistics into the sea of between 20 and 25 s, associated with the ballistic fingers observed in Figs. 3 and 4, although the distance reached offshore cannot be retrieved. For the purpose of modelling, the ballistics ejected on July 3 provide the best input data as the range of exit angles can be derived from available images (Fig. 4), landing distances on the island and measured clast density (Table S4 in supplementary material), and in agreement with literature (Apuani et al. 2005). The range of exit velocities reported in Table 1 refers to values that cover the spectrum of observed clast diameters and distribution (Table S6 in supplementary material). Results are conservative in that we selected the most favourable exit angles and spherical shapes, which are appropriate for HP and LP bombs, although for spatter clasts low cube shapes probably better describe the real geometry, whereas high cubes should be used for lava blocks. We did not define a proximal reduced drag region, although Fig. 3 shows that ballistics exit from the initial expanding bulb 3 s after explosion, forming clearly visible fingers. Ambient conditions were set at 25 °C at sea level and no wind, as for the day of the eruption. The best results for the July 3 explosion show asymmetric exit velocities with the highest values for ballistic bombs close to the southwest rim of the Sciara (GIN3), in agreement with direct observations. Exit velocities range between 160 and 120 m s−1 for HP and LP juvenile bombs, while spatter clasts on the summit indicate values around 100 m s−1 for spherical shapes and 120 m s−1 if we use a more appropriate low cube shape (Table S6 in supplementary material). Similar values of exit velocities comprised between 110 and 120 m s−1 are obtained for m-sized lava clasts (i.e. the likely nature and size of ballistics associated with fingers of Fig. 4) and landing offshore (i.e. at horizontal distances > 1300 m from vent, which is the horizontal distance of the coastline from the vent) between 20 and 25 s after ejection, as gathered from the video redrawn in Fig. 3.
Exit velocities for the lava blocks ejected on August 28 provide exit velocities of around 90 m s−1, while HP bombs in the order of 130 m s−1 (Table S6 in supplementary material).
Modelling of ballistic trajectories for HP and LP bombs smaller than 10 cm in diameter depart from the parabolic curve, and once they have reached the maximum altitude, they fall back at angles which become progressively higher the smaller the clast size. For these clasts, which characterize the medial region in Fig. 14), at horizontal distances greater than 1300 m from vent, exit velocities need to be unreasonably high to justify the landing distance, so we infer that they probably represent clasts that had been partly entrained in the rising convective region of the plume, rather than pure ballistics.
Ballistic exit velocities (Uejecta) can then be used to calculate the gas exit velocity (Ugas), using the equation of Steinberg and Babenko (1978):
where g is the acceleration of gravity, D is the diameter of the ballistic, CD is the drag coefficient and ρ is the density of ejecta and gas, respectively. Within the approximations and limitations of our calculations, we set the drag coefficient to 1. Using the range of clast sizes, densities and calculated exit velocities, and the value of 6.7 kg m−3 for the gas density calculated by Ripepe and Harris (2008) for the April 2003 paroxysm as a very close and reasonable approximation for the July 3, 2019, event, gas exit velocities appear to be asymmetric with maximum values of > 200 m s−1 seawards, decreasing to 135 m s−1 inland, which appears to be in good agreement with estimates from video recordings (Fig. 5) and the asymmetric expansion of the rising plume as observed in the visual record (Figs. 3 and 4). Gas exit velocities for the August 28 explosion are between 120 and 150 m s−1.
Mass eruption rate
As shown in Fig. 6, the plumes of the July 3 and the August 28 eruptions reached estimated heights of 8.4 and 6.4 km, respectively, taking into account the uncertainties and errors of the measure. According to Mastin et al. (2009), the mass eruption rate can be retrieved from the maximum height of the eruption plume with the equation:
where H is the plume height in km and Ṿ is the DRE volumetric eruption rate in m3 s−1. This equation proposed by Mastin et al. (2009) also accounts at the lower end for transient plumes such as the March 8, 2005, Vulcanian eruption at Mt St Helens (Scott et al. 2008). By applying Eq. 2 to the July 3 event, Ṿ = 385 m3 s−1, which, for a D.R.E. density of the magma of 2850 kg m−3 indicates a MER of 1.1 × 10⁶ kg s−1. For the 28 August event, the calculated Ṿ = 125 m3 s−1, and the MER = 3.6 × 10⁵ kg s−1.
A confirmation of the above estimates can be obtained from the areas of isopleths of Figs. 9 and 13. In both cases, isopleths are only reasonably well defined in limited sectors of the volcano and lack offshore data. Isopachs for August 28 are best constrained and more widely reconstructed along the northern lower slopes of the volcano. Taking into consideration the vent location, the reconstructed dispersal axis to the ENE, and the absence of pumice fall deposits on the southern slopes, we approximate the area of the 4-cm isopleth at ca 4 km2, that of the 2 cm at 6 km2 and that of the 1.5 cm at 9.5 km2 (see S3b in supplementary material). Based on these data, and allowing for the large uncertainties related to the available dataset, comparison with the calculations of Carey and Sparks (1986) suggests a plume height of ca. 5 km would fit the isopleth areas for pumice densities comprised between 500 and 1000 kg m−3 (Table 1). We are aware that the Carey and Sparks (1986) calculations are valid for sustained plumes, but we note that short-lived transient events evolve in lower plumes for a given MER so we believe that the results are conservative and valid if used just for comparison with the independently calculated estimates based on the observed plume height.
It must be noted that the calculated MER are certainly underestimated as the height of the plume was affected by the simultaneous collapse of a significant part of the erupted material that fed the pyroclastic flow along the Sciara, therefore reducing at source the effective MER feeding the plume (Trolese et al. 2019) for at least the first two and a half minutes of the eruption.
Discussion
Summary of the main characteristics of the summer 2019 Stromboli eruptive period
The 2019 summer eruptive period at Stromboli involved different phases: (i) the progressive rise of the intensity and frequency of the ordinary Strombolian activity during the second half of June, with a major explosion occurring on June 25; (ii) an unexpected (no monitored precursor except very short-term ground deformation) paroxysm occurring on July 3; (iii) a period of intermittent effusive and high intensity Strombolian activity from July 8 to August 28; (iv) a second paroxysm on August 28; and (v) a major explosion and effusive activity on August 29–30.
The presence of LP magma (olive-brown or golden pumice) in both paroxysms indicates, as known for all other paroxysms, that the trigger for the explosions was the fast rise and decompression of a deep-seated (ca. 10 km) LP magma batch able to displace (and partly mingle with) the resident, largely degassed and crystallized, stiffer HP magma (dark-brown scoria), and degas volatiles mostly as a closed system, preventing decoupling of bubbles from magma until fragmentation (Bertagnini et al. 2011).
The short-term inflation of the edifice detected by geophysical data (Giudicepietro et al. 2020) can be interpreted as reflecting the rapid build-up in pressure due to the LP magma being temporarily slowed and accumulating at shallow levels during its final rise to the surface by the presence in the upper conduit of the more viscous and less mobile HP magma. This pressure build-up continued up to a threshold at which the HP plug could be displaced, leading to the explosive phase. Textural features of erupted juvenile and mingling of LP and HP magma indicate that a turbulent mixing of LP and HP magmas occurred with the sudden degassing and limited crystallization of the LP melt (cf Métrich et al. 2005, 2010, Pioli et al. 2014). The interaction of LP magma with HP magma within the conduits plays a crucial role in the eruptive dynamics, although this process is still not fully understood.
Within this general scheme, we note that the July 3 explosion produced a significant flaring of the SW crater (lowered by almost 70 m in the Sciara del Fuoco and Ginostra direction) and an initial almost radial expansion of the jet, suggesting that the volatile overpressure was released almost instantaneously very close to vent, where fragmentation also likely occurred (cf < 150 m fragmentation depth inferred by Ripepe and Harris 2008 for the April 5, 2003, paroxysm). In contrast, the August 28 explosion, though feeding an eruptive column and pyroclastic flows very similar to the July 3 event, generated a mostly vertical jet (Table 1), suggesting a (slightly) less overpressured jet.
The difference between the July 3 and August 28 explosions may be explained taking into consideration that they issued from different crater areas, the SW and the Central crater, respectively. According to the geophysical reconstruction of the shallow conduit geometry by Chouet et al. (2008), the conduit geometry below the SW crater is irregular, which is thought to enhance the pattern of fluid motion and pressurization (Chouet et al. 2008), which may have resulted in the LP magma acting as a piston-like gas slug. The LP magma on August 28 may instead have risen up a different conduit geometry, resulting in a (slightly) different mechanism of degassing and fragmentation. Interestingly, the grain size distribution of the 28 August fall deposits is finer grained and better sorted than the July 3 fall deposits, which may relate to a more efficient and (slightly) deeper level of fragmentation.
The trigger for the fast rise of the LP magma remains the main question to be answered. Existing literature have proposed both a top-down trigger associated with decompression of the deep plumbing system induced by effusive withdrawal of magma from the shallow system (e.g. the 5 April, 2003, and the 15 March, 2007, Calvari et al. 2011) and a bottom-up trigger, i.e. the fast rise of LP magma independent of the shallow conditions (Métrich et al. 2005). The bottom-up trigger appears to be the best interpretation for the July 3 event and possibly also for the 28 August paroxysm, although in this latter case, the prolonged intense explosive and intermittent effusive eruption preceding the event may have caused feedback processes between the shallow and the deep sections of the plumbing systems. In any case, we must acknowledge that current scientific understanding of how the volcano works and the monitored geophysical and geochemical parameters are not yet able to capture changes that may be considered as precursors to paroxysms more than a few minutes in advance. We stress therefore that at open (or near open) conduit systems, where gas and mass fluxes are largely decoupled and shallow phenomena overwhelm deep dynamics in terms of monitored observables, innovative research should focus on imaging the real-time evolution of the deep plumbing system.
Plume dynamics
The July 3 and August 28 paroxysms at Stromboli had very similar physical characteristics in terms of mass eruption rates (1.1 × 10⁶ kg s−1 and 3.6 × 10⁵ kg s−1, respectively) and related phenomena (Table 1). Observations indicate that explosions started as blasts, with an impulsive character and were short lived. They fed weak buoyant columns up to 8.4 km and 6.4 km high, respectively, which drifted away in the weak summer winds. Short-lived, directional pyroclastic flows issued directly from the lateral spreading of an initial jet in the direction of the Sciara suggests a morphologic control on the generation of the flows, likely due to the breaching and lower elevation of the crater rim in that direction.
Pyroclastic fall material forms very thin deposits, and the interpretation of their distribution may give insights into the plume dynamics (e.g. Houghton et al. 2017). The maximum measured thickness is 40 cm of welded spatter at the summit for the July 3 event (Fig. 1). The continuous spatter cover of the July 3 event in the proximal area covers a few hundreds of metres in radius. The abundance of ballistic lava blocks and their westerly directional distribution is consistent with the westerly breaching of the crater wall. The 28 August eruption did not even form a continuous cover in the summit area. The medial area, comprised between the proximal summit region and a distance of ca. 1600–1700 m from vent, is in both events characterized by deposition of only scattered ballistic clasts (lava blocks, spatter, HP and LP bombs) rapidly declining in size from over 1 m to less than 10 cm (Figs. 9, 13 and 14). Beyond this, the deposits became continuous and are composed predominantly of LP pumice lapilli. The dispersal axes of the ballistics were different in both paroxysms from that of the continuous pumice lapilli fall deposits. In terms of duration, the ballistic fallout as reconstructed from available photos and videos lasted only the very early part of the explosions (tens of seconds), while the pumice lapilli fallout lasted in both paroxysms more than 30 min (Table 1). We interpret the different dispersal patterns, duration, grain size and componentry of the ballistic versus continuous fallout deposits in terms of plume dynamics (Fig. 15). According to Walker et al. (1971), ballistic lava blocks with densities of 2500 kg m−3 in the order of 1 m as observed at Stromboli have terminal fall velocities of ca. 110 m s−1. Clasts with densities of 1250 kg m−3, similar to spatter clasts, larger than 1 m have terminal fall velocities of ca. 100 m s−1. This is in good agreement with reconstructed exit velocities, and we therefore interpret the m-sized lava ballistics and welded spatter deposits observed within 350–500 m of the vent (greater distance in the Sciara del Fuoco direction according to Fig. 4) as being related to direct ballistic fall from the thrust zone, during the early seconds of the blast (i.e. proximal region in Fig. 14). The chronogram of the July 3 plume ascent in Fig. 3 shows that the plume reaches ca 1 km above vent in ca. 10 s with an almost cylindrical shape, which we define as the maximum elevation of the thrust region with an average rise velocity of ca 100 m s−1 (Fig. 15). This is consistent with the initial Ugas calculated using Eq. 1 of up to > 200 m s−1, observed to slow down in a matter of seconds. Large eddies started to form after ca. 10 s at an elevation of ca. 1 km above the vent (Fig. 3), which is where we set the base of the convective region of the plume (Fig. 15), and extend for a few kilometres where the umbrella region started to spread. We interpret the lack of a continuous fall cover within 1.7 km from vent as due to overall upward velocities within the convective and umbrella plume regions, which were able to fully maintain all clasts in suspension, with a terminal fall velocity below that of the highest value of pumice fall isopleths in Figs. 9 and 13. In both cases, the continuous pumice fall has maximum clast diameters of 4–5 cm which, for measured densities of 500–700 kg m3, corresponds approximately to terminal fall velocities of 10–20 m s−1 (Walker et al. 1971). We hence estimate that the convective region had average upward velocities higher than 10–20 m s−1, and deposition started only below these values in the upper convective and/or in the umbrella region (Fig. 15). Possibly, the medial region indicated in Fig. 14 may reflect the fall of outsized clasts from the sides of the convective region along with (or instead of) pure ballistic trajectories (Fig. 15).

Interpretative model for the plume dynamics and depositional processes of the July 3 and August 28 paroxysms at Stromboli. Uav is the average upward velocity of the plume; Ufall is the terminal fall velocity of clasts
Definition of the paroxysms at Stromboli as (basaltic/mafic) Vulcanian in style
Based on all available information and data, we define the paroxysmal explosions at Stromboli as Vulcanian in style. However, we need to clarify why the term paroxysm at Stromboli is very poorly defined and difficult to fit within the current classification of eruptive styles (Walker 1973; Bonadonna et al. 2016). The term paroxysm has a strong local connotation since the work of Barberi et al. (1993), and most of the subsequent literature has kept this term, avoiding an attempt to place it into the consolidated classification and nomenclature for eruption styles (see Andronico and Pistolesi 2010).
Paroxysms at Stromboli have been described as “single violent Strombolian episodes” in Taddeucci et al. (2015). However, the same authors noted that the term paroxysm is poorly defined, ambiguous and difficult to reconcile with the classic violent Strombolian style, which refers specifically to prolonged cone building events (days to months), such as the early days of the 1943–1952 eruption at Paricutin in Mexico (Pioli et al. 2008), or the 2001 eruption at Mt Etna (Calvari and Pinkerton 2004), able to deposit extensive blankets of scoriaceous tephra fall away from the scoria cone. The violent Strombolian eruption style is characterized by intermittent but very closely spaced explosions (every few seconds) able to feed eruption plumes for days that may reach 10 km in height, which have been called micro-plinian at the upper scale of their intensity (Francis et al. 1990; Valentine and Connor 2015). In addition, no violent Strombolian eruptions are associated with pyroclastic flows.
Calvari et al. (2006) and D'Auria et al. (2006) proposed the term Vulcanian paroxysm for the 2003 event at Stromboli, as it occurred after the clogging of the vent for 3 months, causing the authors to suggest that the obstructed conduit allowed the creation of overpressure at its base, acting as the viscous plug/dome in the common Vulcanian style.
The 2019 paroxysms at Stromboli do not seem to fit easily into either the violent Strombolian or the classic Vulcanian style. They are not violent Strombolian because they are not prolonged, cone-building events. They are not classic Vulcanian because they occurred in open-conduit conditions of low viscosity magma.
We propose to allocate the 2019 eruption at Stromboli to the Vulcanian style because we believe that either these events really form a separate class of eruptions or they fit somewhere in the continuum of known eruption styles. Furthermore, their classification should be based on observables and not on the interpretation of genetic mechanisms. In this sense, paroxysms at Stromboli certainly do not fit the violent Strombolian style, to which they differ both in eruption dynamics and in deposit types. In contrast, paroxysms at Stromboli, including the July 3 and August 28, 2019, events, are Vulcanian in style because they are short-lived (few minutes), vent clearing, cannon-like blasts, associated with pyroclastic flows and phenomenologically identical to Vulcanian eruptions. The events share all the characteristics listed in Clarke et al. 2015 that characterize and distinguish Vulcanian eruptions from other styles: (i) transient behaviour, as the eruptions lasted a few minutes; (ii) supersonic regime which can be inferred from the strong audible shock waves associated with the initial blast and the typical mushroom shape of the columns just above the vent, characterized by a nearly vertical, rather than conical, stalk and a large vortex front (Fig. 2d); (iii) short-lived atmospheric plume lasting about half an hour and rapidly detaching and drifting away in the wind; (iv) relatively small magnitude, which although not fully computed in this work, is certainly the case, considering the mass estimate of the summit spatter and block cover at 1.4 × 10⁸ kg, the calculated MER and the short duration of the eruptions; (v) strong ballistic ejection both observed and measured in the field with abundant m-sized blocks in the proximal region; (vi) relatively fine ejecta as indicated by the grain size data; and (vii) low vesicularity pyroclasts within a variable range of vesicular pyroclasts, represented by the HP component, which is the early erupted product, later followed by the high vesicularity LP component.
Paroxysmal deposits, like Vulcanian ones, are very thin, with little potential of preservation in the rock record, apart from for the largest events (Bertagnini et al. 2011). These deposits form thin blankets dominated by variably vesicular ballistic juvenile spatter and lithic blocks around the summit area (only up to 40-cm thick for the 3 July 2019 event); farther away, the fallout deposits are composed of a maximum of a few centimetres of lapilli and ash, dominated by the more vesicular component. The fallout of the July 3 and August 28, 2019, events lasted about 35 min on the island, leaving a 1–2-cm-thick lapilli fall deposit on the ground. Furthermore, as in other studied Vulcanian eruptions (Formenti et al. 2003), the textures of juvenile clasts range from dense to highly vesicular, which is what we also observed among the clasts erupted by the two paroxysms. The former are the first to be discharged, whereas the latter are extracted in the subsequent phases of the eruption. Similarly, the internal stratigraphy of the summit spatter and block continuous cover shows that the denser HP spatter and scoria were erupted earlier and were followed by the highly vesicular LP spatter and pumice (Fig. 10b, e).
In addition, the 2019 paroxysm deposits would fit in the Vulcanian field of Walker (1973), although both F (fragmentation index: amount of ash < 1 mm at the isopach 0.1Tmax along the dispersal axis, where Tmax is the maximum thickness) and D (dispersal: area of the isopach at 0.01Tmax) are impossible to measure rigorously at Stromboli because it is a small island where only onshore deposits are preserved; indeed the dispersal of the isopach at 0.01 of Tmax, which would be about 4 mm for the July 3 paroxysm as Tmax is 40 cm, easily exceeds 100 km2 (equivalent to a circle of 5.7 km in radius), and our grain size data show that the amount of ash < 1 mm on the island, where the deposit thickness is a few centimetres, hence in the approximate range of 0.1Tmax, is certainly larger than 15–20% (cf plot of Vulcanian deposits on Walker’s diagram in Fig. 6.25 in Cas and Wright 1987).
Based on all of the above, we do not think that there is any ground to separate the paroxysmal style at Stromboli from the classic Vulcanian style, with which it shares all observational characteristics, deposit types and distribution.
Of course, we acknowledge that the genetic mechanism of paroxysms is different to what is described for classic Vulcanian explosions (Mercalli and Silvestri 1891; Self et al. 1979). Stromboli is an open conduit basaltic volcano, continuously erupting, where no highly viscous plug/dome exists within the conduit to justify the build-up of gas overpressure below it. In fact, paroxysms at Stromboli have occurred both during effusive phases (2003 and 2007 events, Calvari et al. 2006, 2011; and the 28 August 2019) and punctuating ordinary Strombolian activity (e.g. the 11 September 1930, Rittmann 1931, and the 3 July 2019).
However, whatever the trigger, paroxysms are the expression of very shallow and sudden release of overpressure within a relatively small magma batch undergoing closed degassing that mimics what happens in classic Vulcanian eruptions. We stress that the role of the shallow degassed and crystallized, viscous HP magma at Stromboli has been described by many authors to act as a weak plug (Cimarelli et al. 2010; Oppenheimer et al. 2020). In particular, the variable conduit geometry (see Chouet et al. 2008) may enhance the plug effect exerted by the almost stagnant and rather viscous HP magma (due to the abundant crystallization of plagioclase microliths, in particular) to the rise of the lower viscosity LP magma in terms of effective conduit radius, as suggested for the basaltic plinian 1886 Tarawera eruption (Houghton et al. 2004).
In this new framework, the edifice inflations that started 10 min before the July 3 eruption and 7.5 min before the August 28 eruption (Giudicepietro et al. 2020) may be interpreted as the progressive pressurization of the rising LP magma pushing upwards, and closed-degassing below the HP weak plug that filled the upper conduit, before reaching sufficiently high-pressure conditions to trigger the Vulcanian explosion.
We therefore suggest describing the paroxysms of low viscosity magmas which are impulsive, short-lived, vent blasting (and pyroclastic flow forming) events as Vulcanian in style, even when associated with open conduit mafic volcanoes.
In the same way that basaltic (or mafic) Plinian eruptions can now be specifically described (e.g. Walker et al. 1984; Coltelli et al. 1998; Costantini et al. 2009), the addition of “basaltic” (or “mafic”) to Vulcanian events would help clarify that the eruption style and deposit distribution are similar, even though the triggering and fragmentation mechanisms may vary from the classic high-viscosity counterparts of the same style. We therefore suggest dropping the generalized use of the term paroxysm (or paroxysmal eruption) to describe an eruption style at Stromboli. Instead paroxysm should be used qualitatively to refer to any climactic phase of eruption of any style, due to its lack of definition, ambiguity, local connotation and absence of any clear observational distinction from the Vulcanian style. As a consequence, we propose that the two 2019 paroxysms at Stromboli were basaltic Vulcanian in style and thus by inference all other preceding paroxysms.
Comparison of the 1930 and 2019 eruptions: a new eruptive scenario and implications for the alert level system
The largest eruption at Stromboli of the last few centuries occurred in 1930, for which there is an excellent description by Imbò (1928), Rittmann (1931) and Abbruzzese (1935). We summarize in Table 2 the main events and features of the 1930 events which show remarkable similarities with the 2019 summer events.
Despite the obvious differences in the amount and quality of observations between the 1930 and the 2019 events, the most striking similarities are as follows: (i) occurrence of two paroxysms (or as now suggested basaltic Vulcanian eruptions) within 2 months of each other; (ii) absence of significant precursory signs to the first eruption which occurred during a period of ordinary Strombolian activity; (iii) high level of activity between the first and the second eruption; and (iv) eruptive phenomena, such as PDC, glowing avalanches and ballistics on the island.
These similarities may help us to broaden the eruptive scenarios for Stromboli and discuss what we define as an eruption or eruptive period at Stromboli, for civil protection purposes, within the uncertainties associated with natural phenomena.
Since Stromboli is a persistently active volcano, it is rather difficult to define what constitutes an eruption. Here we focus on the operative definition of an eruption, i.e. the period of time that requires shifts in alert levels and certain related activities of the scientific and operational personnel in order to prevent the harmful effects of volcanic activity. The current alert level system and related operational activities are described in the emergency plan for Stromboli (Protezione Civile 2015). The plan has been devised to manage the possible events leading to tsunamigenic processes that may affect coastal areas well away from Stromboli, with a strong emphasis on evidence for slope instability along the Sciara. Specifically, four alert levels are defined corresponding to ordinary Strombolian activity (green), intense Strombolian activity (yellow), evidence of disequilibrium in the volcano edifice (orange) and strong disequilibrium of the volcano edifice (red). Consequently, since paroxysms are considered as being largely unpredictable, even though the historical record shows that most paroxysms have been associated with tsunamis (Tinti et al. 2008), the current alert level system triggers operations at the national level (including incremental activities of the monitoring system) only at orange and red levels in the case of signs of slope instability, adopting the 2002–2003 eruption as a reference scenario (Protezione Civile 2015). In the absence of signs of slope instability, i.e. at green and yellow alert levels, the reference scenario is defined as being of local impact and therefore managed by the Regional Civil Protection (Protezione Civile 2015). In turn the Regional Civil Protection has its own scheme of operational phases for managing the scenarios of local impacts, based on three levels: attention, pre-alarm and alarm (https://www.protezionecivilesicilia.it/it/70-rischio-vulcanico.asp).
The evolution of the 2019 summer eruptive events did not involve evidence of potentially tsunamigenic slope instability, so the alert level was green at the time of the July 3 paroxysm and was raised to yellow 2 days later and remained so through to the August 28 paroxysm and finally rose to orange on August 31 to November 7, 2019 (http://www.protezionecivile.gov.it/attivita-rischi/rischio-vulcanico/vulcani-italia/stromboli/videoconferenze-su-stato-di-attivita-e-livelli-di-allerta).
Following the paroxysm on July 3, the Regional Civil Protection, acknowledging the green alert level in place, immediately raised the local operational phase to “alarm” (DRPC 2019). This prohibited people to climb the volcano above 400 m a.s.l. and to navigate the sea and coast in front of the Sciara del Fuoco, which proved effective in subsequently avoiding the presence of people and boats at distances reached by the products of the 28 August eruption.
So far, then, the system seems to have worked correctly, and the distinction between local relevance (explosive and effusive activity of any kind) and national relevance (large tsunamis) is clearly meaningful at the scale of consequent civil protection actions. However, since the alert level remained at yellow level throughout the eruption, an operational group present on the island in the so-called Centro Operativo Avanzato (Operational Advanced Centre; COA), with scientists and Civil Protection members, was formed only after August 31, when the level was raised to orange. Furthermore, at yellow, the monitoring activities need only be summarized in weekly reports to the Civil Protection, whereas at orange, this frequency rises to daily.
In the summer of 2019, even when there were thousands of people on the island every day during a serious volcanic crisis that lasted for about 2 months, the current alert level system did not allow a permanent group of scientists to work together under the umbrella of the national civil protection officials in the Advanced Operative Centre, nor the release of daily reports to the Civil Protection. This also had obvious consequences in terms of communication of volcanic hazard to the public and media. In contrast, such operations were put into place from September to November, when the eruptive period was waning and the summer tourist season coming to an end. In this respect, we believe that the current alert level system underperformed. The 2019 Stromboli eruption should motivate a rigorous revision of the emergency plan. Based on the 2019 events and the comparison with the 1930 events, this reference scenario should be used, and distinctions between scenarios of national relevance and local relevance, which figure in the current plan, dropped. Paroxysms, just because they are unheralded, should not be seen simply as unpredictable events that punctuate ordinary activity but rather the subsequent evolution of the phenomena should be used as an indicator of the state of the volcano. Using the 2019 (and the 1930) eruption as an example, we would like to have the full period from the July 3 paroxysm to at least August 30, if not later, taken into account, and to make it clear that the occurrence of a paroxysm, even with no precursory signs, should be regarded as an unequivocal sign to raise the alert level to orange, as the eruption could be closely followed by a second paroxysm (with the potential also for sudden, unheralded and tsunamigenic slope failures). The alert should only be downgraded when the subsequent evolution of the eruption clearly indicates a return to milder conditions. Under such a scheme, the operational activities deployed in 2019 would have been substantially different and would have certainly helped in the management of the crisis with the public, media and administration.
A final comment which could be useful for updating eruptive scenarios at Stromboli relates to the hazard posed by pyroclastic density currents associated with Vulcanian eruptions. So far very few PDC deposits have been described in the Stromboli rock record: there are those associated with the rare phreatomagmatic activity related to edifice collapse (Giordano et al. 2008; Lucchi et al. 2019) and those related to rheomorphic slides of welded spatter or glowing avalanches (Di Roberto et al. 2014; Salvatici et al. 2016). The latter have been described, prior to 2019, as being associated with the most energetic Vulcanian events of 1916, 1919, 1930, 1944, 1954 and 2003 (Di Roberto et al. 2014, Pistolesi et al. 2008). Primary pyroclastic density current deposits originating from the collapse of the Vulcanian eruptive jet, such as was observed in 2019, are not preserved/exposed in the rock record and have only been described for the 2003 and 2007 events in the Sciara del Fuoco area, where they were rapidly eroded and buried (Pistolesi et al. 2008, 2011; Andronico et al. 2013). Based on these considerations, it is likely that pyroclastic density currents associated with Vulcanian eruptions at Stromboli are as common as the glowing avalanches and tend to travel in the direction of the Sciara del Fuoco where they are not preserved, probably due to the morphology of the crater area. Hazards related to them also need to be assessed.
Conclusions
The summer 2019 eruptions at Stromboli provided an excellent opportunity to integrate direct observation, information extracted from the large photo and video dataset available online (the amount and quality of which was unprecedented) and field data acquired immediately after the eruptions.
The integration of such a large dataset allowed us to reconstruct the Vulcanian style of the explosive phenomena, the main associated eruption parameters (Table 1), and to interpret the transport mechanisms and sedimentation of the pyroclastic fall deposits from the weak, short-lived, buoyant plumes (Fig. 15).
The trigger of Vulcanian eruptions such as this remains poorly understood. The temporal proximity of one major explosion, two Vulcanian eruptions and highly sustained activity which lasted for about 2 months, very similar to that which occurred in 1930, documents that the volcano is able to exhibit a continuous spectrum of explosivity—from ordinary Strombolian to Vulcanian—and effusive activity within a unique genetic context.
The lack of “long-term” precursory signals and the inflation of the edifice just a few minutes before the Vulcanian eruptions points to the major role of the degassed, crystallized and highly viscous HP magma which stagnates in the upper conduit of Stromboli, acting as a temporary (weak) plug for the deeper, fast rising, low viscosity and gas-rich LP magma, which as a consequence becomes over pressurized before triggering the explosion.
Several implications arise from our field-based investigation and data:
-
Paroxysmal explosions and related deposits at Stromboli share all the characteristics of Vulcanian eruptions and deposits, although they have a distinctly different trigger mechanism from the classic Vulcanian eruptions. We therefore suggest the term basaltic (or mafic) Vulcanian eruptions and deposits for them, in the same way that basaltic Plinian deposits (and eruptions) are similar in physical characteristics to their felsic counterparts without necessarily implying a common identity in terms of conduit processes and mechanisms of fragmentation.
-
The rapid rise of deep magma batches requires new insight into how to monitor deep processes, which is not easy with the monitoring system currently in place, as well as to search for more subtle changes in the ordinary Strombolian activity.
-
Direct hazards associated with the 2019 basaltic Vulcanian eruptions include ballistic fall of spatter, scoria bombs and lava blocks, pyroclastic flows and related small tsunamis, glowing avalanches from slides of welded spatter down the highly inclined upper slopes, and pumice fall over the island.
-
The Stromboli 2019 basaltic Vulcanian eruptions should provide the motivation for a rigorous revision of the emergency plan for this volcanic island, leading to improvements in the reference scenario to include Vulcanian eruptions and the eruptive activity which follows them, and the removal of the distinction between scenarios of national and local relevance.
References
Abbruzzese D (1935) Sulla catastrofica esplosione dello Stromboli dell’11 settembre 1930. Gioenia Proc Soc Nat Sci 1:1–13
Aiuppa A, Federico C, Giudice G, Giuffrida G, Guida R, Gurrieri S, Liuzzo M, Moretti R, Papale P (2009) The 2007 eruption of Stromboli volcano: insights from real-time measurement of the volcanic gas plume CO2/SO2 ratio. J Volcanol Geotherm Res 182(3–4):221–230
Andronico D, Pistolesi M (2010) The November 2009 paroxysmal explosions at Stromboli. J Volcanol Geotherm Res 196(1–2):120–125
Andronico D, Taddeucci J, Cristaldi A, Miraglia L, Scarlato P, Gaeta M (2013) The 15 March 2007 paroxysm of Stromboli: video-image analysis, and textural and compositional features of the erupted deposit. Bull Volcanol 75(7):733
Andronico D, Scollo S, Castro MDL, Cristaldi A, Lodato L, Taddeucci J (2014) Eruption dynamics and tephra dispersal from the 24 November 2006 paroxysm at South-East Crater, Mt Etna, Italy. J Volcanol Geotherm Res 274:78–91
Apuani T, Corazzato C, Cancelli A, Tibaldi A (2005) Physical and mechanical properties of rock masses at Stromboli: a dataset for volcano instability evaluation. Bull Eng Geol Environ 64(4):419–431
Barberi F, Rosi M, Sodi A (1993) Volcanic hazard assessment at Stromboli based on review of historical data. Acta Vulcanol 3:173–187
Barberi F, Civetta L, Rosi M, Scandone R (2009) Chronology of the 2007 eruption of Stromboli and the activity of the scientific synthesis group. J Volcanol Geotherm Res 182(3–4):123–130
Bertagnini A, Coltelli M, Landi P, Pompilio M, Rosi M (1999) Violent explosions yield new insights into dynamics of Stromboli volcano. EOS Trans Am Geophys Union 80(52):633–636
Bertagnini A, Metrich N, Francalanci L, Landi P, Tommasini S, Conticelli S (2008) Volcanology and magma geochemistry of the present-day activity: constraints on the feeding system. In: Calvari S, Inguaggiato S, Puglisi G, Ripepe M, Rosi M (eds) The Stromboli Volcano: an integrated study of the 2002-2003 eruption, Am Geophys Union, Geophysical Monograph Series, vol 182, pp 19–37
Bertagnini A, Di Roberto A, Pompilio M (2011) Paroxysmal activity at Stromboli: lessons from the past. Bull Volcanol 73(9):1229–1243
Bonadonna C, Cioni R, Costa A, Druitt T, Phillips JC, Pioli L, Andronico D, Harris A, Scollo S, Bachmann O, Bagheri G, Biass S, Brogi F, Cashman KV, Dominguez L, Durig T, Galland O, Giordano G, Gundmundsson M, Hort M, Hoskuldsson A, Houghton B, Komorowski JC, Kuppers U, G. L, Le Pennec JL, Macedonio G, Manga M, Manzella I, de’ Michieli Vittrui E, Neri A, Pistolesi M, Polacci M, Ripepe M, Rossi E, Scheu B, Sulpizio R, Tripoli B, Valade S, Valentine GA, Vidal CM, Wallenstein N, (2016) MeMoVolc consensual document: dynamics and classification of volcanic explosive eruptions. Bull Volcanol 78(11):84
Calvari S, Pinkerton H (2004) Birth, growth and morphologic evolution of the ‘Laghetto’ cinder cone during the 2001 Etna eruption. J Volcanol Geotherm Res 132(2):225–239
Calvari S, Spampinato L, Lodato L (2006) The 5 April 2003 Vulcanian paroxysmal explosion at Stromboli volcano (Italy) from field observations and thermal data. J Volcanol Geotherm Res 149(1–2):160–175
Calvari S, Spampinato L, Bonaccorso A, Oppenheimer C, Rivalta E, Boschi E (2011) Lava effusion—a slow fuse for paroxysms at Stromboli volcano? Earth Planet Sci Lett 301(1–2):317–323
Calvari S, Inguaggiato S, Puglisi G, Ripepe M, Rosi M (eds) (2008) The Stromboli volcano: an integrated study of the 2002–2003 eruption. Am Geophys Union Geophys Monogr Ser 182
Carapezza ML, Inguaggiato S, Brusca L, Longo M (2004) Geochemical precursors of the activity of an open-conduit volcano: the Stromboli 2002–2003 eruptive events. Geophys Res Lett 31(7)
Carey S, Sparks RSJ (1986) Quantitative models of the fallout and dispersal of tephra from volcanic eruption columns. Bull Volcanol 48(2–3):109–125
Chouet B, Dawson P, Martini M (2008) Shallow-conduit dynamics at Stromboli Volcano, Italy, imaged from waveform inversions. Geol Soc London Spec Publ 307(1):57–84
Cimarelli C, Di Traglia F, Taddeucci J (2010) Basaltic scoria textures from a zoned conduit as precursors to violent Strombolian activity. Geology 38:439–442. https://doi.org/10.1130/G30720.1
Clarke AB, Ongaro TE, Belousov A (2015) Vulcanian eruptions. In: Sigurdsson H, Houghton B, Mcnutt S, Rymer H, Stix J (eds) The encyclopedia of volcanoes. Elsevier-Academic Press: 505–518
Coltelli M, Del Carlo P, Vezzoli L (1998) Discovery of a Plinian basaltic eruption of Roman age at Etna volcano, Italy. Geology 26(12):1095–1098
Costa A, Pioli L, Bonadonna C (2016) Assessing tephra total grain-size distribution: insights from field data analysis. Earth Planet Sci Lett 443:90–107
Costantini L, Bonadonna C, Houghton BF, Wehrmann H (2009) New physical characterization of the Fontana Lapilli basaltic Plinian eruption, Nicaragua. Bull Volcanol 71(3):337–355
D’Auria L, Giudicepietro F, Martini M, Peluso R (2006) Seismological insight into the kinematics of the 5 April 2003 Vulcanian explosion at Stromboli volcano (southern Italy). Geophys Res Lett 33(8):L08308. https://doi.org/10.1029/2006GL026018
Di Roberto A, Bertagnini A, Pompilio M, Bisson M (2014) Pyroclastic density currents at Stromboli volcano (Aeolian Islands, Italy): a case study of the 1930 eruption. Bull Volcanol 76(6):827
Di Stefano F, Mollo S, Ubide T, Petrone CM, Caulfield J et al (2020) Mush cannibalism and disruption recorded by clinopyroxene phenocrysts at Stromboli volcano: new insights from recent 2003–2017 activity. Lithos 360:105440
DRPC (2019) Avviso Regionale di Protezione Civile per Eventi Vulcanici di Impatto Locale a Stromboli n. 3 del 3 luglio 2019. Regione Siciliana – Presidenza – Dipartimento della Protezione Civile, Servizi Rischi Sismico e Vulcanico, accessible at https://www.protezionecivilesicilia.it/avvisi/Avviso_Stromboli_03_03072019.pdf, last access 03 September 2020
Formenti Y, Druitt TH, Kelfoun K (2003) Characterisation of the 1997 Vulcanian explosions of Soufrière Hills volcano, Montserrat, by video analysis. Bull Volcanol 65(8):587–605
Francalanci L, Bertagnini A, Métrich N, Renzulli A, Vannucci R, Landi P et al (2008) Mineralogical, geochemical, and isotopic characteristics of the ejecta from the 5 April 2003 paroxysm at Stromboli, Italy: inferences on the preeruptive magma dynamics. Am Geophys Union Geophys Monogr Ser 182:19–39
Francalanci L, Lucchi F, Keller J, De Astis G, Tranne CA (2013) Eruptive, volcano-tectonic and magmatic history of the Stromboli volcano (north-eastern Aeolian archipelago). Geol Soc Mem 37(1):397–471
Francis PW, Glaze LS, Pieri D, Oppenheimer CMM, Rothery DA (1990) Eruption terms. Nature 346:519
Freret-Lorgeril V, Donnadieu F, Scollo S, Provost A, Fréville P, Guéhenneux Y et al (2018) Mass eruption rates of tephra plumes during the 2011–2015 lava fountain paroxysms at Mt. Etna from Doppler radar retrievals. Front Earth Sci 6:73
Giordano G, Porreca M (2009) Field observations on the initial lava flow and the fracture system developed during the early days of the Stromboli 2007 eruption. J Volcanol Geotherm Res 182(3–4):145–154
Giordano G, Porreca M, Musacchio P, Mattei M (2008) The Holocene Secche di Lazzaro phreatomagmatic succession (Stromboli, Italy): evidence of pyroclastic density current origin deduced by facies analysis and AMS flow directions. Bull Volcanol 70(10):1221–1236
Giudicepietro F, López C, Macedonio G, Alparone S, Bianco F, Calvari S et al (2020) Geophysical precursors of the July-August 2019 paroxysmal eruptive phase and their implications for Stromboli volcano (Italy) monitoring. Sci Rep 10(1):1–16
Harris A, Ripepe M (2007a) Synergy of multiple geophysical approaches to unravel explosive eruption conduit and source dynamics–a case study from Stromboli. Geochemistry 67(1):1–35
Harris A, Ripepe M (2007b) Temperature and dynamics of degassing at Stromboli. J Geophys Res Solid Earth 112(B3):B03205. https://doi.org/10.1029/2006JB004393
Hornig-Kjarsgaard I, Keller J, Koberski U, Stadlbauer E, Lenhart R (1993) Geological map of the island of Stromboli. Acta Vulcanol 3(3):21–68
Houghton BF, Wilson CJN, Del Carlo P, Coltelli M, Sable JE, Carey R (2004) The influence of conduit processes on changes in style of basaltic Plinian eruptions: Tarawera 1886 and Etna 122 BC. J Volcanol Geotherm Res 137(1–3):1–14
Houghton BF, Swanson DA, Rausch J, Carey RJ, Fagents SA, Orr TR (2013) Pushing the Volcanic Explosivity Index to its limit and beyond: constraints from exceptionally weak explosive eruptions at Kīlauea in 2008. Geology 41(6):627–630
Houghton BF, Swanson DA, Biass S, Fagents SA, Orr TR (2017) Partitioning of pyroclasts between ballistic transport and a convective plume: Kīlauea volcano, 19 March 2008. J Geophys Res Solid Earth 122(5):3379–3391
Imbò G (1928) Parossismo di Stromboli nel settembre 1930. Bull Volcanol 5(1):177–185
Landi P, Corsaro RA, Francalanci L, Civetta L, Miraglia L, Pompilio M, Tesoro R (2009) Magma dynamics during the 2007 Stromboli eruption (Aeolian Islands, Italy): mineralogical, geochemical and isotopic data. J Volcanol Geotherm Res 182(3–4):255–268
Leduc L, Gurioli L, Harris A, Colò L, Rose-Koga EF (2015) Types and mechanisms of Strombolian explosions: characterization of a gas-dominated explosion at Stromboli. Bull Volcanol 77(1):1–15. https://doi.org/10.1007/s00445-014-0888-5
LGS (2019a) ESPLOSIONE PAROSSISTICA A STROMBOLI DEL 03/07/2019 14:45 GMT http://lgs.geo.unifi.it/index.php/blog/esplosione-parossistica-stromboli-3-luglio-2019, Last access 03 September, 2020
LGS (2019b), NUOVA ESPLOSIONE PAROSSISTICA A STROMBOLI DEL 28/08/2019 ALLE 10:17 GMT http://lgs.geo.unifi.it/index.php/blog/esplosione-parossistica-stromboli-28-agosto-2019. Last access 03 September, 2020
LGS (2019c) ESPLOSIONE MAGGIORE A STROMBOLI DEL 29/08/2019 20:43 GMT http://lgs.geo.unifi.it/index.php/blog/esplosione-maggiore-stromboli-29-agosto-2019. Last access 03 September, 2020
Lucchi F, Francalanci L, De Astis G, Tranne CA, Braschi E, Klaver M (2019) Geological evidence for recurrent collapse-driven phreatomagmatic pyroclastic density currents in the Holocene activity of Stromboli volcano, Italy. J Volcanol Geotherm Res 385:81–102
Mastin LG (2001) A simple calculator of ballistic trajectories for blocks ejected during volcanic eruptions. US Geol Surv Open-File Report 01–45
Mastin LG, Guffanti M, Servranckx R, Webley P, Barsotti S, Dean K, Durant A, Ewert JW, Neri A, Rose WI, Schneider D, Siebert L, Stunder B, Swanson G, Tupper A, Volentik A, Waythomas CF (2009) A multidisciplinary effort to assign realistic source parameters to models of volcanic ash-cloud transport and dispersion during eruptions. J Volcanol Geotherm Res 186(1–2):10–21
Mercalli G, Silvestri O (1891) L’eruzione dell’Isola di Vulcano incominciata il 3 agosto 1888 e terminata il 22 marzo 1890. Ann Uff Centr Meteorol Geodin 10:71–281
Mercalli G (1907) I vulcani attivi della terra: morfologia - dinamismo - prodotti - distribuzione geografica – cause. Ulrico Hoepli, Milan, 421p
Métrich N, Bertagnini A, Landi P, Rosi M (2001) Crystallization driven by decompression and water loss at Stromboli volcano (Aeolian Islands, Italy). J Petrol 42(8):1471–1490
Métrich N, Bertagnini A, Landi P, Rosi M, Belhadj O (2005) Triggering mechanism at the origin of paroxysms at Stromboli (Aeolian archipelago, Italy): the 5 April 2003 eruption. Geophys Res Lett 32(10):L10305. https://doi.org/10.1029/2004GL022257
Métrich N, Bertagnini A, Di Muro A (2010) Conditions of magma storage, degassing and ascent at Stromboli: new insights into the volcano plumbing system with inferences on the eruptive dynamics. J Petrol 51:603–626
Oppenheimer J, Capponi A, Cashman KV, Lane SJ, Rust AC, James MR (2020) Analogue experiments on the rise of large bubbles through a solids-rich suspension: a “weak plug” model for Strombolian eruptions. Earth Planet Sci Lett 531:115931
Pasquare’ G, Francalanci L, Garduno VH, Tibaldi A (1993) Structure and geological evolution of the Stromboli volcano, Aeolian islands, Italy. Acta Vulcanol 3:79–89
Patanè D, Barberi G, De Gori P, Cocina O, Zuccarello L, Garcia-Yeguas A, Castellano M, D’Alessandro A, Sgroi T (2017) The shallow magma chamber of Stromboli Volcano (Italy). Geophys Res Lett 44(13):6589–6596
Patrick M, Harris A, Ripepe M, Dehn J, Rothery D, Calvari S (2007) Strombolian explosive styles and source conditions: insights from thermal (FLIR) video. Bull Volcanol 69(7):769–784
Pensa A, Pinton A, Vita L, Bonamico A, De Benedetti AA, Giordano G (2019) Atlas of Italian submarine volcanic structures. Mem Descr Carta Geol d'It 104:77–183
Pioli L, Erlund E, Johnson E, Cashman K, Wallace P, Rosi M, Delgado Granados H (2008) Explosive dynamics of violent Strombolian eruptions: the eruption of Parıcutin volcano 1943-1952 (Mexico). Earth Planet Sci Lett 271:359–368. https://doi.org/10.1016/j.epsl.2008.04.026
Pioli L, Pistolesi M, Rosi M (2014) Transient explosions at open-vent volcanoes: the case of Stromboli (Italy). Geology 42(10):863–866
Pioli L, Bonadonna C, Pistolesi M (2019) Reliability of total grain-size distribution of tephra deposits. Sci Rep 9(1):1–15
Pistolesi M, Rosi M, Pioli L, Renzulli A, Bertagnini A, Andronico D (2008) The paroxysmal event and its deposits. In: Calvari S, Inguaggiato S, Puglisi G, Ripepe M, Rosi M (eds) The Stromboli Volcano: an integrated study of the 2002–2003 eruption, Am Geophys union, geophysical monograph series, vol 182, pp 317–330
Pistolesi M, Delle Donne D, Pioli L, Rosi M, Ripepe M (2011) The 15 March 2007 explosive crisis at Stromboli volcano, Italy: assessing physical parameters through a multidisciplinary approach. J Geophys Res Solid Earth 116(B12):B12206. https://doi.org/10.1029/2011JB008527
Protezione Civile (2015) Piano nazionale di emergenza a fronte di eventi vulcanici di rilevanza nazionale ex art. 107, comma 1, lettera f) del D.Lgs. 31 marzo 1998, n.112, http://www.protezionecivile.gov.it/attivita-rischi/rischio-vulcanico/vulcani-italia/stromboli/pianificazione, last access 03 September, 2020
Regione Siciliana (2019) Delibera 257/19 Allegato A, accessible at http://www.regione.sicilia.it/deliberegiunta/file/giunta/allegati/Delibera_257_19.pdf, last access 03 September, 2020
Riccò A (1907) Sull’attivita’ dello Stromboli dal 1891 in poi. Boll Sismol Soc Ital 12:205
Ripepe M, Harris AJ (2008) Dynamics of the 5 April 2003 explosive paroxysm observed at Stromboli by a near-vent thermal, seismic and infrasonic array. Geophys Res Lett 35(7):L07306
Ripepe M, Marchetti E, Ulivieri G, Harris A, Dehn J, Burton M, Caltabiano T, Salerno G (2005) Effusive to explosive transition during the 2003 eruption of Stromboli volcano. Geology 33(5):341–344
Ripepe M, Delle Donne D, Harris A, Marchetti E, Ulivieri G (2008) Dynamics of Strombolian activity. Am Geophys Union Geophys Monogr Ser 182:39–48
Rittmann A (1931) Der ausbruch des Stromboli am 11 September 1930. Z vulkanol 14:47–77
Rosi M (1980a) The island of Stromboli. Rend Soc It Mineral Petrol 36:345–368
Rosi M (1980b) Geological map of the island of Stromboli (Aeolian Islands). Rend Soc It Mineral Petrol 36
Rosi M, Bertagnini A, Landi P (2000) Onset of the persistent activity at Stromboli volcano (Italy). Bull Volcanol 62(4–5):294–300
Rosi M, Bertagnini A, Harris A, Pioli L, Pistolesi M, Ripepe M (2006) A case history of paroxysmal explosion at Stromboli: timing and dynamics of the April 5, 2003 event. Earth Planet Sci Lett 243(3–4):594–606
Rosi M, Pistolesi M, Bertagnini A, Landi P, Pompilio M, Di Roberto A (2013) Stromboli volcano, Aeolian Islands (Italy): present eruptive activity and hazards. In: Lucchi F, Peccerillo A, Keller J, Tranne CA, Rossi PL (eds) The Aeolian Islands Volcanoes, Geol Soc Memoirs, vol 37, pp 473–490. https://doi.org/10.1144/M37.14
Salvatici T, Di Roberto A, Di Traglia F, Bisson M, Morelli S, Fidolini F et al (2016) From hot rocks to glowing avalanches: numerical modelling of gravity-induced pyroclastic density currents and hazard maps at the Stromboli Volcano (Italy). Geomorphology 273:93–106
Scott WE, Sherrod D, Gardner CA (2008) Chapter 1. Overview of 2004 to 2005, and continuing, eruption of Mount St. Helens, Washington. In: Sherrod D, Scott WE (eds) A volcano rekindled: the renewed eruption at Mount St. Helens, 2004–2006. U.S. Geological Survey Professional Paper 1750:3–22
Self S, Wilson L, Nairn IA (1979) Vulcanian eruption mechanisms. Nature 277(5696):440–443
Simons BC, Cronin SJ, Eccles JD, Bebbington MS, Jolly AD (2020) Spatiotemporal variations in eruption style, magnitude and vent morphology at Yasur volcano, Vanuatu: insights into the conduit system. Bull Volcanol 82(8):1–22
Steinberg GS, Babenko JL (1978) Gas velocity and density determination by filming gas discharges. J Volcanol Geotherm Res 3:89–98
Taddeucci J, Edmonds M, Houghton B, James MR, Vergniolle S (2015) Hawaiian and Strombolian eruptions. In: Sigurdsson H, Houghton B, McNutt S, Rymer H, Stix J (eds) The encyclopedia of volcanoes. Elsevier-Academic Press, pp 485–503
Tinti S, Zaniboni F, Pagnoni G, Manucci A (2008) Stromboli Island (Italy): scenarios of tsunamis generated by submarine landslides. Appl Geophys 165:2143–2167
Trolese M, Cerminara M, Ongaro TE, Giordano G (2019) The footprint of column collapse regimes on pyroclastic flow temperatures and plume heights. Nat Commun 10(1):1–10
Valentine GA, Connor CB (2015) Basaltic volcanic fields. In: Sigurdsson H, Houghton B, McNutt S, Rymer H, Stix J (eds) The encyclopedia of volcanoes. Elsevier-Academic Press, pp 423–439
Walker GPL (1971) Grain-size characteristics of pyroclastic deposits. J Geol 79(6):696–714
Walker GPL, Wilson L, Bowell ELG (1971) Explosive volcanic eruptions—I the rate of fall of pyroclasts. Geophys J Int 22(4):377–383
Walker GPL (1973) Explosive volcanic eruptions—a new classification scheme. Geol Rundsch 62(2):431–446
Walker GPL, Self S, Wilson L (1984) Tarawera 1886, New Zealand—a basaltic plinian fissure eruption. J Volcanol Geotherm Res 21(1–2):61–78
Acknowledgements
The authors gratefully acknowledge M. Ripepe (University of Firenze) for discussions in the field prior to and during the summer Stromboli 2019 eruption. The authors also thank S. Branca (INGV-OE) for sharing photos and discussion. Mario Zaia and all volcanological guides are acknowledged for their support together with A. Esposito (INGV-ONT). Bea Fassi and Vera are also acknowledged for support, laughter and taking samples. Don Bruno is acknowledged for allowing the sampling on the roof of S. Vincenzo church. Silvia Zorra Frenquelli, G. Scognamiglio, A. Fabrizi and S. Rinauro are acknowledged for sharing their photos. A. Bonamico, G. Carrasco-Nunez and A. Pensa shared few days in the field. Mr. Mensolina and Mrs. Sbadamé are heartedly acknowledged for their wedding on Stromboli during the crisis. Two anonymous reviewers, the associate editor L. Pioli and editor-in-chief A. Harris, provided many important comments that greatly helped improving the manuscript. The Grant to Department of Science, Roma Tre University (MIUR-Italy Dipartimenti di Eccellenza, Art. 1, com. 314 –337 Legge 232/2016) is gratefully acknowledged. We are grateful to the Associate Editor and two anonymous reviewers who greatly helped improving the manuscript.
Funding
Open access funding provided by Università degli Studi Roma Tre within the CRUI-CARE Agreement.
Author information
Authors and Affiliations
Corresponding author
Additional information
Editorial responsibility: L. Pioli
Rights and permissions
Open Access This article is licensed under a Creative Commons Attribution 4.0 International License, which permits use, sharing, adaptation, distribution and reproduction in any medium or format, as long as you give appropriate credit to the original author(s) and the source, provide a link to the Creative Commons licence, and indicate if changes were made. The images or other third party material in this article are included in the article's Creative Commons licence, unless indicated otherwise in a credit line to the material. If material is not included in the article's Creative Commons licence and your intended use is not permitted by statutory regulation or exceeds the permitted use, you will need to obtain permission directly from the copyright holder. To view a copy of this licence, visit http://creativecommons.org/licenses/by/4.0/.
About this article

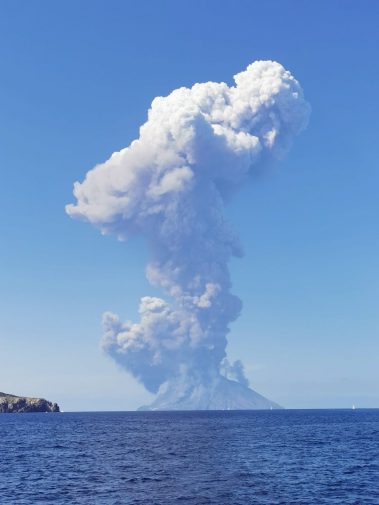
Cite this article
Giordano, G., De Astis, G. The summer 2019 basaltic Vulcanian eruptions (paroxysms) of Stromboli. Bull Volcanol 83, 1 (2021). https://doi.org/10.1007/s00445-020-01423-2
Received:
Accepted:
Published:
DOI: https://doi.org/10.1007/s00445-020-01423-2