Influence of the Economic Efficiency of Built-Up Land (EEBL) on Urban Heat Islands (UHIs) in the Yangtze River Delta Urban Agglomeration (YRDUA)


1
State Key Laboratory of Resources and Environmental Information Systems, Institute of Geographic Sciences and Natural Resources Research, Chinese Academy of Sciences, Beijing 100101, China
2
University of Chinese Academy of Sciences, Beijing 100049, China
*
Author to whom correspondence should be addressed.
Remote Sens. 2020, 12(23), 3944; https://doi.org/10.3390/rs12233944
Submission received: 28 October 2020
/
Revised: 24 November 2020
/
Accepted: 27 November 2020
/
Published: 2 December 2020
(This article belongs to the Special Issue Understanding Urban Systems Using Remote Sensing)
Abstract
:Currently, an urban agglomeration is a trend in global urbanization. With the continuous development of urban agglomerations, Chinese urban agglomerations have entered an era of high-quality development. Improving the economic efficiency of built-up land (EEBL) and maintaining a good ecological environment are important for promoting the high-quality development of urban agglomerations. Urban heat islands (UHIs) are one of the major ecological environmental problems affecting urban agglomerations. Therefore, it is meaningful to investigate the influence of the EEBL on UHIs in urban agglomerations. Based on the land-use data, MODIS land surface temperature (LST) data and gross domestic product (GDP) in the secondary and tertiary industries from 2000 to 2018, and electric power consumption data in 2018, this paper analyzed the influence of the EEBL on the surface urban heat island intensity (SUHII) in the Yangtze River Delta Urban Agglomeration (YRDUA). The results showed that most of cites in the YRDUA experienced rapid EEBL growth and a significant increase in heat island intensity from 2000 to 2018. There has been a significant positive correlation between the EEBL and the SUHII over the years, among which the EEBL had the strongest correlation (R = 0.76, p < 0.01) with the SUHII in 2000. Moreover, among the 27 cities in the YRDUA, 21 cities showed a significant uptrend of the SUHII with rising EEBL and the uptrend was significantly and negatively correlated with the electric power utilization efficiency (EPUE) of the secondary and tertiary industries (R = −0.6, p < 0.01). These results indicated that the EEBL of the secondary and tertiary industries had a significant influence on UHIs, which also reflected the significant influence of anthropogenic heat on UHIs to a certain extent. The findings of this paper can provide a scientific basis for mitigating the UHIs caused by the rapid economic development and promoting the high-quality development of urban agglomerations.
1. Introduction
In the dual processes of global urbanization and economic globalization, urban agglomerations have become a global trend [1]. In China, urban agglomerations hold a special important status in urbanization since they are the major form of China’s New Urbanization (an urbanization plan in China) [2]. With unprecedented rapid economic development, the rapid expansion of built-up land has become the major feature of land-use changes in China. However, expansion is usually uncontrolled and does not exert the greatest benefit for economic growth and regional ecology [3]. In recent years, built-up land efficiency and high-quality development have gradually attracted the attention of the Chinese government and scholars [4,5,6]. The economic efficiency of built-up land (EEBL) is an important part of built-up land efficiency and is of great significance to the sustainable development of society [7]. Urban agglomerations are regions with the fastest expansion of built-up land, and the EEBL is important for regional economic development and high-quality development [4]. It is important to control urban sprawl, improve the EEBL and maintain a good ecological environment to promote the high-quality development of urban agglomerations [8]. The effect of urbanization on the thermal environment, commonly characterized as the phenomenon of the urban heat island (UHI), is one of the most evident ecological and environmental problems [9,10]. With the continuous increase in the EEBL, energy-use patterns will change, and great amounts of anthropogenic heat will be released into the environment, which may affect the regional thermal environment [11,12].
The UHI effect is a phenomenon which higher temperatures occur in urban areas than in the surrounding rural areas [13]. This effect is attributed greatly to the change in the energy exchange between urban land surfaces and the atmosphere, which is primarily caused by increased impervious surface cover replacing evaporative vegetation surfaces, and by anthropogenic heat emissions [14,15]. In addition, meteorological characteristics and synoptic conditions have significant impacts on the UHI effect [16]. With the increasing importance of urban agglomerations in China’s urbanization in recent years, the UHI effect in Chinese urban agglomerations has been widely studied. Because in situ weather stations are limited in many urbanized areas, it is difficult to quantify the air UHI over a large spatial scale [17]. With advantages in spatially explicit coverage and high resolution, many scholars have used satellite-derived land surface temperature (LST) data to research the UHI effect in urban agglomerations, and the UHI was quantified by the surface urban heat island intensity (SUHII) [18]. Most of the previous studies investigated the spatiotemporal patterns of the SUHII and their driving forces in urban agglomerations. For instance, Zhao et al. [19] evaluated the seasonal variability in daytime and nighttime SUHIIs and found that the seasonal variations in the daytime SUHII were significantly correlated with the seasonal variations in the leaf area index (LAI) difference between urban areas and background areas. Jia et al. [5] explored the trends and driving forces of LST along the urban-rural gradients in the Yangtze River Delta Urban Agglomeration (YRDUA) and found that evaporation was the primary driver of the daytime trend. Zhou et al. [20] investigated the spatiotemporal trends of the SUHII along the urban development intensity gradient in 32 major Chinese cities and found that the trend pattern was largely controlled by local climate-vegetation conditions. However, most of these studies investigated the impact of landscape pattern and background climate on the thermal environment of urban agglomeration [21,22]. There are relatively few studies on the influence of economic growth on the UHI effect. Some studies believed that landscape urbanization was the key link between economic growth and the UHI effect [23]. However, the EEBL may be another link between economic development and the UHI effect, as the EEBL can well reflect the intensity of urban anthropogenic heat emissions to some extent, which may have an important influence on the thermal environment of urban agglomerations. However, there is a lack of research on this topic.
Considering the shortage of previous thermal environment studies on urban agglomerations, this paper chose the YRDUA as the research area and analyzed the influence of the EEBL on the SUHII variation based on the land-use data, MODIS LST data, gross domestic product (GDP) in the secondary and tertiary industries, and electric power consumption data. First, the spatiotemporal patterns of the EEBL and SUHII in the YRDUA from 2000 to 2018 were analyzed. Then, the influence of the EEBL on the SUHII variation was investigated. Finally, combined with energy consumption data, this paper investigated the underlying mechanism of the influence. This research is expected to provide a scientific basis for mitigating the UHI caused by the rapid economic development of urban agglomerations and promoting the high-quality development.
2. Materials and Methods
2.1. Study Area
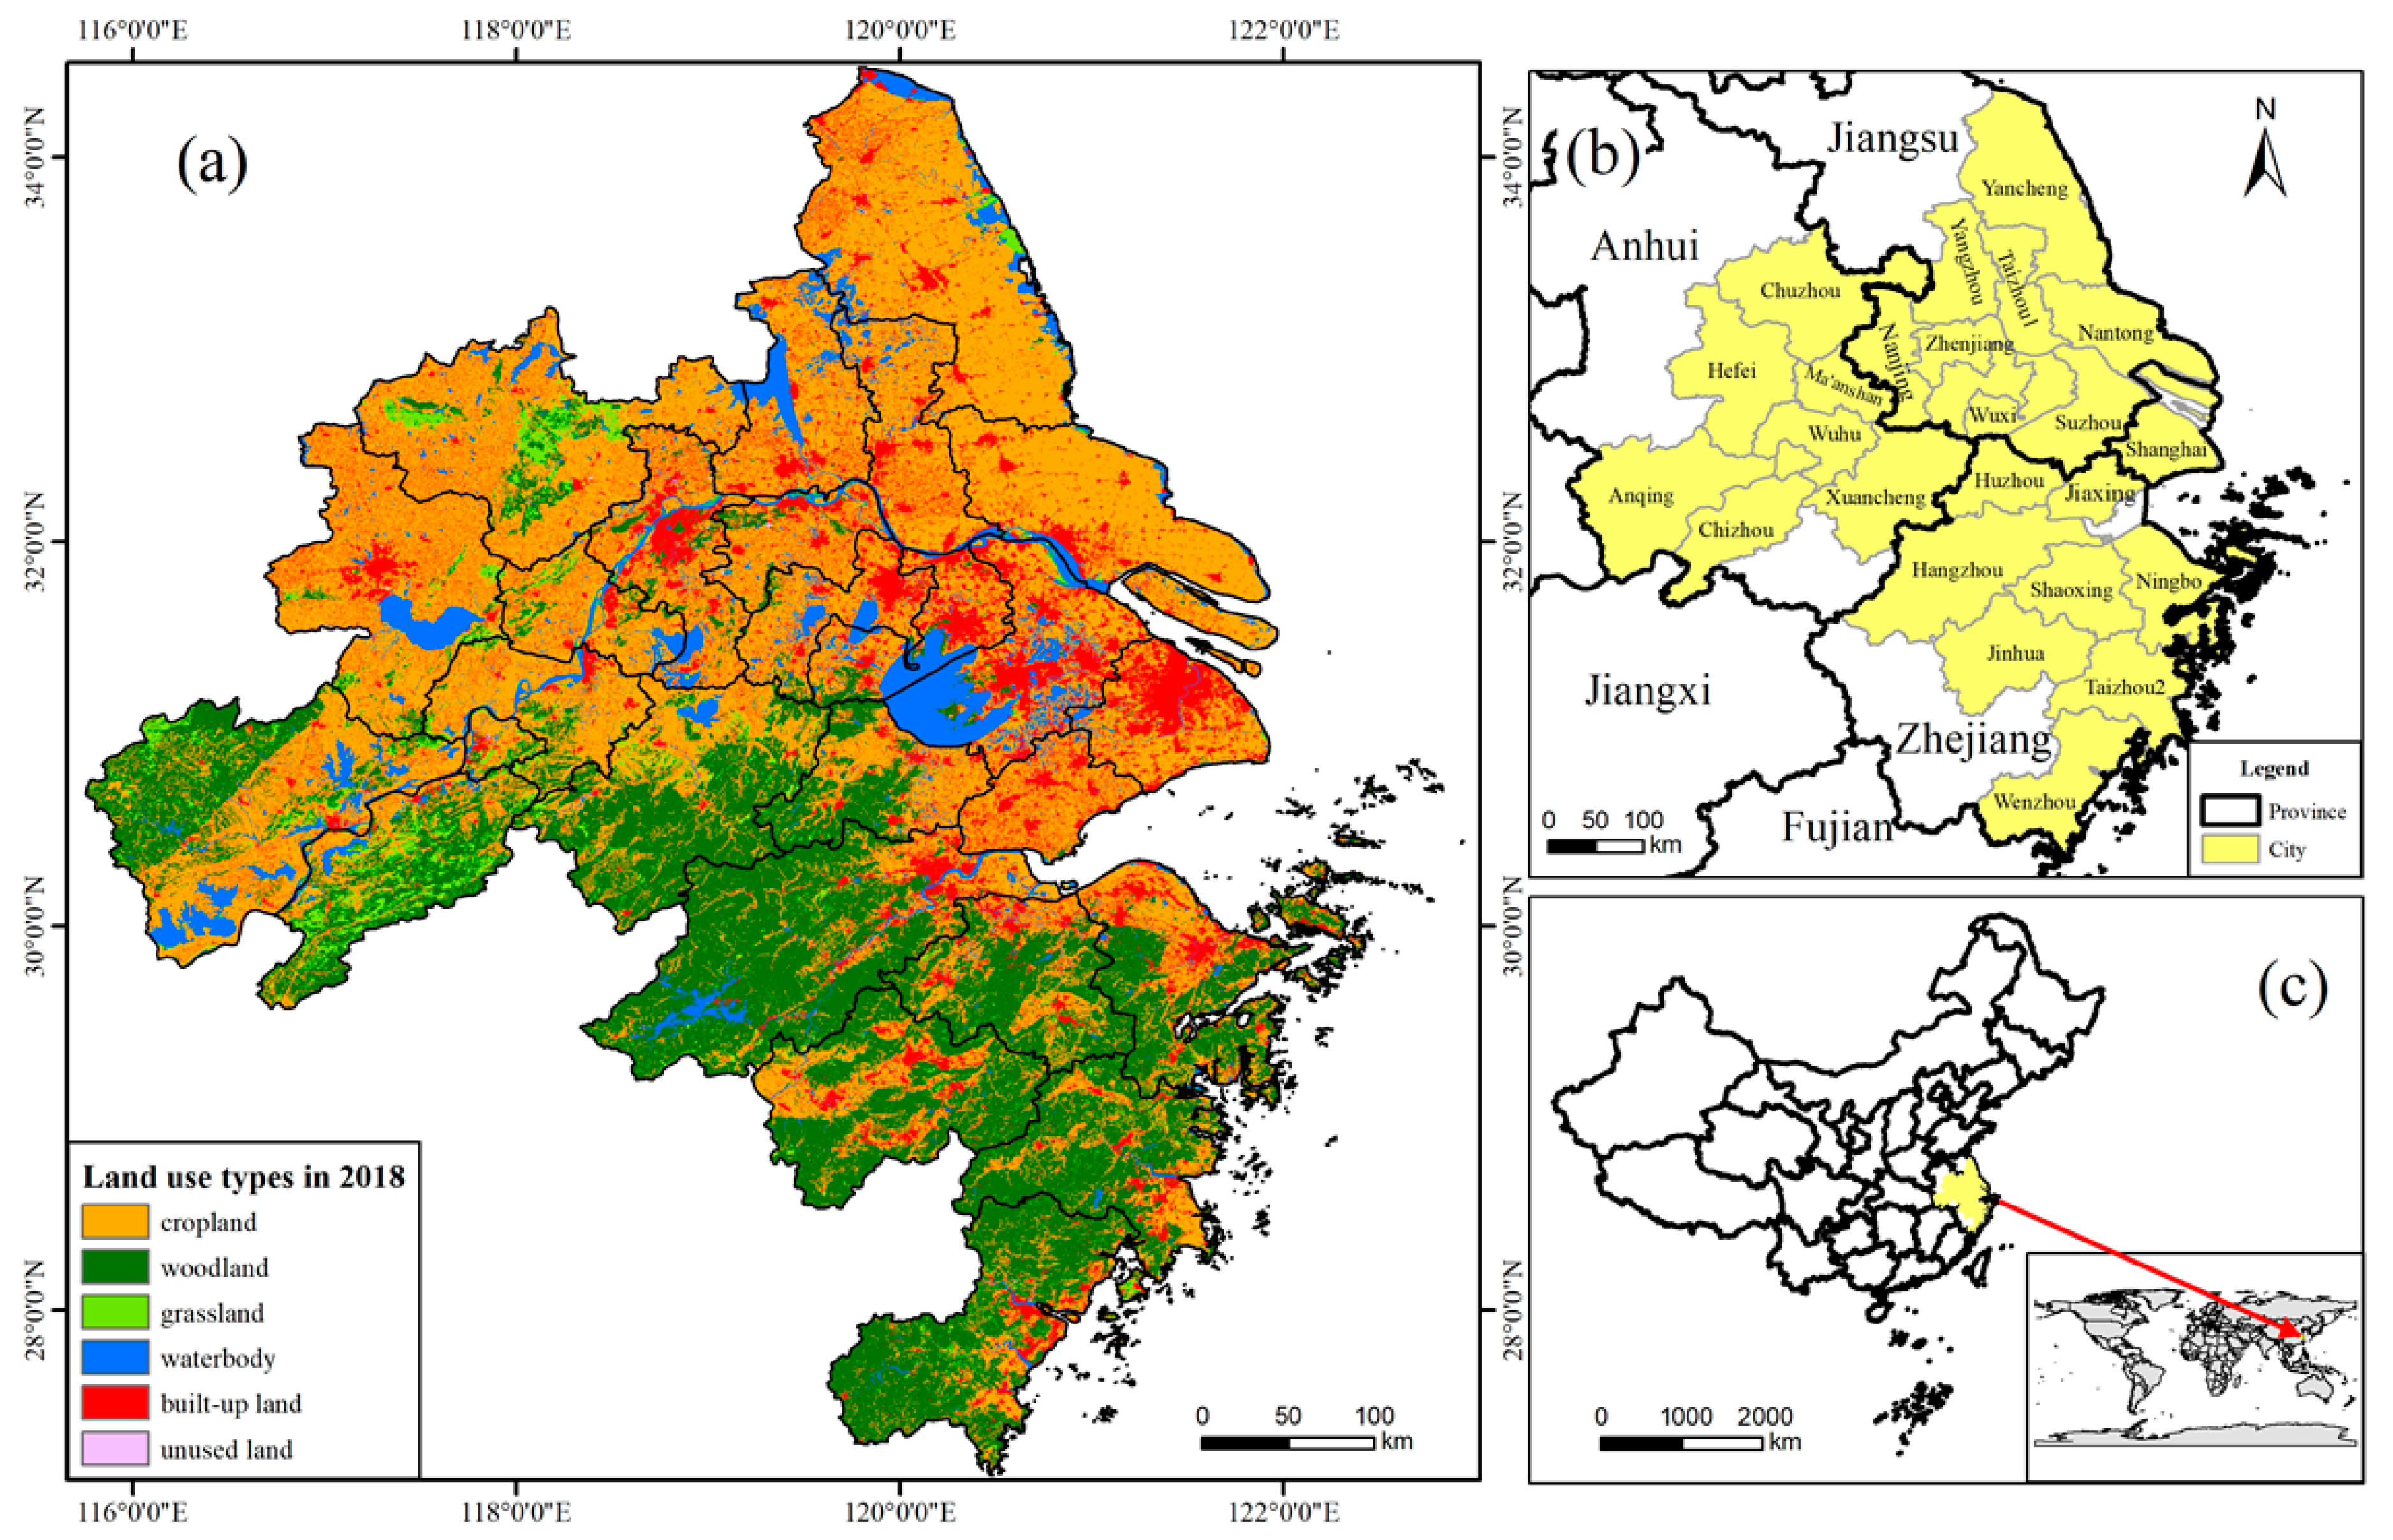
The YRDUA is the most developed urban agglomeration in China and the intersection of the Silk Road Economic Belt and the 21st Century Maritime Silk Road. The YRDUA plays an important role in Chinese economic and social development as well as in the Belt and Road Initiative of China [24]. It is located in East China and includes 27 cities from Jiangsu (JS) Province, Zhejiang (ZJ) Province, Anhui (AH) Province and Shanghai municipality (Figure 1). The YRDUA is ideal for investigating the relationship between the SUHII and EEBL since the YRDUA has experienced rapid economic development and EEBL increase in the past two decades. From 2000 to 2018, GDP in the secondary and tertiary industries of the YRDUA increased nearly nine-fold, and the area of built-up land increased nearly doubled. From 2000 to 2018, cropland, woodland and grassland decreased significantly, while built-up land and unused land increased significantly. The transformation between cropland and built-up land and the transformation between cropland and woodland are the main modes of land-use transformation in the YRDUA. However, with the rapid urbanization process, the YRDUA is facing severe thermal environmental problems, which threaten the health of city dwellers and regional sustainable development [25]. As the regional integration of the Yangtze River Delta becomes a national strategy, the YRDUA enters an era of high-quality development. Improving the EEBL and ensuring a good urban thermal environment are basic goals for the high-quality development of the YRDUA. The findings of this study can not only provide a scientific basis for the high-quality development of the YRDUA, but also provide a reference for the high-quality development of other urban agglomerations in China.
2.2. Data
In this study, land-use data, Terra MODIS LST data, GDP in secondary and tertiary industries and electric energy consumption in 2000, 2005, 2010, 2015 and 2018 were mainly used.
The land-use data of the YRDUA were derived from China’s National Land Use and Cover Change (CNLUCC) datasets (30 m spatial resolution) provided by the Chinese Academy of Sciences. The CNLUCC datasets were constructed mainly using a high-resolution remote sensing–unmanned aerial vehicle (UAV)–ground survey observation system via human–computer interaction, based on geographic knowledge [26]. Moreover, these land-use datasets divide the land-use types into 6 first-grade types including cropland, woodland, grassland, waterbody, built-up land and unused land, and the overall accuracy of these datasets has been reported to be higher than 90%. Unused land was defined as land that was not put into practical use or land that was difficult to use, including sandy land, wetland, bare soil, bare rock and other types, such as alpine desert and tundra [27]. This paper used these land-use data to extract the LST of built-up land and calculate the built-up land area of each city in the YRDUA.
GDP in the secondary and tertiary industries [9] and their electric energy consumption were mainly obtained from statistical yearbooks at the city level and province level (Jiangsu, Zhejiang, Anhui and Shanghai). Moreover, GDP in the secondary and tertiary industries were calculated to comparable prices for 2000.
The LST data were obtained from the Terra MODIS 8-days composite products (version 6) with a spatial resolution of 1000 m. The MOIDS LST data were retrieved by a generalized split-window algorithm at 10:30 h (daytime) and 22:30 h (nighttime) local solar time. Some studies showed that the retrieval errors of MODIS LST were mostly <1 K and the root mean square (RMS) was <0.5 K [28]. Because of its high quality, free availability and wide coverage, MODIS LST data have been widely used in regional thermal environment studies. Moreover, compared with other LST products, such as Surface Kinetic Temperature (AST_08), the MODIS LST dataset provided by the United States (U.S.) Geological Survey (USGS) are included in the Google Earth Engine (GEE) data catalog, which allows us to obtain and process the LST data more conveniently and efficiently. Considering that the economic data and energy consumption data used in this paper are on an annual scale, the mean daytime LST value for a year of each pixel in the YRUDA was calculated using the GEE. The LST pixels with cloud contamination were removed according to LST quality control flags (“average LST error > 3 K”). Because the Terra MODIS LST product has been available since March 2000, the date range of the LST data used for the annual mean LST calculation was set as March of a certain year to February of the next year, and there were 46 MODIS LST scenes for each year. For example, the mean daytime LST value of a certain pixel in 2005 was generally calculated by the 46 daytime LST values available for this pixel from March 2015 to February 2016. Finally, to match the spatial resolution of the land-use data, the annual mean LST images were resampled to a 30 m spatial resolution using the resample function of ArcGIS 10.3 with the resampling technique parameter set as nearest.
2.3. Methods
2.3.1. Quantification of Surface Urban Heat Island Effect
The SUHIIs of cities in the YRDUA were defined as the mean LST difference between built-up land and background land. The background land of a city was selected as the land in the city other than built-up land. Moreover, the LST pixels that were water bodies were excluded because these pixels may overshadow the urbanization effect on temperature [29]:
where is the annual daytime surface urban heat island intensity of a city in a certain year, is the mean value of daytime LST values of the built-up land pixels of this city and is the mean value of daytime LST values of the background land pixels in this city.
2.3.2. Quantification of the EEBL
Built-up land is an important carrier of economic activities. As a means of production, it is primarily involved in the secondary and tertiary industries [4]. Therefore, in this study, the EEBL of a city was defined as the ratio of the GDP in the secondary and tertiary industries to the area of built-up land.
where is the economic efficiency of built-up land of a city, is the GDP in the secondary and tertiary industries for a comparable price in 2000 of this city, is the area of built-up land of this city (calculated from land-use data). For example, the of Hefei in 2018 was equal to 416.61 (billion yuan), and the was equal to 2118.04 (km2). By calculation, the of Hefei in 2018 was 0.197 (billion yuan/km2).
2.3.3. Analysis of the Influence of the EEBL on the SUHII
This paper analyzed the influence of the EEBL on the SUHII from two aspects. First, the Spearman correlation coefficient was used to analyze the relationship between the EEBL and SUHII across cities in the YRDUA. Then, the trend of the SUHII with a rising EEBL (SUHII-EEBL trend) for each city in the YRDUA was examined using linear regression analysis, and the trend is represented as the slope of the regression equation. If the slope is positive, it denotes an increasing tendency in the SUHII with rising EEBL; conversely, a negative slope value indicates a cooling tendency. The greater the trend is, the greater the influence of the EEBL on the SUHII is.
2.3.4. Analysis of the Influence of the Electric Power Utilization Efficiency (EPUE) of the Secondary and Tertiary Industries on the SUHII-EEBL Trend
To investigate the underlying mechanism of the spatial variation in the SUHII-EEBL trend across cities, the EPUE of the secondary and tertiary industries was calculated as shown in Equation (3), and then the Spearman correlation coefficient was used to analyze the relationship between the EPUE of the secondary and tertiary industries and the SUHII-EEBL trend across cities in the YRDUA.
where is the GDP in the secondary and tertiary industries, and is the total electric power consumption of the secondary and tertiary industries.
3. Results
3.1. Spatiotemporal Patterns of EEBLs in the YRDUA from 2000 to 2018
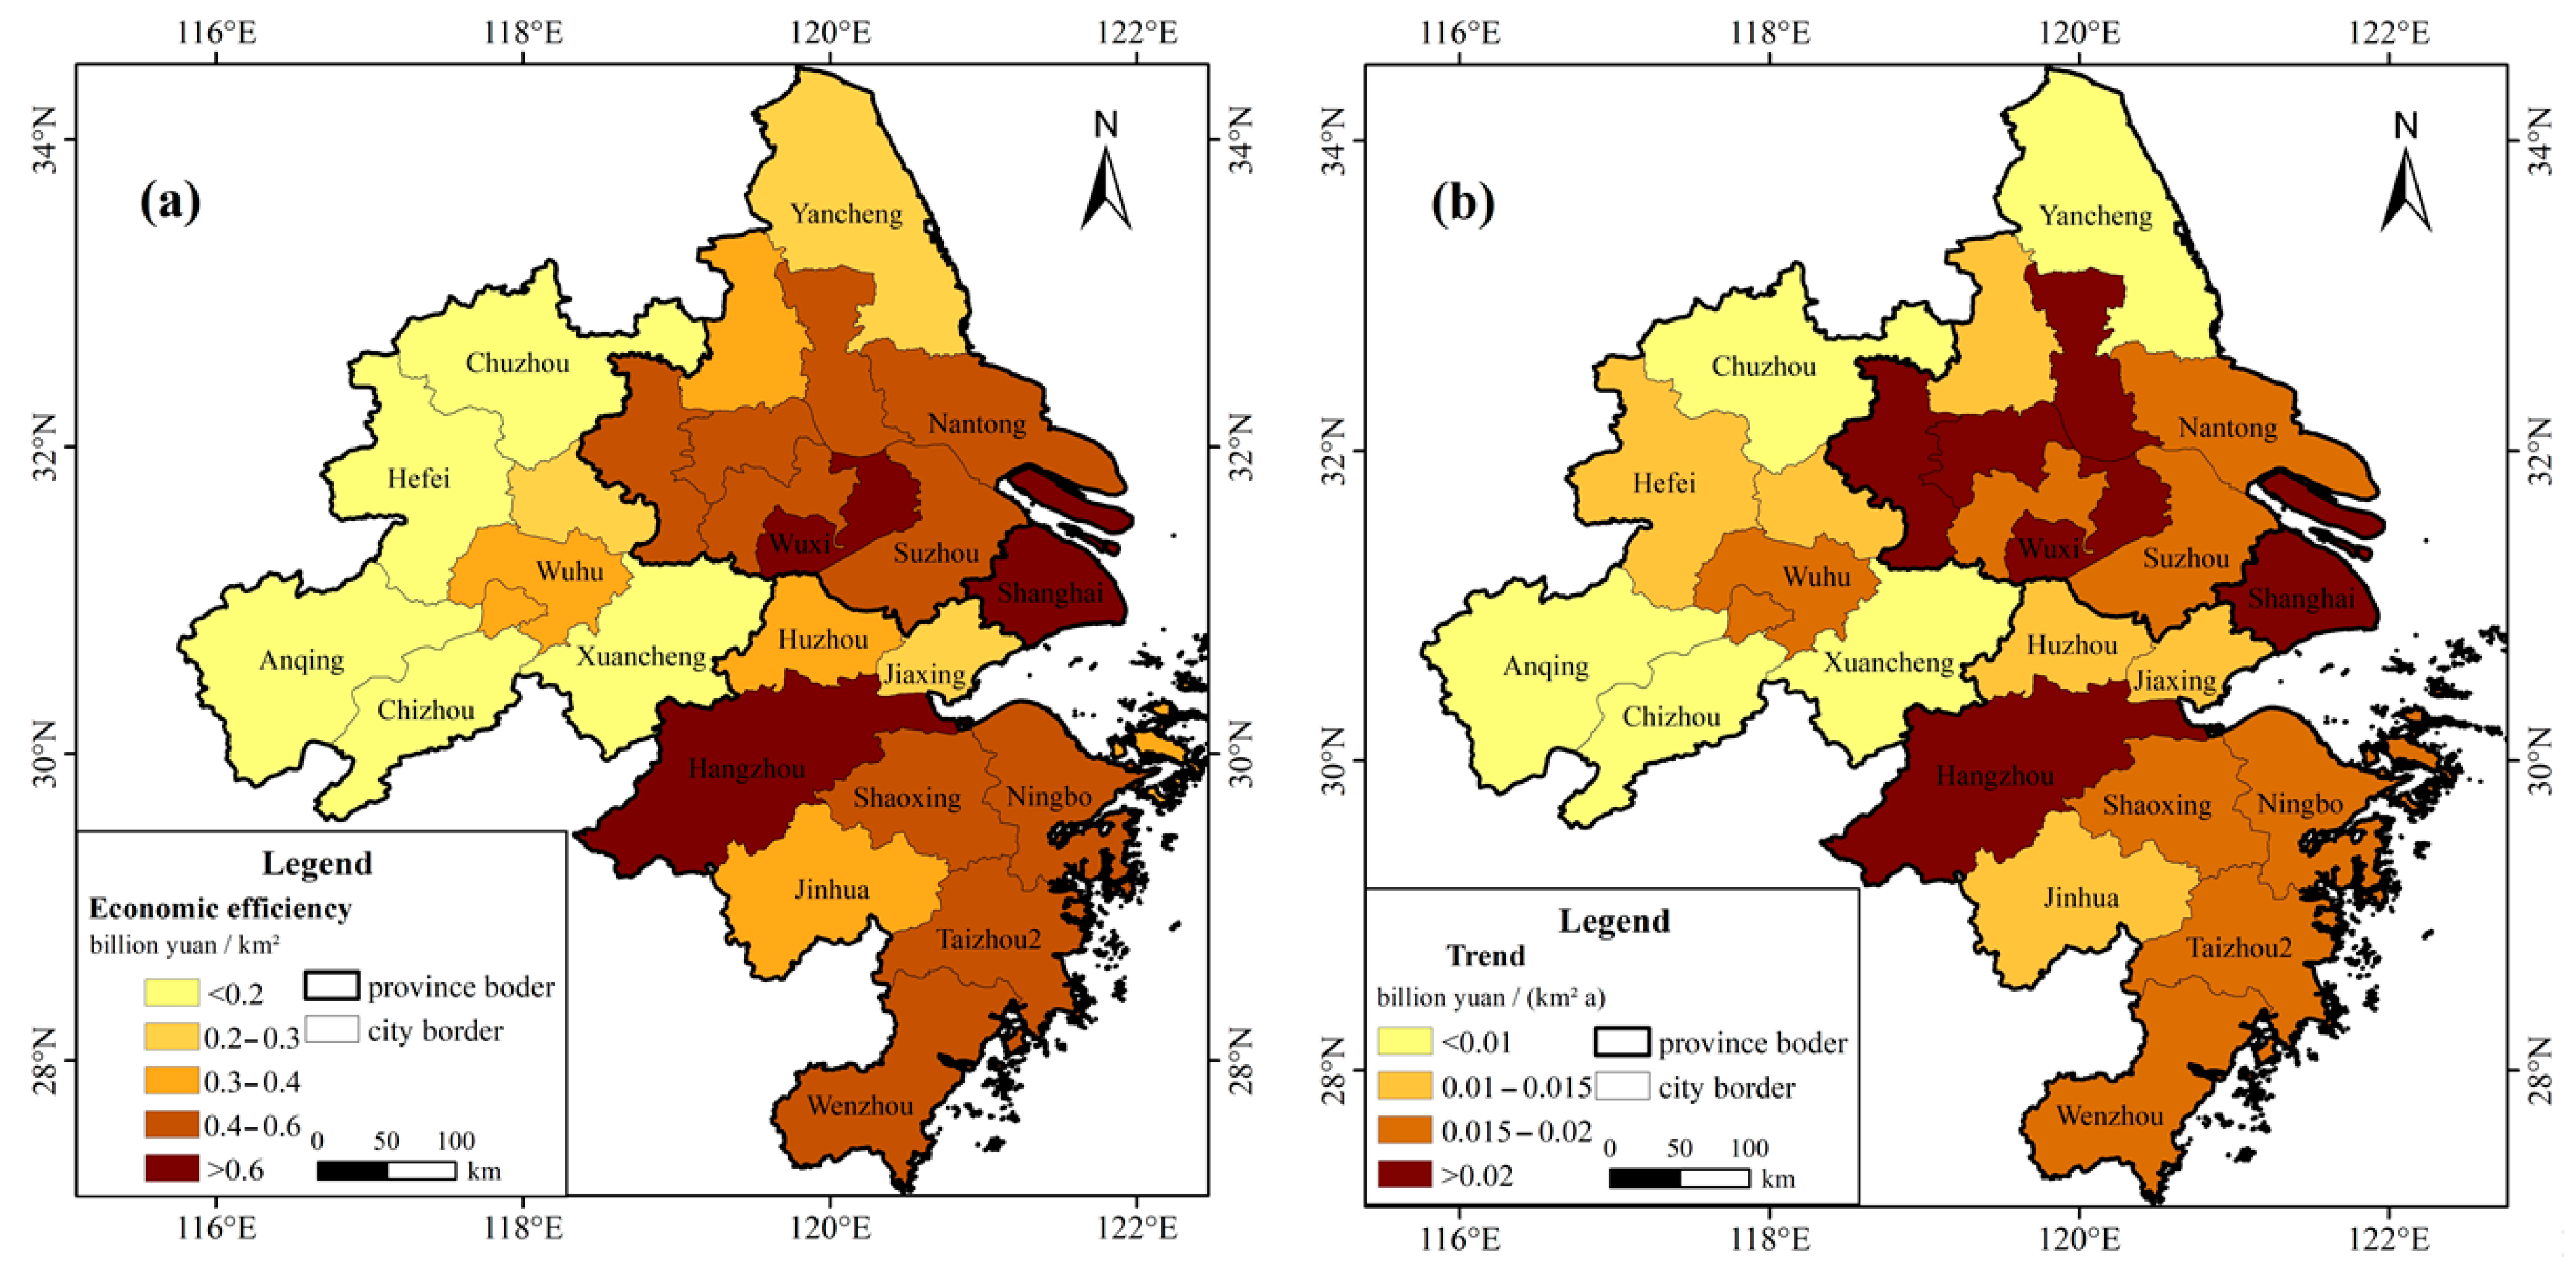
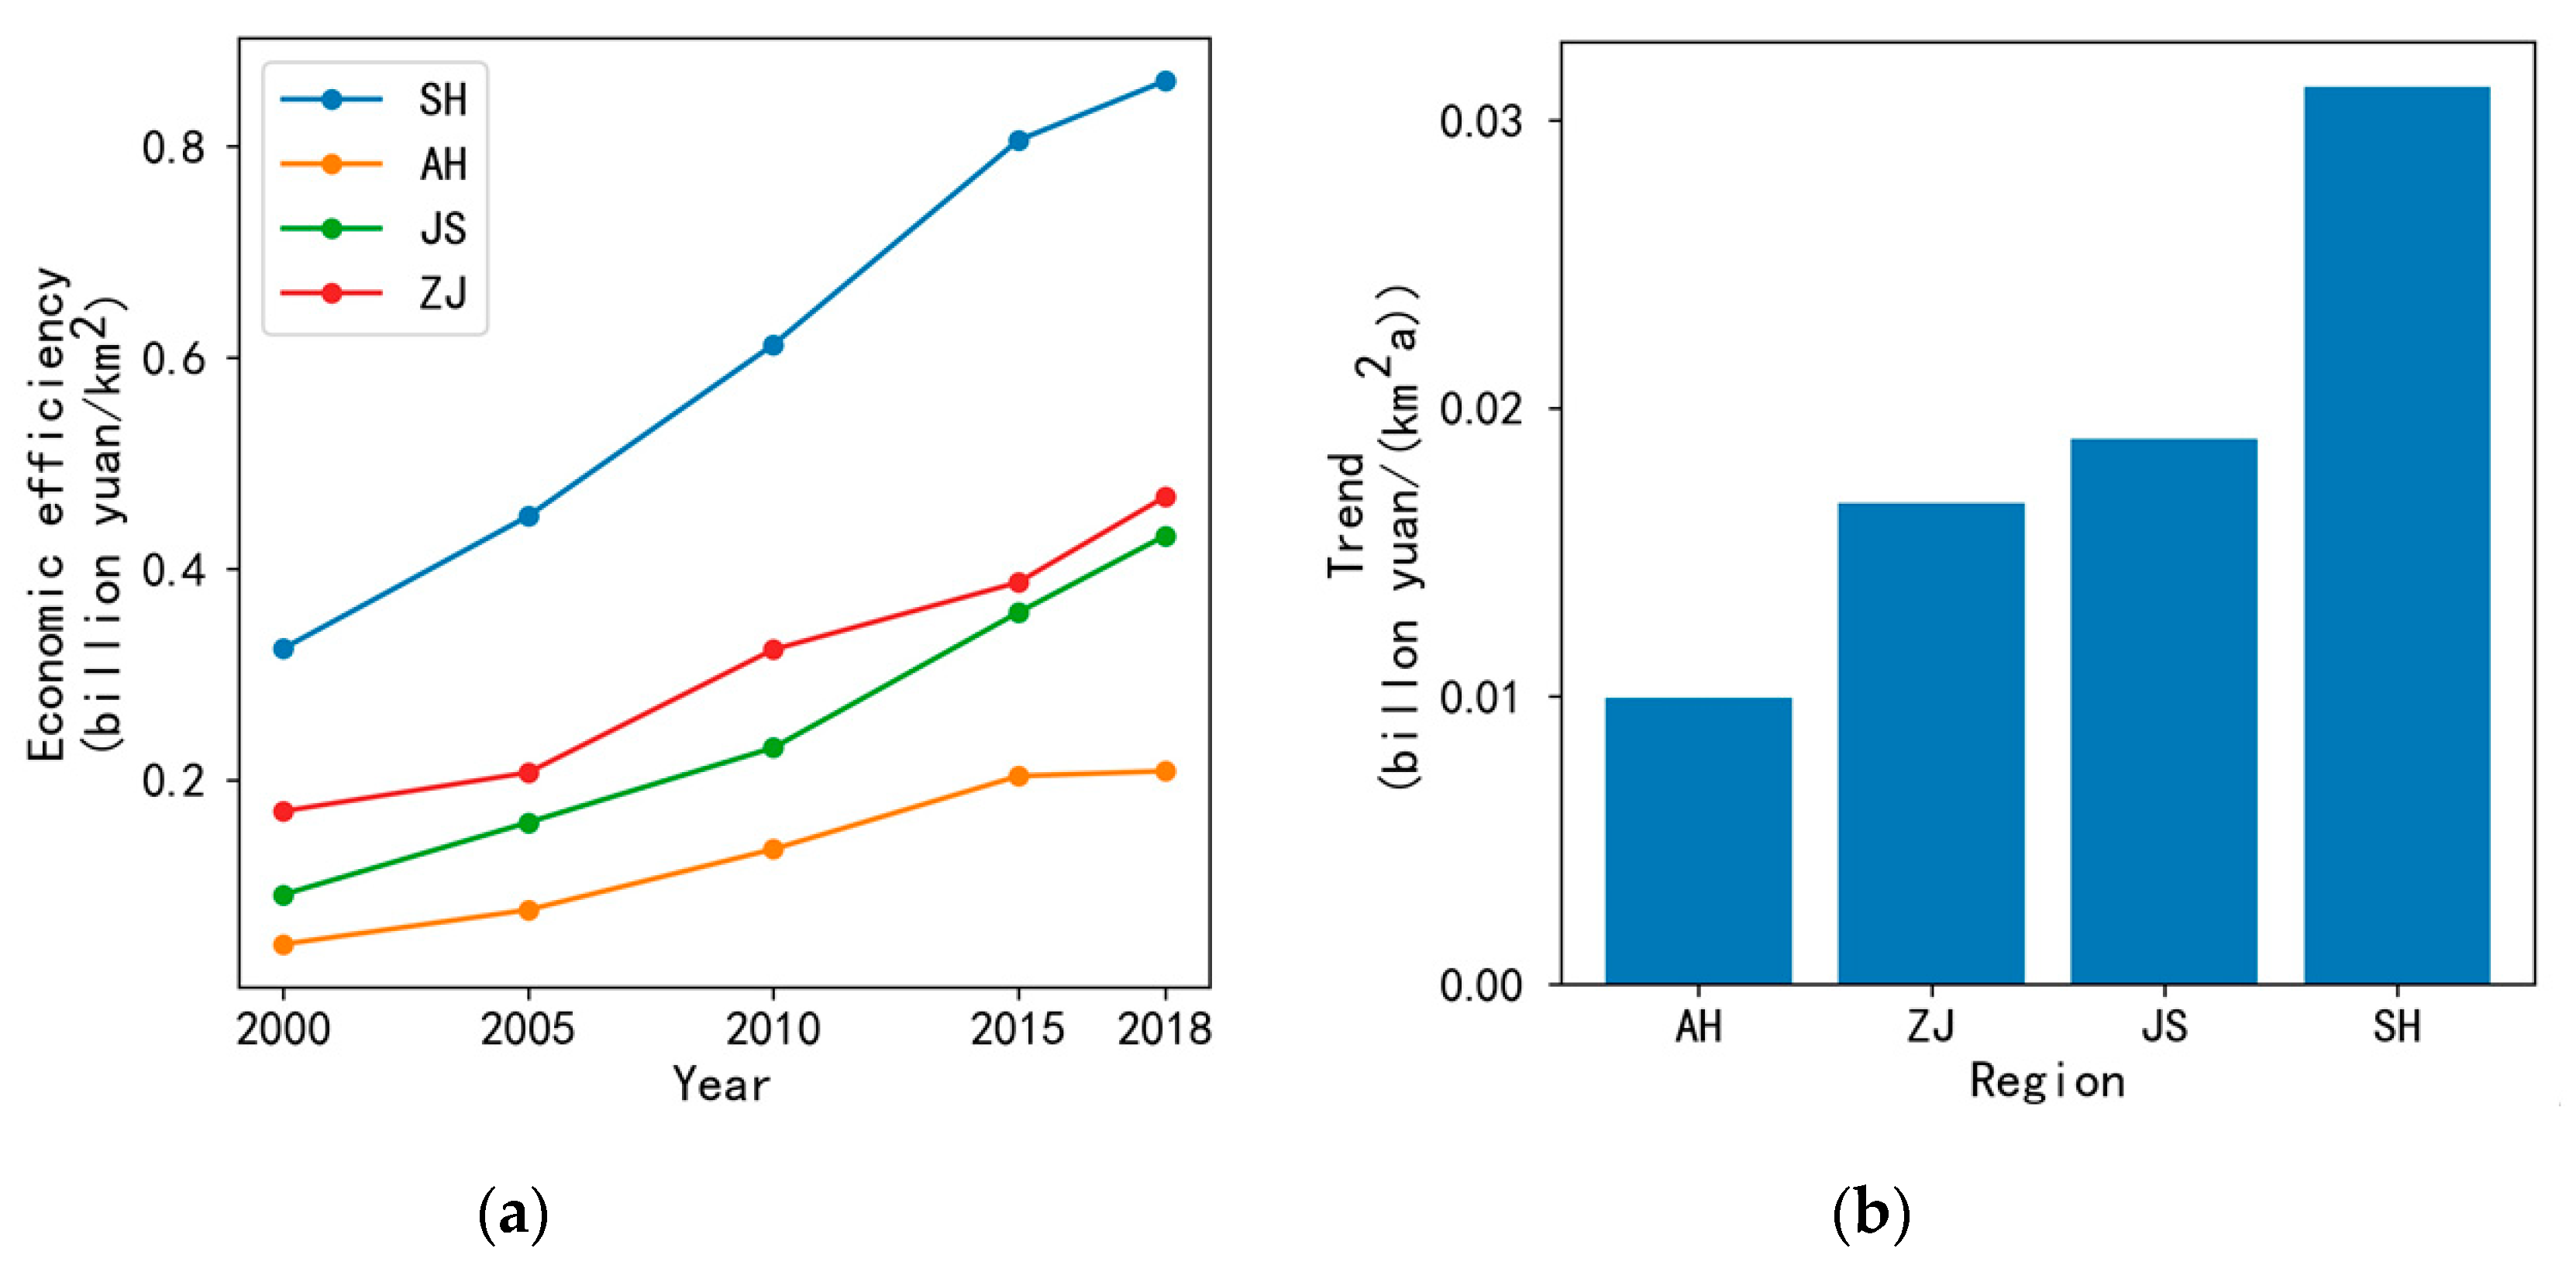
The EEBLs and their trends with time in the YRDUA showed obvious spatial heterogeneities (Figure 2). In 2018, Shanghai, Hangzhou of the Zhejiang region, and Wuxi of the Jiangsu region were the top three cities with the highest EEBLs (Figure 2a), with EEBLs were 0.86 (billion yuan/km2), 0.7 (billion yuan/km2), 0.64 (billion yuan/km2) respectively. However, the EEBL of Chuzhou was only 0.073 (billion yuan/km2) in 2018, which was the lowest and less than one-tenth of Shanghai’s EEBL. In the Anhui region, Tongling and Wuhu had the highest EEBLs, which were 0.36 (billion yuan/km2) and 0.35 (billion yuan/km2) respectively. From the perspective of the average EEBLs of regions in the YRDUA (Figure 3a), the average EEBL of Zhejiang was the highest, while that of Anhui was the lowest. Meanwhile, we found that the EEBL gap between cities in the YRDUA gradually widened, with the standard deviation increasing from 0.083 in 2000 to 0.186 in 2018. The EEBLs of cities in the YRDUA obviously inceased from 2000 to 2018 (Figure 2b). Among them, the EEBL of Shanghai increased the fastest at a rate of 0.03 (billion yuan/km2 a), while that of Chuzhou increased the slowest at a rate of 0.0036 (billion yuan/km2 a). In the Zhejiang region, the EEBL of Hangzhou increased the fastest at a rate of 0.026 (billion yuan/km2 a); in the Jiangsu region, the EEBL of Wuxi increased the fastest at a rate of 0.026 (billion yuan/ km2 a); in the Anhui region, the EEBL of Wuhu increased the fastest at a rate of 0.017 (billion yuan/km2 a) (Figure 3b). The rate of increase of the EEBLs of cities in the Jiangsu region were generally fast, with an average rate of increase of 0.019 (billion yuan/km2 a), while those of cities in the Anhui regional were generally slow, with an average rate increase of only 0.01 (billion yuan/km2 a).
3.2. Spatiotemporal Patterns of Annual SUHIIs in the YRDUA from 2000 to 2018
The UHI effect was obvious in the YRDUA (Figure 4). In 2018, more than 60% of cities had SUHIIs above 1 °C, among which Hangzhou had the highest SUHII at 3.9 °C and Chuzhou had the lowest SUHII at 0.65 °C (Figure 4a). Moreover, the SUHIIs of cities in the Zhejiang region were generally high, with an average SUHII of 2.67 °C, while that of cities in Jiangsu region were generally low, with an average SUHII of 1.06 °C. From 2000 to 2018, the SUHIIs of cities in the YRDUA increased to different degrees, among which the SUHII of Hangzhou increased the most, by 1.27 °C (Figure 4b). The SUHII increases of cities in the Zhejiang region were generally high, with an average SUHII increase of 1.27 °C, while that of cities in the Jiangsu region were generally low, with an average SUHII increase of 0.47 °C.
3.3. The Influence of the EEBL on the SUHII in the YRDUA
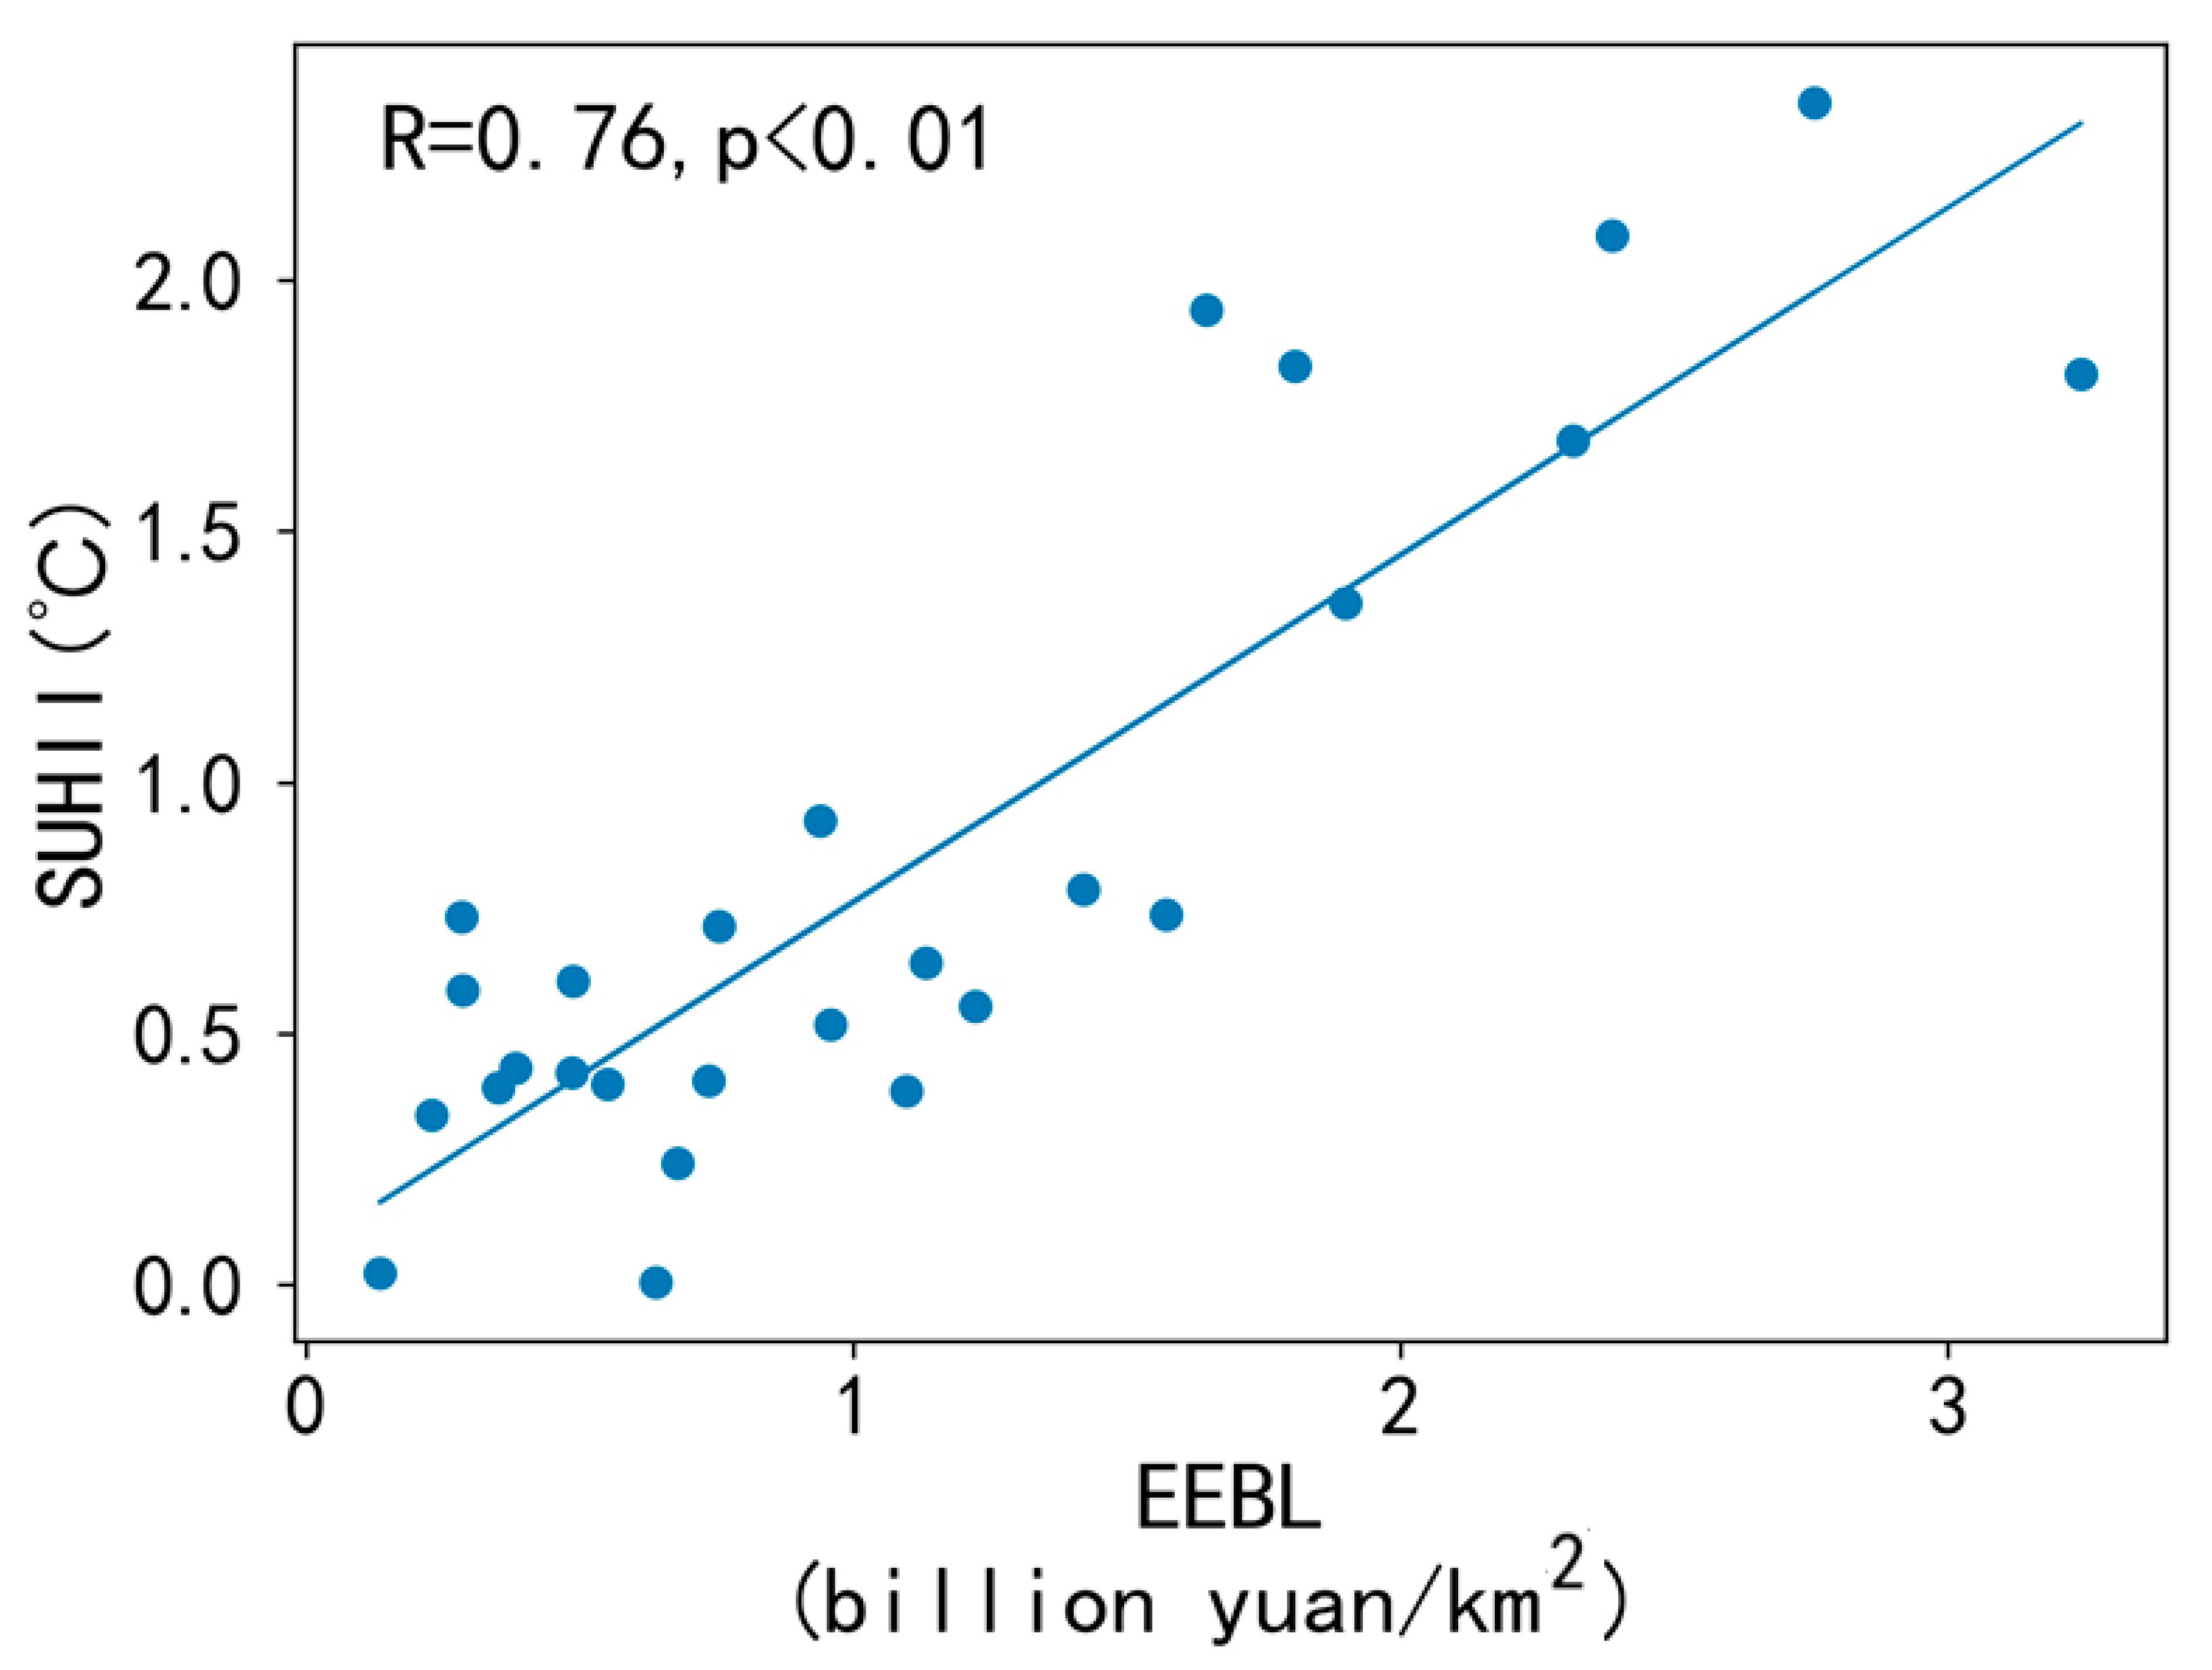
Compared with GDP in the secondary and tertiary industries and built-up areas, the EEBL always had a significant and positive correlation with the SUHII from 2000 to 2018 (Table 1). The SUHIIs of cities in the YRDUA had the strongest correlation (R = 0.76, p < 0.01) with the EEBL in 2000 (Figure 5), and then the correlation gradually waned. The secondary and tertiary industries outputs showed a weak but statistically significant correlation with the SUHII in 2000, 2005 and 2010, while the correlation was not significant in other years. Moreover, there was no significant correlation between the built-up land area and the SUHII.
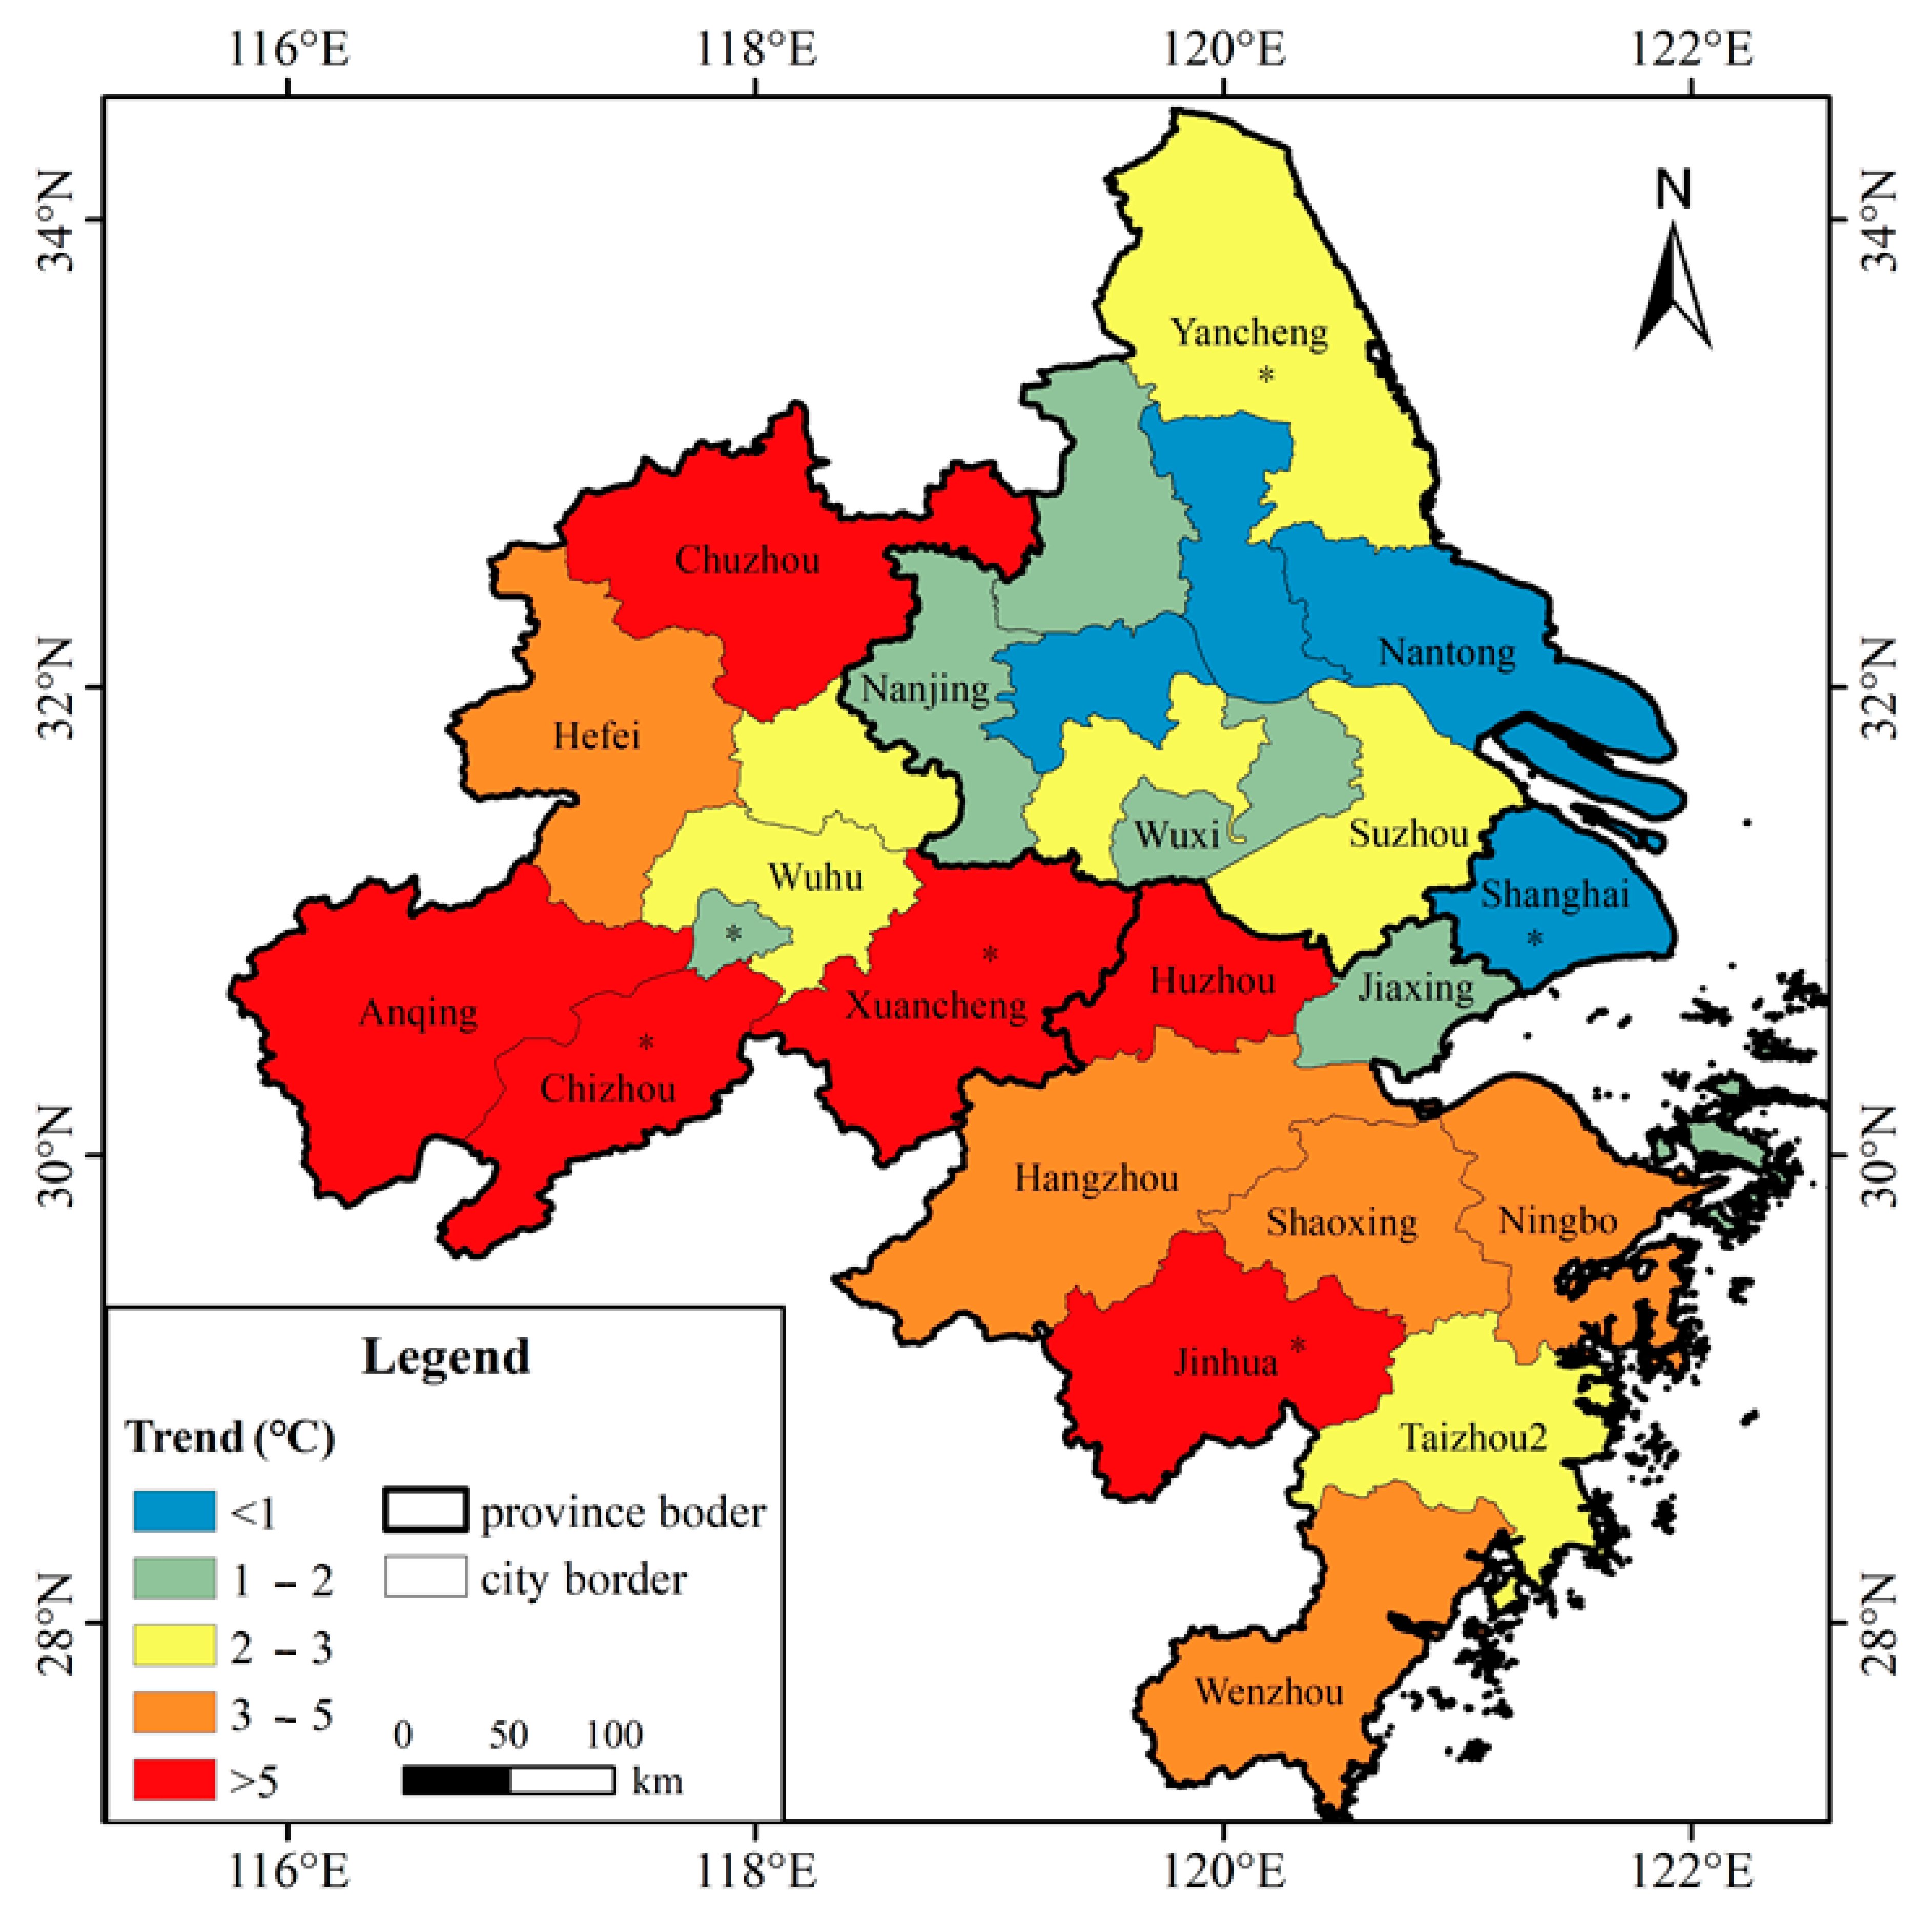
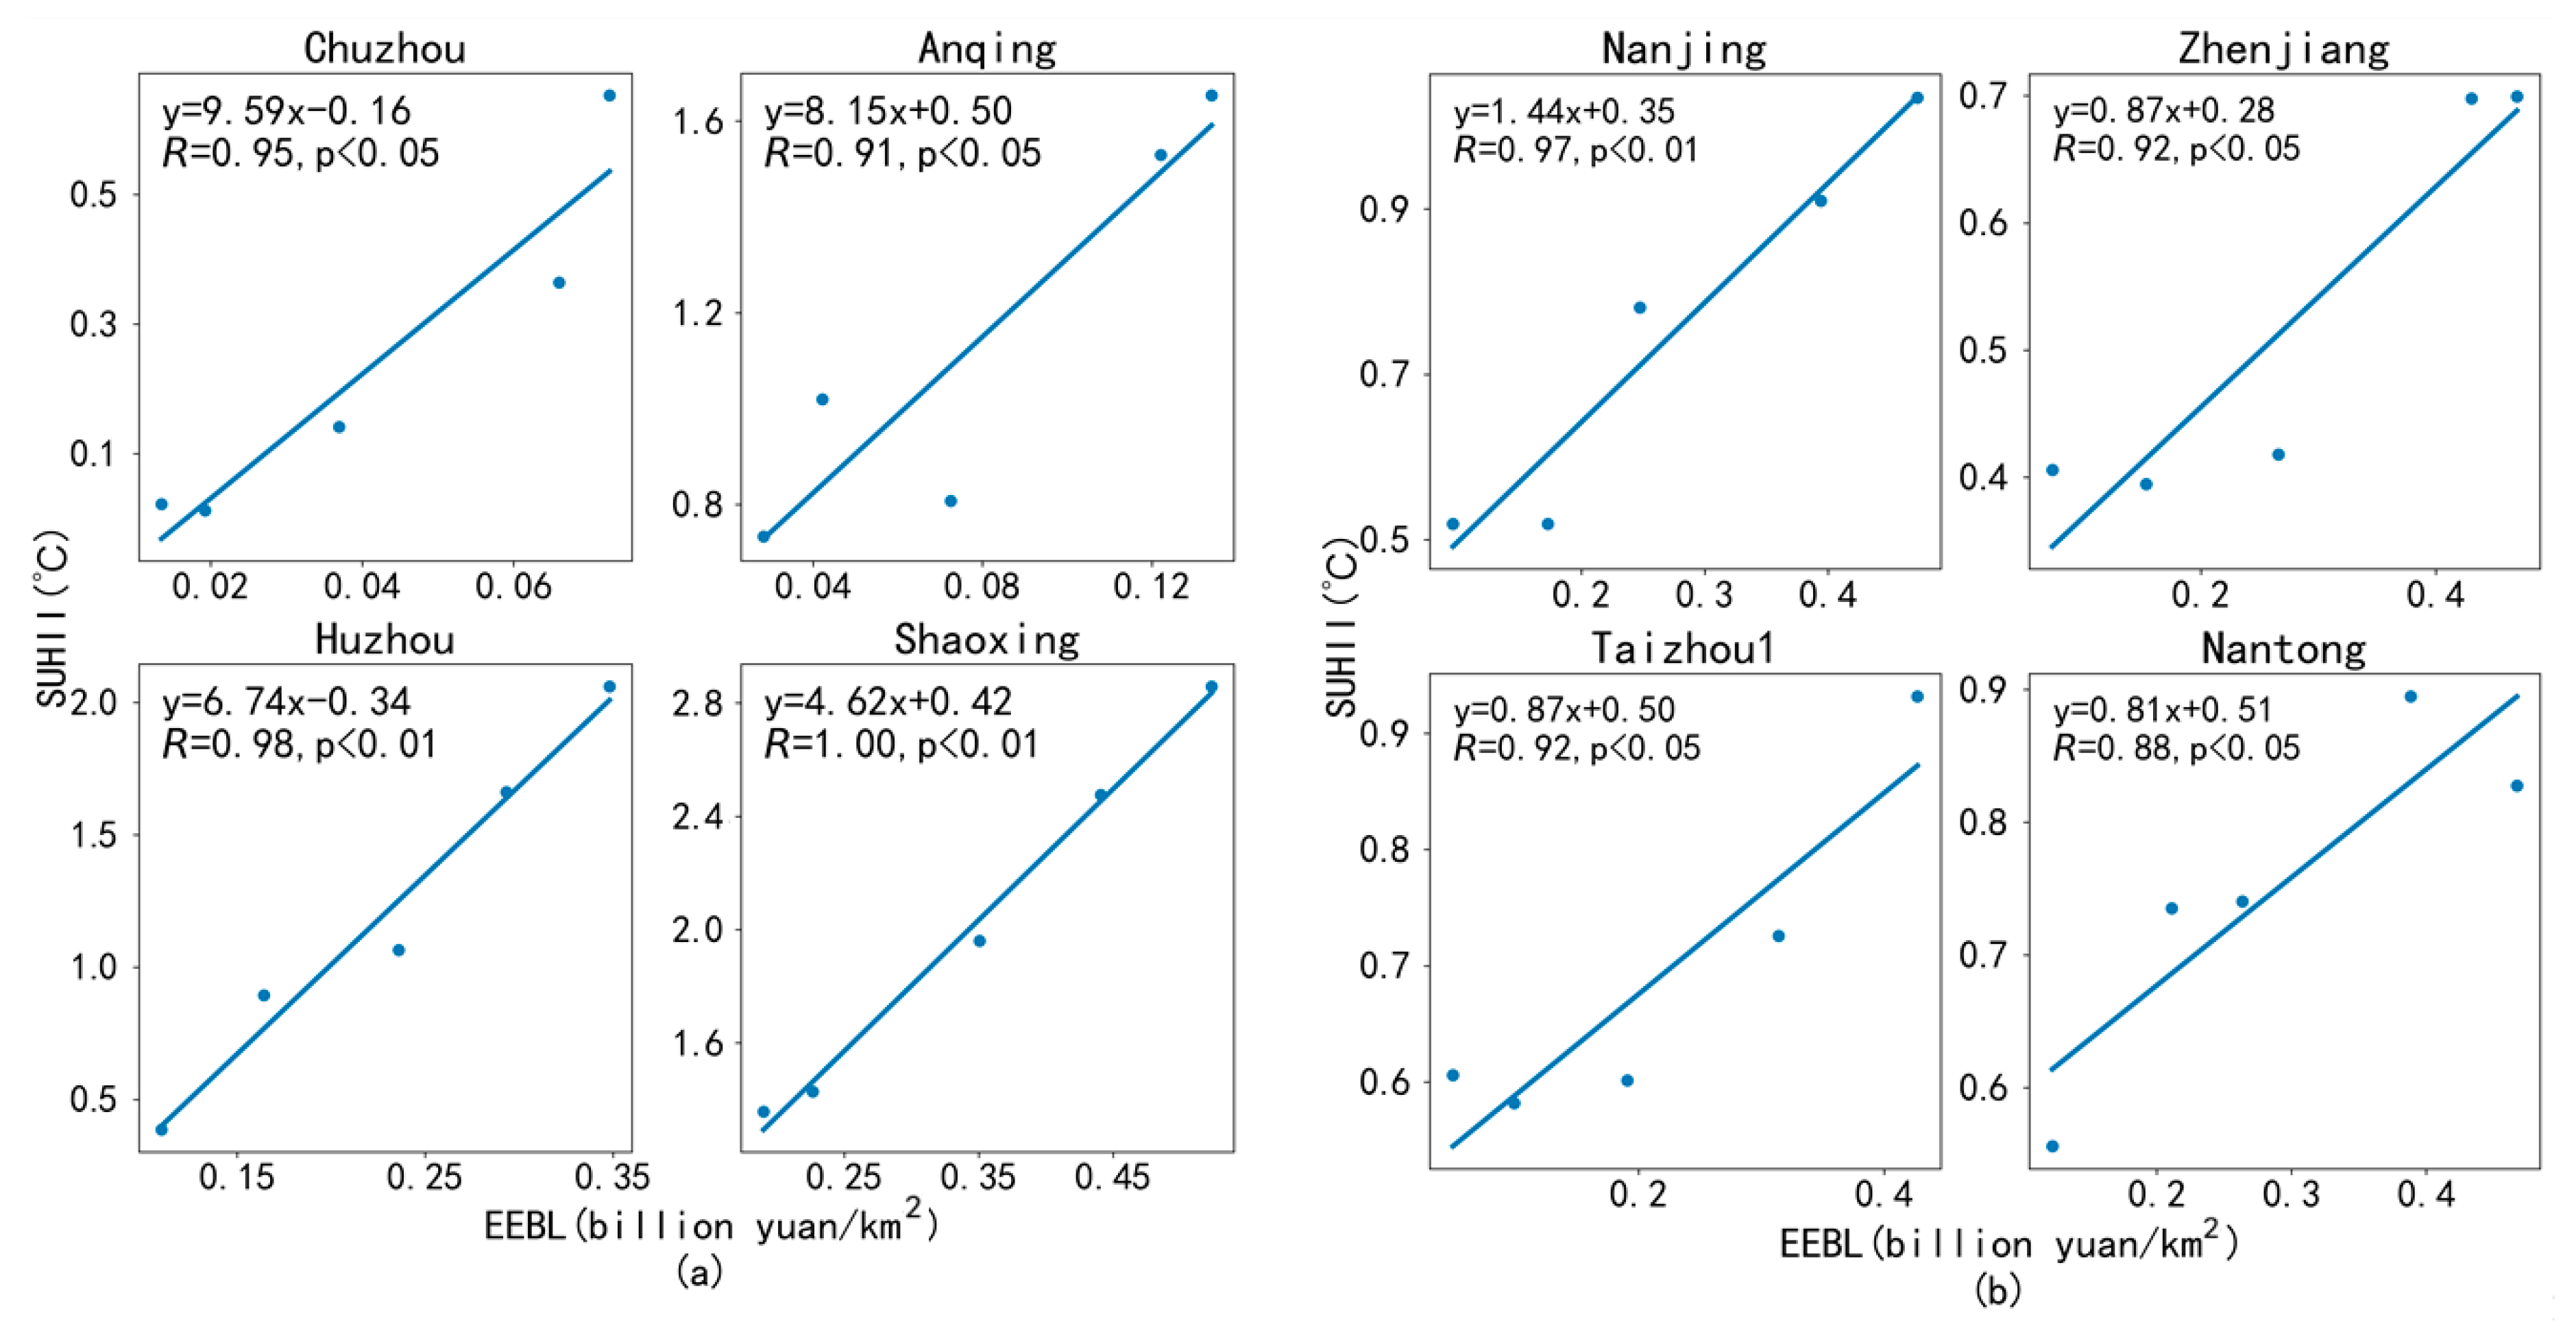
The SUHII of each city increased with rising EEBL but with different trends (Figure 6), and the SUHII-EEBL trends of 78% of cities in the YRDUA were statistically significant (p < 0.05). Among the cities with a significant SUHII-EEBL trend, Chuzhou, Anqing, Huzhou and Shaoxing were the four cities in which the SUHII increased most obviously with the EEBL, with linear trends of 9.59, 8.15, 6.74 and 4.62 respectively (Figure 7a). However, the SUHIIs of Nanjing, Zhenjiang, Taizhou and Nantong showed the least obvious upward trends with the EEBL, with linear trends of 1.44, 0.87, 0.87, and 0.81, respectively (Figure 7b). The SUHII-EEBL trends were generally higher in the cities of the Anhui region than in the cities of the Zhejiang or Jiangsu regions. The average SUHII-EEBL trends of the Anhui, Zhejiang and Jiangsu regions were 5.7, 4.1 and 1.5, respectively.
3.4. The Relationship between the EPUE of the Secondary and Tertiary Industries and SUHII-EEBL Trend
In terms of the energy consumption patterns (Figure 8), we found that the EPUE of the secondary and tertiary industries in the cities of the Anhui and Zhejiang regions was relatively low. The average EPUEs of the secondary and tertiary industries of the Jiangsu, Zhejiang and Anhui regions were 14.6 (yuan/kw h), 11.5 (yuan/kw h) and 9.4 (yuan/kw h), respectively.
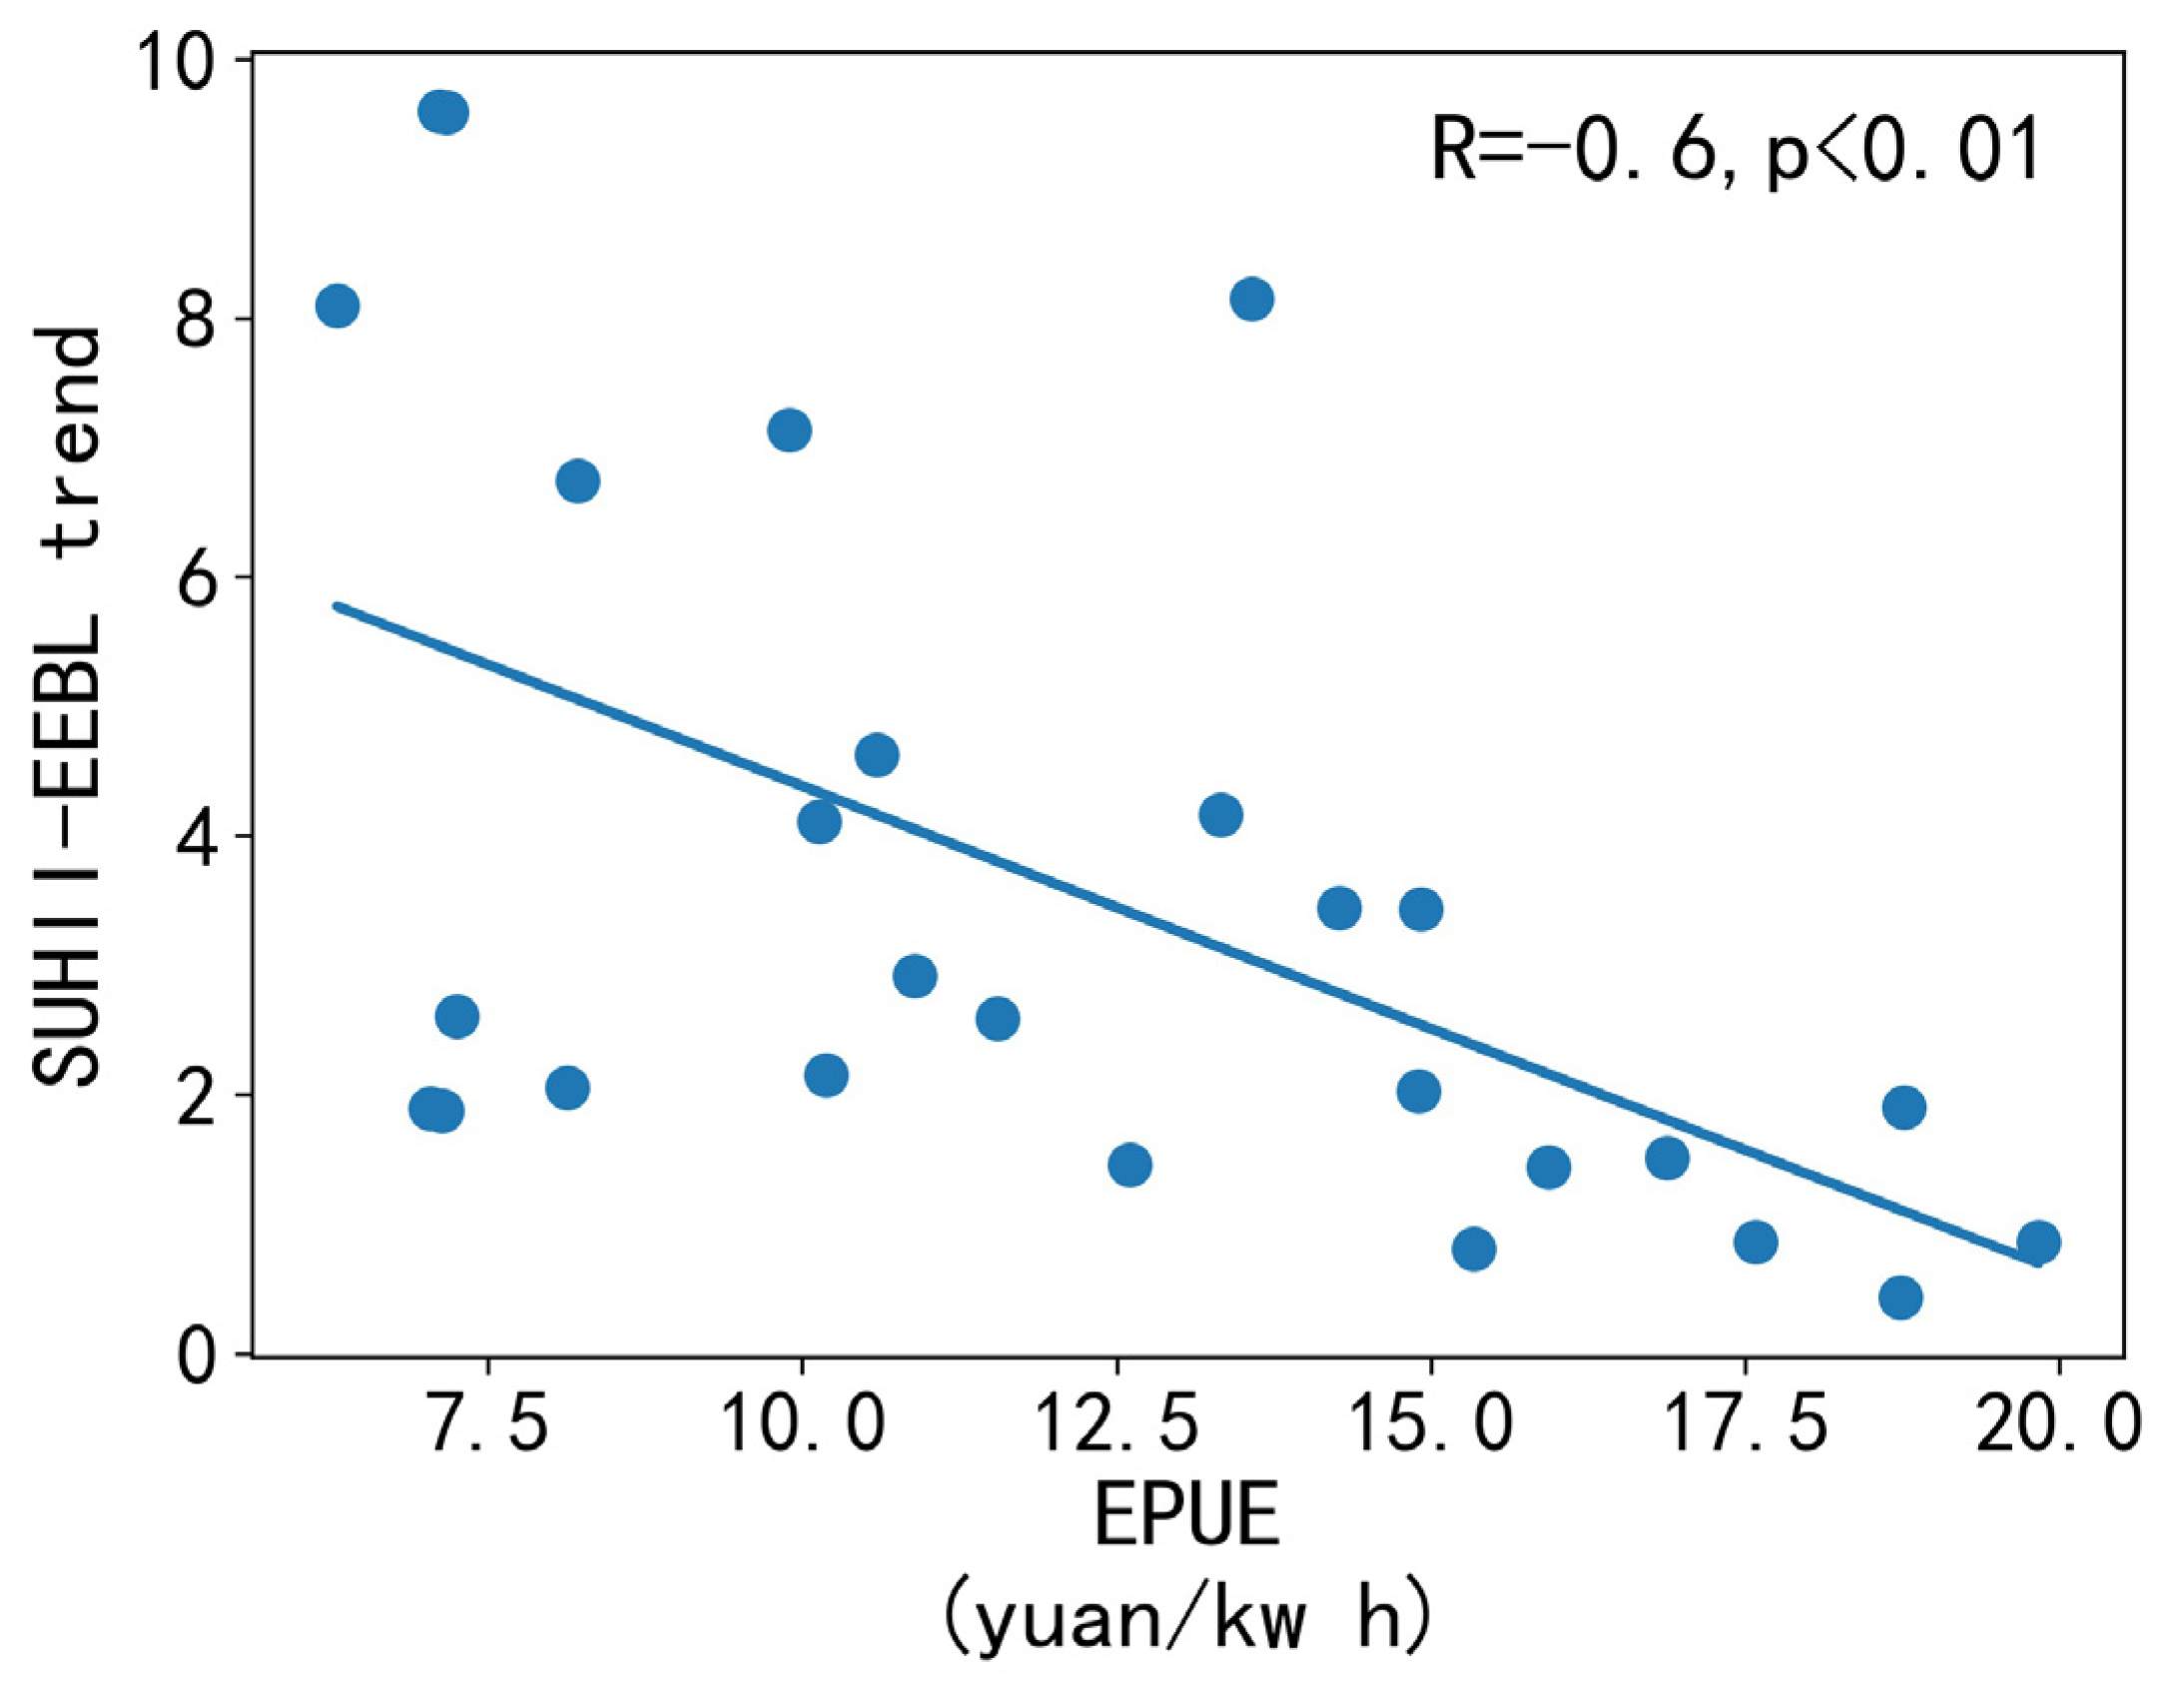
Among the cities in the YRDUA, Taizhou, Zhoushan and Shanghai were the three cities with the highest EPUEs of the secondary and tertiary industries, with EPUE values of 19.8 (yuan/kw h), 18.8 (yuan/kw h), and 18.7 (yuan/kw h), respectively. However, Tongling, Xuancheng and Jiaxing were the three cities with the lowest EPUEs of the secondary and tertiary industries, and their EPUEs in 2018 were 7.1 (yuan/kw h), 7.1 (yuan/kw h) and 7 (yuan/kw h), respectively. Moreover, we found the EPUE of the secondary and tertiary industries was significantly and negatively correlated with the SUHII-EEBL trend (R = −0.6, p < 0.01) (Figure 9).
4. Discussion
4.1. The Drivers of the SUHII Variations in Urban Agglomerations
With a sufficient industrial concentration and economy of scale, urban agglomerations will actively engage in global competition. Based on the United Nations forecast, by 2050, 18% of the total population will live in and 66% of global economic activities will occur in the largest 40 megalopolises or urban agglomerations [1]. Therefore, urban agglomerations will be significant to the competitiveness and sustainable development of a country. However, due to dense regional urbanization and highly intensive human activity, urban agglomerations are threatened by heat island effects. To alleviate the heat island effect caused by rapid urbanization, many studies have investigated the SUHII variation and its drivers in urban agglomerations. In terms of the spatial variations in the annual daytime SUHII, Zhou et al. [30] found that they were significantly and negatively correlated with ΔEVI (enhanced vegetation index differences between urban and rural areas) and solar radiation and positively linked to background precipitation or air temperature in the the YURDA. However, from the above results, we found that the EEBL also had a significant impact on the spatial and annual variation pattern of the SUHII, and the increase in the EEBL usually indicated there was an increase in the SUHII.
4.2. Anthropogenic Heat Emissions from the Secondary and Tertiary Industries
Various types of energy resources are consumed by the human society, all of which ultimately result in anthropogenic heat being released into the atmosphere [31]. Some studies have shown that approximately 73% of the energy consumed by industry is used as heat [32]. Built-up land is the most important place for urban economic activities, and economic activities tend to consume large amounts of energy, thus emitting large amounts of heat, especially in relation to the activities of secondary and tertiary industries. We found that the energy consumption of the secondary and tertiary industries accounts for a high proportion of the total energy consumption, with values of 83% and 89% for Anhui and Jiangsu Province in 2018, respectively (from the statistical yearbooks of Anhui and Jiangsu province). Therefore, we thought the EEBL could well reflect the intensity of urban anthropogenic heat emissions to some extent, which was one of the main reasons for the significant influence of the EEBL on the SUHII, although economic development would lead to the modification of urban morphology and land cover, which could also impact the air and surface temperatures [23].
Considering the availability of energy data, this paper collected electric power consumption data instead of total energy consumption data [7]. Based on limited energy consumption data (Figure 10), we found that total electricity power consumption had a significant correlation with total energy consumption in the cities of the YRUDA (R = 0.93, p < 0.01). Therefore, the consumption pattern of electric power could well represent the total energy consumption pattern. In addition, the energy consumption data used to calculate the EPUE in this paper refer only to the energy consumed by the secondary and tertiary industries and exclude the energy consumed by households and primary industry. We found that there was a significant and positive correlation between the EPUE of the secondary and tertiary industries and the SUHII-EEBL trend in the YRDUA(R = −0.6, p < 0.01), which indicated that the energy consumption pattern of the secondary and tertiary industries was very important to the thermal environment of the urban agglomeration (Figure 9). Therefore, improving the energy utilization efficiency of the secondary and tertiary industries, which means reducing anthropogenic heat emissions, is an effective way to alleviate the SUHII uptrend caused by rapid economic development. Adopting a more efficient technology or production process with waste heat recovery is key to reducing energy consumption and anthropogenic heat [32]. Governments also need to make policies to improve energy efficiency improvement to provide incentives for each possible technical improvement. Moreover, buildings are an important field for energy efficiency improvements because much of the economic activity takes place indoors [33]. For example, insulating a building allows it to use less heating and cooling energy to achieve and maintain a thermal comfort.
4.3. Limitations
This study has certain limitations, primarily related to data availability. First, to adapt to the land-use data with a resolution of 30 m, MODIS LST data were resampled from 1000 m to 30 m, which may produce uncertainty in the estimation of the SUHII. Second, the analysis in this paper reached only the level of prefecture-level cities. If the research scale is at the county level, the result may better reflect the influence of the EEBL on the SUHII in the YRDUA. Moreover, the discussion between the energy-use pattern, anthropogenic heat and the influence of the EEBL on the SUHII is still insufficient. If possible, further studies will use LST data with a lower spatial resolution or retrieve LST data by using Landsat images and use more accurate energy consumption data.
5. Conclusions
Based on land-use data, LST data and GDP in the secondary and tertiary industries and 2000 to 2018, and energy consumption data in 2018, this paper analyzed the spatiotemporal patterns of the EEBL and SUHII in the YRDUA and investigated the influence of the EEBL on the SUHII in terms of spatial heterogeneities and temporal variation. From the results the following conclusions can be put forth:
- (1)
- From 2000 to 2018, cities of the YRDUA experienced rapid EEBL growth, among which Hangzhou, Shanghai and Wuxi were the top three cities with the highest growth rates. These three cities were also the top three cities with the highest EEBLs. Moreover, cities of the YRDUA experienced an obvious increase in SUHII from 2000 to 2018, and cities in the Zhejiang region generally had a higher increase in SUHII, among which the increase in the SUHII of Hangzhou was the highest.
- (2)
- In terms of spatial heterogeneities, compared with indicators such as GDP and built-up area, the EEBL had a significant and positive correlation with SUHII over the years, among which the EEBL had the highest correlation (R = 0.76, p < 0.01) with the SUHII in 2000, which meant that the EEBL could reveal the spatial distribution characteristics of the SUHII in the YRDUA well.
- (3)
- In terms of temporal variation, the SUHII increased significantly (p < 0.05) with a rising EEBL along time for 21 out of 27 cities in the YRDUA. Moreover, the uptrends varied obviously between cities and had a significant and negative correlation with EPUE of the secondary and tertiary industries (R = −0.6, p < 0.01). These results indicated that improving the EPUE of the secondary and tertiary industries, which means reducing anthropogenic heat emissions, could effectively alleviate urban thermal environmental problems in the process of rapid development and promote the high-quality development of urban agglomerations.
Author Contributions
Data Curation, Z.S. and X.X.; Formal Analysis, Z.S.; Methodology, Z.S.; Writing, Z.S.; Review and Supervision, X.X. All authors have read and agreed to the published version of the manuscript.
Funding
This research was supported by the National Natural Science Foundation of China (No. 41971389) and the Strategic Priority Research Program of the Chinese Academy of Sciences (Grant No. XDA20010302).
Acknowledgments
The authors greatly appreciate the reviewers and the editors for their valuable and constructive comments and suggestions that improved the manuscript.
Conflicts of Interest
The authors declare no conflict of interest.
References
- Fang, C.; Yu, D. Urban agglomeration: An evolving concept of an emerging phenomenon. Landsc. Urban Plan. 2017, 162, 126–136. [Google Scholar] [CrossRef]
- Chu, Y.W. China’s new urbanization plan: Progress and structural constraints. Cities 2020, 103, 102736. [Google Scholar] [CrossRef]
- Zhai, G.; Li, S.; Chen, J. Reducing Urban Disaster Risk by Improving Resilience in China from a Planning Perspective. Hum. Ecol. Risk Assess. Int. J. 2015, 21, 1206–1217. [Google Scholar] [CrossRef]
- Chen, Y.; Chen, Z.; Xu, G.; Tian, Z. Built-up land efficiency in urban China: Insights from the General Land Use Plan (2006–2020). Habitat Int. 2016, 51, 31–38. [Google Scholar] [CrossRef]
- Jia, W.; Zhao, S. Trends and drivers of land surface temperature along the urban-rural gradients in the largest urban agglomeration of China. Sci. Total Environ. 2020, 711, 134579. [Google Scholar] [CrossRef] [PubMed]
- Fang, C.; Mao, Q.; Ni, P. Discussion on the scientific selection and development of China’s urban agglomerations. Acta Geogr. Sin. 2015, 4, 515–527. [Google Scholar]
- Chen, W.; Wu, Q. Economic efficiency of urban construction land and its influential factors in Yangtze River Delta. Econ. Geogr. 2014, 34, 142–149. [Google Scholar]
- Fang, C.; Zhou, C.; Gu, C.; Chen, L.; Li, S. Theoretical analysis of interactive coupled effects between urbanization and eco-environment in mega-urban agglomerations. Acta Geogr. Sin. 2016, 71, 531–550. [Google Scholar] [CrossRef]
- Holz, C.A. Chinese statistics: Classification systems and data sources. Eurasian Geogr. Econ. 2013, 54, 532–571. [Google Scholar] [CrossRef] [Green Version]
- Yao, Y.; Chen, X.; Qian, J. Research progress on the thermal environment of the urban surfaces. Acta Ecol. Sin. 2018, 38, 1134–1147. [Google Scholar]
- Cao, Z.; Wu, Z.; Liu, L.; Chen, Y.; Zou, Y. Assessing the relationship between anthropogenic heat release warming and building characteristics in Guangzhou: A sustainable development perspective. Sci. Total Environ. 2019, 695, 133759. [Google Scholar] [CrossRef]
- Du, H.; Wang, D.; Wang, Y.; Zhao, X.; Qin, F.; Jiang, H.; Cai, Y. Influences of land cover types, meteorological conditions, anthropogenic heat and urban area on surface urban heat island in the Yangtze River Delta Urban Agglomeration. Sci. Total Environ. 2016, 571, 461–470. [Google Scholar] [CrossRef] [PubMed]
- Yang, Q.; Xin, H.; Tang, Q. The footprint of urban heat island effect in 302 Chinese cities: Temporal trends and associated factors. Sci. Total Environ. 2019, 655, 652–662. [Google Scholar] [CrossRef] [PubMed]
- Oke, T.R. The energetic basis of the urban heat island. Q. J. R. Meteorol. Soc. 1982, 108, 1–24. [Google Scholar] [CrossRef]
- Rizwan, A.M.; Dennis, L.Y.C.; Liu, C. A review on the generation, determination and mitigation of urban heat island. J. Environ. Sci. 2008, 20, 120–128. [Google Scholar] [CrossRef]
- He, B.-J. Potentials of meteorological characteristics and synoptic conditions to mitigate urban heat island effects. Urban Clim. 2018, 24, 26–33. [Google Scholar] [CrossRef]
- Peng, S.; Piao, S.; Ciais, P.; Friedlingstein, P.; Ottle, C.; Bréon, F.; Nan, H.; Zhou, L.; Myneni, R. Surface urban Heat Island across 419 global big cities. Environ. Sci. Technol. 2012, 46, 696–703. [Google Scholar] [CrossRef] [PubMed]
- Zhou, D.; Xiao, J.; Bonafoni, S.; Berger, C.; Deilami, K.; Zhou, Y.; Frolking, S.; Yao, R.; Qiao, Z.; Sobrino, J.A. Satellite Remote Sensing of Surface Urban Heat Islands: Progress, Challenges, and Perspectives. Remote Sens. 2019, 11, 48. [Google Scholar] [CrossRef] [Green Version]
- Zhao, G.; Dong, J.; Liu, J.; Zhai, J.; Cui, Y.; He, T.; Xiao, X. Different patterns in daytime and nighttime thermal effects of urbanization in Beijing-Tianjin-Hebei urban agglomeration. Remote Sens. 2017, 9, 121. [Google Scholar] [CrossRef] [Green Version]
- Zhou, D.; Zhang, L.; Hao, L.; Liu, Y.; Zhu, C. Spatiotemporal trends of urban heat island effect along the urban development intensity gradient in China. Sci. Total Environ. 2016, 544, 617–626. [Google Scholar] [CrossRef]
- Manoli, G.; Fatichi, S.; Schläpfer, M.; Yu, K.; Crowther, T.W.; Meili, N.; Burlando, P.; Katul, G.G.; Bou-Zeid, E. Magnitude of urban heat islands largely explained by climate and population. Nature 2019, 573, 55–60. [Google Scholar] [CrossRef]
- Zhou, B.; Rybski, D.; Kropp, J.P. The role of city size and urban form in the surface urban heat island. Sci. Rep. 2017, 7, 4791. [Google Scholar] [CrossRef]
- Liu, H.; Huang, B.; Yang, C. Assessing the Coordination between Economic Growth and Urban Climate Change in China from 2000 to 2015. Sci. Total Environ. 2020, 732, 139283. [Google Scholar] [CrossRef] [PubMed]
- Zhang, Q.; Wu, Z.; Yu, H.; Zhu, X.; Shen, Z. Variable Urbanization Warming Effects across Metropolitans of China and Relevant Driving Factors. Remote Sens. 2020, 12, 1500. [Google Scholar] [CrossRef]
- Feng, Y.; Cao, C.; Tong, X.; Chen, S.; Lei, Z.; Wang, J. Spatial patterns of land surface temperature and their influencing factors: A case study in Suzhou, China. Remote Sens. 2019, 11, 182. [Google Scholar] [CrossRef] [Green Version]
- Ning, J.; Liu, J.; Kuang, W.; Xu, X.; Zhang, S.; Yan, C.; Li, R.; Wu, S.; Hu, Y.; Du, G.; et al. Spatiotemporal patterns and characteristics of land-use change in China during 2010–2015. J. Geogr. Sci. 2018, 28, 547–562. [Google Scholar] [CrossRef] [Green Version]
- Liu, J.; Liu, M.; Tian, H.; Zhuang, D.; Zhang, Z.; Zhang, W.; Tang, X.; Deng, X. Spatial and temporal patterns of China’s cropland during 1990–2000: An analysis based on Landsat TM data. Remote Sens. Environ. 2005, 98, 442–456. [Google Scholar] [CrossRef]
- Wang, Z.; Wang, X.; Liang, L. Green economic efficiency in the Yangtze River Delta: Spatiotemporal evolution and influencing factors. Ecosyst. Health Sustain. 2019, 5, 20–35. [Google Scholar] [CrossRef] [Green Version]
- Zhou, D.; Zhao, S.; Zhang, L.; Sun, G.; Liu, Y. The footprint of urban heat island effect in China. Sci. Rep. 2015, 5, 11160. [Google Scholar] [CrossRef]
- Zhou, D.; Bonafoni, S.; Zhang, L.; Wang, R. Remote sensing of the urban heat island effect in a highly populated urban agglomeration area in East China. Sci. Total Environ. 2018, 628, 415–429. [Google Scholar] [CrossRef]
- Chen, B.; Wu, C.; Liu, X.; Chen, L.; Wu, J.; Yang, H.; Luo, T.; Wu, X.; Jiang, Y.; Jiang, L.; et al. Seasonal climatic effects and feedbacks of anthropogenic heat release due to global energy consumption with CAM5. Clim. Dyn. 2019, 52, 6377–6390. [Google Scholar] [CrossRef]
- Chowdhury, J.I.; Hu, Y.; Haltas, I.; Balta-Ozkan, N.; Matthew, G., Jr.; Varga, L. Reducing industrial energy demand in the UK: A review of energy efficiency technologies and energy saving potential in selected sectors. Renew Sustain. Energy Rev. 2018, 94, 1153–1178. [Google Scholar] [CrossRef]
- Amecke, H. Buildings Energy Efficiency in China, Germany, and the United States; Climate Policy Initiative: San Francisco, CA, USA, 2013. [Google Scholar]
Figure 1.
Study area: (a) spatial distribution of land-use types in 2018; (b) cities in the YURDA; (c) the location of the YURDA in China and world (data source: http://www.resdc.cn/).
Figure 1.
Study area: (a) spatial distribution of land-use types in 2018; (b) cities in the YURDA; (c) the location of the YURDA in China and world (data source: http://www.resdc.cn/).

Figure 2.
Spatiotemporal patterns of EEBLs in the YRDUA from 2000 to 2018. (a) EEBLs in 2018; (b) linear trends of EEBL with rising years.
Figure 2.
Spatiotemporal patterns of EEBLs in the YRDUA from 2000 to 2018. (a) EEBLs in 2018; (b) linear trends of EEBL with rising years.

Figure 3.
(a)The EEBLs for regions of the YRDUA from 2000 to 2018; (b) the average EEBL trends for regions.
Figure 3.
(a)The EEBLs for regions of the YRDUA from 2000 to 2018; (b) the average EEBL trends for regions.

Figure 4.
Spatiotemporal patterns of SUHIIs in the YRDUA from 2000 to 2018. (a) SUHIIs in 2018; (b) SUHII difference between 2018 and 2000.
Figure 4.
Spatiotemporal patterns of SUHIIs in the YRDUA from 2000 to 2018. (a) SUHIIs in 2018; (b) SUHII difference between 2018 and 2000.

Figure 5.
Scatterplot and Spearman correlation coefficient (R) of the SUHII and EEBL of cities in the YRDUA in 2000.
Figure 5.
Scatterplot and Spearman correlation coefficient (R) of the SUHII and EEBL of cities in the YRDUA in 2000.

Figure 6.
The SUHII-EEBL trends of cities in the YRDUA from 2000 to 2018 (* indicates an insignificant correlation at the 0.05 level).
Figure 6.
The SUHII-EEBL trends of cities in the YRDUA from 2000 to 2018 (* indicates an insignificant correlation at the 0.05 level).

Figure 7.
(a) The four cities with the highest SUHII-EEBL trends and (b) the four cities with the lowest SUHII-EEBL trends.
Figure 7.
(a) The four cities with the highest SUHII-EEBL trends and (b) the four cities with the lowest SUHII-EEBL trends.

Figure 8.
The EPUE of the secondary and tertiary industries of the YRDUA in 2018.

Figure 9.
Scatterplot and Spearman correlation coefficient (R) of the SUHII-EEBL trend and EPUE of the secondary and tertiary industries.
Figure 9.
Scatterplot and Spearman correlation coefficient (R) of the SUHII-EEBL trend and EPUE of the secondary and tertiary industries.

Figure 10.
Scatterplot and Spearman correlation coefficient (R) of total electric power consumption and total energy consumption of some cities in the YRDUA.
Figure 10.
Scatterplot and Spearman correlation coefficient (R) of total electric power consumption and total energy consumption of some cities in the YRDUA.


Table 1.
The Spearman coefficient between the SUHII and GDP in the secondary and tertiary industries, built-up land, and the EEBL across cities in the YRDUA from 2000 to 2018.
Table 1.
The Spearman coefficient between the SUHII and GDP in the secondary and tertiary industries, built-up land, and the EEBL across cities in the YRDUA from 2000 to 2018.
| Year | GDP in the Secondary and Tertiary Industries (Billion Yuan) | GDP in the Secondary Industries (Billion Yuan) | GDP in the Tertiary Industries Output (Billion Yuan) | Built-Up Land Area (km2) | EEBL (Billion Yuan/km2) |
|---|---|---|---|---|---|
| 2000 | 0.52 ** | 0.53 ** | 0.50 ** | −0.22 | 0.76 ** |
| 2005 | 0.50 ** | 0.51 ** | 0.49 ** | −0.08 | 0.68 ** |
| 2010 | 0.57 ** | 0.51 ** | 0.58 ** | −0.009 | 0.69 ** |
| 2015 | 0.26 | 0.23 | 0.31 | −0.09 | 0.49 ** |
| 2018 | 0.19 | 0.16 | 0.22 | −0.18 | 0.45 * |
* indicates a significant correlation at the 0.05 level; ** indicates a significant correlation at the 0.01 level.
Publisher’s Note: MDPI stays neutral with regard to jurisdictional claims in published maps and institutional affiliations. |
© 2020 by the authors. Licensee MDPI, Basel, Switzerland. This article is an open access article distributed under the terms and conditions of the Creative Commons Attribution (CC BY) license (http://creativecommons.org/licenses/by/4.0/).
Share and Cite
MDPI and ACS Style
Shen, Z.; Xu, X. Influence of the Economic Efficiency of Built-Up Land (EEBL) on Urban Heat Islands (UHIs) in the Yangtze River Delta Urban Agglomeration (YRDUA). Remote Sens. 2020, 12, 3944. https://doi.org/10.3390/rs12233944
AMA Style
Shen Z, Xu X. Influence of the Economic Efficiency of Built-Up Land (EEBL) on Urban Heat Islands (UHIs) in the Yangtze River Delta Urban Agglomeration (YRDUA). Remote Sensing. 2020; 12(23):3944. https://doi.org/10.3390/rs12233944
Chicago/Turabian StyleShen, Zhicheng, and Xinliang Xu. 2020. "Influence of the Economic Efficiency of Built-Up Land (EEBL) on Urban Heat Islands (UHIs) in the Yangtze River Delta Urban Agglomeration (YRDUA)" Remote Sensing 12, no. 23: 3944. https://doi.org/10.3390/rs12233944
Note that from the first issue of 2016, this journal uses article numbers instead of page numbers. See further details here.