Next Article in Journal
Accuracy Assessment of GEDI Terrain Elevation and Canopy Height Estimates in European Temperate Forests: Influence of Environmental and Acquisition Parameters
Previous Article in Journal
Stand Characterization of Eucalyptus spp. Plantations in Uruguay Using Airborne Lidar Scanner Technology
 
 
Erratum published on 17 June 2021, see Remote Sens. 2021, 13(12), 2362.
Technical Note

Studying the Regional Transmission and Inferring the Local/External Contribution of Fine Particulate Matter Based on Multi-Source Observation: A Case Study in the East of North China Plain

1
State Environment Protection Key Laboratory of Satellite Remote Sensing, Aerospace Information Research Institute, Chinese Academy of Sciences, Beijing 100049, China
2
University of Chinese Academy of Sciences, Beijing 100049, China
3
School of Remote Sensing and Information Engineering, North China Institute of Aerospace Engineering, Langfang 065000, China
*
Author to whom correspondence should be addressed.
Remote Sens. 2020, 12(23), 3936; https://doi.org/10.3390/rs12233936
Submission received: 23 October 2020 / Revised: 24 November 2020 / Accepted: 30 November 2020 / Published: 2 December 2020
(This article belongs to the Section Atmospheric Remote Sensing)

Abstract

:
The regional transmission characteristics as well as the local emission and external transmission contribution of fine particulate matter in the eastern North China Plain were investigated using multisource data. Himawari-8 aerosol optical depth can represent the whole layer of air pollution situation; hourly aerosol optical depth were used to reconstruct the route of fine particulate matter horizontal transmission, and the transmission speed was calculated and compared with the near-surface wind speed. A case study conducted on 22 September 2019 showed the pollutant was mainly transmitted from Tangshan to Dezhou, and the transmission speed was greater than the near-surface wind speed. We also found that pollution air mass had 2–3 h of diffusion delay in the near-surface pollutant monitoring results. In addition, the vertical diffusion of pollution mainly occurred at low altitude below 1.8 km. The contribution of local emission and external transmission was inferred in this study with the help of the WRF-Chem model, the pollution in the northeastern portion of the study area mainly derived from local emissions, while the southwestern portion of the study area was mainly affected by external transport. Among them, the local emission accounted for 79.15% of the pollution in Tangshan, while the external transmission contributed 60.28% of the fine particulate matter concentration in Dezhou.

Graphical Abstract

1. Introduction

Large-scale haze events have occurred frequently in China, especially in the North China Plain (NCP) since 2013; these are mainly caused by the rapid rise in fine particulate matter concentration due to the increase in human activities [1]. Fine particulate matter, also known as PM2.5, is defined as particulate matter with a diameter less than 2.5 micrometers. Fine particulate matter may suspend in the air with solid or liquid state, being considered as the most complex and harmful pollutants [2,3]. Numerous epidemiological studies have shown that fine particulate matter can be inhaled into the lungs and cause respiratory diseases such as pneumonia and bronchitis, which seriously threaten human health [4]. Fine particulate matter can increase the extinction coefficient of the atmosphere and reduce visibility, creating a disappointing outdoor experience [5]. In addition, as an important part of the earth–air system, aerosol fine particles suspended in the air affect climate change mainly through direct and indirect radiative forcing [6]. Local emissions from anthropogenic and natural sources in the region directly and instantaneously affect the local environment. Fine particulate pollutants also transport across boundaries at different atmospheric altitudes as meteorological factors change. Some unindustrialized areas may also experience serious air pollution problems [7]. Regional transmission and different sources of air pollution make monitoring and controlling the atmospheric problems difficult and complex.
Some studies have been carried out on regional transmission and different source contributions of fine particulate matter, and these studies can be generally categorized into three groups: (1) analyzing with ground-monitoring results; (2) identifying potential sources based on the backward trajectories; (3) simulating according to the air quality models.
Sun et al. [8] conducted physical observations of the atmospheric boundary layer from the Beijing 325 m meteorological tower in August 2009. The vertical observations of atmospheric particles were also studied. They found that the high concentration of particles in the residual layer reached the ground by the next morning through convection. In addition, the fine particulate matter levels increased due to the long-range transmission of smoke plume into the residual layer. Zheng et al. [9] studied the intraregional transport of black carbon (BC) between the south edge of the NCP and central China during winter haze episodes. The result showed that the highest equivalent BC (eBC) mass concentrations and the highest aerosol absorption coefficients occurred in the NCP region. They also found that the transboundary influences from the central China exhibited a more frequent impact on the ambient eBC levels during pollution episodes.
The backward trajectory can reflect the actual path of particulate matter moving in the atmosphere, and the hybrid single-particle Lagrangian integrated trajectory (HYSPLIT) model can invert the hourly backward trajectory based on meteorological input [10]. Attiya et al. [11] carried out a study to identify the potential sources of dust storms over Iraq, and the HYSPLIT backward trajectories analysis of air parcels was used to support the result, the different potential sources of dust storms were identified and analyzed in this research. Moreover, with the combination of meteorological information and air mass trajectories (HYSPLIT), Franzin et al. [12] identified the probable sources of atmospheric aerosols in the city of São José do Rio Preto, Brazil. They found that the complex composition of the particles was caused by the combination of both local and long-distance sources. Based on the backward trajectory of HYSPILT and combined with pollutant concentration data, a number of related algorithms have been developed to analyze the transmission of fine particulate matter and identify potential sources, and the representative models are potential source concentration function (PSCF) and concentrations weighted trajectory (CWT) analysis. Nicolás et al. [13] conducted an experiment in Southeastern Spain from December 2004 to November 2005; the PSCF algorithm was then used to identify potential source locations, and they found that primary source regions for the particles contributions due to long-range transport have a marked Atlantic and North African location, primarily between Morocco and Northwestern Algeria. Dimitriou et al. [14] determined the spatial distribution affecting PM sources in Athens (Greece) using the CWT algorithm, and revealed the relative contribution of regional and transboundary emissions to PM2.5 quality.
Air quality models mainly use numerical models of different scales to simulate the physical and chemical changes in atmospheric pollutants in the process of diffusion from source to acceptor, and quantitatively calculate the contribution of emissions from different regions and different types of emission sources to the concentration of pollutants in the atmosphere [15,16]. The Community Multiple Air Quality (CMAQ) model and the Weather Research and Forecast-Chemistry (WRF-Chem) model have been frequently used to study local- and regional-scale air quality problems [17,18,19]. Yim et al. [20] applied CMAQ to simulate air quality over East Asia and highlighted the significance of transboundary air pollution affecting Japan and South Korea as well as the impact of wet deposition on various land covers. Zhang et al. [21] developed a WRF-Chem model to simulate a severe aerosol pollution episode that occurred over the Beijing-Tianjin-Hebei (BTH) region of China from 29 October to 8 November, 2015, and examined the temporal and spatial distributions and transport characteristics of this episode. The results showed that large quantities of pollutants were transported to the BTH region from Shandong, Jiangsu, Anhui, and Henan provinces (accounting for 11.6%, 9.2%, 6.7%, and 11.8%, respectively) via the southerly wind during the heavy pollution period.
In general, all the above algorithms have provided important references for the research in this transmission field, and they have resulted in many achievements. However, these algorithms also have some defects. Ground monitoring methods just reflect the point pollution information, the necessary transmission details are always lost, and they cannot refactor the transmission route of fine particles’ pollution. In addition, the approaches performed based on backward trajectory only consider atmospheric dynamics and do not involve any chemical reactions, which cannot meet the requirements for quantifying the regional transport contribution [22,23]. Moreover, the performance of an air quality model is limited by uncertainties in the emission inventory and biases in the initial and boundary conditions, as well as deficiencies in the current chemical and physical schemes, which lead to an uncertain accuracy of the simulation result [24].
In this research, from the earth science perspective, we aimed to obtain a deeper and more quantitative understanding of the regional transmission and source contribution of fine particulate matter, especially in the eastern North China Plain region (E-NCP). From a technical perspective, we innovatively reconstructed the transmission route of a fine particulate matter pollution event by integrating ground-monitoring data, aerosol optical depth (AOD) data retrieved from Himawari-8 satellite, and pollution concentration and meteorological data simulated based on WRF-Chem. In addition, the horizontal transmission and vertical diffusion of fine particulate matter as well as the contributions of different sources were studied deeply and concretely in this research. This research will provide an important reference for exploring the theory of pollution transmission and regional joint prevention and control.
The paper is organized as follows: In Section 2, the study region of E-NCP is first introduced. Then, we provide a brief introduction to the used datasets as well as the model and algorithm. After that, Section 3 outlines the analysis result of this study. Finally, Section 4 summarizes this research and describes the conclusion.

2. Materials and Methods

2.1. Study Region: East of North China Plain

In this research, the E-NCP study region is a physical geography concept rather than a human geography concept, which mainly includes but is not strictly limited to the cities of Tangshan (TS), Tianjin (TJ), Cangzhou (CZ), and Dezhou (DZ).
The E-NCP region has a large population and developed industry. The main terrain of the E-NCP region is plain and located near the Bohai Bay. It is extremely vulnerable to the influence of northern air currents, which cause the southward diffusion of pollutants and affect the air quality of downstream cities. Figure 1 shows the geographic location and digital elevation map of the E-NCP. On 22 September 2019, an air pollution event occurred in the NCP, which included the regional transmission and deposition process of pollution in a short period of time, especially in the E-NCP, which was detailed and studied in this research.

2.2. Study Time Period

On 22 September 2019, a serious air pollution event occurred in the North China Plain. This serious haze event can also be observed through the MODIS satellite true color map (Figure 2). In addition, according to the real-time monitoring data of air quality ground stations, PM2.5 concentration in many places in the North China Plain reached more than 75 μg/m3, indicating that the air quality reached the pollution level. Because, according to the Chinese national standard of PM2.5, a concentration less than 35 μg/m3 represents excellent air quality, 35–75 μg/m3 means good air quality, but when the concentration is greater than 75 μg/m3, the air can be considered to be slightly polluted. Moreover, the website of JAXA Himawari Monitor can show the true color map every hour or 10 min, which is convenient for us to track the pollution event. During the pollution event, we found an obvious regional transport process in the eastern part of the North China Plain. Therefore, the E-NCP region was chosen as the research area of our study. A detailed analysis is carried out in the following sections.

2.3. Atmosphere Pollutants and Meteorological Ground Monitoring Dataset

To effectively monitor air pollutants, China started to build a number of ground-monitoring stations at different locations in 2013 to track the spatial distribution of pollutants and conduct timely warnings and interventions for possible hazards. To date, more than 1500 sites are in service for monitoring the atmospheric quality, and the hourly concentrations of PM2.5, PM10, NO2, CO, SO2, and O3 can be monitored accurately and effectively. The monitoring results can be obtained from China National Environmental Monitoring Centre (http://www.cnemc.cn/). There are 32 stations in the E-NCP region, and the hourly PM2.5 concentration was used to support the research.
Changes in the meteorological field affect the diffusion of pollutants; to further reconstruct the pollution event, hourly wind fields and planetary boundary layer height were also analyzed in this study. The China National Meteorological Science Data Center (http://data.cma.cn/) provided meteorological ground-monitoring data for free; currently, more than 2100 sites are displayed on this website, and the meteorological parameters obtained by monitoring mainly include the hourly observed values of temperature, air pressure, relative humidity, water vapor pressure, wind, and planetary boundary layer height. In this study, the hourly wind speed (10 m), wind direction (10 m), and the planetary boundary layer height were introduced to analyze the horizontal transmission and vertical diffusion of fine particulate matter.

2.4. Aerosol Optical Depth Dataset of Himawari-8

Himawari-8 is a new generation of geostationary weather satellites launched by Japan in October 2014; the Himawari-8 satellite carries the most advanced 16-channel visible infrared imager (AHI), which provides more accurate information such as meteorological and ground observations [25]. The Himawari-8 satellite can obtain complete information of the hemisphere covering East Asia. The positioning accuracy of the Himawari-8 satellite can be maintained within one pixel [26]. In addition, compared with the original geostationary satellite, the observation frequency and accuracy of the Himawari-8 satellite are greatly improved, with a 10 min time resolution and 0.5 km spatial resolution. Himawari-8 AHI has three sets of resolutions: 0.5 and 1 km for the visible spectrum and 1 and 2 km for IR channels. In addition, Himawari-8 provides continuous monitoring under cloudless conditions, which provides advantages for reconstructing and continuously tracking pollution transmission events.
In current studies, aerosol optical depth (AOD) has become a research hotspot in the field of air pollution, which represents the integral of extinction coefficient in the vertical direction, and describes the all-parameter of sunlight induced by aerosol [27]. This is a key physical parameter to characterize the degree of atmospheric turbidity and represent the pollution and dust outbreak situation of the whole atmosphere [28]. Therefore, it provided an important basis for us to track pollution transmission by satellite data. We simultaneously retrieved 10 min and 5 km AOD using an N-dimensional cost function (NDCF) method, which obtained an AOD at multiple timepoints by exploiting multitemporal data synergy from the geostationary satellite. This algorithm proved that the AOD retrieval accuracy and retrieval applicability over the NCP of Himawari-8 Imager data were significantly improved [29]. Figure 2 shows the satellite true color map and the distribution of AOD in the NCP region on 22 September 2019, which also proved that the distribution of AOD can represent the air pollution accurately. In this study, an hourly AOD in the NCP region on 22 September 2019, was inverted to support the analysis and research.

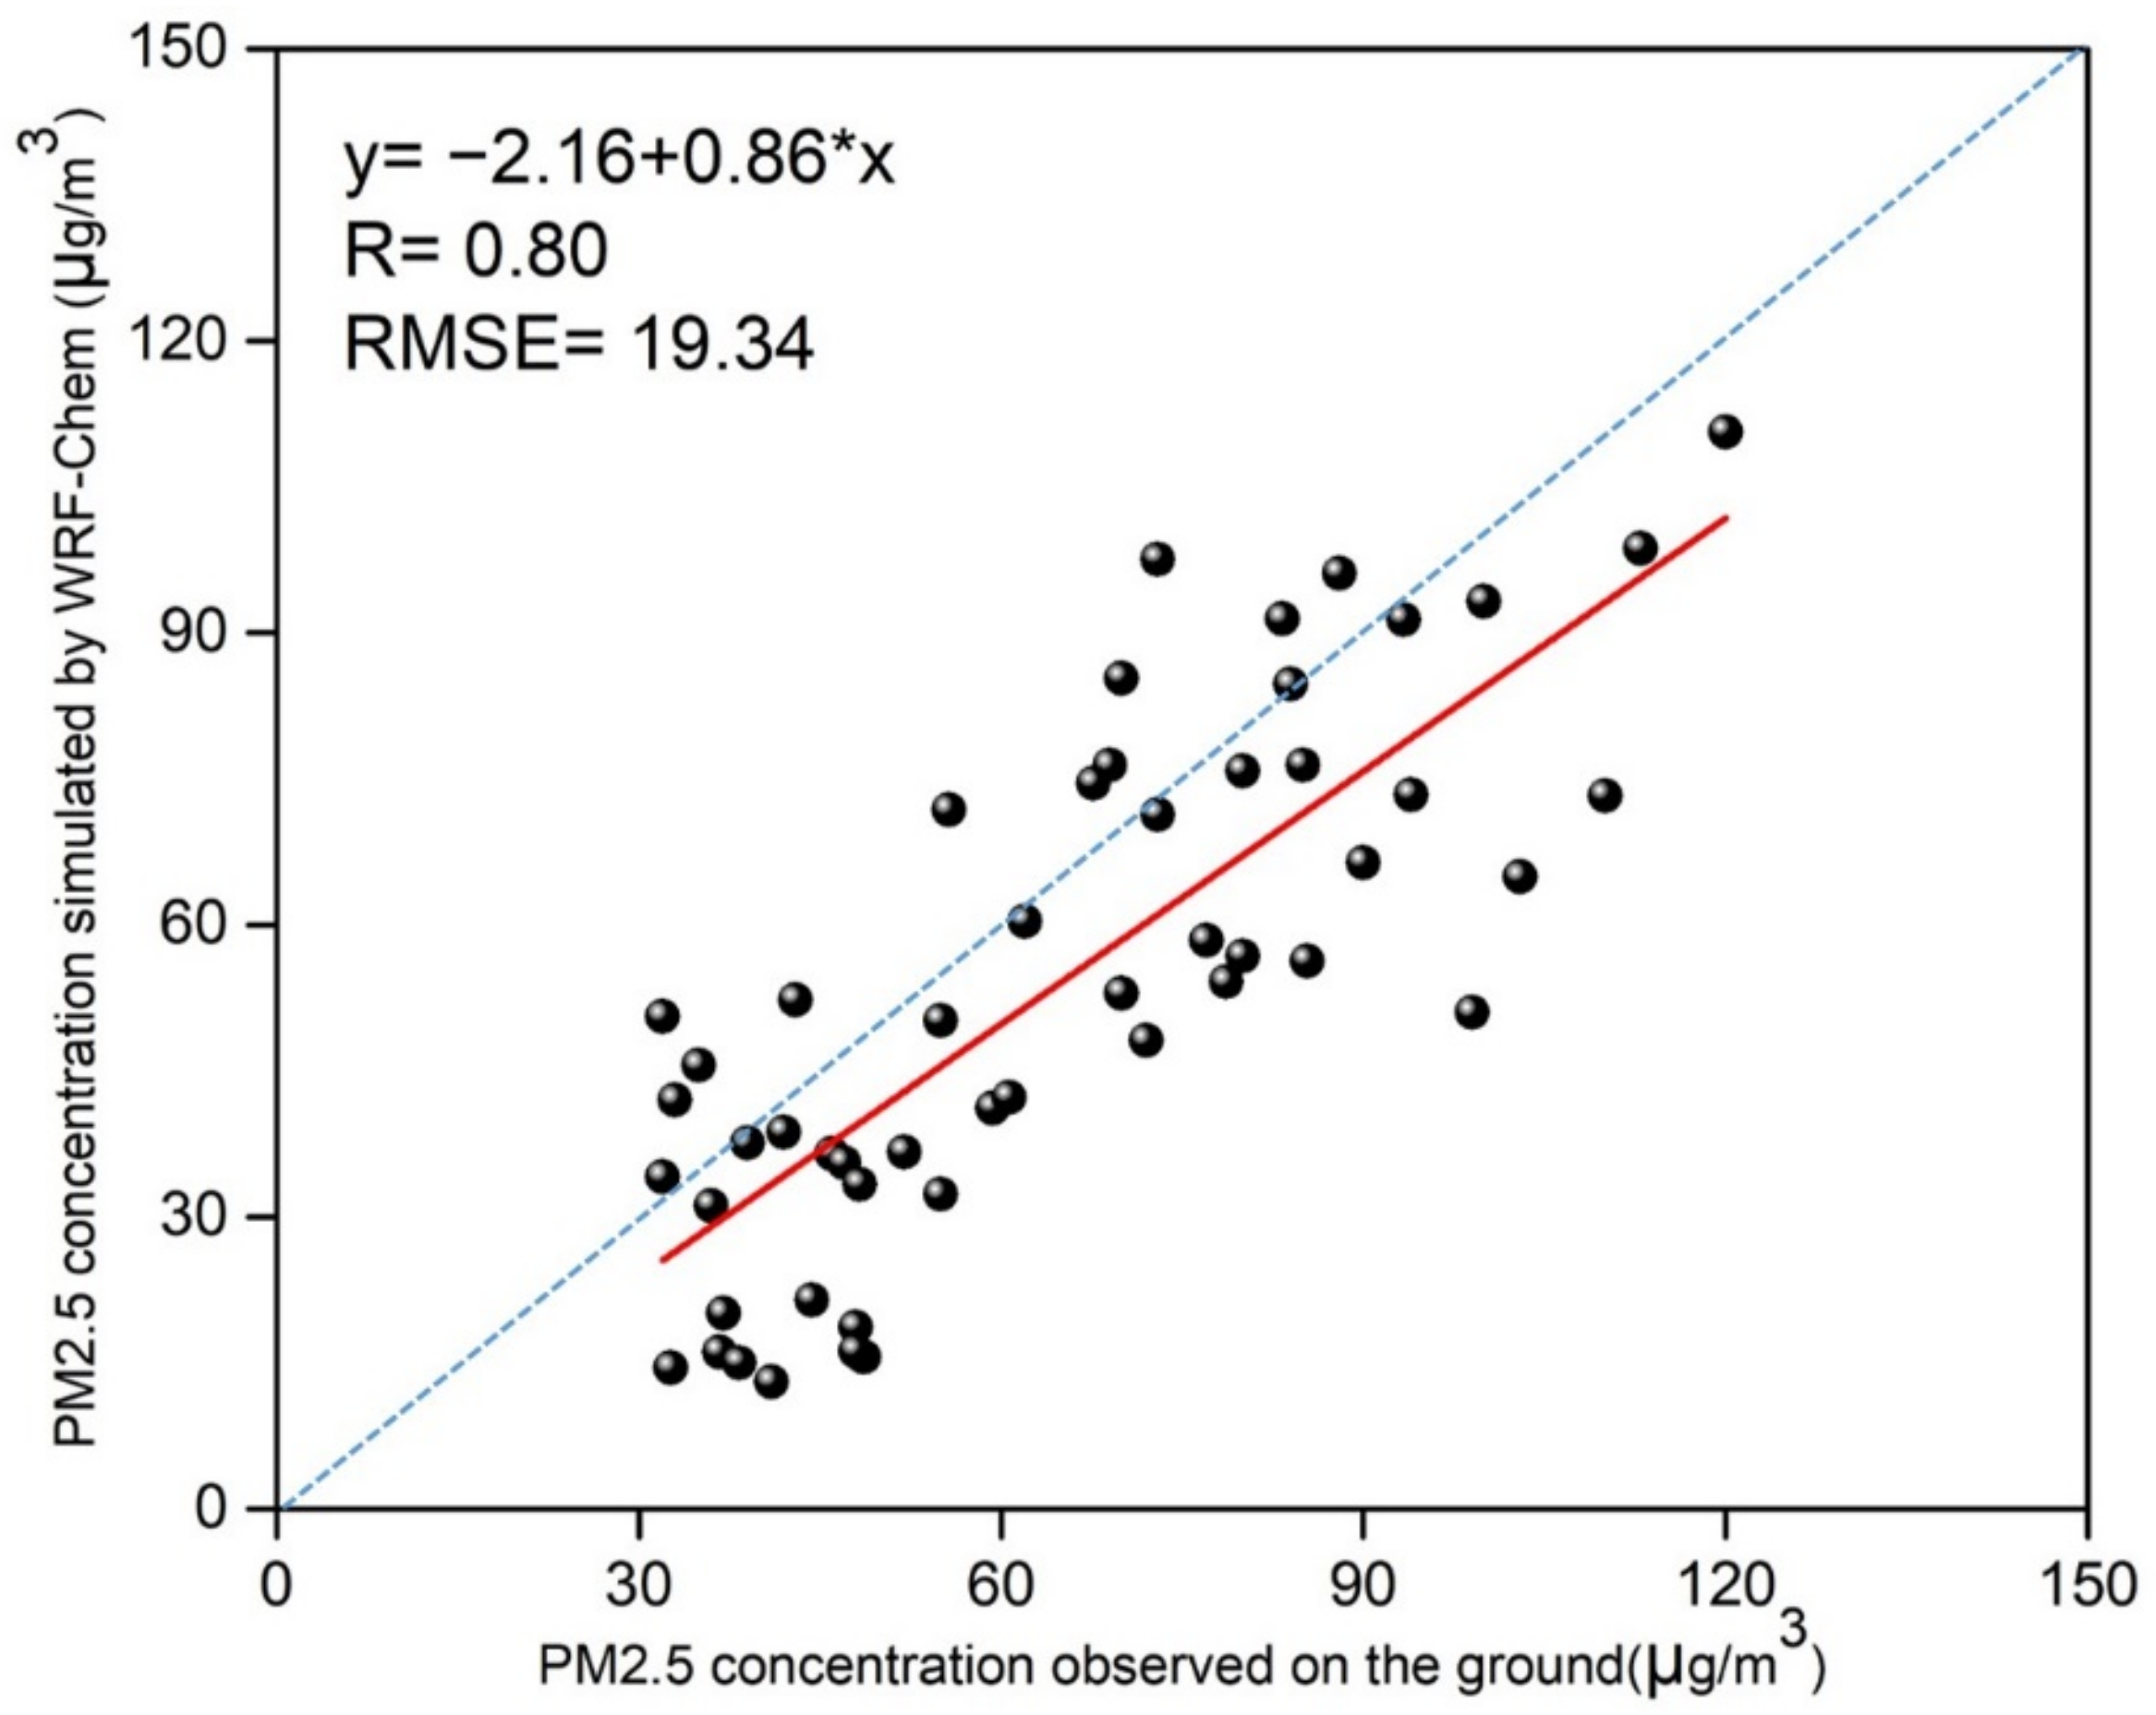
2.5. WRF-Chem Configuration and Implementation

WRF-Chem is a new generation of regional air quality model which is fully coupled with a meteorological model and chemical model online; it uses the same horizontal and vertical coordinate systems and the same physical parameterization scheme in chemical and meteorological processes with no time interpolation. WRF-Chem considers the feedback effect of chemistry on the meteorological process, so that a more realistic atmospheric environment is guaranteed for simulation [30].
In this study, version 3.6.1 the WRF-Chem was implemented over the E-NCP. As shown in Figure 3, three-level nested modeling domains were used to cover the research region with resolutions of 27, 9, and 3 km. The vertical structure of the atmosphere was represented with 30 vertical levels, and the NCEP FNL data were chosen as the initial meteorological field and boundary field, and the model started on 18 September 2019, and ended on 22 September 2019. In addition, the anthropogenic emission inventory data came from China’s Multiscale Emission Inventory Model [31], and biogenic emissions were calculated online using the model of emissions of gases and aerosols from nature (MEGAN2) [32].
The main options for physical and chemical schemes adopted here are listed in Table 1. These mainly include the RRTMG longwave radiation scheme [33], the RRTMG shortwave radiation scheme [33], the Morrison two-moment microphysics scheme [34], the Noah land-surface model [35], the RADM2 gas phase chemical mechanism scheme [36], the MADE-SORGAN aerosol mechanism scheme [36], the Mellor–Yamada–Jajic’ TKE planetary boundary layer scheme [37,38], and the Monin–Obukhov surface layer scheme [39].
According to these physical and chemical parameter schemes, we simulated the concentration of fine particulate matter in the research region; we further corrected the simulation results according to the pollutant ground-monitoring data, and 32 ground-monitoring stations were designed into calibration models to optimize the simulation data. In the process of accuracy verification, the hourly average value of key cities is used for calculating of the correlation coefficient R and the Root Mean Square Error (RMSE) between modelled and observed PM2.5 concentration. Figure 4 shows the precision validation results, in which the R of the ground monitor data and WRF-Chem simulation data was 0.80, and the RMSE was 19.34 μg/m3, which can be improved so that we could obtain a suitable simulation result for further research. Moreover, the simulation results from WRF-Chem were lower than ground-monitoring data in general, which is mainly caused by the altitude difference. Ground-monitoring stations only represent the pollution situation near the instrument. However, the WRF-Chem model simulates the concentration of fine particulate matter above the surface and below the atmospheric boundary layer. However, they all demonstrate the same trend in pollutant concentration variation, reflecting the same pollution and transmission process.
In addition, the influence between local emission and the external transmission is distinguished as follows. Firstly, we can calculate the total concentration of PM2.5 in the study area during the research period by joining all the inventory data. The total concentration includes the local emission concentration and external transmission concentration. However, if the local emission inventory is not added to WRF-Chem, the model will generate a pollution concentration result caused by external transmission. Thus, the subtraction of them is the concentration of pollution produced by local emission. Based on these data, this study distinguished the contribution of local emission from external transmission, and calculated the percentage of contribution in some key cities.

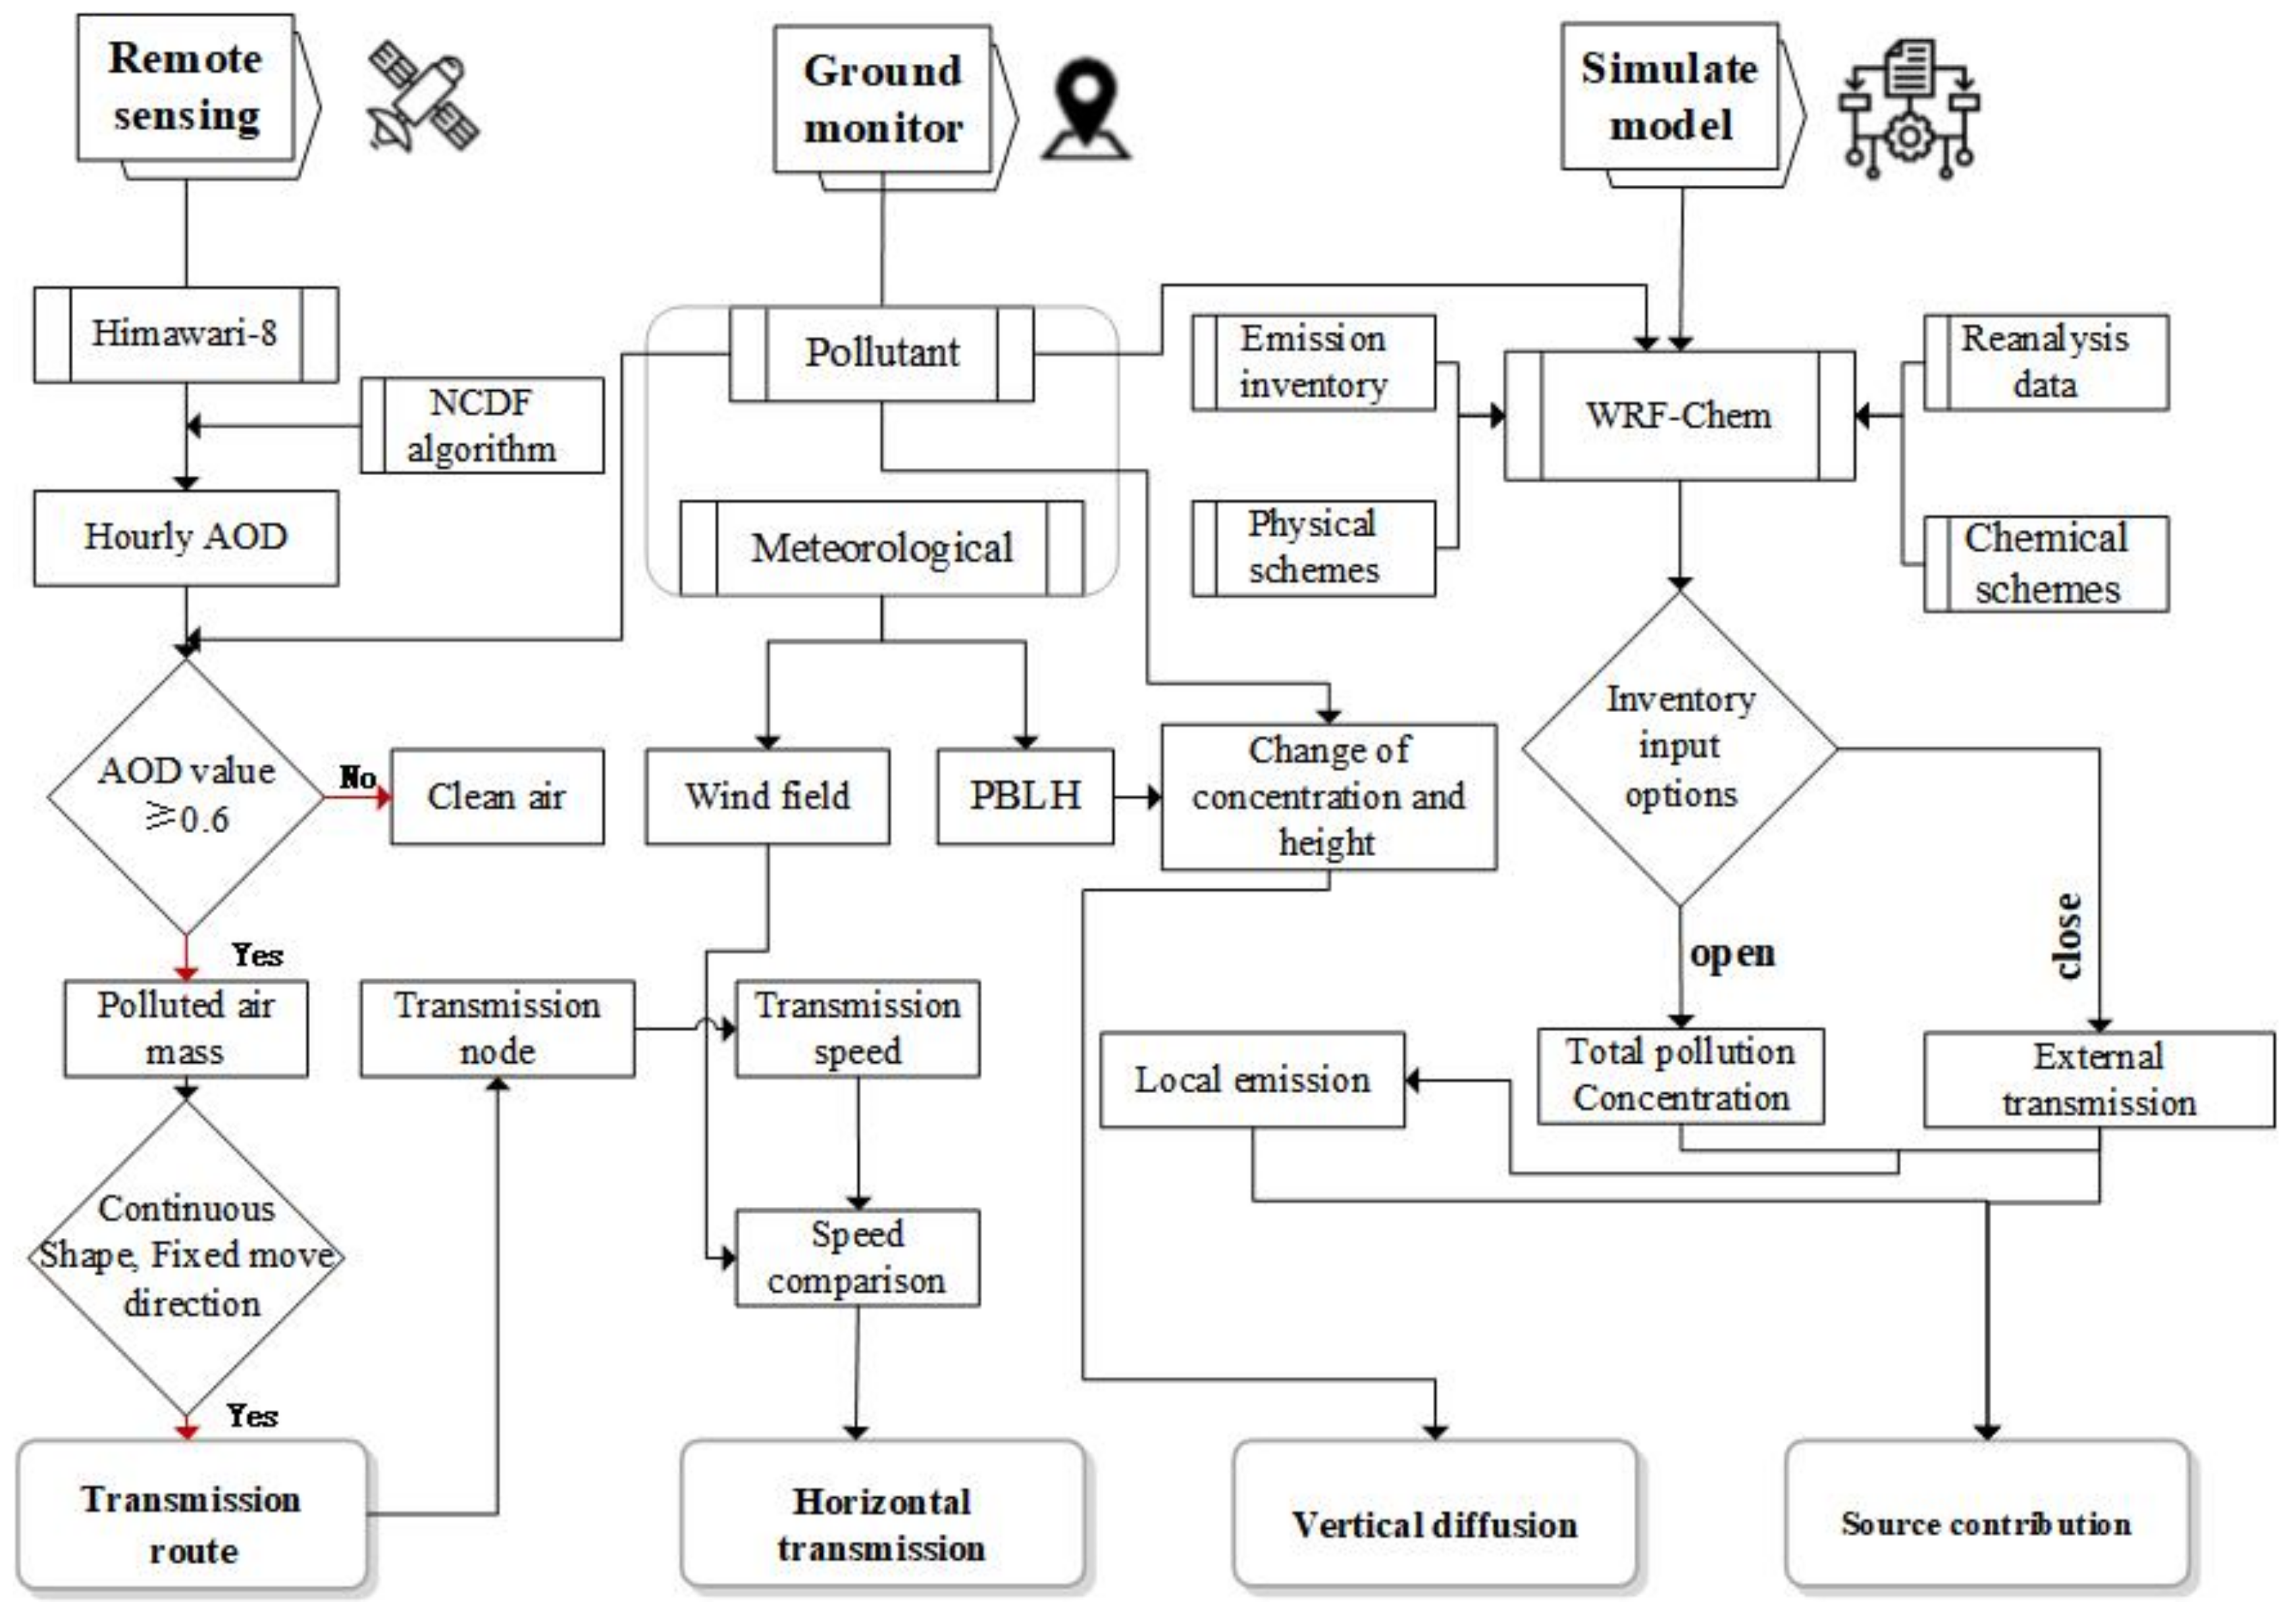
2.6. Research Methods

We carried this research based on the above data collection and algorithm description, in which the obtained hourly AOD was used to restructure the pollutant transmission route. The horizontal transmission and vertical diffusion of fine particulate matter were analyzed with the combination of ground monitor data and remote-sensing data. In addition, the WRF-Chem model was also introduced into this research to infer the local/external contribution of fine particulate matter. It should be noted that in order to judge the relationship between AOD and air pollution, 32 air quality ground monitor stations (Figure S2) which could provide hourly PM2.5 data were collected to analyzed with the corresponding AOD value in the range 7:00–16:00 h, 22 September 2019.When the AOD was greater than 0.6, 69.7% of the hourly PM2.5 concentration was greater than 75 μg/m3, which means that the air quality has reached the pollution level. Therefore, 0.6 was used as the threshold to determine the polluted air mass and contour the trajectory of movement. In addition, it was necessary to determine whether there was a transmission route, and two conditions should be met: continuous shape of the polluted AOD remote sensing image, and the pollution range having a fixed movement direction. According to the extracted transmission node from remote-sensing data, the transmission speed can be calculated as follows
T_S = (T_Ni + 1 − T_Ni)/T_t,
where T_S represents the speed of pollutant transmission, T_N represents the location of transmission node, and T_t represents the time between the transmission nodes.
Meteorology and pollutant ground-monitoring data were also introduced to support this research, especially in the study of horizontal transmission and vertical diffusion. Then, the WRF-Chem model was used to distinguish the contribution of local pollution and the external transmission by combining the input of inventory data; the basic flow chart was as shown in Figure 5.

3. Results

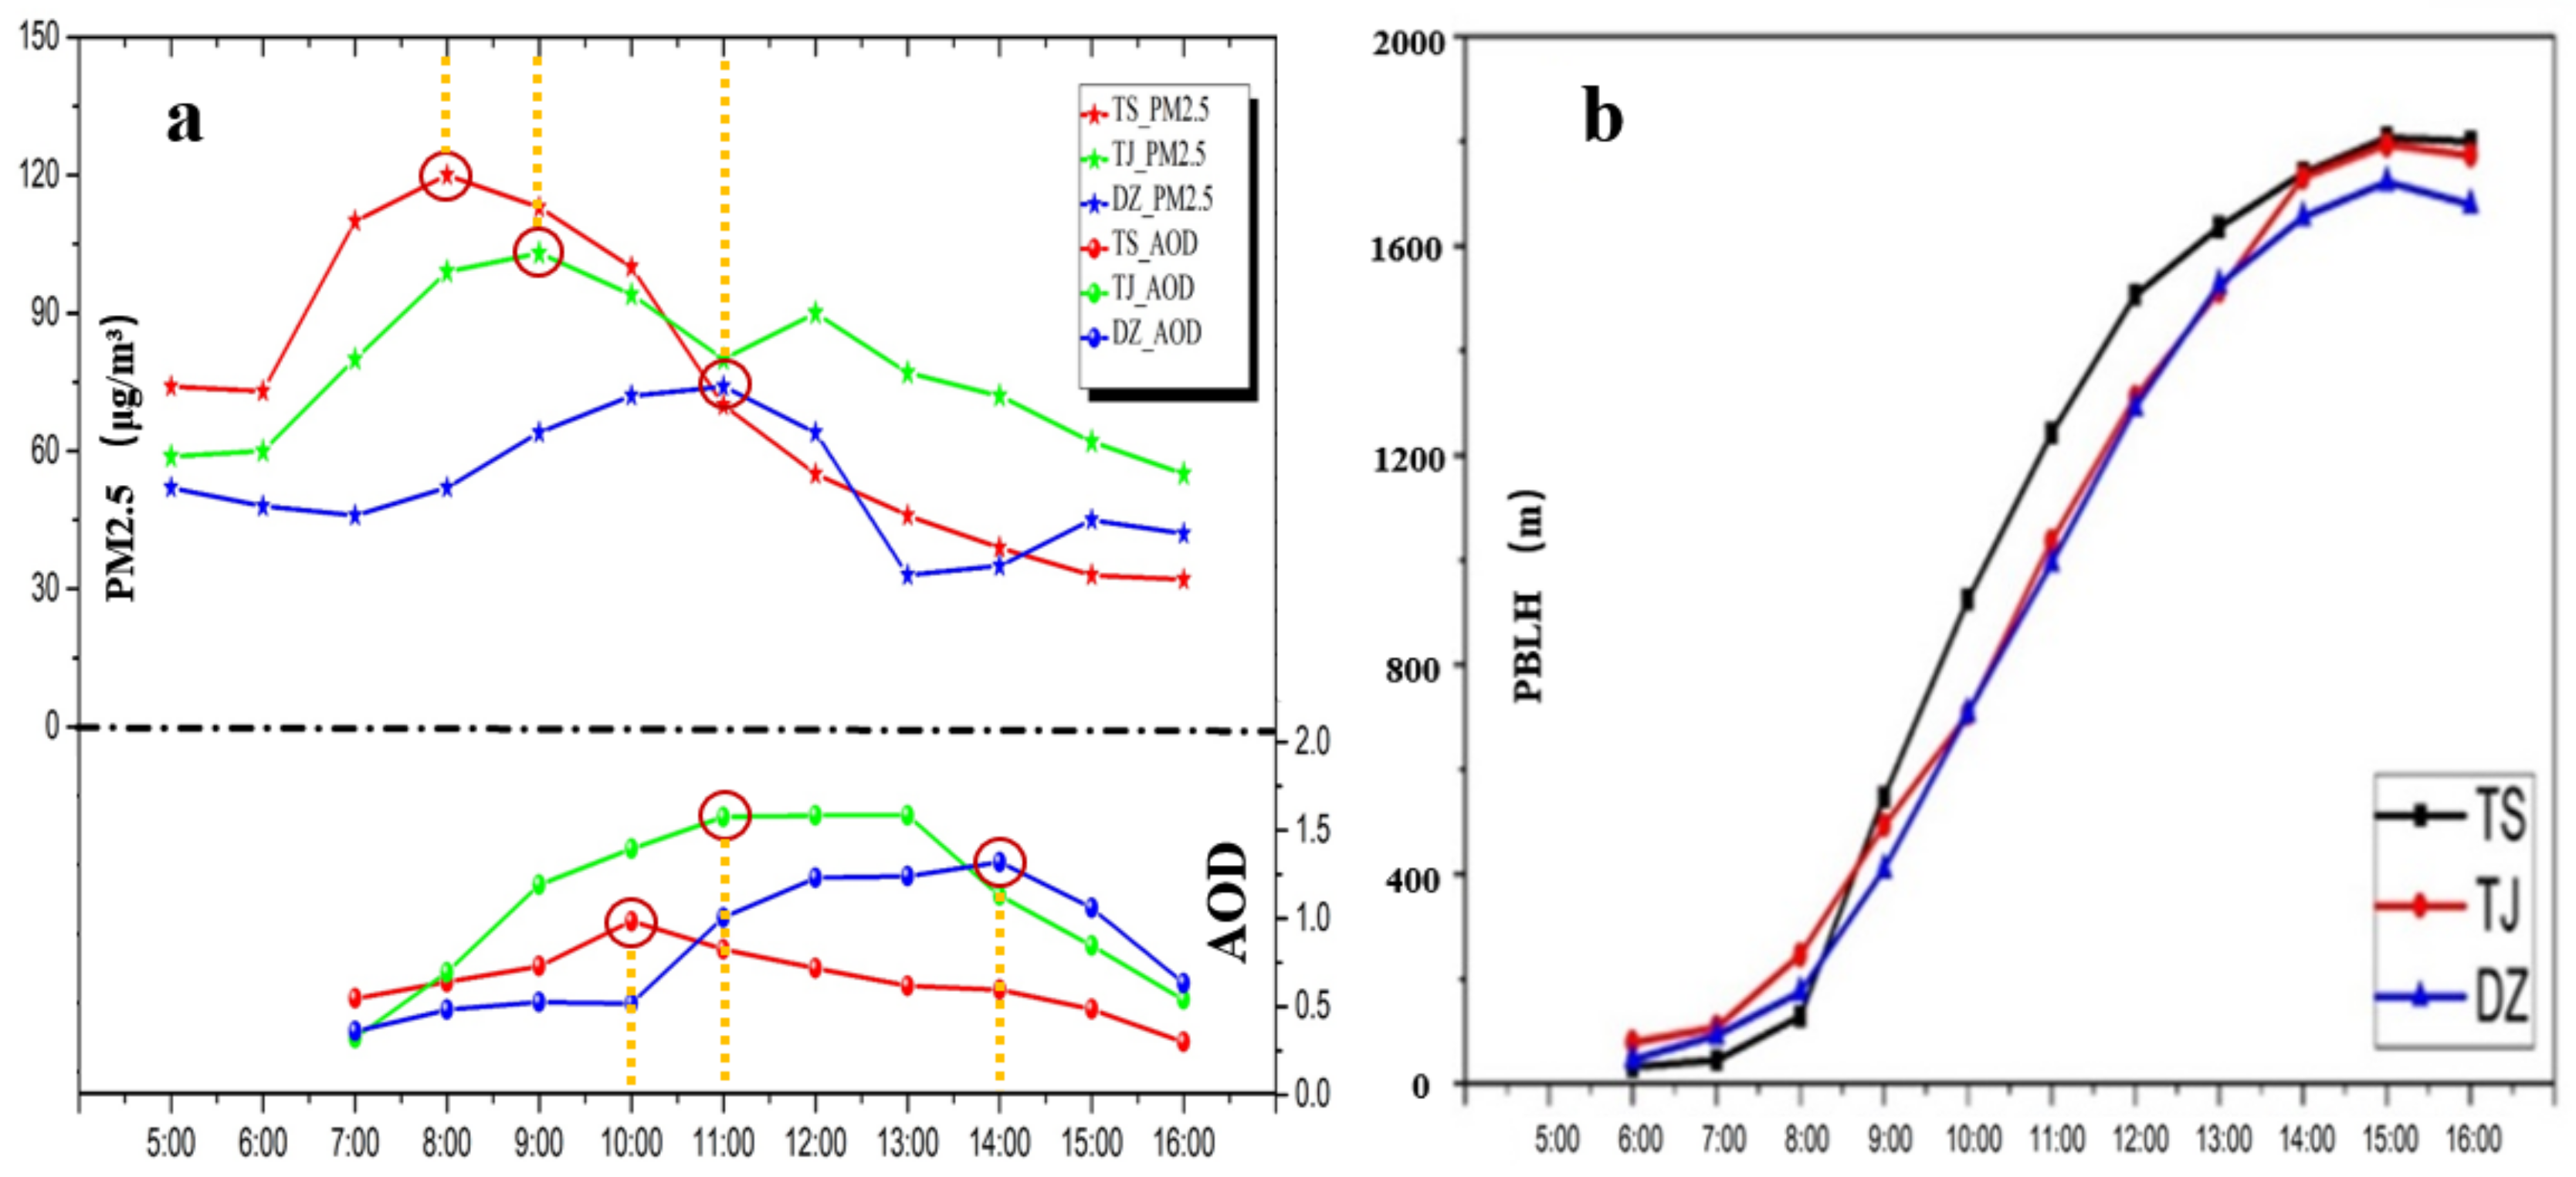
3.1. Reconstruction of the Pollution Transmission Route

In this study, hourly AOD was calculated using the NDCF algorithm. The effective time ranges from 7:00 to 16:00 h (local time) on 22 September 2019. According to the analysis of the inversion results and the judgment criteria of the transmission route, a serious air pollution event occurred in the NCP region during this period, and there were two obvious pollution belts: a high pollution belt along the Taihang Mountains on the west side and a high pollution belt on the E-NCP region (Figure 2). Through the analysis of the pollution magnitude and variation over a continuous period of time, we found that the western high pollution belt had a trend of rising and falling as a whole, which indicated that local emissions played a major role in this pollution event. The particle transmission process was not obvious there. However, the E-NCP pollution belt showed a significant transmission trend, which included two procedures: the transmission process and the diffusion process. Thus, the pollution belt became the focus of our research.
Figure 6a–j shows the transmission route of the pollution process; we determined that the transmission process of this pollution mainly occurred from 7:00 to 13:00 h and that the transmission route was from TS to DZ. This process originated in TS, and continuously transmitted to the southwest, accompanied by the joint effect of the pollution emission in Tianjin. Figure 6l represents the transport nodes of pollutants in the transmission process and the corresponding time advancing. In addition, this study modelled the wind speed and direction at 10 m with the mean value in the time period 7:00–16:00 h and showed, in Figure 6, that the airflow from the northeast moved to the southwest as a whole, and prompted the pollutants continuously transport to the southwest, which had the same trend as the transmission route studied from Himawari-8 AOD data.

3.2. Horizontal Transmission of Fine Particulate Matter

Driven by the meteorological field, the pollution air mass moved southward continuously. According to this transmission track, the transmission distance was easy to obtain, and the pollutant transmission speed could calculated from Formula (10). At the same time, we calculated the near-surface wind speed at the pollution transmission node from the nearby ground meteorological observation stations. Figure 7 shows the speed of pollutant transmission and wind. There was a high correlation between them, with the correlation coefficient reaching 0.73. In addition, the pollutant transmission speed was greater than the near-surface wind speed, indicating that there were different altitude transmission layers in the pollution transmission process, and the speed of transmission near surface was lower than that at the high-altitude layer.

3.3. Vertical Diffusion of fine Particulate Matter

Fine particulate matter not only migrates in the horizontal direction but also diffuses in the vertical direction. In Figure 8, the change process of PM2.5 concentration that was obtained from ground-monitoring stations (TS, TJ, and DZ) over time is analyzed and compared with the extracted AOD. The meteorological monitoring station nearest to the pollutant monitoring station was also introduced into the analysis, which could help with evaluating the influence of the change in meteorological factors on the vertical transmission of fine particulate matter. As can be seen in Figure 8a, the entire layer of polluted air mass dissipates 2–3 h later than the near-surface PM2.5 concentration dissipation, which was caused by the significant increase in the planetary boundary layer height in this short period of time, shown in Figure 8b. In this case, the near-surface pollutant concentration monitoring results decreased considerably. However, the entire layer of atmospheric pollution was still high, and was not affected by the planetary boundary layer height. In contrast, the transmission or deposition of pollutants could lead to changes in the entire layer of atmosphere. In addition, due to the planetary boundary layer height, the fine particulate matter basically moved below 1.8 km in this pollution event.

3.4. Contribution of Local Emission and External Transmission

Another highlight of this study was the quantitative analysis of the contribution of different source to the pollution. In the WRF-Chem model, the access of the emission inventory could help in simulating the total concentration of fine particulate matter in E-NCP area. The contribution of external transport to the pollution event could be determined without the introduction of emission inventory. Figure 9 shows the distribution of the average contribution of local emission and external transmission of fine particulate matter in the time period 7:00–16:00 h, 22 September 2019.
In general, in this time period, the fine particulate pollutants were mainly dominated by local emissions and supplemented by external transport, which, combined, lead to the continuous pollution events. In particular, the northeastern region was dominated by local emissions, especially in TS and TJ, where the local emission concentration was higher than 40 μg/m3, accounting for 79.15% and 76.43%, respectively. In addition, local emissions in the northern part of CZ were significant with the contribution rate reaching 54.83%, the local emissions combined with the influence of external transport led to the serious pollution result in CZ, and the total concentration was 73.36 μg/m3. In contrast, the pollution in the downstream city of DZ was mainly affected by the transmission of external sources, and the local emission concentration was only 20.42 μg/m3, while the concentration of fine particulate matter caused by the transmission of external sources was 30.99 μg/m3, which contributed 60.28% to this pollution event. It was worth mentioning that the polluted air mass also strongly impacted Hengshui, located to the west of the CZ during its southward transmission, and the average concentration in the whole city was 74.27 μg/m3, with 57.18% of the concentration attributed to external transmission.

4. Discussion

In this study, multisource data were used to explore the transport characteristics of fine particulate matter, and many useful results were obtained. However, many aspects remain to be further studied. The combination of the Himawari-8 AOD dataset with the WRF-Chem model and ground-monitoring dataset can provide unique insights into the regional transmission and source contribution of fine particulate matter. The proposed method still has its inherent limitations. In the process of reconstructing the pollutant transport route according to AOD, we used 0.6 as the threshold value to determine the pollution air mass transmission node. However, this was only determined using the ground-monitoring data in the E-NCP region during the pollution period, which did not represent all pollution events and may not be universally applicable in other areas.
In terms of the WRF-Chem model simulation results, we used the fine particulate matter concentration ground-monitoring data to make a certain correction. However, the simulation results in the vertical direction could not be quantitatively evaluated. The particle monitoring LiDAR may provide a new reference for the WRF-Chem model profile simulation results. In addition, some scholars have proposed an empirical and statistics-based scheme that could optimize the estimation of the initial conditions (ICs) of aerosol in WRF-Chem [40]. The proposed method facilitated the mitigation of the underestimation of PM2.5 during pollution episodes at an instantaneous hourly level. All of these will enable further study and exploration of the transmission of fine particulate matter.

5. Conclusions

In this study, we innovatively combined multisource data to analyze a typical fine particulate matter pollution transmission case in the E-NCP region, highlighting the advantages of remote sensing satellites and the WRF-Chem model. We also combined the pollutants and meteorological ground-monitoring data to conduct quantitative and qualitative analyses of fine particulate matter transmission characteristics.
First of all, this study was supported by satellite data and the aerosol optical depth was retrieved from Himawari-8 through the NDCF model, which accurately reflected the hourly pollution transmission of the entire atmosphere. As a result, we innovatively reconstructed the transmission route of fine particulate matter pollution, which was mainly from TS to DZ in the time range from 7:00 to 13:00 h.
In addition, we explored the characteristics of horizontal transmission with the supporting of the pollutant transmission speed in the transmission route, which was also compared with the near-surface wind speed and proved that there were different altitude transmission layers in the pollution transmission process. In terms of vertical diffusion, the changes in pollutant concentration and the PBLH during the study period were also introduced in this research, and we found that the entire layer of polluted air mass dissipated 2–3 h later than the near-surface PM2.5 concentration dissipation. The fine particulate matter basically moved below 1.8 km in this pollution event.
We distinguished the concentration of local emissions and the external transport in the E-NCP with the help of emission inventory from China’s Multiscale Emission Inventory Model. The different pollution source contributions were also explored in the study; we found that local emission was dominant in the northeast E-NCP region, especially in TS and TJ, with local emission contributions of 79.15% and 76.43%, respectively. The southwest was mainly affected by external transmission, which contributed 60.28% of the fine particulate matter concentration in DZ.

Supplementary Materials

The following are available online at https://www.mdpi.com/2072-4292/12/23/3936/s1.

Author Contributions

Conceptualization, X.G.; methodology, X.Z.; software, S.S.; validation, Y.W. and H.G.; writing—Original draft preparation, X.Z.; writing—Review and editing, S.S. and T.C. All authors have read and agreed to the published version of the manuscript.

Funding

This research was funded by the National Key R & D Program of China (Grant Number: 2017YFC0212301, 2017YFC0212302, 2020YFE0200700, 2019YFE0126700) and National Natural Science Foundation of China (Grant Number: 42005104, 42071318).

Acknowledgments

This work was supported in part by the National Key R & D Program of China (Grant Number: 2017YFC0212301, 2017YFC0212302, 2020YFE0200700, 2019YFE0126700), and National Natural Science Foundation of China (Grant Number: 42005104, 42071318). The authors would like to thank China National Environmental Monitoring Centre and China National Meteorological Science Data Center for providing the pollutant and meteorological monitoring data. We acknowledge the free use of Himawari-8 data from the website of https://www.eorc.jaxa.jp/ptree/. We also acknowledge use of the WRF-Chem preprocessor tools provided by the Atmospheric Chemistry Observations and Modeling Lab (ACOM) of NCAR.

Conflicts of Interest

The authors declare that we have no known competing financial interests or personal relationships that could have appeared to influence the work reported in this paper.

References

  1. Zhao, X.J.; Zhao, P.S.; Xu, J.; Meng, W.; Pu, W.W.; Dong, F.; He, D.; Shi, Q.F. Analysis of a winter regional haze event and its formation mechanism in the North China Plain. Atmos. Chem. Phys. 2013, 13, 5685–5696. [Google Scholar] [CrossRef] [Green Version]
  2. Lee, H.J.; Chatfield, R.B.; Strawa, A.W. Enhancing the Applicability of Satellite Remote Sensing for PM2.5 Estimation Using MODIS Deep Blue AOD and Land Use Regression in California, United States. Environ. Sci. Technol. 2016, 50, 6546–6555. [Google Scholar] [CrossRef]
  3. Zhang, Y.; Wang, W.; Ma, Y.; Wu, L.; Xu, W.; Li, J. Improvement in hourly PM2.5 estimations for the Beijing-Tianjin-Hebei region by introducing an aerosol modeling product from MASINGAR. Environ. Pollut. 2020, 264, 114691. [Google Scholar] [CrossRef] [PubMed]
  4. Ali, M.U.; Liu, G.; Yousaf, B.; Ullah, H.; Abbas, Q.; Munir, M.A.M. A systematic review on global pollution status of particulate matter-associated potential toxic elements and health perspectives in urban environment. Environ. Geochem. Health 2018, 41, 1131–1162. [Google Scholar] [CrossRef]
  5. Pui, D.Y.; Chen, S.-C.; Zuo, Z. PM 2.5 in China: Measurements, sources, visibility and health effects, and mitigation. Particuology 2014, 13, 1–26. [Google Scholar] [CrossRef]
  6. Choobari, O.A.; Zawarreza, P.; Sturman, A.P. The global distribution of mineral dust and its impacts on the climate system: A review. Atmos. Res. 2014, 138, 152–165. [Google Scholar] [CrossRef]
  7. Chen, D.; Liu, X.; Lang, J.; Zhou, Y.; Wei, L.; Wang, X.; Guo, X. Estimating the contribution of regional transport to PM 2.5 air pollution in a rural area on the North China Plain. Sci. Total Environ. 2017, 583, 280–291. [Google Scholar] [CrossRef]
  8. Sun, Y.; Song, T.; Tang, G.; Wang, Y. The vertical distribution of PM2.5 and boundary-layer structure during summer haze in Beijing. Atmos. Environ. 2013, 74, 413–421. [Google Scholar] [CrossRef]
  9. Zheng, H.; Kong, S.; Wu, F.; Cheng, Y.; Niu, Z.; Zheng, S.; Yang, G.; Yao, L.; Yan, Q.; Wu, J.; et al. Intra-regional transport of black carbon between the south edge of the North China Plain and central China during winter haze episodes. Atmos. Chem. Phys. 2019, 19, 4499–4516. [Google Scholar] [CrossRef] [Green Version]
  10. Koracin, D.; Vellore, R.; Lowenthal, D.H.; Watson, J.G.; Koracin, J.; Mccord, T.; Dubois, D.W.; Chen, L.-W.A.; Kumar, N.; Knipping, E.M.; et al. Regional Source Identification Using Lagrangian Stochastic Particle Dispersion and HYSPLIT Backward-Trajectory Models. J. Air Waste Manag. Assoc. 2011, 61, 660–672. [Google Scholar] [CrossRef]
  11. Attiya, A.A.; Jones, B.G. Assessment of mineralogical and chemical properties of airborne dust in Iraq. SN Appl. Sci. 2020, 2, 1–21. [Google Scholar] [CrossRef]
  12. Franzin, B.T.; Guizellini, F.C.; De Babos, D.V.; Hojo, O.; Pastre, I.A.; Marchi, M.R.; Fertonani, F.L.; Oliveira, C.M. Characterization of atmospheric aerosol (PM10 and PM2.5) from a medium sized city in São Paulo state, Brazil. J. Environ. Sci. 2020, 89, 238–251. [Google Scholar] [CrossRef]
  13. Nicolás, J.F.; Chiari, M.; Crespo, J.; Galindo, N.; Lucarelli, F.; Nava, S.; Yubero, E. Assessment of potential source regions of PM2.5 components at a southwestern Mediterranean site. Tellus B Chem. Phys. Meteorol. 2011, 63, 96–106. [Google Scholar] [CrossRef]
  14. Dimitriou, K.; Remoundaki, E.; Mantas, E.; Kassomenos, P. Spatial distribution of source areas of PM2.5 by Concentration Weighted Trajectory (CWT) model applied in PM2.5 concentration and composition data. Atmos. Environ. 2015, 116, 138–145. [Google Scholar] [CrossRef]
  15. Guo, H.; Kota, S.H.; Sahu, S.K.; Hu, J.; Ying, Q.; Gao, A.; Zhang, H. Source apportionment of PM2.5 in North India using source-oriented air quality models. Environ. Pollut. 2017, 231, 426–436. [Google Scholar] [CrossRef]
  16. Qiao, X.; Ying, Q.; Li, X.; Zhang, H.; Hu, J.; Tang, Y.; Chen, X. Source apportionment of PM2.5 for 25 Chinese provincial capitals and municipalities using a source-oriented Community Multiscale Air Quality model. Sci. Total Environ. 2018, 612, 462–471. [Google Scholar] [CrossRef]
  17. Choi, M.-W.; Lee, J.-H.; Woo, J.-W.; Kim, C.-H. Comparison of PM2.5 Chemical Components over East Asia Simulated by the WRF-Chem and WRF/CMAQ Models: On the Models’ Prediction Inconsistency. Atmosphere 2019, 10, 618. [Google Scholar] [CrossRef] [Green Version]
  18. Qin, M.; Wang, X.; Hu, Y.; Huang, X.; He, L.; Zhong, L.; Xuesong, W.; Hu, M.; Zhang, Y. Formation of particulate sulfate and nitrate over the Pearl River Delta in the fall: Diagnostic analysis using the Community Multiscale Air Quality model. Atmos. Environ. 2015, 112, 81–89. [Google Scholar] [CrossRef]
  19. Yang, J.; Zhang, Y.; Ji, Z.; Yin, X.; Kang, S. Investigating air pollutant concentrations, impact factors, and emission control strategies in western China by using a regional climate-chemistry model. Chemosphere 2020, 246, 125767. [Google Scholar] [CrossRef]
  20. Yim, S.H.L.; Gu, Y.; Shapiro, M.A.; Stephens, B. Air quality and acid deposition impacts of local emissions and transboundary air pollution in Japan and South Korea. Atmos. Chem. Phys. 2019, 19, 13309–13323. [Google Scholar] [CrossRef] [Green Version]
  21. Zhang, Y.; Zhu, B.; Gao, J.; Kang, H.; Yang, P.; Wang, L.; Zhang, J. The Source Apportionment of Primary PM2.5 in an Aerosol Pollution Event over Beijing-Tianjin-Hebei Region using WRF-Chem, China. Aerosol Air Qual. Res. 2017, 17, 2966–2980. [Google Scholar] [CrossRef] [Green Version]
  22. Yao, L.; Yang, L.; Yuan, Q.; Yan, C.; Dong, C.; Meng, C.; Sui, X.; Yang, F.; Lu, Y.; Wang, W. Sources apportionment of PM 2.5 in a background site in the North China Plain. Sci. Total Environ. 2016, 541, 590–598. [Google Scholar] [CrossRef]
  23. Zhang, H.; Cheng, S.; Yao, S.; Wang, X.; Wang, C. Insights into the temporal and spatial characteristics of PM2.5 transport flux across the district, city and region in the North China Plain. Atmos. Environ. 2019, 218, 117010. [Google Scholar] [CrossRef]
  24. Ma, J.; Yu, Z.; Qu, Y.; Xu, J.; Cao, Y. Application of the XGBoost Machine Learning Method in PM2.5 Prediction: A Case Study of Shanghai. Aerosol Air Qual. Res. 2020, 20, 128–138. [Google Scholar] [CrossRef] [Green Version]
  25. Zang, L.; Mao, F.; Guo, J.; Gong, W.; Wang, W.; Pan, Z. Estimating hourly PM1 concentrations from Himawari-8 aerosol optical depth in China. Environ. Pollut. 2018, 241, 654–663. [Google Scholar] [CrossRef]
  26. Yumimoto, K.; Nagao, T.; Kikuchi, M.; Sekiyama, T.; Murakami, H.; Tanaka, T.; Ogi, A.; Irie, H.; Khatri, P.; Okumura, H.; et al. Aerosol data assimilation using data from Himawari-8, a next-generation geostationary meteorological satellite. Geophys. Res. Lett. 2016, 43, 5886–5894. [Google Scholar] [CrossRef]
  27. Che, H.; Gui, K.; Xia, X.; Wang, Y.; Holben, B.; Goloub, P.; Cuevas, E.; Wang, H.; Zheng, Y.; Zhao, H.; et al. Large contribution of meteorological factors to inter-decadal changes in regional aerosol optical depth. Atmos. Chem. Phys. 2019, 19, 10497–10523. [Google Scholar] [CrossRef] [Green Version]
  28. Karagulian, F.; Temimi, M.; Ghebreyesus, D.; Weston, M.; Kondapalli, N.K.; Valappil, V.K.; Aldababesh, A.; Lyapustin, A.; Chaouch, N.; Al Hammadi, F.; et al. Analysis of a severe dust storm and its impact on air quality conditions using WRF-Chem modeling, satellite imagery, and ground observations. Air Qual. Atmos. Health 2019, 12, 453–470. [Google Scholar] [CrossRef] [Green Version]
  29. Shi, S.; Cheng, T.; Gu, X.; Letu, H.; Guo, H.; Chen, H.; Wang, Y.; Wu, Y. Synergistic Retrieval of Multitemporal Aerosol Optical Depth Over North China Plain Using Geostationary Satellite Data of Himawari-8. J. Geophys. Res. Atmos. 2018, 123, 5525–5537. [Google Scholar] [CrossRef]
  30. Grell, G.A.; Peckham, S.E.; Schmitz, R.; McKeen, S.A.; Frost, G.; Skamarock, W.C.; Eder, B. Fully coupled “online” chemistry within the WRF model. Atmos. Environ. 2005, 39, 6957–6975. [Google Scholar] [CrossRef]
  31. Zhou, G.; Xu, J.; Xie, Y.; Chang, L.; Gao, W.; Gu, Y.; Zhou, J. Numerical air quality forecasting over eastern China: An operational application of WRF-Chem. Atmos. Environ. 2017, 153, 94–108. [Google Scholar] [CrossRef]
  32. Guenther, A.; Zimmerman, P.; Wildermuth, M. Natural volatile organic compound emission rate estimates for us woodland landscapea. Atmos. Environ. 1994, 28, 1197–1210. [Google Scholar] [CrossRef] [Green Version]
  33. Iacono, M.J.; Delamere, J.S.; Mlawer, E.J.; Shephard, M.W.; Clough, S.A.; Collins, W.D. Radiative forcing by long-lived greenhouse gases: Calculations with the AER radiative transfer models. J. Geophys. Res. Space Phys. 2008, 113. [Google Scholar] [CrossRef]
  34. Morrison, H.; Thompson, G.; Tatarskii, V. Impact of Cloud Microphysics on the Development of Trailing Stratiform Precipitation in a Simulated Squall Line: Comparison of One- and Two-Moment Schemes. Mon. Weather Rev. 2009, 137, 991–1007. [Google Scholar] [CrossRef] [Green Version]
  35. Chen, F.; Dudhia, J. Coupling an Advanced Land Surface–Hydrology Model with the Penn State–NCAR MM5 Modeling System. Part I: Model Implementation and Sensitivity. Mon. Weather Rev. 2001, 129, 569–585. [Google Scholar] [CrossRef] [Green Version]
  36. Zaveri, R.A.; Easter, R.C.; Fast, J.D.; Peters, L.K. Model for Simulating Aerosol Interactions and Chemistry (MOSAIC). J. Geophys. Res. Space Phys. 2008, 113. [Google Scholar] [CrossRef]
  37. Janjić, Z.I. Nonsingular Implementation of the Mellor-Yamada Level 2.5 Scheme in the NCEP Meso Model. Available online: https://citeseerx.ist.psu.edu/viewdoc/download?doi=10.1.1.459.5434&rep=rep1&type=pdf (accessed on 30 November 2020).
  38. Mellor, G.L.; Yamada, T. Development of a turbulence closure model for geophysical fluid problems. Rev. Geophys. 1982, 20, 851–875. [Google Scholar] [CrossRef] [Green Version]
  39. Monin, A.S.; Obukhov, A.M. The main types of the baroclinic atmosphere motions in the field of coriolis force. Dokl. Akad. Nauk SSSR 1958, 122, 58–61. [Google Scholar]
  40. Hong, J.; Mao, F.; Min, Q.; Pan, Z.; Wang, W.; Zhang, T.; Gong, W. Improved PM2.5 predictions of WRF-Chem via the integration of Himawari-8 satellite data and ground observations. Environ. Pollut. 2020, 263, 114451. [Google Scholar] [CrossRef]
Figure 1. The geographic location and digital elevation map of the eastern North China Plain (E-NCP).
Remotesensing 12 03936 g001
Figure 2. The satellite true color map (MODIS) and the distribution of AOD in the NCP region on 22 September 2019.
Remotesensing 12 03936 g002
Figure 3. The three-level nested modeling domains of the WRF-Chem model.
Remotesensing 12 03936 g003
Figure 4. The precision validation of the WRF-Chem model in the E-NCP region.
Remotesensing 12 03936 g004
Figure 5. Flow chart of regional transmission and source contribution of fine particulate matter research.
Remotesensing 12 03936 g005
Figure 6. (aj) Transmission route of the pollution process; (l) pollutant transport node and corresponding time advancing process; (m) average modelled wind speed and direction at 10 m in the E-NCP region during polluted period.
Remotesensing 12 03936 g006
Figure 7. Speed of pollutant transmission and near-surface wind. G_S and T_S represent near-surface wind speed obtained from ground-monitoring and speed of pollutant transmission, respectively.
Remotesensing 12 03936 g007
Figure 8. (a) Changes in fine particulate matter concentration and AOD during polluted period; (b) changes in planetary boundary layer height during polluted period.
Remotesensing 12 03936 g008
Figure 9. The distribution of the average contribution of local emission and external transmission of fine particulate matter in the time period 7:00–16:00 h, 22 September 2019.
Remotesensing 12 03936 g009
Table 1. Configurations of the physical and chemical schemes of the WRF-Chem model.
Physical and Chemical ProcessParameterization Scheme
Longwave radiationRRTMG scheme
Shortwave radiationRRTMG scheme
MicrophysicsMorrison two-moment scheme
Land-surfaceNoah land-surface model
Gas phase chemical mechanismRADM2
Aerosol mechanismMADE-SORGAN
Planetary boundary layerMellor–Yamada–Jajic’ TKE scheme
Surface layerMonin–Obukhov scheme
Publisher’s Note: MDPI stays neutral with regard to jurisdictional claims in published maps and institutional affiliations.

