Shaking Table Test on Dynamic Response of Bedding Rock Slopes With Weak Structural Plane Under Earthquake
 Changwei Yang1
  Liang Zhang
- 1Department of Civil Engineering, Southwest Jiaotong University, Chengdu, China
- 2Zhongke (Hunan) Advanced Rail Transit Research Institute, Zhuzhou, China
Taking a bedding rock slope with weak structural plane as the prototype, a shaking table test with a similarity ratio of 1:10 is designed and carried out. By analyzing the acceleration and displacement responses at different positions of the slope, the seismic response and instability mechanism of rock bedding slope under different seismic amplitudes, frequencies, and durations are studied. Before the failure of the slope, the rock bedding slope shows an obvious “elevation effect” and “surface effect” under the action of Wenchuan Wolong earthquake wave with different amplitudes. With the increase of the amplitude of the input seismic wave, the elevation effect and the surface effect gradually weaken. When the amplitude of the seismic wave reaches 0.9 g, the rock bedding slope begins to show damage, which demonstrates that the difference of PGA amplification coefficients on both sides of the weak structural plane increases significantly. Compared with the Kobe seismic wave and Wenchuan Wolong seismic wave, the excellent frequency of EL Centro seismic wave is closer to the first-order natural frequency of slope model and produces resonance phenomenon, which leads to the elevation effect of PGA amplification coefficient more significantly. Through the analysis of the instability process of rock bedding slope, it can be found that the failure mechanism of the slope can be divided into two stages: the formation of sliding shear plane and the overall instability of the slope.
1 Introduction
Due to the influence of collision and compression between the Indian Ocean plate and the Eurasian plate, the neotectonic movement in the mountainous area of Southwest China is extremely strong. There are a lot of active fault zones in this area, which means high-intensity earthquakes occur frequently [1, 2]. When high-intensity earthquakes occur, strong ground vibrations may induce large-scale landslides [3, 4]. For example [5–7], the Wenchuan Ms 8.0 earthquake triggered about 60,000 landslides, which caused the injuries and deaths of more than 20,000 people. Five years later, the magnitude 7.0 earthquake in Lushan also triggered more than 3,800 landslides. Debris flow from the slope collapse destroyed a lot of infrastructure and tens of thousands of people lost their homes. It can be seen that earthquakes are a significant threat to the stability of a slope.
A bedding rock slope with a weak structural plane is one of the most common slope types in Southwest China [8]. Compared with stacked slopes, this type of slope is more prone to instability and failure under seismic force. Due to the existence of weak structural planes, the instability mechanism of bedding rock slopes is extremely complex. During strong earthquakes, the increase of dynamic load and horizontal seismic force reduces the normal pressure on the weak structural plane of the slope. The overall sliding force of the slope also increases due to the earthquake inertia force [9, 10]. These reasons reduce the safety factor of the slope and make the slope unstable.
A considerable amount of research has been conducted on the seismic stability of bedding rock slopes using shaking table model tests and numerical simulation [11–14]. For example, Huang R Q [15] established a conceptual model of the failure mechanism of the layered rock mass slope through actual geological observation work on site, and studied the seismic dynamic response characteristics and failure processes of different structural types of slopes through large-scale shaking table experiments; Liu X R et al. [16, 17] used the shaking table test and numerical simulations to study the stability of bedding rock slopes under the action of the high frequency micro earthquake induced by the Three Gorges reservoir, and considered the influence of different dynamic load amplitudes, dynamic load frequencies, and slope heights on slope cumulative failure; Fan G. [18–20] carried out the shaking table test to obtain the dynamic failure mode of bedding rock slope, and used the energy identification method to characterize the development process of earthquake damage inside slope; Chen X L et al. [21, 22] proposed a method for calculating the dynamic fuzzy reliability of bedding rock slopes under random earthquake excitation based on the Newmark-beta method, and analyzed the influence of ground motion parameters and uncertainty on the reliability of bedding rock slopes. These research results have a certain guiding significance for understanding the seismic response characteristics of bedding rock slopes.
However, the existing research results are based on simple layered bedding and do not consider the influence of weak structural planes between layers on the seismic response of bedding rock slopes. Moreover, due to the randomness of seismic force and the different mechanical parameters of slopes, the slope often has different dynamic response and failure mechanisms [23], and it is necessary to study it more deeply and systematically. The large-scale shaking table physical simulation test is one of the most effective methods to reveal the seismic response and failure process of slopes. Therefore, this method is used to study the dynamic response of bedding rock slopes with weak structural planes under a strong seismic force.
In this paper, a bedding rock slope which may collapse in the southwest mountain area is selected, and the 1:10 scale shaking table physical simulation test of this slope is designed and carried out. By analyzing the acceleration and displacement responses at different measuring points of bedding rock slope in the shaking table test, the seismic dynamic response characteristics and failure processes of this slope are obtained. On this basis, the influence of seismic wave frequency, amplitude, and duration on slope dynamic response is analyzed by loading different types of seismic waves. The research results can provide a reference for the prevention and treatment of bedding rock slopes.
2 Overview of the Shaking Table Test
The Parameters of the Shaking Table
Based on the bedding rock slope at the exit of a tunnel in the mountainous area of Southwest China, the shaking table test is designed and carried out. The test site is the earthquake simulation shaking table laboratory at the School of Architecture and Civil Engineering, Xinyang Normal University. The shaking table is a large-scale one-way seismic simulation shaking table with a table size of 3 m × 3 m. The table structure is a steel-welded single-layer grid. The maximum load capacity of the table is 10 t and the maximum speed is 0.7 m/s. The frequency of this shaking table is 0.1–50 Hz, the displacement range is ±125 mm, and the maximum acceleration is 15 m/s2, which can meet the requirements of this shaking table test.
Design of Similar Systems and Similar Materials
In the shaking table simulation test, keeping the model similar to the prototype is a prerequisite to ensure the accuracy of the test results. According to the similarity theory [24], the density (ρ), elastic modulus (E), and geometric dimension (L) are taken as control parameters to design a similar system to the model test. Considering the size of the prototype slope and the condition of test equipment, the similarity constants of geometric dimensions are set to 10. The other similarity constants are shown in Table 1. The geological survey report shows that the lithology of the prototype slope is mainly quartz sandstone splint. Referring to the types of raw materials commonly used in model test and their mechanical properties [25, 26], gypsum, clay, river sand, and water are used as raw materials of similar materials in this test. Through repeated material ratio test, it is determined that the ratio of the simulated rock material is gypsum: clay: river sand: water = 1: 5.38: 1.52: 0.27, and the ratio of the weak structure plane simulated material is clay: river Sand: water = 1: 6.89: 0.25. Through a density test, direct shear test, and triaxial compression test, the density of the rock material is 1.908 g/cm3, the cohesion is 15.5 kPa, the internal friction angle is 37.9°, and the density of the structural surface material is 1.72 g/cm3. The cohesion force is 2.7 kPa and the internal friction angle is 41.7°.
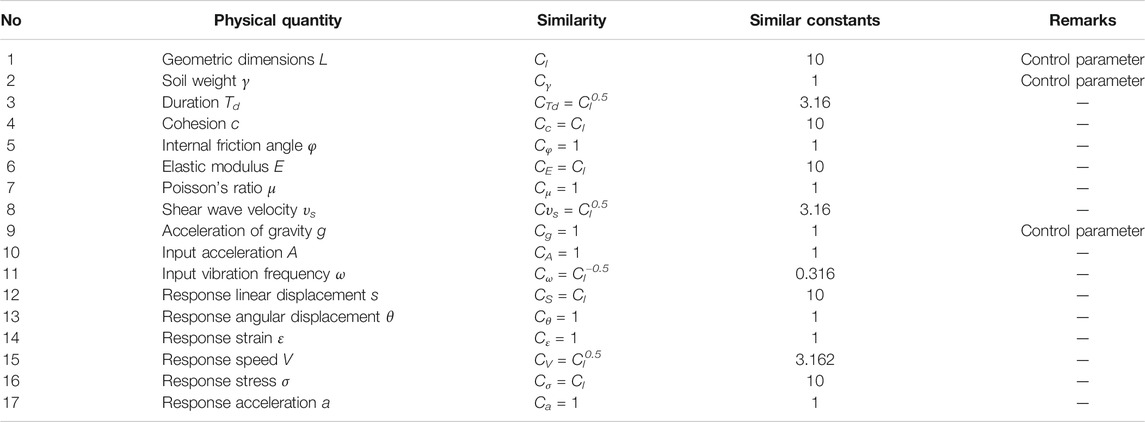
TABLE 1. Similar constants of shaking table test.
The Process of Making the Slope Model
The model box used in this model test is a rigid model box welded by angle steel, channel steel, and steel plate, and its size is 2.0 m × 2.0 m × 1.5 m (length × width × height), as shown in Figure 1. In order to observe and record the deformation and failure of the slope model during the test, 12 mm thick plexiglass is used for visualization on both sides of the model box. Vaseline was evenly applied on the inside of the plexiglass to reduce the friction between the model and the plexiglass. A polyethylene foam with a thickness of 10 cm is placed between the steel plate and the model as a shock-absorbing layer to reduce the influence of the model box boundary effect [27].
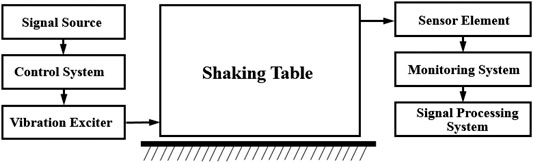
FIGURE 1. Principle of shaking table test.

FIGURE 2. The model box used in the test.
According to previous geological exploration, the prototype slope is a rock slope with many weak structural planes. These weak structural planes are approximately equally spaced. In order to facilitate the establishment of the test model, the prototype slope is simplified as a slope with parallel rock layers, the inclination angle of rock stratum is 35°, and the angle of slope foot is 60°. The thickness of the rock layer is 6 cm and the thickness of the weak structural planes is 1 cm for layered filling and compaction. In this process, the three-way acceleration sensor is arranged inside the slope body and on the slope body surface, and the acceleration sensors is also arranged on the vibrating table as a reference point for calculating the peak ground acceleration (PGA) amplification coefficient. In addition, pull-wire displacement sensors are used to measure the displacement at different heights of the slope. The test model is shown in Figure 3, and the measuring point layout is shown in Figure 4.
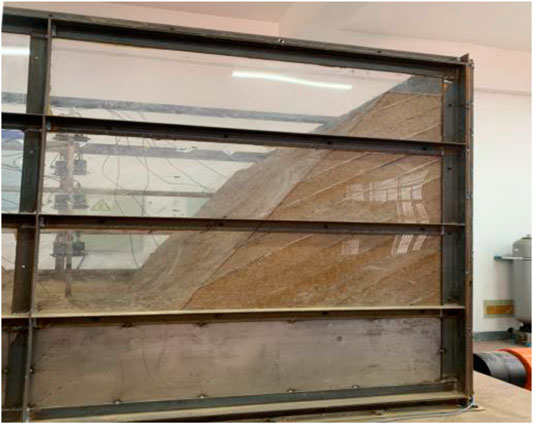
FIGURE 3. The slope model in the test.
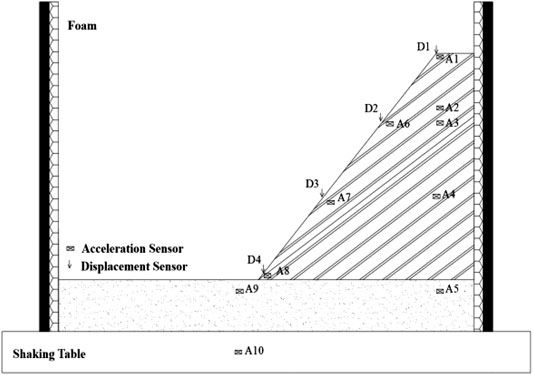
FIGURE 4. Acceleration and displacement point arrangement in the test.
The Loading Conditions of the Test
In order to study the dynamic response of bedding rock slopes under seismic waves of different frequencies, amplitudes, and durations, this test applied three seismic waves in the horizontal direction: Wenchuan Wolong seismic wave, Kobe seismic wave, and EL Centro seismic wave. The acceleration peak values of the three seismic waves are normalized, and the duration is adjusted according to the similarity relationship. The adjusted acceleration time history curves of the three seismic waves are shown in Figure 5. The shaking table test started with an amplitude of 0.1 g, and the amplitude of each seismic wave (0.1–1.2 g) was gradually increased in the order of the Wenchuan Wolong seismic wave, Kobe seismic wave, and EL Centro seismic wave until the model failed. Before each peak seismic wave loading, the model was swept by white noise with an amplitude of 0.05 g. The specific loading conditions are shown in Table 2.
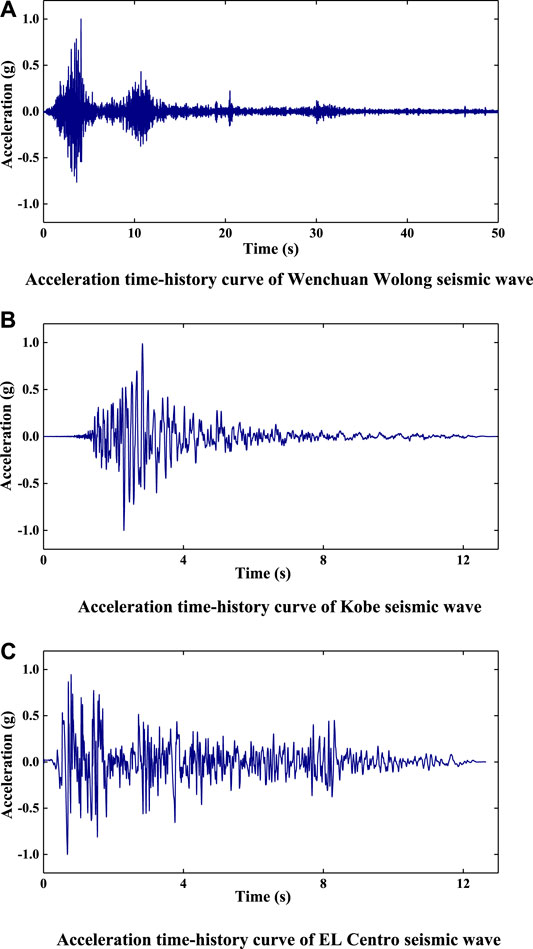
FIGURE 5. The horizontal seismic waves used in the test. (A) Acceleration time-history curve of Wenchuan Wolong seismic wave. (B) Acceleration time-history curve of Kobe seismic wave. (C) Acceleration time-history curve of EL Centro seismic wave.
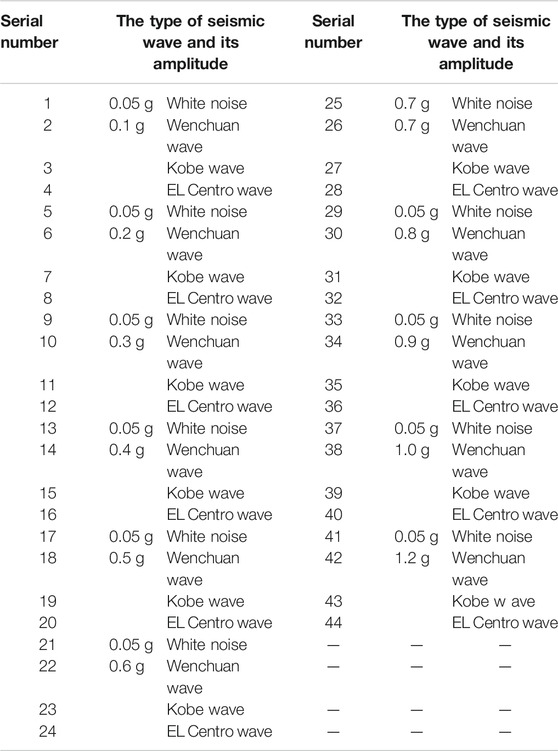
TABLE 2. Loading conditions of shaking table test.
3 Acceleration Response of Bedding Rock Slope
Acceleration Response of Slope Under Different Seismic Wave Amplitudes
Under the action of seismic force, the slope surface and slope body of the bedding rock slope generally show different acceleration responses [28, 29]. In this test, the Y-direction acceleration of A1, A2, A3, A4, and A5 measuring points is taken as the acceleration response of slope surface, and the Y-direction acceleration of A1, A6, a7, a8, and A9 is taken as the acceleration response of the slope surface. The PGA amplification coefficient is defined as the ratio of the peak acceleration of each measuring point to the peak acceleration of A10 measuring point; A10 is the peak acceleration of the shaking table. Taking the Wenchuan seismic wave as an example, the variation law of the PGA amplification coefficient of the slope surface and slope body with elevation under different seismic amplitude values is analyzed.
Figures 6 and 7 show the variation law of the PGA amplification coefficient of the slope and slope body with elevation. Before the slope failure (input seismic wave amplitude is 0.1–0.8 g), the slope has an obvious elevation amplification effect on the input seismic wave. In particular, the PGA amplification coefficient at the top of the slope increases significantly, which is about 2–3 times that at the slope shoulder (2/3 height of the slope). With the increase of seismic wave amplitude, the PGA amplification coefficient of the slope body and slope surface decreases gradually, and the elevation amplification effect weakens. The reason for this phenomenon is that the dynamic shear strength and dynamic shear modulus of slope materials decrease gradually with the increase of input seismic amplitude, and the damping ratio of slope increases, the nonlinear characteristics gradually strengthen. The slope has better isolation and damping effects, and more energy is consumed in the process of seismic wave propagation from bottom to top, which leads to the weakening of the elevation effect of the PGA amplification coefficient.
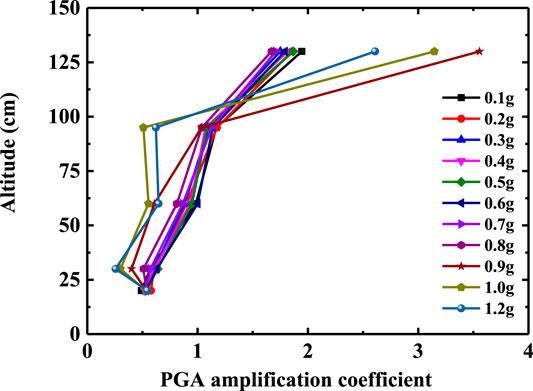
FIGURE 6. PGA amplification coefficient of slope surface under different seismic wave amplitudes.
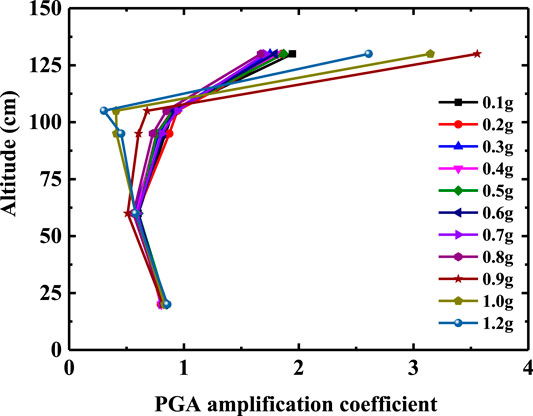
FIGURE 7. PGA amplification coefficient of slope body under different seismic wave amplitudes.
When the seismic wave amplitude reaches 0.9 g, the slope begins to show damage. Taking the slope shoulder as the boundary point, the GPA amplification coefficient of the measuring points below the slope shoulder decreases significantly. The GPA amplification coefficient of the measuring point above the slope shoulder suddenly increases, and the GPA amplification coefficient of the slope top measuring point is about 6 times that of the slope shoulder measuring point. Continuing to increase the input seismic wave amplitude, the PGA amplification coefficient of the slope top measuring point begins to decrease, but the difference between it and the slope shoulder does not change. The main reason for the above phenomenon may be that the internal structure of the slope is damaged, and there are a large number of micro-cracks in the rock mass, which divide the slope into loose blocks and enhance the filtering effect of the slope material. At the same time, the internal friction and frictional energy consumption between the slope layers increase [30], which further leads to a significant decrease in the GPA amplification coefficient of each measuring point below the slope shoulder. The slope body above the slope shoulder produces relative slip through the structural plane, and gradually separates from the main slope body. The inconsistency of slope movement on both sides of the structural plane increases, so the difference of GPA amplification coefficient increases.
Acceleration Response of Slope Under Different Seismic Waves
In order to clearly explain the variation law of slope acceleration response with elevation under different types of seismic waves, the acceleration responses of rock bedding slopes under the action of 0.1 g Wolong seismic wave, El Centro earthquake wave, and Kobe seismic wave are selected for comparative analysis, as shown in Figures 8 and 9.
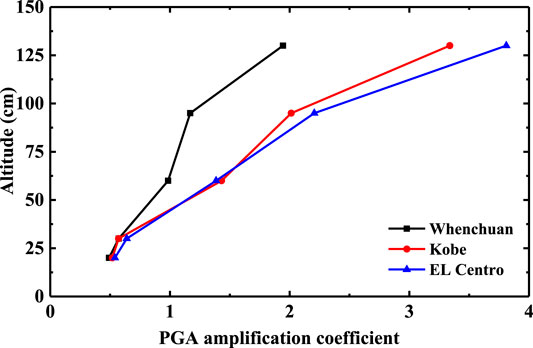
FIGURE 8. PGA amplification coefficient of slope surface under different seismic wave.

FIGURE 9. PGA amplification coefficient of slope body under different seismic wave.
It can be seen from Figures 8 and 9 that the Y-direction PGA amplification coefficient of the slope body and slope surface shows an obvious elevation amplification effect, which is independent of the seismic wave type. Comparing the PGA amplification coefficient of the slope surface and slope body under different seismic waves, El Centro seismic wave has the greatest impact on the slope, Kobe seismic wave takes the second place, and Wolong Wenchuan seismic wave is the smallest. According to the frequency spectrum analysis of acceleration time history curve, compared with Kobe seismic wave and Wenchuan Wolong seismic wave, the predominant frequency of El Centro seismic wave is closer to the first-order natural frequency of the slope model, so it is easier to produce resonance phenomenon. The acceleration time history curve of the measurement point is analyzed by FFT spectrum. Therefore, the influence of different seismic waves on the acceleration response of bedding rock slope is mainly reflected in the difference between the predominant frequency of seismic waves and the natural frequency of the slope.
Difference of Acceleration Response Between Slope Surface and Slope Body
The Y-direction PGA amplification coefficient of measuring points at the slope waist (A2 and A7) and slope shoulder (A3 and A8) under the action of Wenchuan seismic wave are selected. The difference of acceleration response between slope surface and slope body is analyzed, as shown in Figures 10 and 11.
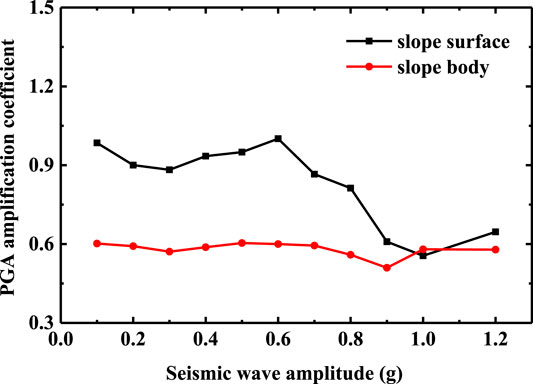
FIGURE 10. Difference of PGA amplification coefficient between slope surface and slope body (the slope waist).
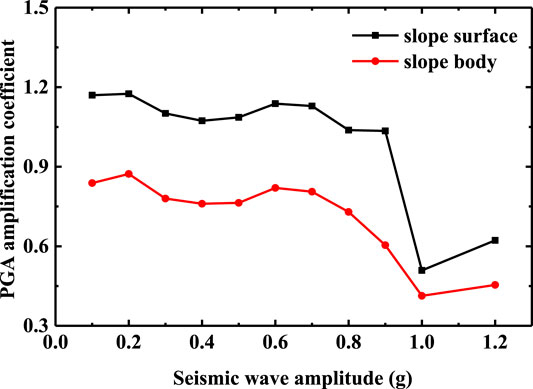
FIGURE 11. Difference of PGA amplification coefficient between slope surface and slope body (the slope shoulder).
It can be seen from Figures 10 and 11, whether at the slope waist or the slope shoulder, the PGA amplification coefficient of the slope body is always smaller than that of the slope surface. This phenomenon indicates that the seismic wave is refracted and projected on the free surface of the slope surface, which makes the acceleration response of the slope more intense, and the acceleration response of the bedding rock slope has an obvious “surface effect” [32] in the horizontal direction. With the increase of seismic amplitude, the slope begins to show damage, the cracks in the slope are gradually connected, which leads to the further strengthening of the filtering effect of the slope, and the “surface effect” is gradually reduced. Especially when the seismic amplitude reaches 1.0 g, the tensile cracks at the slope shoulder and slope waist expand and open, which further affect the horizontal acceleration response of the bedding rock slope.
4 Failure Mechanism of Bedding Rock Slope
In this test, the high-speed camera system was used to record the instability process of the slope model. The bedding rock slope began to damage in the process of the Wenchuan earthquake wave with 0.9 g amplitude, and collapsed in the process of the Wenchuan earthquake wave with 1.2 g amplitude. The whole instability process of the slope is shown in Figure 12.
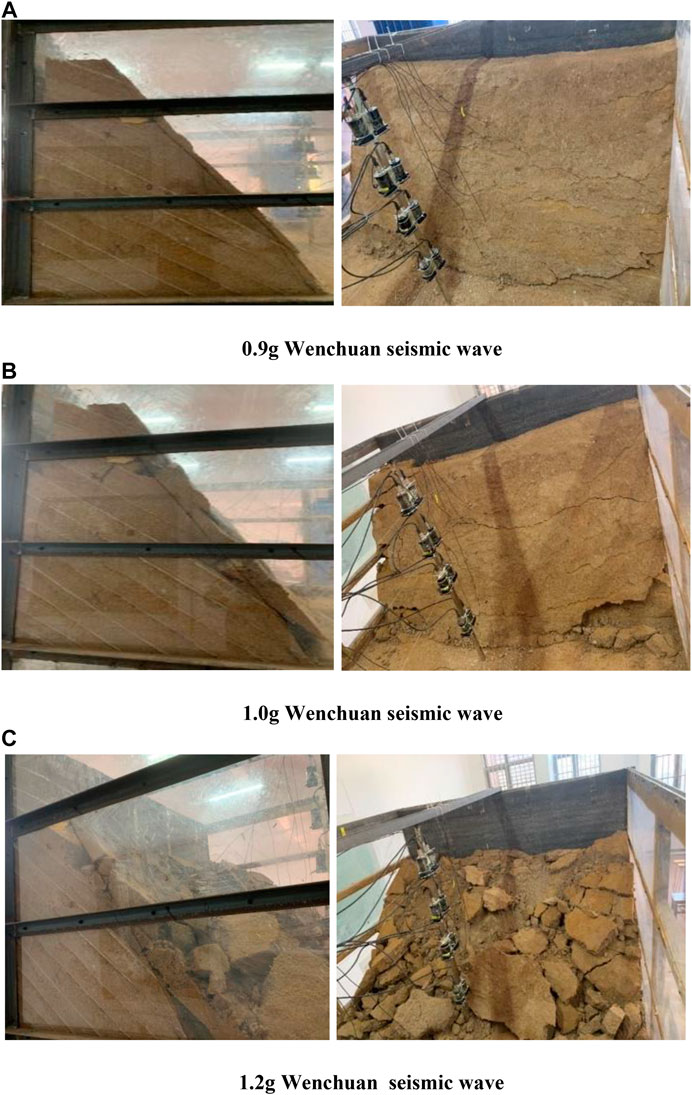
FIGURE 12. The instability process of bedding rock slope. (A) 0.9 g Wenchuan seismic wave. (B) 1.0 g Wenchuan seismic wave. (C) 1.2 g Wenchuan seismic wave.
Based on the comprehensive analysis of Figure 12, the whole instability process of bedding rock slopes can be obtained. Under the action of 0.8 g and less than 0.8 g seismic wave, the bedding rock slope does not take damage. When the input seismic wave amplitude reaches 0.9 g, the middle and upper parts of the slope gradually slide down along the weak structural plane, and the trailing edge of the slope begins to separate from the model box. The middle and upper part of the slope are blocked by the “locked section” of the slope body, which fails to slide out along the weak structural plane, and two tensile cracks perpendicular to the rock layer are generated at the shoulder and waist of the slope surface, as shown in Figure 12A. When the amplitude of the seismic wave is increased to 0.9 g, the sliding behavior of the slope is more intense, and the two tensile fissures expand and open to the weak structural plane. At the same time, there are many through cracks on the slope surface, and some rock blocks at the foot of the slope are spalling, as shown in Figure12B. When the input seismic amplitude reaches 1.2 g, the tensile fracture and the sliding structural plane connect and form a shear slip surface, which leads to the separation of the upper rock layer and lower rock layer, and the upper rock layer collapses in the form of blocks. The slope loses its stability and damages, as shown in Figure 12C.
Taking the displacement time history curves of slope surface measuring points D1, D2, and D3 under the action of 0.9 g Wenchuan seismic wave as an example, the failure mechanism of the slope is further analyzed. It can be seen from Figure 13 that the displacement of the slope surface gradually increases with the increase of elevation. This phenomenon shows that, due to the existence of a weak structural plane, the movement of different parts of the slope is not consistent, which leads to the shear slip of the top of the slope relative to the main body. In addition, the time of displacement mutation is about 5 and 14 s respectively, which corresponds to the time node when the input seismic wave reaches the double peak value.
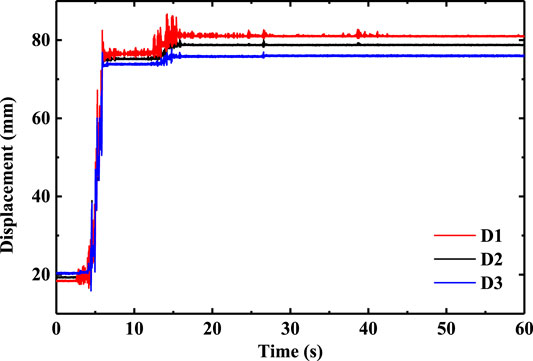
FIGURE 13. displacement time history curves of slope surface measuring points D1, D2 and D3 under the action of 0.9 g Wenchuan seismic wave.
Considering the acceleration response and displacement response of the slope, the instability mechanism of bedding rock slopes can be divided into two stages. Due to the existence of a weak structural plane, the first stage involves the inconsistent movement of different parts of the slope. Under the action of gravity and seismic force, the top of the slope slides down along the structural plane, the back edge of the slope is separated from the model box, and the tension cracks gradually expand to the structural plane in the locked section of the slope. With the continuous ground motion, the second stage sees inconsistent movement between the rock layers further increases, and the tensile fracture connects with the structural plane and forms a shear slip surface. The top slope slides out along the shear slip surface, and the slope loses its stability and damages.
5 Conclusion
In this paper, a similarity ratio of 1:10 shaking table test is designed and carried out to systematically study the seismic dynamic response and instability mechanism of rock bedding slopes under different seismic amplitudes, frequencies, and durations. The conclusion is as follows:
Firstly, the slope has an obvious elevation effect and surface effect on the input seismic wave before the slope failure. The PGA amplification coefficient at the top of slope specifically increases significantly. With the increase of seismic wave amplitude, the nonlinear and damping characteristics of slope materials change gradually. The PGA amplification coefficient of slope body and slope surface increases, while the elevation effect and surface effect decrease.
Secondly, when the seismic wave amplitude reaches 0.9 g, tension cracks occur in the slope structure and damage occurs. The GPA amplification coefficient of the slope measuring points below the sliding surface decreases significantly while that of the slope measuring points above the sliding surface increases significantly. Continuing to increase the input seismic wave amplitude, the upper area slips along the sliding surface, and gradually separates from the main body of the slope, resulting in slope destabilization and destruction.
Thirdly, the influence of different seismic waves on the acceleration response of bedding rock slopes is mainly reflected in the difference between the excellent frequency of seismic waves and the natural frequency of the slope. Compared with Kobe seismic wave and Wenchuan Wolong seismic wave, the excellent frequency of EL Centro seismic wave is closer to the first-order natural frequency of the slope model and produces resonance phenomenon, which leads to the elevation effect of the PGA amplification coefficient more significantly.
Fourthly, the instability mechanism of bedding rock slopes is mainly divided into two stages: penetration of sliding shear plane and integral instability of slope. Under the action of gravity and seismic force, rock at the top of the slope begins to slide along the structural plane, the rear edge of the slope is separated from the model box, and tension cracks gradually extend to the structural plane at the slope locking section. With the continuous seismic motion, the inconsistent movement between rock layers increases further, tension cracks run through the structural plane, the top slope slides along the shear sliding surface, and the slope loses its stability and damages.
6 Discussion
This paper selected a typical bedding rock slope in the southwest mountainous area to study its seismic response and failure mechanism. The results are basically consistent with the instability process of other similar slopes. In addition, some of the research results in this article have been applied to practical projects, such as the reinforcement of vulnerable parts of a slope. However, the seismic response of bedding rock slope is a very complex nonlinear dynamic process, which needs further improvement.
Data Availability Statement
The raw data supporting the conclusions of this article will be made available by the authors, without undue reservation.
Ethics Statement
Written informed consent was obtained from the individual(s) AND/OR minor(s)' legal guardian/next of kin for the publication of any potentially identifiable images or data included in this article.
Author Contributions
CY is the project administrator, was responsible for field tests, and proposed the research ideas. LZ is the site representative of field tests and helped CY to finish the modification of the revised article. YL (3rd author) finished the data process work. DT finished the data process work. XG finished the first version of the article. LY (6th author) helped Zhang Liang to finish the field tests.
Funding
This study is supported in part by Natural Science Foundation of China (Contract NO. 51408510), Sichuan Provincial Science and Technology support project (NO.2016GZ0338), The Fundamental Research Funds for the Central Universities (NO. 2682016CX023), 2016–2018 Young Elite Scientist Sponsorship Program by CAST/CSRME (YESS), Nanchang Railway Bureau scientific research project (NO. 20171106), and the Education department of Sichuan Province scientific research project (NO. 16ZB0012). The authors declare that this study received funding from China National Railway Group Co. Ltd., China Academy of RAILWAY Sciences Corporation Limited and China Railway Eryuan Engineering Group Co. Ltd. The funder was not involved in the study design, collection, analysis, interpretation of data, the writing of this article, or the decision to submit it for publication.
Conflict of Interest
The authors declare that the research was conducted in the absence of any commercial or financial relationships that could be construed as a potential conflict of interest.
References
1. Royden LH, King RW, Chen Z, Liu Y. Surface deformation and lower crustal flow in eastern Tibet. Science (1997). 276(5313):788–90. doi:10.1126/science.276.5313.788.
2. Judith H, John HS. Uplift of the Longmen Shan and Tibetan plateau, and the 2008 Wenchuan (m = 7.9) earthquake. Nature (2009). 458(7235):194–7. doi:10.1038/nature07837
3. Jongmans D, Stéphane Garambois S. Geophysical investigation of landslides: a review. Bull Soc Geol Fr (2007). 178(2):101–12. doi:10.2113/gssgfbull.178.2.101.
4. Guo CB, David RM, Zhang YS, Wang K, Yang ZH. Quantitative assessment of landslide susceptibility along the Xianshuihe fault zone, Tibetan Plateau, China. Geomorphology (2015). 248:93–110. doi:10.1016/j.geomorph.2015.07.012.
6. Zhou Z, Ma G, Chang M, Li WL, Zhang DD, Jia T. Landslides triggered by the 20 April 2013 Lushan earthquake, Sichuan province, China. Eng Geol (2015). 187:45–55. doi:10.1016/j.enggeo.2014.12.004.
7. Wang WP, Yin YP, Yang LW, Zhang N, Wei YJ. Investigation and dynamic analysis of the catastrophic rockslide avalanche at Xinmo, Maoxian, after the Wenchuan Ms 8.0 earthquake. Bull Eng Geol Environ (2020). 79(1):495–512. doi:10.1007/s10064-019-01557-4.
8. Zhang S, Guang-Ze Z, Liang-Wen J, Guang WU. Analysis of the characteristics of major geological disasters and geological alignment of sichuan-tibet railway. Railway Std Design (2016). 1:14–9. doi:10.13238/j.issn.1004-2954.2016.01.003
9. Xiao KQ, Li HB, Liu YQ, Xia X, Zhang LQ. Study on deformation characteristics of bedding slopes under earthquake. Rock Soil Mech (2007). 28(8):1557–64. doi:10.1016/S1874-8651(08)60066-6
10. Gong W, Li Y, Zhao X, Chen X. Dynamic reliability analysis of bedding slope under non-stationary earthquake. J Huazhong Univ Sci Technol (Nat Sci Edn) (2018). 46(10):1–6. doi:10.13245/j.hust.181001
11. Xiangning J, Qiangbing H, Tao W, Ning Z, Zikan J. Shaking table test of dynamic responses of loess-mudstone slopes with a steep dip bedding fault zone. Chin J Rock Mech Eng (2018). 37(12):85–96. doi:10.13722/j.cnki.jrme.2018.0719-en
12. Yu-Chuan Y, Hui-Ge X, Xing-Guo Y, Ming-Liang C, Jia-Wen Z. Experimental study on the dynamic response and stability of bedding rock slopes with weak interlayers under heavy rainfall. Environ Earth Sci (2018). 77(12):433. doi:10.1007/s12665-018-7624-y
13. Che A, Yang H, Wang B, Ge X. Wave propagations through jointed rock masses and their effects on the stability of slopes. Eng Geol (2016). 201:45–56. doi:10.1016/j.enggeo.2015.12.018.
14. Dong L, Sun D, Li X, Zhou Z. Interval non-probabilistic reliability of a surrounding jointed rockmass in underground engineering: a case study. IEEE Access (2017). 5:18804–17. doi:10.1109/access.2017.2745705.
15. Huang R, Li G, Ju N. Shaking table test on strong earthquake response of stratified rock slopes. Chinese J Rock Mech Eng (2013). 32(5):865–75. doi:10.3969/j.issn.1000-6915.2013.05.003
16. Liu XR, Xu B, Liu YQ, Wang JW, Lin GY. Cumulative damage and stability analysis of bedding rock slope under frequent microseisms. Chin J Geotech Eng (2020). 42(4):631–41. doi:10.1007/s12517-020-05299-6
17. Liu SL, Yang ZP, Liu XR, Liu YQ, Hu YN, Wu ZS. Shaking table model test and numerical analysis of the bedding rock slopes under frequent micro-seismic actions. J Rock Mech Eng (2018). 037(010):2264–76. doi:10.1007/s10706-018-0679-4
18. Fan G, Zhang J, Wu J, Yan K. Dynamic response and dynamic failure mode of a weak intercalated rock slope using a shaking table. Rock Mech Rock Eng (2016). 49(8):3243–56. doi:10.1007/s00603-016-0971-7.
19. Fan G, Zhang LM, Zhang JJ, Yang CW. Time-frequency analysis of instantaneous seismic safety of bedding rock slopes. Soil Dynam Earthq Eng (2017). 94:92–101. doi:10.1016/j.soildyn.2017.01.008.
20. Fan G, Zhang JJ, Fu X, Zhou LR. Dynamic failure mode and energy-based identification method for a counter-bedding rock slope with weak intercalated layers. J Mt Sci (2016). 13(12):2111–23. doi:10.1007/s11629-015-3662-z.
21. Chen XL, Gao RX, Gong W. Random seismic response and dynamic fuzzy reliability analysis of bedding rock slopes based on pseudoexcitation method. Int J Geomech (2018). 8(3):04017165. doi:10.1061/(ASCE)GM.1943-5622.0001084.
22. Chen X, Gong W, Zhong X, Qiu J, Li Y. Dynamic reliability analysis of bedding rock slopes under horizontal and vertical earthquake actions. China Civ Eng J (2017). 50(10):91–8. doi:CNKI:SUN:TMGC.0.2017-10-012
24. Zuo-Bao C, Chen-Cong X, Liu-Cai H, Shen Q, Xiao-Guo F, Liu Xiao W. Research on similar material of slope simulation experiment. Rock Soil Mech (2014). 5(11):125–8. doi:10.1007/BF02911033
25. Liu-Han X. Research on seismic dynamic response of rock slope based on shaking table test. Chengdu, China: Chengdu University of Technology (2014).
26. Dong JY, Yang GX, Wu FQ. The large-scale shaking table test study of dynamic response and failure mode of bedding rock slope under earthquake. Rock Soil Mech (2011). 10:2977–82. doi:10.1177/0883073810379913
27. Yang-Chang W. Research on the ground motion characteristics of rock slope and the landslide genesis mechanism, stability identification and damage scope evaluation system of base-covered slope. Chengdu, China: Southwest Jiaotong University (2013).
28. Dong L, Wesseloo J, Potvin Y, Li X. Discriminant models of blasts and seismic events in mine seismology. Int J Rock Mech Min Sci (2016). 86:282–91. doi:10.1016/j.ijrmms.2016.04.021.
29. Fan G, Zhang JJ, Fu X. Dynamic response differences between bedding and count-tilt rock slopes with siltized intercalation. Chinese J Geotech Eng (2015). 37(4):692–9. doi:10.11779/CJGE201504015
30. Changwei Y, Ning F, Jianjing Z, Junwei B, Jun Z. Research on time-frequency analysis method of seismic stability of covering-layer type slope subjected to complex wave. Environmental earth ences (2015). 74(6):5295–306. doi:10.1007/s12665-015-4540-2.
31. Dong L, Zou W, Li X, Shu W, Wang Z. Collaborative localization method using analytical and iterative solutions for microseismic/acoustic emission sources in the rockmass structure for underground mining. Eng Fract Mech (2018). 210:95–112. doi:10.1016/j.engfracmech.2018.01.032.
32. Dong L, Wesseloo J, Potvin Y, Li X. Discrimination of mine seismic events and blasts using the Fisher classifier, naive bayesian classifier and logistic regression. Rock Mech Rock Eng (2016). 49(1):183–211. doi:10.1007/s00603-015-0733-y.
Keywords: shaking table test, bedding rock slopes, dynamic response, peak acceleration amplification coefficient, failure mechanism
Citation: Yang C, Zhang L, Liu Y, Tian D, Guo X and Liu Y (2020) Shaking Table Test on Dynamic Response of Bedding Rock Slopes With Weak Structural Plane Under Earthquake. Front. Phys. 8:556714. doi: 10.3389/fphy.2020.556714
Received: 28 April 2020; Accepted: 02 October 2020;
Published: 01 December 2020.
Edited by:
Alex Hansen, Norwegian University of Science and Technology, NorwayReviewed by:
Haroldo V. Ribeiro, State University of Maringá, BrazilFeifei Wang, Chongqing Jiaotong University, China
Copyright © 2020 Yang, Zhang, Liu, Tian, Guo and Liu. This is an open-access article distributed under the terms of the Creative Commons Attribution License (CC BY). The use, distribution or reproduction in other forums is permitted, provided the original author(s) and the copyright owner(s) are credited and that the original publication in this journal is cited, in accordance with accepted academic practice. No use, distribution or reproduction is permitted which does not comply with these terms.
*Correspondence: Liang Zhang, zhangliangdpme@my.swjtu.edu.cn