Effects of Dissociation Water Retention on Pore Structure Disintegration in Hydrate Sediments
 Liu Yang1*
  Shuo Wang
- 1State Key Laboratory for Geomechanics and Deep Underground Engineering, China University of Mining and Technology (Beijing), Beijing, China
- 2Guangzhou Marine Geological Survey, China Geological Survey, Guangzhou, China
During the depressurization process, natural gas hydrates (NGHs) decompose and release methane gas and water. Field experience shows that only 1% of the dissociation water is recovered, hindering the continuous pressure decline and further NGHs decomposition. The retention effect of the dissociation water on the pore structure is still unclear in NGHs sediments. In this paper, the hydrate sediment samples were tested for porosity, permeability, pore structure and clay minerals content, etc. The ions concentration change of solution was continuously measured using a conductivity meter to evaluate the disintegration mechanism of sediments. The results show that the pore structure of sediments tend to disintegrate under the action of dissociation water, leading to an increase in the ions concentration of dissociation water. According to the ions concentration curve, the sediment disintegration is divided into two stages. The rapid disintegration stage is mainly related to clay minerals. The slow disintegration stage is mainly related to the dissolution of soluble salt minerals. The initial water content is the main factor affecting the disintegration of the sediment skeleton. Under the condition of low initial water content, the sediment skeleton disintegrates instantaneously in dissociation water. When the initial water content exceeds 30.6–37.9%, the pore structure of sediments tends to be stable in dissociation water. Studying the effect of dissociation water on the sediment pore structure is helpful to understand the mechanism of low water production and to optimize the exploitation regime of gas hydrate.
1. Introduction
Natural gas hydrates (NGHs) are ice-like crystalline materials that exist under coexistence conditions of high pressure and low temperature (less than 300 K) (Cai et al., 2020b). The natural gas molecule is confined within the hydrogen bond molecule, and the molecular structure resembles a cage structure (Pandey et al., 2019). NGHs are mainly distributed in deep seas below 300 m and in permafrost zones. As one of the new energy sources, the total energy of an NGH is about two times larger than that of conventional oil and gas resources (Cai et al., 2020a). It is regarded as an energy source and has broad prospects for development. According to the molecular structure of hydrate, 1 cubic meter of NGHs can decompose and release about 164 cubic meters of methane gas and 0.8 cubic meters of water. However, less than 1% of the dissociation water can be produced, and a large amount of water is retained in the NGHs sediments (Yang et al., 2020). It has a significant impact on the pore structure and water-gas flow (Omelchenko and Makogon, 2013; Linga and Clarke, 2017; Shen et al., 2019). It involves the physical and chemical processes, which has not been well studied yet (Radich et al., 2009; Kang et al., 2016).
Water retention refers to the water content in the sediment under a certain capillary force (Mahabadi et al., 2016). As an important parameter, capillary force is usually integrated into the water retention function (Moridis and Sloan, 2007). In the initial stage of dissociation, the capillary force between hydrate particles promotes the combination of dissociated water and undecomposed hydrate into large particles, which hinders the subsequent separation of hydrate (Chen et al., 2014). Many researchers have established mathematical equations to quantitatively analyze water retention. The most commonly used model is the Van Genuchten model. Water retention has an important influence on the dissociation of hydrates (Van Genuchten, 1980; Mahabadi et al., 2016; Moridis and Sloan, 2007; Moridis and Reagan, 2007; Gamwo and Liu, 2010; Anderson et al., 2011). The hydrate dissociation can change the relative permeability of water and gas as a function of hydrate saturation (Mahabadi et al., 2016). Numerous researchers have conducted extensive research on the dissociation process of hydrates and the flow of dissociation water. Zhong et al. (Zhong et al., 2019) used in-situ Raman spectroscopy to study the effects of gas composition and temperature on the structure transformation of hydrate dissociation. Mahabadi et al. (Mahabadi et al., 2019) proposed that the permeability of hydrate sediment directly affected the dissociation of hydrates and the production of methane gas. He established the relationship model between permeability and hydrate saturation. The dissociation water hinders the production of methane gas from hydrate-bearing sediments. Jin et al. (Jin et al., 2019) established a new dissociation model to identify the hydrodynamic mechanism, and reproduced the process of dissociation water into ice. Shagapov and Tazetdinov (Shagapov and Tazetdinov, 2014) simulated the hydrate dissociation process by MRI and found that the liquid water produced by the dissociation hindered the release of methane gas.
Hydrate sediments are argillaceous siltstone, so high water retention may cause disintegration of the sediment structure. At present, a large number of studies have focused on the disintegration of terrestrial rocks in water. Luo et al. (Luo et al., 2020) studied the decomposition of pyrite in carbonaceous rocks. Its decomposition changed the pH value of the aqueous solution, leading to the collapse of the porous media structure. By changing the pH of the solution, Huang et al. (Huang et al., 2017) found that argillaceous shale is more prone to disintegration under acidic solution conditions. Yan’s research (Yan et al., 2018) pointed out that temperature can accelerate the interaction of water and red-bed soft rock and increase the rate of soft rock disintegration. Zhang et al. (Zhang et al., 2018) performs 11 wet and dry cycles on mudstone. He found that the dry-wet cycle in the early stage had a greater impact on the disintegration of mudstone. Yang et al. (Yang et al., 2020) has quantitatively studied the dispersion time of hydrate sediments. When the moisture absorption time exceeds the dispersion time, the sediments will disintegrate.
A large number of studies have proved that water retention can cause the structure of porous media to collapse. However, the characteristics of the sediments structure caused by water retention have not been clearly studied. The basic characteristics are studied by a series of tests, such as porosity, permeability, pore structure and clay minerals content. The conductivity meter is used to measure the ions concentration change of solution, which can be used as an evaluation method for pore structure disintegration.
2. Materials and Methods
The experiments are divided into three groups. The first experimental group is conducted on eight samples of three sediments under normal pressure and temperature. The conductivity curves are used to characterize the disintegration process of hydrate sediment. The basic information of sediment samples is shown in Tables 1 and 2. The second group of experiments is to determine the effects of initial water content on disintegration process. The basic information of sediment samples is presented in Table 3. In the third group of experiments, the effects of different temperature on disintegration are studied and the basic information of sediment samples is presented in Table 4.

TABLE 1. The basic information of different sediments.
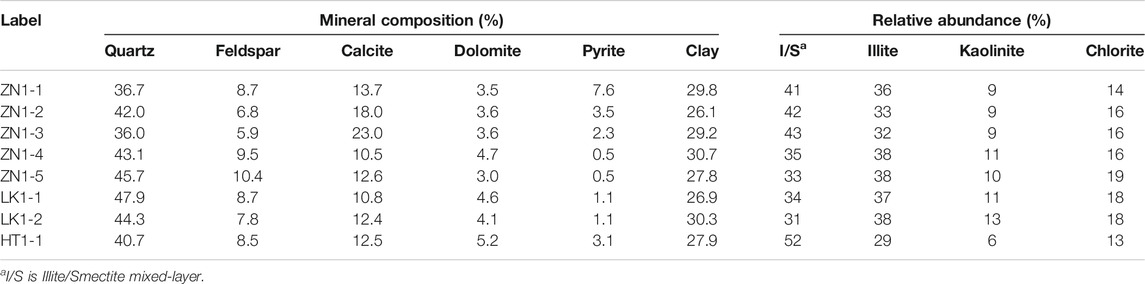
TABLE 2. Mineral composition analysis.
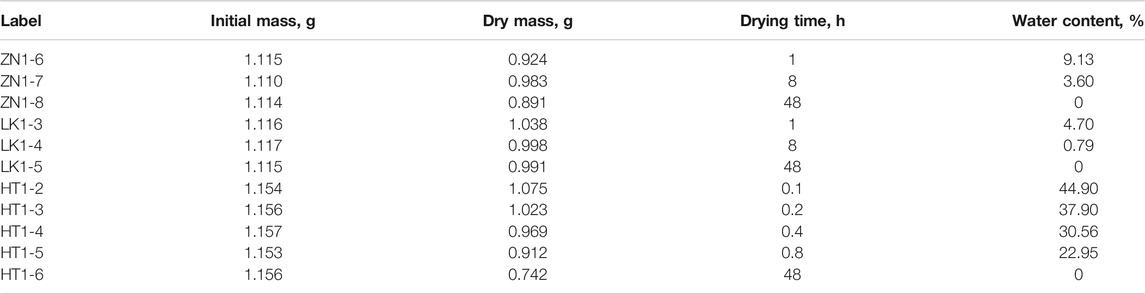
TABLE 3. The sample information for water content test.

TABLE 4. The sample information for temperature effects analysis.
2.1. Samples Characterization
Figure 1 presents the experimental samples of different sediments. The surfaces of the samples are not smooth, and they contain a great amount of cracks and large pores. In addition, the samples have different colors, which may be related to initial water content. The larger the water content is, the darker the color is. The samples with higher water content are black, and the dry samples are gray.
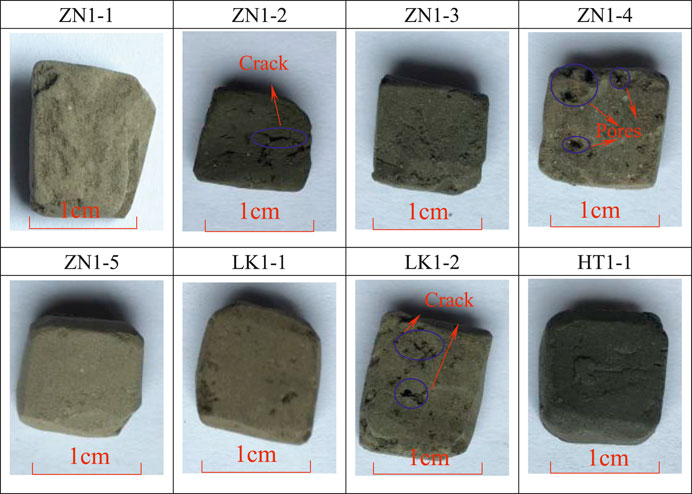
FIGURE 1. The experimental samples of different sediments.
The basic information of different sediments is shown in Table 1. The permeability of three sediments is about 0.324–7.805 mD, and the average permeability is about 3.6 mD. The sediments present low permeability characteristics. The porosity of three sediments is about 21.47–35.39%, and the average porosity is about 30.74%. The sediments present high porosity characteristics. The specific surface area is about 6.4512–13.84 m2/g, and the average value is about 11.0822 m2/g. The permeability, porosity and specific surface area help understand the basic properties of three sediments and study the influencing factors of pore structure disintegration.
According to the mineral composition analysis, the main minerals are quartz and clay. The quartz minerals account for nearly half of the total mineral content (Table 2). The mineral composition data of some hydrate sediments comes from Yang et al., 2020. The clay mineral content is about 26.1%–30.7%. The other mineral content is not more than 10%, such as feldspar, calcite, and dolomite. The clay mineral contents of ZN, LK and HT are 28.7%, 28.6% and 27.9%. The three sediments have nearly equal clay minerals content, but the relative abundance of clay minerals is quite different. The Illite/Smectite mixed-layer (I/S) and illite minerals are main clay minerals. The I/S minerals have strong water sensitiveness, which can result in expansion and pore structure disintegration. According to the mineral composition, the average I/S minerals contents of ZN, LK and HT are 11.1%, 9.2% and 14.5%, respectively.
2.2. Experimental Procedures
The conductivity meter (Mettler Toledo SevenExcellence) is used to determine the ions concentration change of solution (Figure 2A). The range of conductivity is 0.01∼500 uS/cm, and that of the total dissolved solids is 0.01 mg/L∼300 g/L. The measurement temperature is –5°∼105°C. The conductivity meter is composed of an electrode, movable bracket and host. The ions are dissolved in the dissociation water, causing the concentration of the solution to rise. The ions form a conductive loop with the conductivity meter, thereby measuring the conductivity change. The experimental balance (Metter Toledo ME204E) is used to measure the sample mass (Figure 2B). The measurement accuracy is 0.1 mg, and the range is 0–220 mg.
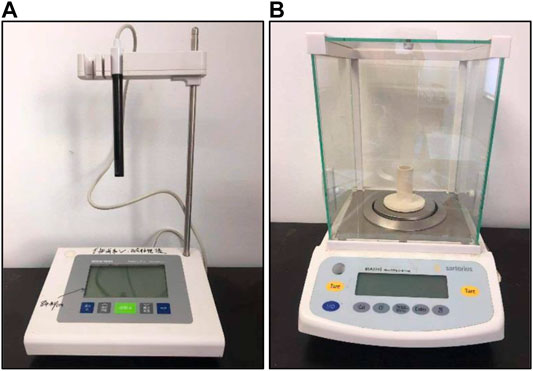
FIGURE 2. The experimental device (A) conductivity meter and (B) experimental balance.
Experimental materials include 250 ml beaker, 100 ml measuring cylinder, plastic wrap, rubber band, conductivity meter, electronic balance, tweezers, vernier caliper, drying box, measuring test paper, knife, and thermometer. The schematic diagram of disintegration experiment is presented in Figure 3.

FIGURE 3. The schematic diagram of the disintegration experiment.
The experimental procedures of first group are as follows.
(1) Cut the sample into prisms with a knife, measure the size of the sample with a vernier caliper, and weigh the sample with an electronic balance.
(2) Pour 200 ml distilled water into the beakers and place the samples in the water
(3) Immerse the conductive electrode in the water to measure the conductivity. After testing, the beakers are sealed with plastic wrap and a rubber band.
(4) Repeat the step 3 to determine the conductivity change over soaking time.
The experimental procedures of second group are as below.
(1) The different water content can be established by drying the sample. Dry the samples in the oven for 1, 8 and 48 h. After the drying process of 48 h, the mass of samples do not change any more, and the water content is 0. The water content Sw is defined as
where mw is the mass of sample containing water, and md is the mass of dried sample.
(2) Conduct the disintegration experiments according to the procedures of first group.
The experimental procedures of third group are as follows.
(1) Heat distilled water to 27.5°C, 40°C and 60°C. Keep the temperature constant during the experiment.
(2) Conduct the disintegration experiments according to the procedures of the first group, and study the effects of temperature.
3. Results and Discussion
3.1. Observations During Disintegration Experiments
Figure 4 presents the observations during disintegration experiments. The whole process can be divided into four stages: decompaction stage, particle collapse stage, fracture propagation stage and structure destruction stage. The water enters into the pores, resulting in the pore structure decompaction. After a certain period, the particles begin to scatter. Some fractures appear to form fracture networks. At the final stage, the skeleton structure of samples tends to be destroyed completely. It suggests that the retention of dissociation water can destroy pore structure in hydrate sediments.
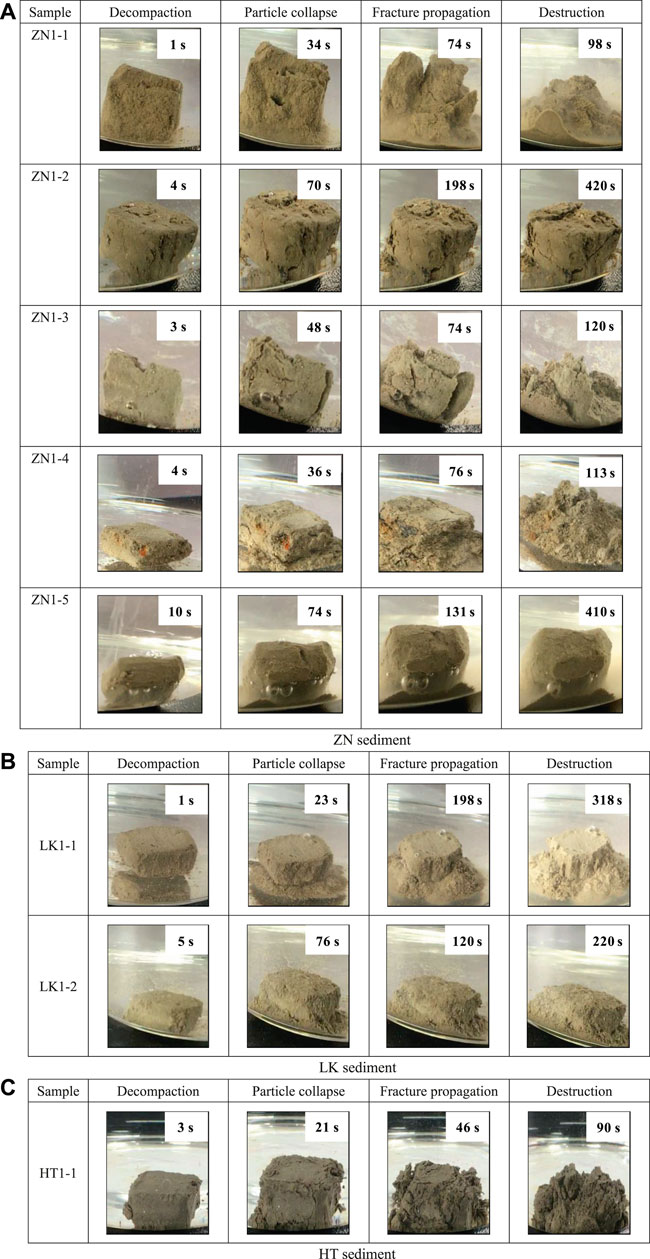
FIGURE 4. The diagram of disintegration process (A) ZN sediment, (B) LK sediment and (C) HT sediment.
It should be noted that different sediments present different disintegration characteristics. In terms of pore structure, the particle diameter of ZN and LK sediments is much smaller than that of HT sediments. The dissociation water leads to more destruction on pore structure in ZN and LK sediments. However, the pore structure of ZN1-2 and ZN1-5 is relatively complete after disintegration experiments. Maybe the samples of ZN1-2 and ZN1-5 have much larger cementing strength. In terms of disintegration time, large disintegration time suggest low disintegration rate. Except for the ZN1-2 and ZN1-5 sample, the disintegration time of ZN and LK sediment samples is about 90–113 s. The disintegration time of LK sediment is about 220–318 s. The ZN and LK sediments have a smaller disintegration rate than LK sediment. In terms of disintegration process, the fractures propagate rapidly in the samples with fast disintegration. No buffering occurs, and they finally become fine sands. For the samples with slow disintegration, fractures propagation is slow in the disintegration process. Many bubbles appear on the surface of sample ZN1-5 and no obvious cracks occur. The skeleton structure softens gradually and homogeneously, preventing rapid gas discharge (Cui et al., 2018).
3.2. Characteristics of Ions Diffusion in Disintegration Experiments
The conductivity tests are used to analyze the solution concentration during the disintegration experiments. Figure 5A presents the solution conductivity curves corresponding to eight samples. The overall trends of conductivity curves are similar in spite of different characteristics in three sediments. At the initial stage, the conductivity increases significantly. When the soaking time exceeds about 25 h, the rate of conductivity rise slows down. From 600 to 1,000 h, the conductivity curve basically does not increase with time.
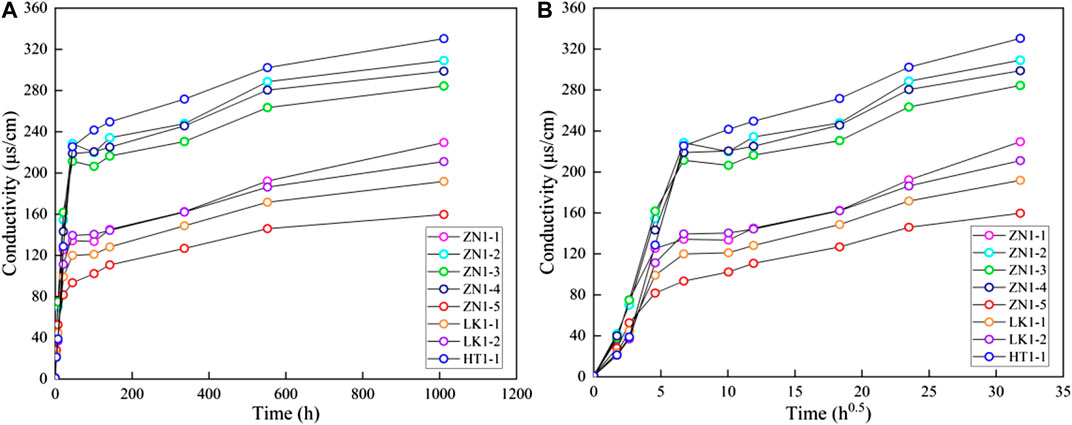
FIGURE 5. The conductivity curves of different sediments (A) conductivity vs. t and (B) conductivity vs. sqrt (t).
Figure 5B presents the relationship between solution conductivity and the square root of time. The bilinear characteristics are observed in conductivity curves of three samples. In other words, the disintegration process can be divided into two stages: a rapid disintegration stage and a slow disintegration stage (Figure 6). In the rapid disintegration stage, the expansion deformation occurs due to clay minerals expansion and the dissociation water rapidly destroys the pore skeleton. The soluble salt in the pores is rapidly released, resulting in the fast conductivity rise. The bond ability of particles is diminished, thereby accelerating ions diffusion. In the slow disintegration stage, the conductivity rise is mainly related to the dissolution of soluble salt minerals. A large amount of salt minerals dissolve and diffuse into the dissociation water, causing the sediment skeleton to further disperse and eventually become powdery. In general, the change of solution conductivity can well reflect the disintegration process of different sediments. The slope of conductivity curves represents the ions diffusion rate, which can be considered as the characteristic parameter of the disintegration rate. In the following paragraphs, the sediments characteristics are studied, such as water content, temperature, clay minerals, pore structure, porosity, and permeability. The effects of dissociation water retention on pore structure are clarified.
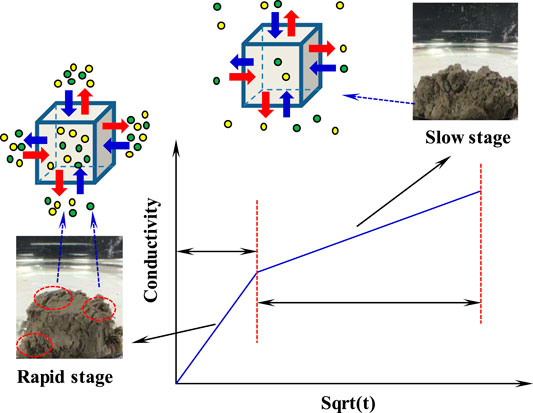
FIGURE 6. The conductivity curve diagram.
3.3. Influencing Factors of Pore Structure Disintegration
3.3.1. Effects of Initial Water Content
The disintegration experiments are conducted on HT sediments to study the effects of initial water content. It helps clarify the relationship between the disintegration state of hydrate sediments and water content under the effects of dissociation water. The water content of HT1-2, HT1-3, HT1-4 and HT1-5 are 44.9%, 37.9%, 30.6% and 22.9%, respectively. The disintegration observations of four samples are presented in Figure 7. The sample with high initial water content does not cause disintegration, but a low initial water content is liable to cause disintegration. A critical value (30.6% to 37.9%) exits. When the initial water content exceeds 30.6%–37.9%, the pore structure of sediments tends to be stable in dissociation water.
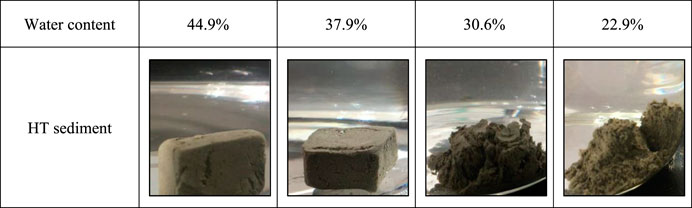
FIGURE 7. Disintegration diagram of samples with different water content.
The ZN sediments samples (ZN1-6 and ZN1-7) and LK sediments samples (LK1-3 and LK1-4) are used to establish the relationship between initial water content and electrical conductivity. It helps to analyze the effect of dissociation water on pore structure. Figure 8 presents the conductivity change over soaking time. As for the same sediment, the conductivity rise rate of samples with higher water content is faster than that of samples with lower water content. However, the conductivity difference between samples with higher water content and samples with lower water content changes over soaking time. According to the conductivity difference, the disintegration process can be divided into three stages. In the first stage, the rate of conductivity rise is the same and the conductivity is approximately equal. In the second stage, the rise rate of samples with lower water content is accelerated, and the conductivity difference increases with time. In the third stage, the conductivity difference does not change with time. The final conductivity difference of ZN sediment is about 8 uS/cm, and that of LK sediment is about 13 uS/cm.
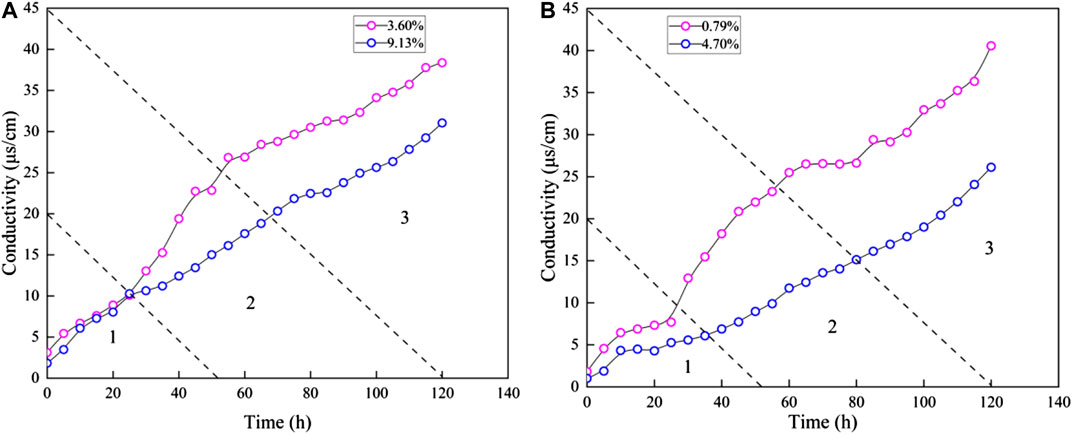
FIGURE 8. Conductivity curves with different water content (A) ZN sediment and (B) LK sediment.
By comparing the disintegration characteristics of samples with different water content, the particles adhesion capacity of samples in the environment of high water content is greater than that in the environment of low water content (Zhao et al., 2015). In the case of dissociation water, samples with higher water content are more resistant to destruction. The higher the water content, the less likely it is to disintegrate. In other words, the water existence can increase the cementing strength of sediments, and contribute to pore structure stability during the NGH depressurization process.
3.3.2. Effects of Temperature
Gas hydrate can exist stably in a real environment that corresponds to certain temperature and pressure. Therefore, the sediment disintegration should involve the temperature effects. Figure 9 presents the relationship between conductivity curves and temperature. It suggests that the conductivity of ZN sediments samples increases with temperature. At the slow disintegration stage, the pore structure of sediments is completely destroyed, and its temperature environment had little effect on disintegration process. Therefore, only the temperature tests are carried out to study the disintegration characteristics at the fast disintegration stage. At 170 min, the conductivity value at 60°C is about 3 times as large as the conductivity value at 27.5°C. According to the conductivity difference at different temperatures, the conductivity curve is divided into two stages. The first stage corresponds to the disintegration process before 20 min. In spite of the different temperatures, the rate at which the conductivity rises is basically the same. The second stage corresponds to the disintegration process after 20 min. The higher the temperature, the faster the rate of conductivity rises.
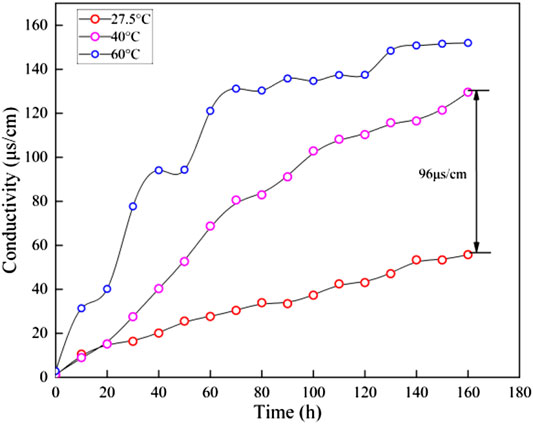
FIGURE 9. The relationship between conductivity curves and temperature.
It should be noted that the conductivity rise rate is unstable at a temperature of 60°C. The high temperature result in the intense and disordered ions diffusion and complex disintegration process (Figure 9). The high temperature contributes to accelerating the disintegration process of the hydrate sediment. High temperatures make molecules move faster, and ion migration is more efficient (Figure 10). During the gas hydrate exploitation, temperature rise is an effective to intensify hydrate decomposition, resulting in more dissociation water. The residual heat may accelerate the process of microscopic pore structure destruction.
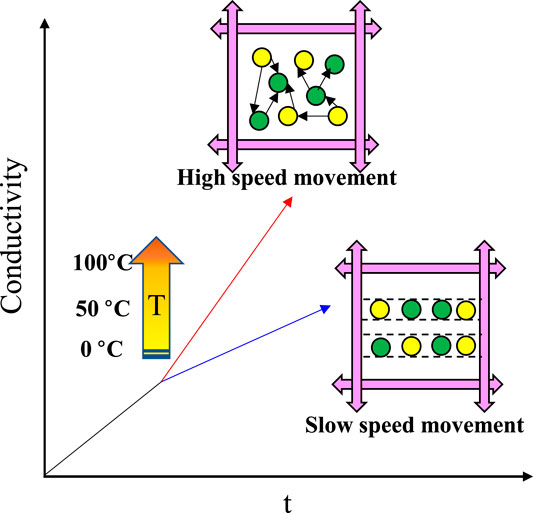
FIGURE 10. Schematic diagram of disintegration influenced by temperature.
3.3.3. Effects of Clay Minerals
The mineral composition has important effects on disintegration, especially clay minerals and salt minerals. The total amount of clay minerals and the relative content of each mineral are obtained by X-ray diffraction analysis, as shown in Table 2. The salt minerals are too limited to measure accurately. The scanning electron microscopy (SEM) can help analyze the distribution characteristics of salt minerals (Figure 11). The soluble salts and clay minerals are present in the ZN sediment.
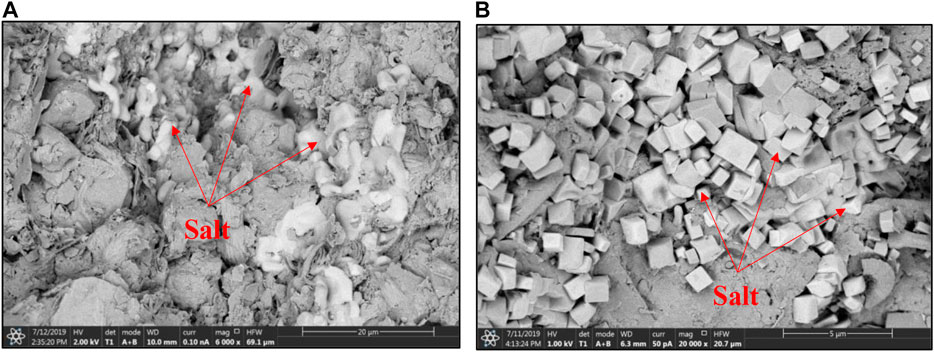
FIGURE 11. SEM pictures (A) ZN1-1 and (B) ZN1-2.
Figure 12A presents the effects of clay minerals on ions diffusion rate. The ions diffusion rate is positively related to total clay mineral content. The larger the amount of total clay minerals, the faster the ions diffusion rate. The content of total clay mineral is about 25%–30%, and the ions diffusion rate varies from 3 to 10 (uS/cm)/h0.5. Most of the clay minerals have a large expansion and deformation capacity after water absorption. The expansion force can instantaneously and significantly destroy the pore structure. Therefore, it plays a dominant role in the rapid disintegration stage. It should be noted that samples ZN1-1 and ZN1-2 have large ions diffusion rate despite of low clay minerals content. A great amount of salt minerals is observed in SEM pictures of sample ZN1-1 and ZN1-2. The salt minerals existence can enhance the ions diffusion rate.
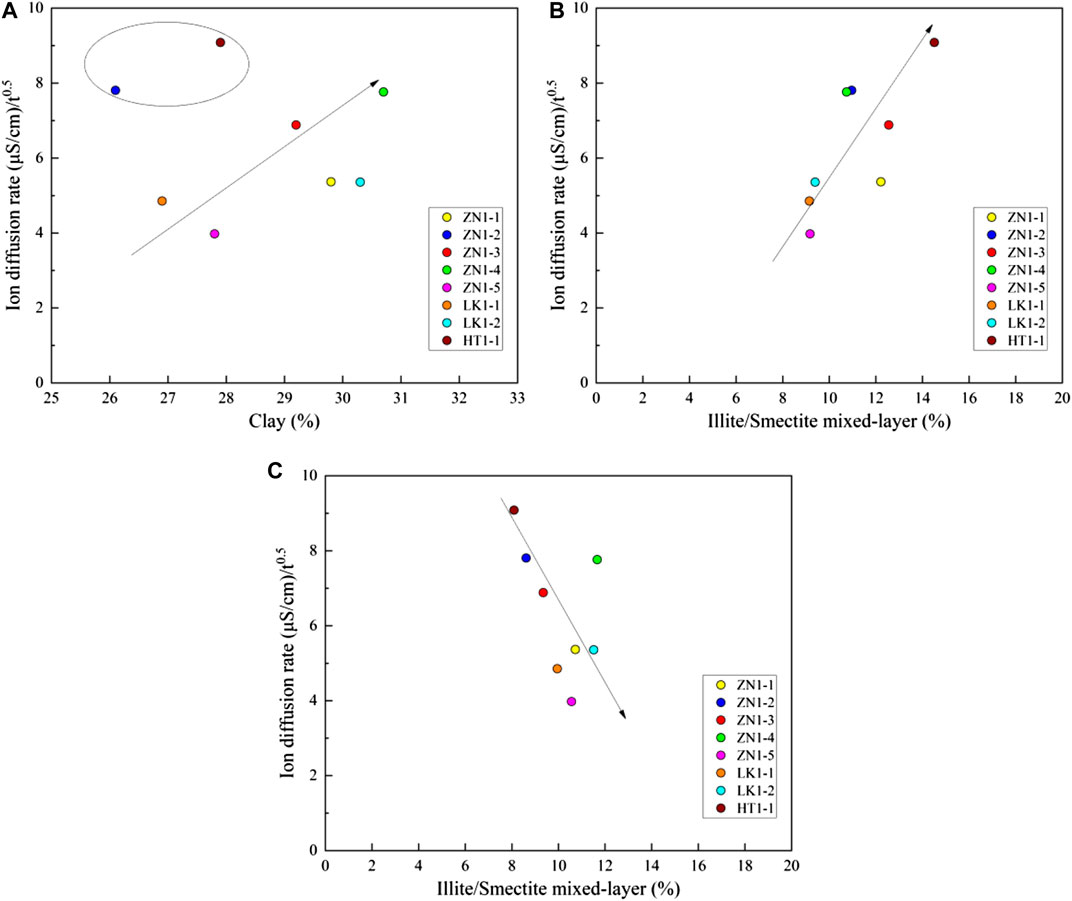
FIGURE 12. The effects of clay minerals on ions diffusion rate (A) the total clay minerals, (B) the I/S minerals and (C) the illite minerals.
The ions diffusion rate also depends on the clay minerals type. The I/S and illite minerals are important water-sensitive minerals, which should be paid more attention. The content of the I/S minerals is about 5%–15%. Figure 12B presents the ions diffusion rate increase with the I/S minerals content. The higher the content of I/S minerals, the faster the ions diffusion rate. In other words, more I/S minerals can result in pore structure expansion and destruction. Figure 12C shows the relationship between ions diffusion rate and illite minerals content. The illite content is about 5%–15%. The ions diffusion rate decreases with illite minerals content. The reason is that illite minerals are in the form of a film. The “films” are arranged around the inner pores and other mineral particles. They are arranged neatly, which makes the internal pore size smaller and hinders ions exchange.
3.3.4. Effects of Pore Structure
The specific surface area is an important parameter of pore structure, and reflects the pore size. The smaller the pore size, the larger the specific surface area. The specific surface area is obtained by a nitrogen adsorption test. Figure 13 shows the relationship between ions diffusion rate and specific surface area. The specific surface area of the sediments varies from 6.4512 to 13.84 m2/g, which is nearly equal to that of gas shale (Ripmeester et al., 2010). It can be assumed that the pores are at the micro-nano level, and the pressure force can reach 5.3–19 MPa (Jin et al., 2019; Mahabadi et al., 2019). In Figure 13, the specific surface area has a negative correlation with ions diffusion rate. In other words, the smaller the pore size, the smaller the ions diffusion rate. According to capillary force theory, the pore size is negatively related to capillary force (Lal, 1999). The dissociation water enters into the matrix pores, but part of the gas cannot be discharged completely. A great amount of gas is trapped in the matrix pores, increasing the pore pressure (Figure 14). The pore pressure is nearly equal to capillary pressure, which is about 5.3–19 MPa. The disintegration and fragmentation can be motivated when the high internal pore pressure gets higher than the tensile strength of the sediments. Under the effects of dissociation water retention, the pore structure corresponding to high specific surface area is very easy to destroy.
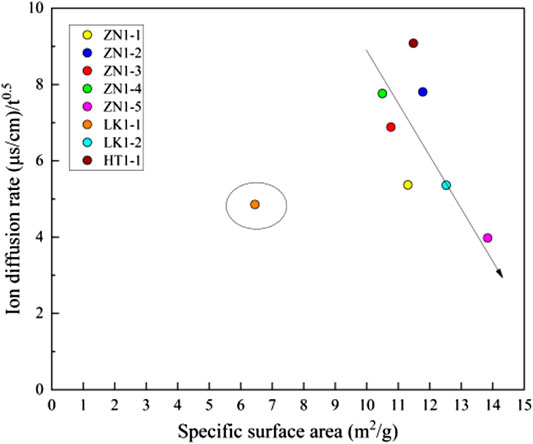
FIGURE 13. The relationship between ions diffusion rate and specific surface area.
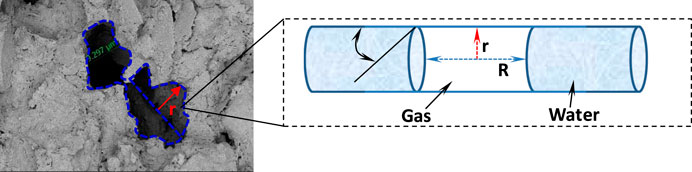
FIGURE 14. Schematic diagram of pore pressure due to capillary force.
3.3.5. Effects of Permeability and Porosity
Studying the relationship between permeability and porosity contributes to understanding the effects of permeability and porosity on ions diffusion. Figure 15 shows the relationship between porosity and permeability, and a positive correlation is observed. In terms of low permeability sediments (<4 mD), the porosity increases significantly with the rise in permeability. As for high permeability sediments (>4 mD), the porosity approximately keeps constant, and basically does not change with permeability rise.
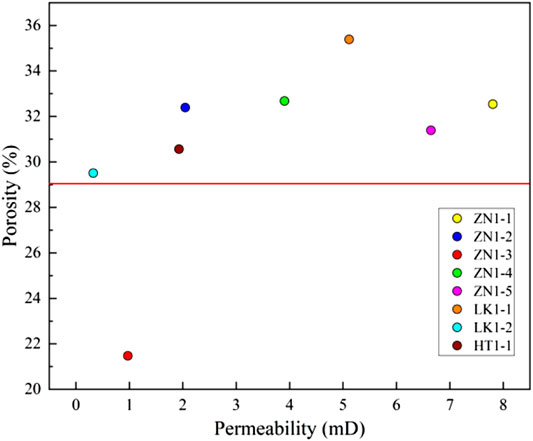
FIGURE 15. The relationship between porosity and permeability.
Considering the positive correlation between permeability and porosity, it is only necessary to study the effects of permeability. The disintegration is a rapid process, leading to the change of pore structure (Li and Hou, 2019). Therefore, the permeability effects mainly happen in the initial disintegration stage. In the late disintegration stage, the samples are dispersed into broken particles, and the permeability no longer affects sediment disintegration (Sun et al., 2018). Figure 16A presents the effects of permeability on ions diffusion rate. It can also be divided into two zones. At the low permeability zone (<4 mD), the ions diffusion rate increases significantly with permeability rise. The larger permeability contributes to the water flow, and enhances the interactions between dissociation water and pore skeleton. At the high permeability zone (>4 mD), There is no obvious correlation between permeability and ions diffusion rate. The samples ZN1-1, ZN1-5 and LK1-1 correspond to high permeability zone. Figure 16B presents shows the effects of permeability on conductivity change. According to the conductivity data before 20 min and after 70 min, the positive correlations between permeability and conductivity rise are observed. No obvious correlation between them is found in the curves from 20 to 70 min. In general, the permeability and porosity positively promote the disintegration of sediments.
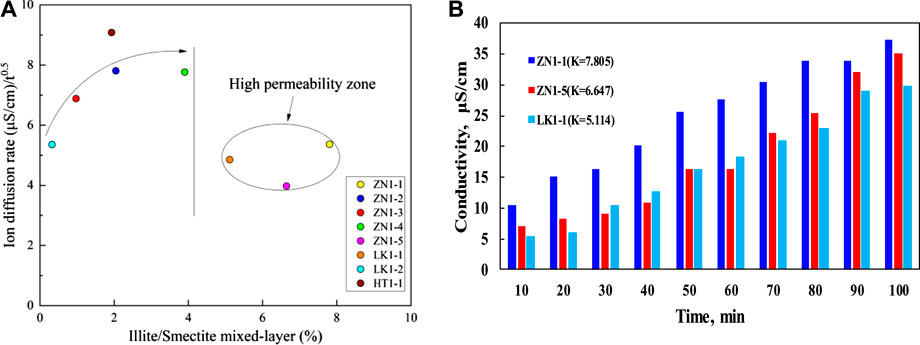
FIGURE 16. The effects of permeability on ions diffusion (A) curves of ions diffusion rate vs. permeability and (B) characteristics of high permeability zone.
4. Conclusions
In this paper, a series of characteristics are measured in sediments, such as porosity, permeability, pore structure and clay minerals content. The disintegration mechanism of sediments is evaluated by quantitative analysis of the conductivity experiment. Because the dissociation process of hydrate is very complicated, the current experiment has certain limitations. The conclusions are as follows.
(1) The dissociation water can lead to the disintegration of the pore structure of sediments. The ions concentration of dissociation water can act as an important parameter to evaluate the disintegration process.
(2) The sediment disintegration is divided into two stages: a rapid disintegration stage and a slow disintegration stage. The rapid disintegration stage is mainly related to clay minerals. The slow disintegration stage is mainly related to the dissolution of soluble salt minerals.
(3) The initial water content is the main factor affecting the disintegration of the sediment skeleton. Under the condition of low initial water content, the sediment skeleton disintegrates instantaneously in dissociation water. When the initial water content exceeds 30.6%–37.9%, the pore structure of sediments tends to be stable in dissociation water.
Data Availability Statement
The original contributions presented in the study are included in the article/supplementary material, further inquiries can be directed to the corresponding authors.
Author Contributions
The idea of the article comes from LY. The paper was written by SW. HL is responsible for reviewing the papers. LL and RS added to the article.
Funding
The research was funded by National Natural Science Foundation of China (No. 11702296), the China Geological Survey (No. DD20190232), by the Fundamental Research Funds for the Central Universities (No. 2462019YJRC011), and by Natural Science Foundation of China (41941018).
Conflict of Interest
The authors declare that the research was conducted in the absence of any commercial or financial relationships that could be construed as a potential conflict of interest.
References
Anderson, B. J., Kurihara, M., White, M. D., Moridis, G. J., Wilson, S. J., Pooladi-Darvish, M., et al. (2011). “Regional long-term production modeling from a single well test,” mount elbert gas hydrate stratigraphic test well, Alaska north slope. Mar. Petrol. Geol. 28 (2), 493–501. doi:10.1016/j.marpetgeo.2010.01.015
Cai, J., Xia, Y., Lu, C., Bian, H., and Zou, S. (2020a). Creeping microstructure and fractal permeability model of natural gas hydrate reservoir. Mar. Petrol. Geol. 115, 104282. doi:10.1016/j.marpetgeo.2020.104282
Cai, J., Xia, Y., Xu, S., and Tian, H. (2020b). Advances in multiphase seepage characteristics of natural gas hydrate sediments. Chin. J. Theor. Appl. Mech. 52, 208–223. doi:10.6052/0459-1879-19-362
Chen, J., Liu, J., Chen, G.-J., Sun, C.-Y., Jia, M.-L., Liu, B., et al. (2014). Insights into methane hydrate formation, agglomeration, and dissociation in water+diesel oil dispersed system. Energy Convers. Manag. 86, 886–891. doi:10.1016/j.enconman.2014.06.056
Cui, Y., Lu, C., Wu, M., Peng, Y., Yao, Y., and Luo, W. (2018). Review of exploration and production technology of natural gas hydrate. Adv. Geo-Energy Res. 2, 3–62. doi:10.26804/ager.2018.01.05
Gamwo, I. K.,, and Liu, Y. (2010). Mathematical modeling and numerical simulation of methane production in a hydrate reservoir. Ind. Eng. Chem. Res. 49, 5231–5245. doi:10.1021/ie901452v
Huang, M., Xu, C.-S., and Zhan, J. (2017). Assessments of the disintegrating behaviour of clay shale considering the effect of pH condition. Eur. J. Environ. Civil Eng. 24, 97–109. doi:10.1080/19648189.2017.1366952
Jin, Y. R., Yang, D. Y., Li, S. X., and Pang, W. X. (2019). Hydrate dissociation conditioned to depressurization below the quadruplepoint and salinity addition. Fuel 255, 1157–1158. doi:10.1016/j.fuel.2019.115758
Kang, D. H., Yun, T. S., and Kim, K. Y. (2016). Effect of hydrate nucleation mechanisms and capillarity on permeability reduction in granular media. Geophys. Res. Lett. 43, 9018–9025. doi:10.1002/2016gl070511
Lal, M. (1999). “Shale stability: drilling fluid interaction and shale strength,” in SPE Asia Pacific oil and gas conference and exhibition, Jakarta, Indonesia, April 20–22, 1999 (Dallas, TX: Society of Petroleum Engineers), 10.
Li, S.,, and Hou, S. (2019). A brief review of the correlation between electrical properties and wetting behaviour in porous media. Capillarity 2, 53–56. doi:10.26804/capi.2019.03.02
Linga, P.,, and Clarke, M. (2017). A review of reactor designs and materials employed for increasing the rate of gas hydrate formation. Energy Fuel. 31, 1–13. doi:10.1021/acs.energyfuels.6b02304
Luo, J., Wu, Y., Mi, D., Ye, Q., Huang, H., Chang, Z., et al. (2020). Analysis of the distribution and microscopic characteristics and disintegration characteristics of carbonaceous rocks: a case study of the middle devonian luofu formation in western guangxi of China. Adv. Civ. Eng. 2020, 1–15. doi:10.1155/2020/8810648
Mahabadi, N., Dai, S., Seol, Y., and Jang, J. (2019). Impact of hydrate saturation on water permeability in hydrate-bearing sediments. J. Petrol. Sci. Eng. 174, 696–703. doi:10.1016/j.petrol.2018.11.084
Mahabadi, N., Zheng, X. L., and Jang, J. (2016). The effect of hydrate saturation on water retention curves in hydrate‐bearing sediments. Geophys. Res. Lett. 43, 4279–4287. doi:10.1002/2016gl068656
Moridis, G. J.,, and Reagan, M. T. (2007). “Strategies for gas production from oceanic Class 3 hydrate accumulations,” in Offshore technology conference, Houston, TX, April 30–May 3, 2007 (Houston, TX: Offshore Technology Conference), 29.
Moridis, G. J.,, and Sloan, E. D. (2007). Gas production potential of disperse low-saturation hydrate accumulations in oceanic sediments. Energy Convers. Manag. 48 (6), 1834–1849. doi:10.1016/j.enconman.2007.01.023
Omelchenko, R. Y.,, and Makogon, Y. F. (2013). Commercial gas production from Messoyakha deposit in hydrate conditions. J. Nat. Gas Sci. Eng. 11, 1–6. doi:10.1016/j.jngse.2012.08.002
Pandey, J. S., Daas, Y. J., and Solms, N. V. (2019). Insights into kinetics of methane hydrate formation in the presence of surfactants. Processes 7, 598. doi:10.3390/pr7090598
Radich, J., Rogers, R. E., French, W. T., and Zhang, G. (2009). Biochemical reaction and diffusion in seafloor gas hydrate capillaries: implications for gas hydrate stability. Chem. Eng. Sci. 64, 4278–4285. doi:10.1016/j.ces.2009.06.073
Ripmeester, J. A., Alireza, S., Hosseini, B., Englezos, P., and Alavi, S. (2010). “Fundamentals of methane hydrate decomposition,” in Canadian unconventional resources and international petroleum conference, Calgary, Alberta, Canada, October 19–21, 2010 (Dallas, TX: Society of Petroleum Engineers), 7.
Shagapov, V.,, and Tazetdinov, B. I. (2014). Formation and dissociation of gas hydrate inclusions during migration in water. Thermophys. Aeromechanics 21, 337–345. doi:10.1134/s086986431403007x
Shen, W. J., Song, F. Q., Hu, X., Zhu, G. M., and Zhu, W. Y. (2019). Experimental study on flow characteristics of gas transport in micro- and nanoscale pores. Sci. Rep. 9, 10196. doi:10.1038/s41598-019-46430-2
Sun, Y., Lu, H., Lu, C., Li, S., and Lv, X. (2018). Hydrate dissociation induced by gas diffusion from pore water to drilling fluid in a cold wellbore. Adv. Geo-Energy Res. 2, 410–417. doi:10.26804/ager.2018.04.06
Van Genuchten, M. T. (1980). A closed-form equation for predicting the hydraulic conductivity of unsaturated soils. Soil Sci. Soc. Am. J. 44, 892–898. doi:10.2136/sssaj1980.03615995004400050002x
Yan, L., Liu, P., Peng, H., Kašanin-Grubin, M., and Lin, K. (2018). Laboratory study of the effect of temperature difference on the disintegration of redbed softrock. Phys. Geogr. 40, 149–163. doi:10.1080/02723646.2018.1559418
Yang, L., Zhang, C., Cai, J., and Lu, H. (2020). Experimental investigation of spontaneous imbibition of water into hydrate sediments using nuclear magnetic resonance method. Energies 13. doi:10.3390/en13020445
Yang, L., Zhang, C., Lu, H., Zheng, Y., and Liu, Y. (2020). Experimental Investigation on the Imbibition Capacity and Its Influencing Factors in Hydrate Sediments. ACS OMEGA 5. doi:10.1021/acsomega.0c01269
Zhang, Z., Liu, W., Cui, Q., Han, L., and Yao, H. (2018). Disintegration characteristics of moderately weathered mudstone in drawdown area of Three Gorges Reservoir, China. Arab. J. Geosci. 11, 405. doi:10.1007/s12517-018-3751-8
Zhao, J. F., Zhu, Z. H., Song, Y. C., Liu, W. G., Zhang, Y., and Wang, D. Y. (2015). Analyzing the process ofgas production for natural gas hydrate using depressurization. Appl. Energy 142, 125–134. doi:10.1016/j.apenergy.2014.12.071
Keywords: gas hydrate, pore structure, disintegration, ions diffusion, dissociation water
Citation: Yang L, Wang S, Lu H, Liu L and Sa R (2020) Effects of Dissociation Water Retention on Pore Structure Disintegration in Hydrate Sediments. Front. Energy Res. 8:599542. doi: 10.3389/fenrg.2020.599542
Received: 27 August 2020; Accepted: 06 November 2020;
Published: 01 December 2020.
Edited by:
Songyan Li, China University of Petroleum (Huadong), ChinaReviewed by:
Yongge Liu, China University of Petroleum (Huadong), ChinaBo Jiang, Nanjing University of Science and Technology, China
Copyright © 2020 Yang, Wang, Lu, Liu and Sa. This is an open-access article distributed under the terms of the Creative Commons Attribution License (CC BY). The use, distribution or reproduction in other forums is permitted, provided the original author(s) and the copyright owner(s) are credited and that the original publication in this journal is cited, in accordance with accepted academic practice. No use, distribution or reproduction is permitted which does not comply with these terms.
*Correspondence: Liu Yang, shidayangliu@126.com; Hongfeng Lu, gmgslhf@126.com