Assessing the Economic Risk of Building Damage due to the Tunneling-Induced Settlement Using Monte Carlo Simulations and BIM

Department of Civil Engineering, University of Birmingham, Birmingham B15 2TT, UK
*
Author to whom correspondence should be addressed.
Sustainability 2020, 12(23), 10034; https://doi.org/10.3390/su122310034
Submission received: 30 October 2020
/
Revised: 20 November 2020
/
Accepted: 25 November 2020
/
Published: 1 December 2020
(This article belongs to the Special Issue Geo-Hazards and Risk Reduction Approaches)
Abstract
:Due to the increasing use of underground space to align with sustainability needs, geohazard risk assessments have become a valuable tool for decision-making. One common issue in relation to urban geohazard assessments relates to ground movements due to tunneling affecting adjacent buildings. A framework for assessing costs related to subsequent building damage, using integrated data, statistics and considering the uncertainties involved, is presented in this paper. The proposed methodology provides an integration of Monte Carlo simulations to support uncertainty estimations with an analysis for building-damage cost risk due to tunneling-induced settlements. The analysis involves analytical models using green-field conditions and a typically used building damage assessment method. BIM is capable of collating, combining and visualizing information with advanced analysis techniques into a risk-based tool. The resulting tool provides a clear way of assessing building-damage costs risk due to tunneling-induced settlements. This uses a BIM-based environment and incorporates 3D visualizations and an integrated analysis via MATLAB to reveal and highlight hazardous areas and the severity of economic risk along the tunneling route. This informs the need for additional ground investigations or secondary analyses to ensure engineering processes reduce or remove the risk of economic damage and advance sustainable decision-making.
1. Introduction
The use of underground space in an urban area has become an essential feature of the sustainable urban expansion of a modern city [1,2]. This demands an understanding of all the related geohazard and geotechnical aspects that should be considered prior to tunneling and/or other underground construction processes. Hence, a geohazard risk assessment in relation to these construction operations should take place to support decision-making and align with the need for safe designs regarding the ground conditions [3]. One particular geotechnical issue that is important as part of the planning process is the ground settlement due to tunnel or underground construction in “soft ground”, defined herein as soils or soft rocks as opposed to hard rock tunneling. This paper presents a methodology for determining the economic risk arising from tunnel construction in soft ground as part of an overarching framework for addressing the problems associated with urban underground construction.
Tunneling-induced ground movements are a complex geotechnical issue, particularly nowadays with an ever-increasing density of the urban built environment. These ground movements are associated with numerous considerations of safety and sustainability within urban settings [4,5,6]. Peck [7] presented the idea of representing the settlement trough under green-field conditions by an inverted normal distribution curve. This was further developed into practical empirical and analytical solutions [8,9]. The criteria for combining the green-field settlement trough with potential building damage assessments were proposed by Burland and Wroth [10], Rankin [11] and Mair et al. [12]. These can be used in combination with building-damage costs to assess the settlement-induced risk for this damage. It is important for engineers to develop a risk-based assessment method in relation to underground construction developments for planning and insurance purposes [13].
There is a growing body of literature concerning building costs [14]. It would be useful if this was combined with the resulting repair/maintenance costs assessed via a risk assessment. The present study has used the example of the risk of building-damage costs associated with tunneling-induced settlements for residential buildings in the UK. These costs were derived using available data for building costs/prices from the Office of National Statistics [15] in combination with the research of Blong [16] and Sundell et al. [14]. Thus, it is possible to introduce a relative cost analysis to a risk assessment analysis of building damage. In this paper, to demonstrate this risk as clearly as possible and provide a more thorough analysis, this is integrated with an uncertainty analysis, which is important to be considered in detail in decision-making [17].
Considering the uncertainty in geological and geotechnical engineering analyses is important for successful ground-related outcomes [18,19]. This has been shown to be the case for a number of geotechnical applications [19,20,21]. The criteria or factors to be included and the number of simulations required are closely linked with the variability of the ground as well as modeling limitations [19,22,23]. Previous research has accounted for the effective input of these factors to model uncertainties, using both geotechnical expertise and measurements [21,22]. This has revealed the need to undertake an uncertainty analysis in relation to a geotechnical risk in an urban area due to the effects of physical intervention, such as tunnel–induced ground movements.
To estimate the uncertainties, probability functions were adopted. The resulting indicators using such statistical techniques are able to describe geotechnical processes [24,25], Mashhadian et al. [20] and Cao et al. [26]. Probabilistic modeling approaches have been employed to estimate uncertainty [20,27,28]. These estimations used common statistical methods, such as the sample mean, standard deviation and correlation coefficient to provide the probability distributions, and the Bayesian approach [28,29]. This was applied in the assessment used in this paper, using probability density functions (PDFs). These are useful tools for this type of analysis, as shown by Pan and Dias [27] and Zhang et al. [28]. Particularly, log-normal PDFs were used that could indicate successful resultants, as shown by Sundell et al. [14]. An indication of the related uncertainty utilizing the mean and standard deviation values of geotechnical factors could be obtained using the Monte Carlo method and these PDFs. Available methods for probability simulation based on the Monte Carlo method could be categorized as directional sampling, Importance sampling, Subset simulation and Line sampling/stepwise simulation [30,31,32,33]. Monte Carlo simulations have been widely used to manage or estimate uncertainties, and there is a large body of literature using it in the geotechnical field providing risk assessments, e.g., Peng et al. [34], Cao et al. [35], Jin et al. [36] and Cao et al. [26]. A successful example of its use in relation to tunneling involved investigation of the potential hazards induced by TBM excavations [37]. This statistical technique could produce even more useful findings if combined with a framework incorporating an advanced database and visualizations so as to help overcome some of the limitations associated with ground/geological data.
Building information modeling (BIM) has become a widely utilized platform for assigning, managing, storing and demonstrating building construction data [38]. This is not limited to structural applications but can also be applied to geotechnical aspects [39]. Therefore, BIM could be used to provide advanced data and visualization aspects to produce integrated computer-aided geotechnical applications. An enhanced framework combining probabilistic and analytical approaches that takes advantage of BIM features, while applied in the context of geotechnics to provide an advanced risk assessment, could provide such a useful computer application for engineers and researchers.
In this paper, the costs associated with the damage caused by settlements due to tunneling in an urban area are assessed using a modeling tool that integrates BIM data with advanced analyses. This integrated tool uses the framework to provide the digital integration presented by Providakis et al. [3] and reports on the subsequent research to extend the assessment to include uncertainty and cost analysis of the specific urban geohazard. The uncertainty and cost analyses indicate the risk of building damage costs due to these settlements. This is achieved by presenting areas of economic risk in three-dimensions using BIM and aligning them with a probabilistic analysis. An assessment tool is presented that could provide a “real-life” computer application in geotechnics, i.e., settlement-induced costs. The proposed approach demonstrates a framework for an integrated digital tool, which could be applied to different types of urban geohazards. This tool could improve the knowledge and understanding of ground-building interaction problems. It is important to note that this is used to demonstrate the principles of the method and does not focus on detailed soil–structure interactions within the foundations or on an attempt to assess all the parameters involved. The method could equally be applied to allied geotechnical hazard analysis, such as seismic risk analysis, and the analysis reported herein could be extended in its sophistication as required for any specific contextual need.
This paper first describes the methodology used for the integration of the core elements within the modeling analysis. Details of the uncertainty evaluations using the Monte Carlo method are then described, together with its application to this case. The analytical methods to provide the resulting cost functions are then presented, along with the resulting 3D visualizations using BIM, which provide an integrated view of the (tunneling-induced) settlement economic cost risk, and hence a potential assessment tool. Finally, these demonstrators and their relative advantages using this integrated computer-aided tool are discussed.
2. Materials and Methods: Building-Damage Cost Analysis due to Tunneling-Induced Settlement
In the proposed methodology, a framework to assess the tunneling-induced settlement costs from adjacent building damages was developed. This framework extends the work presented by Providakis et al. [3] into an economic analysis to provide a sustainable city decision-making analysis. The concept is to provide an information “layer” showing these costs from a “settlement economic risk” assessment, integrated with the georeferenced 3D geological-tunnel-building model.
Uncertainty is important for geohazard prediction and assessment and the consequences (such as rehabilitation costs) and how to limit them. The study aimed to provide an integrated computer-based approach for estimating and visualizing the economic risk (costs) in relation to building damage caused by tunnel-induced settlements using building information modeling (BIM). The risk is adjusted according to the probability, extent and severity of the hazard [40]. The present methodology uses Monte Carlo simulations to provide a probabilistic approach. In addition, analytical models are used to estimate the surface settlement caused by tunneling [9] in combination with building damage assessment methods [12,41].
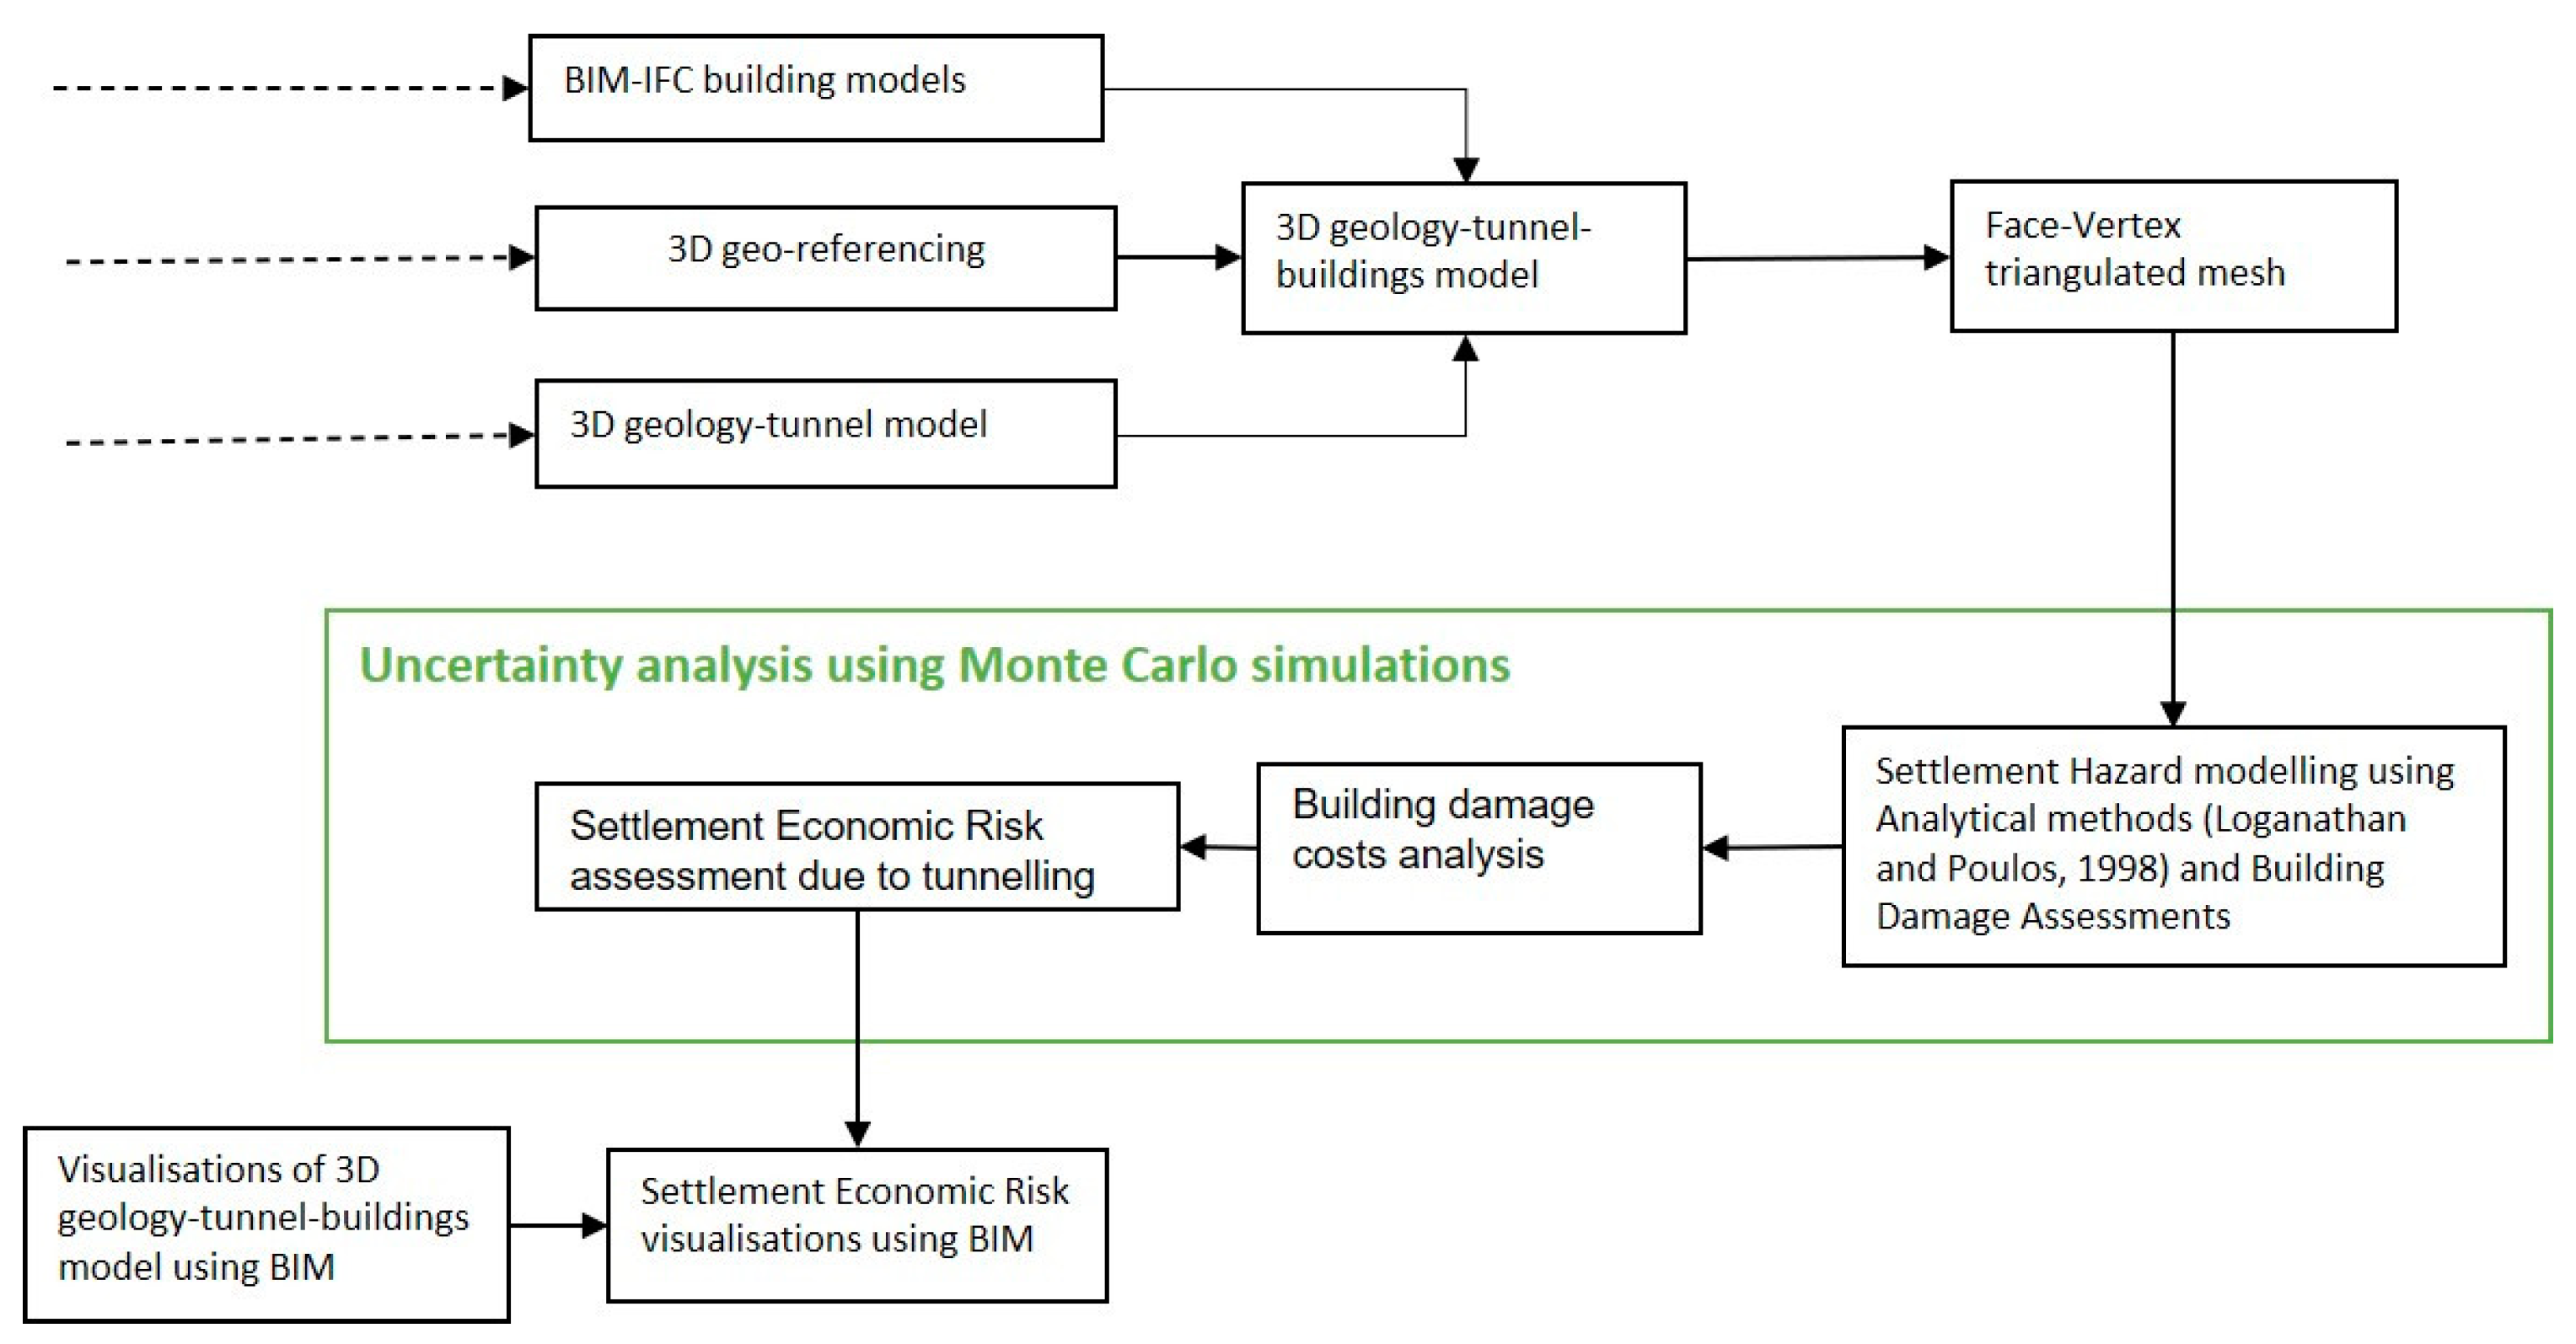
A flow chart showing the approach adopted is presented in Figure 1. Initially, the data integration process uses the method adopted by Providakis et al. [3] where BIM-building models [42] in IFC format [43] are imported into SketchUp [44], which is used for the BIM visualizations. The data for the whole georeferenced 3D geology-tunnel-building model was then exported into MATLAB [45] using the STL format [46], as shown in Providakis et al. [3]. It is important to note that all the information for the proposed analysis is provided using this mesh, which could then be used/integrated with other frameworks (software) for further analysis/investigation [3,47].
2.1. Set up of Simulated Urban Area
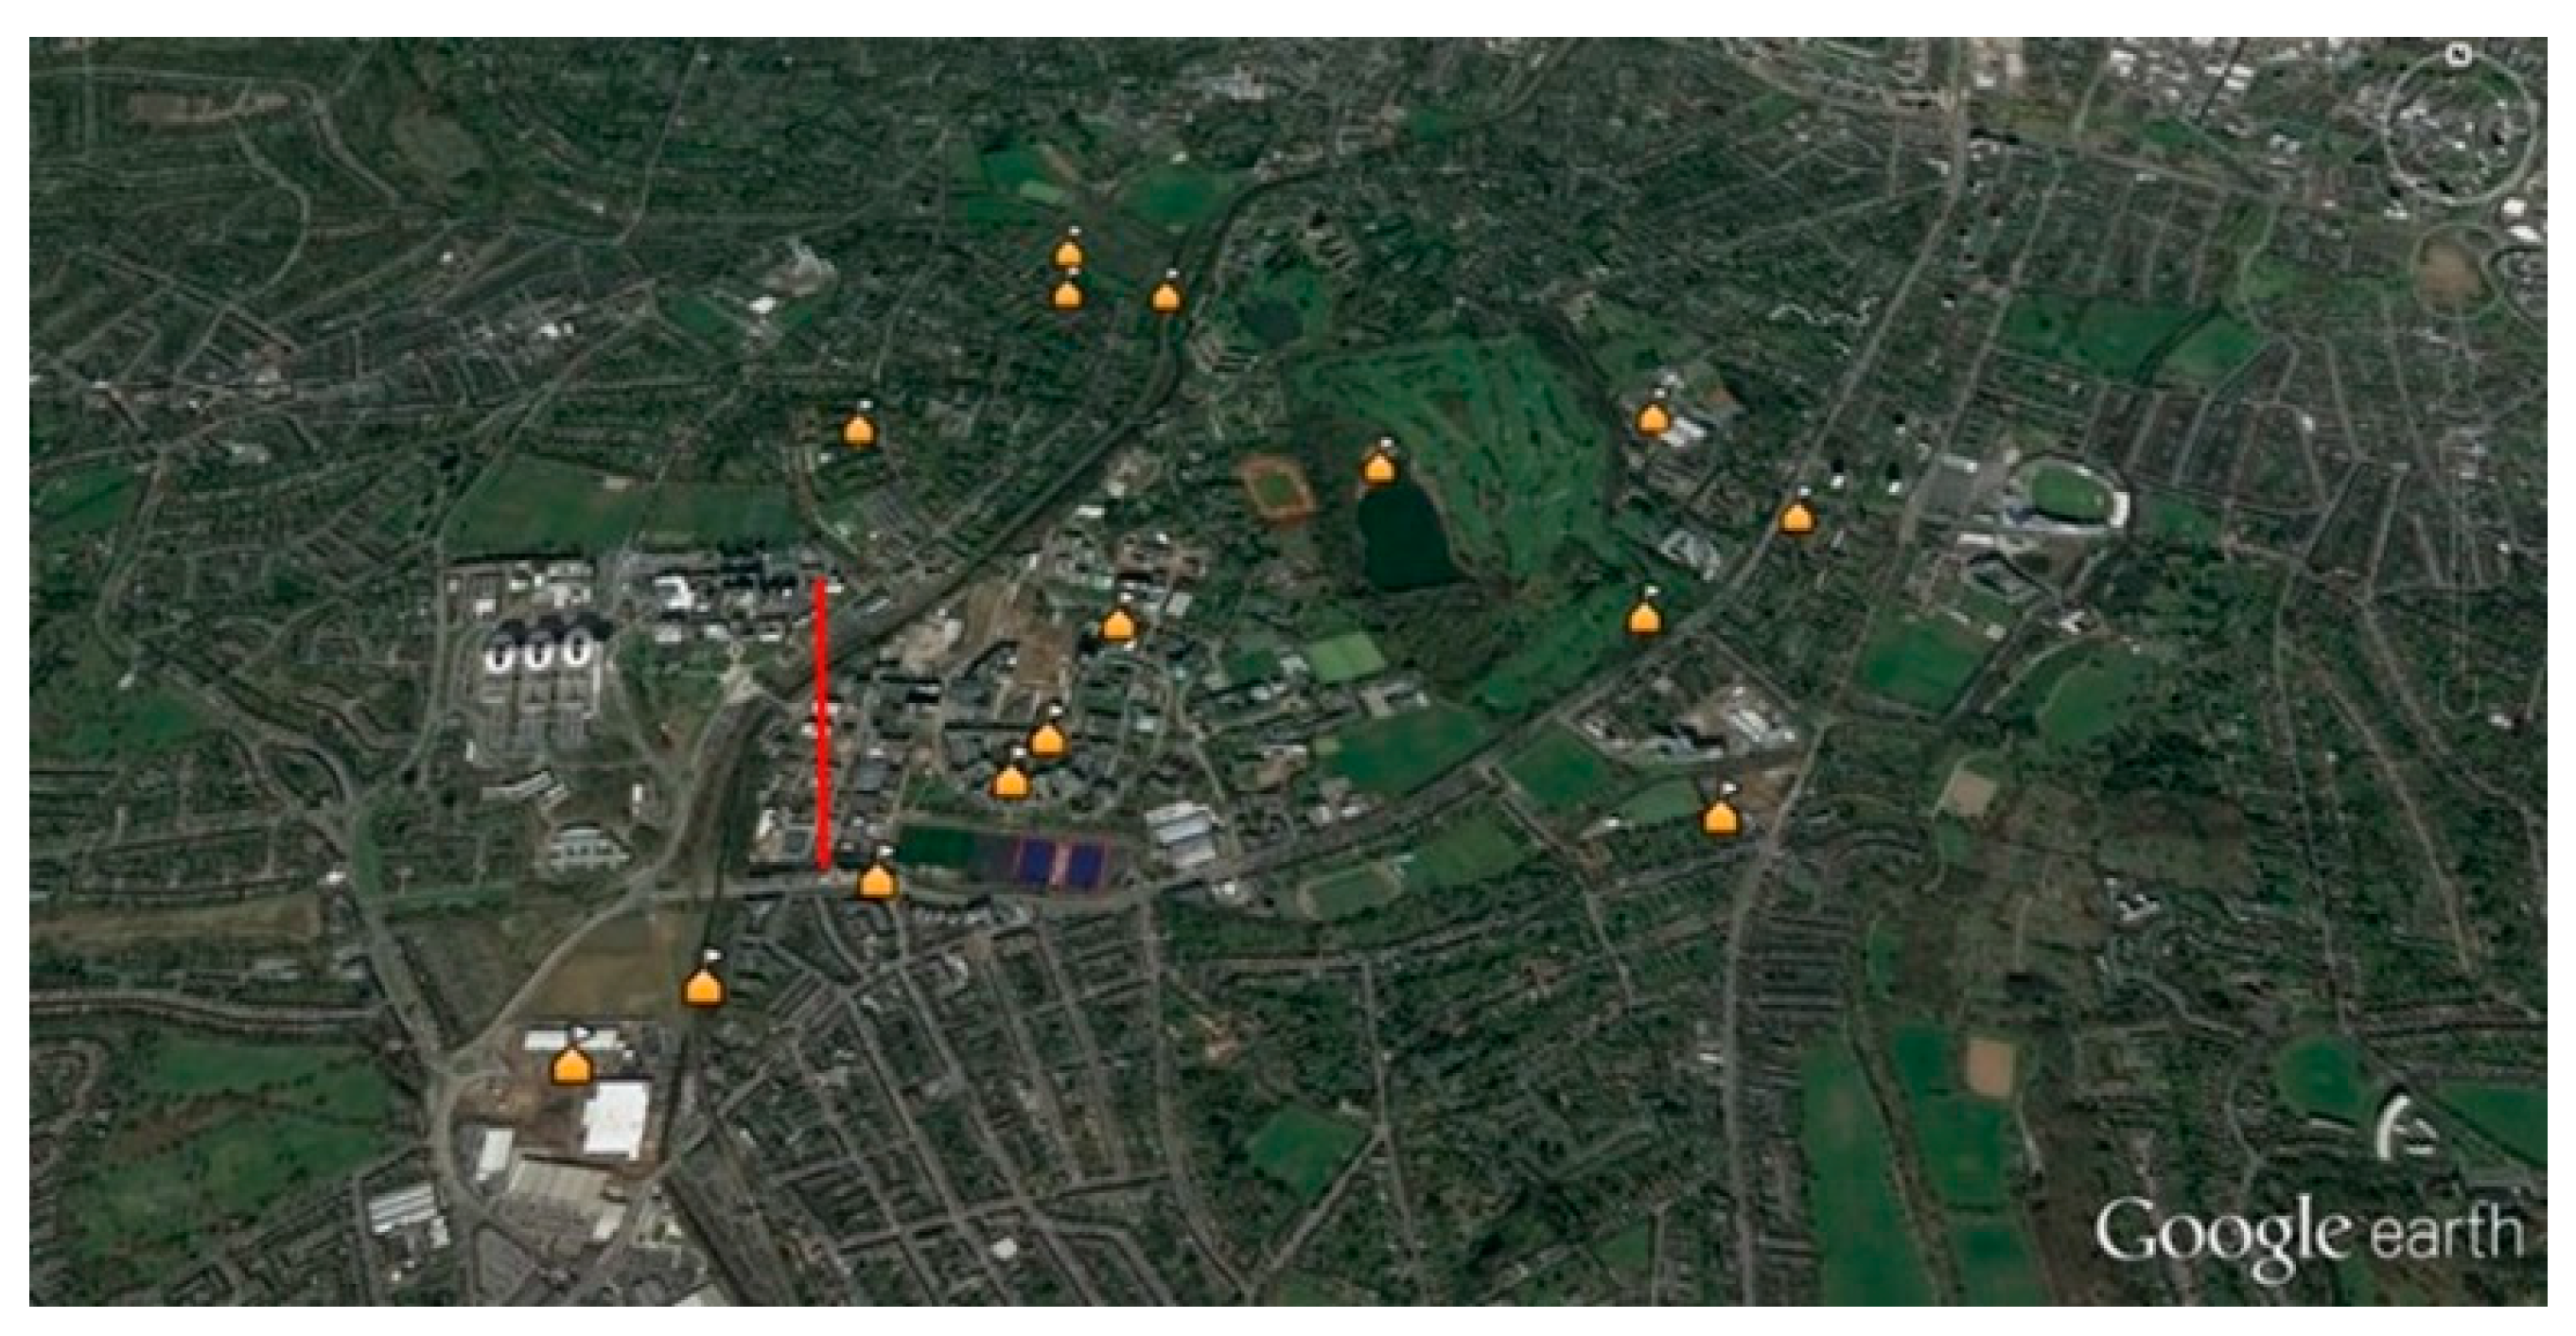
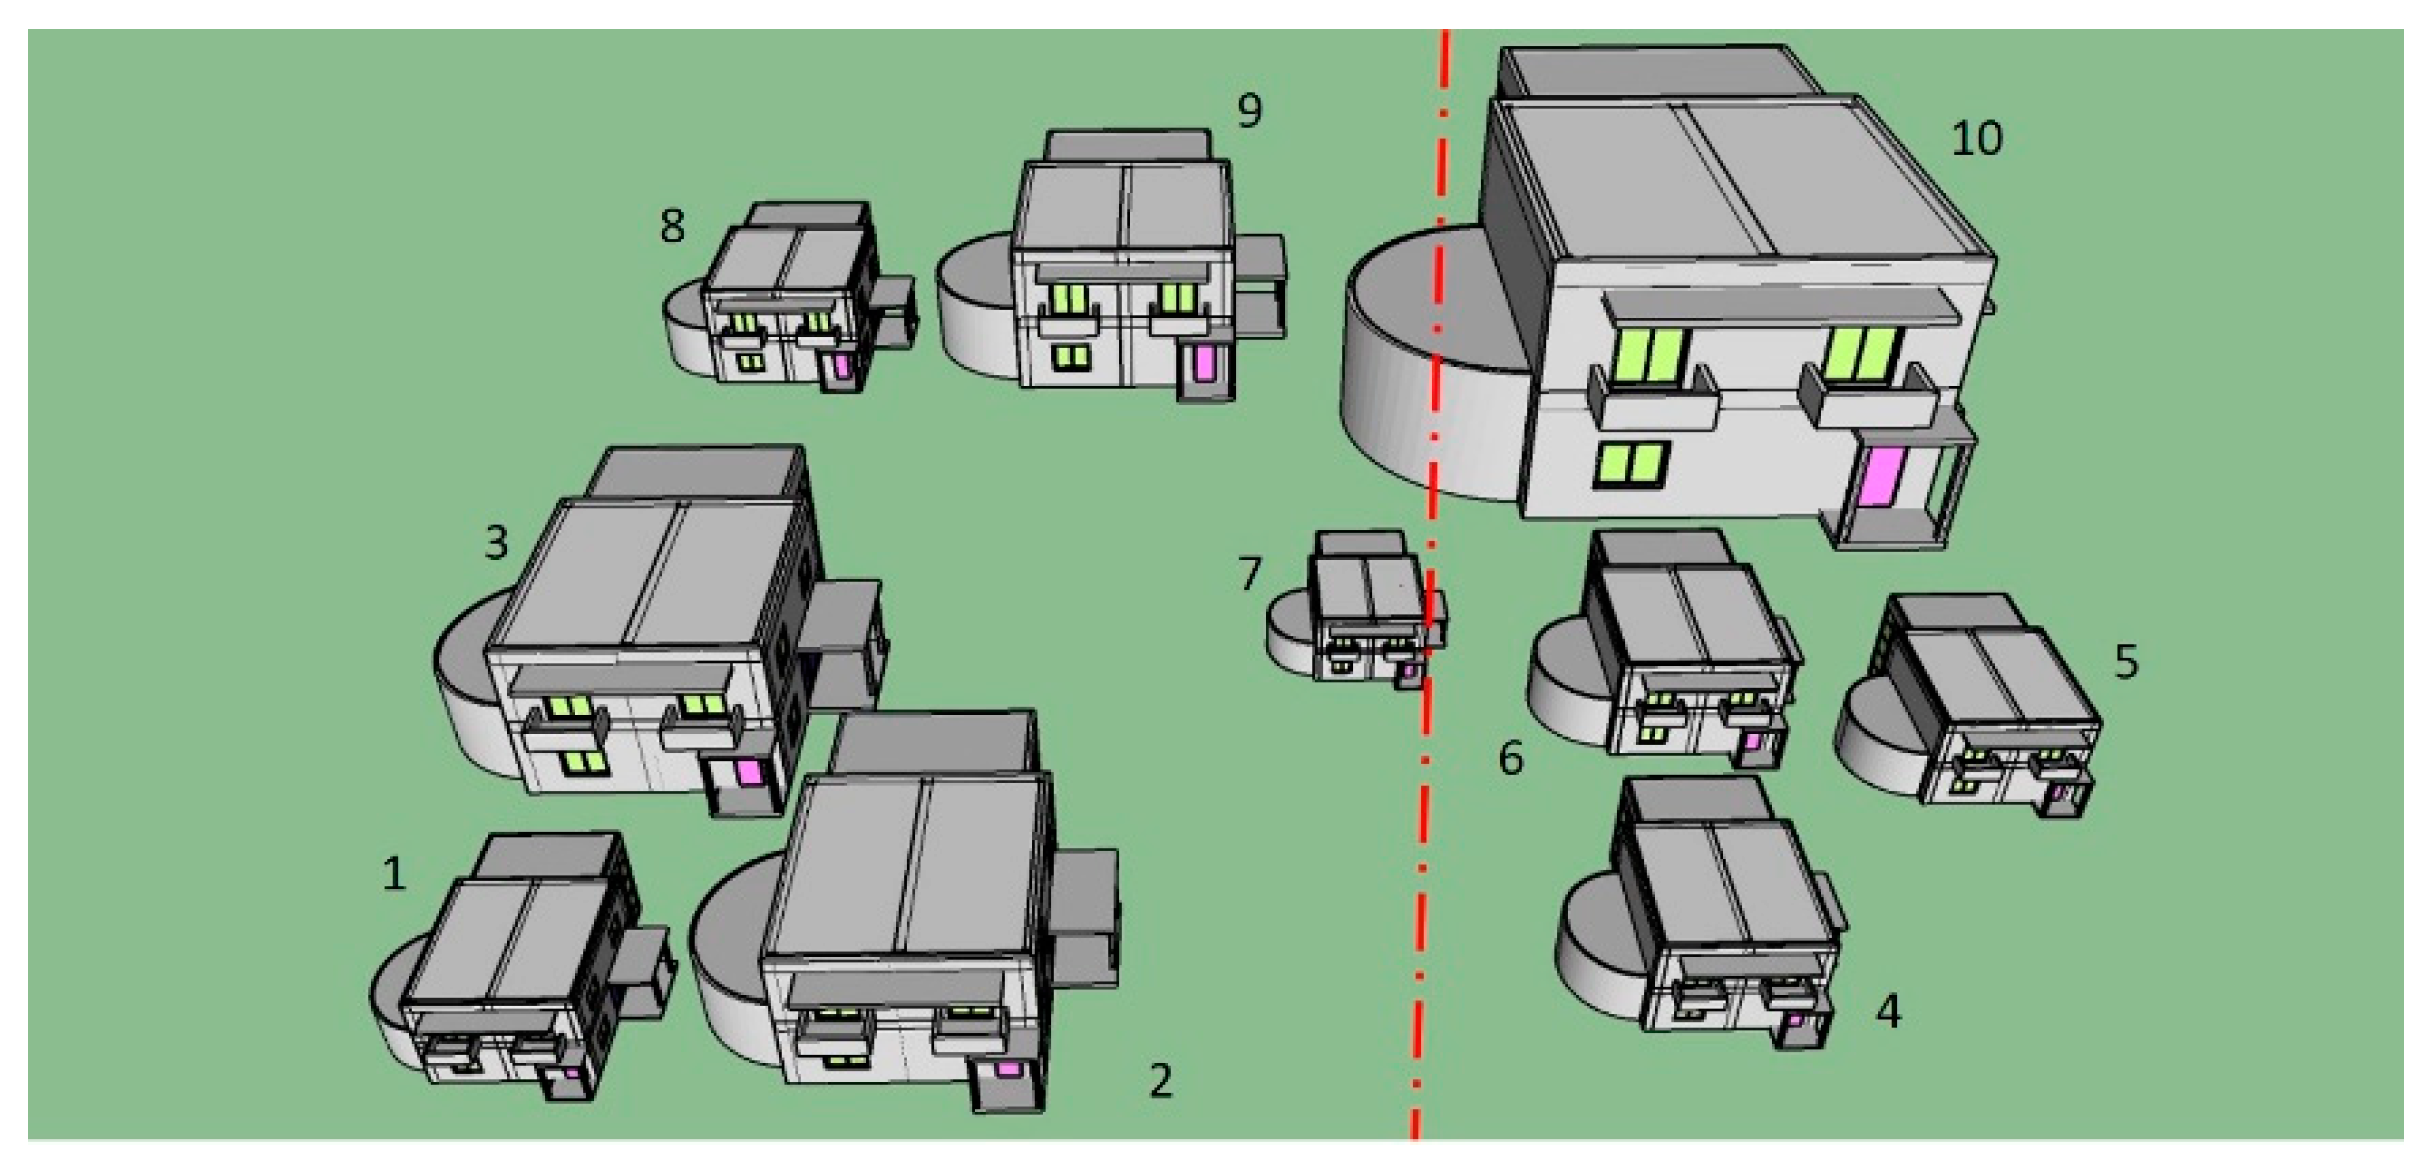
In this paper, the wider urban area around the campus of the University of Birmingham, UK, is used as an example. The geological strata of the area consist of soft ground with made ground overlying the alluvial deposits, which is underlain by the (Wilmslow) sandstone consisting of a weathered to clay top and mudstone bands below. This geology is presented in fifteen boreholes, their locations across the area being shown in Figure 2. These boreholes provided the data for the interpolation conducted in MATLAB [45] to create the 3D geological model in Figure 3, using the method introduced by Providakis et al. [3]. A 3D 10 m-diameter tunnel model was placed within the geological model at approximately 20 m-depth. Ten low-rise building BIM-files taken from SUPodium [42] and developed using Archicad [48] were imported in IFC in SketchUp. These were used to provide a representative sample to test the methodology. These buildings are typical masonry structures and were superimposed on the 3D geology-tunnel model, as shown in Figure 4.
2.2. Settlement Hazard Using Analytical Methods
To provide a tunnel-induced settlement analysis, empirical/analytical models based on the resulting settlement trough have been adopted [7,8]. This assumes that a settlement curve or trough is formed below the ground surface and, in this case, in the ground among buildings. There are a number of methods that can be used to estimate the settlements caused by tunnel construction in soft ground, and any can be used in the proposed methodology, but the method used here to exemplify the process is the analytical model adapted from Loganathan and Poulos [9] and Loganathan [50], as shown in Equation (1)
where R is the tunnel radius, z is the overburden, H is the depth to the tunnel axis level, ν is the Poisson’s ratio of the soil, ε0 is the ground loss, x is the lateral distance from tunnel centerline, and and is the friction angle of the ground.
To evaluate the spatial distribution of Uz=0, input information of the ground (volume) loss, Poisson’s ratio of the soil and the soil friction angle are required, as shown in Table 1. Since they are geotechnical factors characterized by uncertainties, representative estimations throughout the whole construction are needed. Such estimations are based on a combination of knowledge and understanding of local geological conditions, previous experience and statistics. In the proposed approach, the problem conceptually changes from geomechanical by correlating deterministic information based on specific values of the ground (volume) loss, Poisson’s ratio and friction angle, to multidisciplinary, by including (randomly) distributed uncertainty estimations within predefined ranges of values. Hence, each uncertain geotechnical factor X, i.e., ground loss, Poisson ’s ratio and friction angle, could be estimated using Equation (2).
where μ is the mean and σ the standard deviation (square root of variance) of factor X, and Y is a standardized random variate, which in the present approach is assumed to be normally distributed within the range of [−3, +3].
X = μ ± σY
Damage Extent and Severity of the Settlement Hazard
Although there are a number of approaches to assess building damage due to tunnel-induced settlements, by way of example, the proposed methodology adopted in this paper used the Building damage Assessment from the risk categories in Table 2 [11,55] through Equation (1). These were used to estimate the damage extent due to the settlement hazard. This analysis is carried out in MATLAB. BIM is used to collect the information on the maximum settlement and ground slope from building-footprint locations using BIM.
To provide the building damage severity due to the settlement hazard, the building damage assessment criteria adapted from Burland [41] and Mair et al. [12] are also employed, as shown in Table 3. The limiting tensile strain method (LTSM) is used to assign the resulting settlement-induced building damage using the critical tensile strains [10,56]. The LTSM does not focus on detailed interactions in relation to the foundations. The total bending strain (), diagonal strain () and horizontal strain () were used in estimating the critical strain (εcrit) from Equations (3)–(5) [10,56]:
To evaluate the critical strain, εcrit, for each of the buildings within the study zone, their detailed material and geometrical information (e.g., building length, width and height, sagging/hogging areas and the construction material), was collected using BIM from the IFC buildings datasets [42,48] and using the integrated approach in MATLAB proposed by Providakis et al. [3]. The building damage for each building is then obtained using Equation (5) and is classified according to the damage categories from Table 3 [12,41]. Maximum difference normalization is employed in the present methodology to correlate factors and values that initially have completely different ranges, with factors estimated to have a (0, 1) frame [24].
The ratio of Young’s modulus and shear modulus, E/G, of the buildings is challenging. This is often heterogeneous due to variation in building materials used in the construction. It varies from E/G = 2.6 in the case of masonry structures to E/G = 12.5 for concrete structures. The severity of the settlement damage not only depends on the settlement magnitude and extent but also on the material sensitivity within the construction. For instance, buildings built mainly from masonry bricks are more susceptible to damage compared to reinforced concrete, and hence as an example, masonry buildings were selected in the present study. The mean and standard deviation values used (E/G range within 2.6 and 2.8) are shown in Table 4. Thus, the present approach considers the uncertainty estimation of E/G in addition to the geotechnical factors. In this case, this estimation is described in Equation (6):
where the uncertainty factor, , can be estimated here using the mean value, and the standard deviation, ; the random variate (standardized) is , which is assumed to be normally distributed in the range of [−3, +3].
2.3. Uncertainty Analysis for Estimating the Settlement Economic Risk
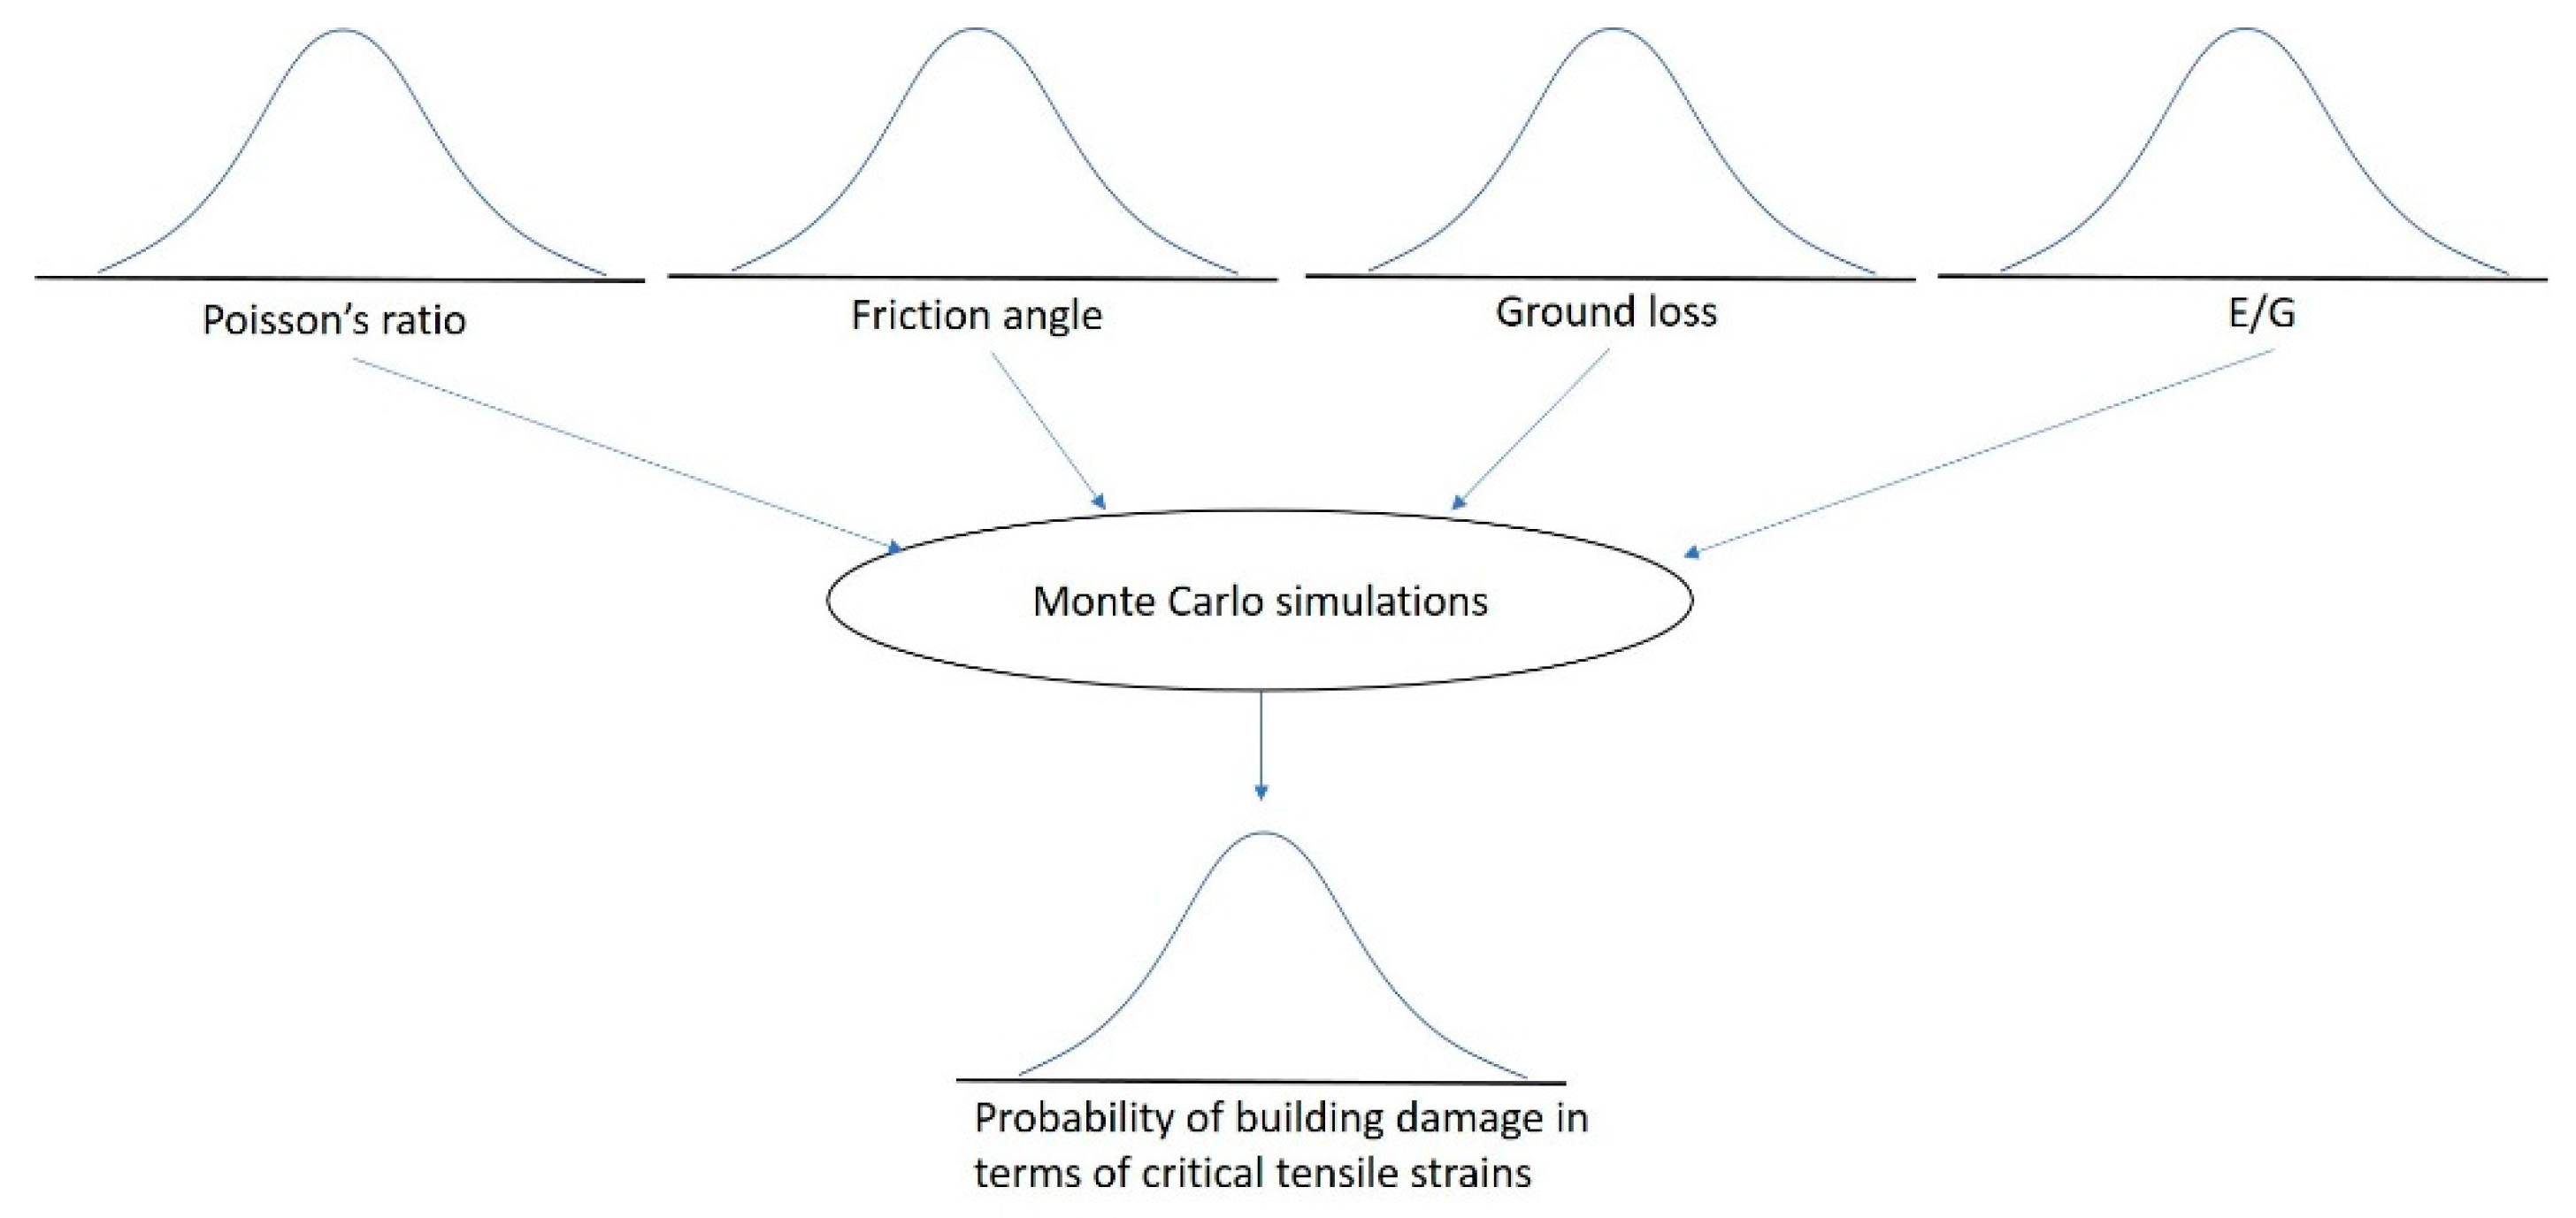
In the case of a model including several inputs with uncertainties, a stochastic analysis could be used to provide subsequent uncertainty evaluations, i.e., how the input uncertainty has an impact on the characteristics of the model [26]. Monte Carlo simulation is a type of stochastic modeling where the output probability distribution is derived from a repeat of random-sampling tests of inputs [23]. A large number of simulations ensures that a random variation of the inputs is reflected [57]. In the present analysis, using the Monte Carlo simulations, uncertainties of the geotechnical factors used in Equation (2) or of the E/G factor in Equation (6) have an impact on each other. The concept of the Monte Carlo analysis used is presented in Figure 5. The damage of the buildings in the proposed analysis is a function of the critical tensile strain εcrit using Table 3. The key points of the Monte Carlo simulations used in the proposed methodology are:
- Define the probability distributions of possible inputs (factors): ground (volume) loss, Poisson’s ratio, friction angle and E/G ratio. In this case, it is assumed these factors vary according to a normal probability distribution;
- Generate the random (representative) inputs from the probability distribution over the domain, using Equations (2) and (6);
- Calculate the resultants of building damage categories (outputs) according to Table 3 using Equations (1) and (5) and the randomly generated inputs;
- Repeat steps 1–3, using 1000 simulations;
- Aggregate the results.
2.3.1. Probability Distribution of Building Damage
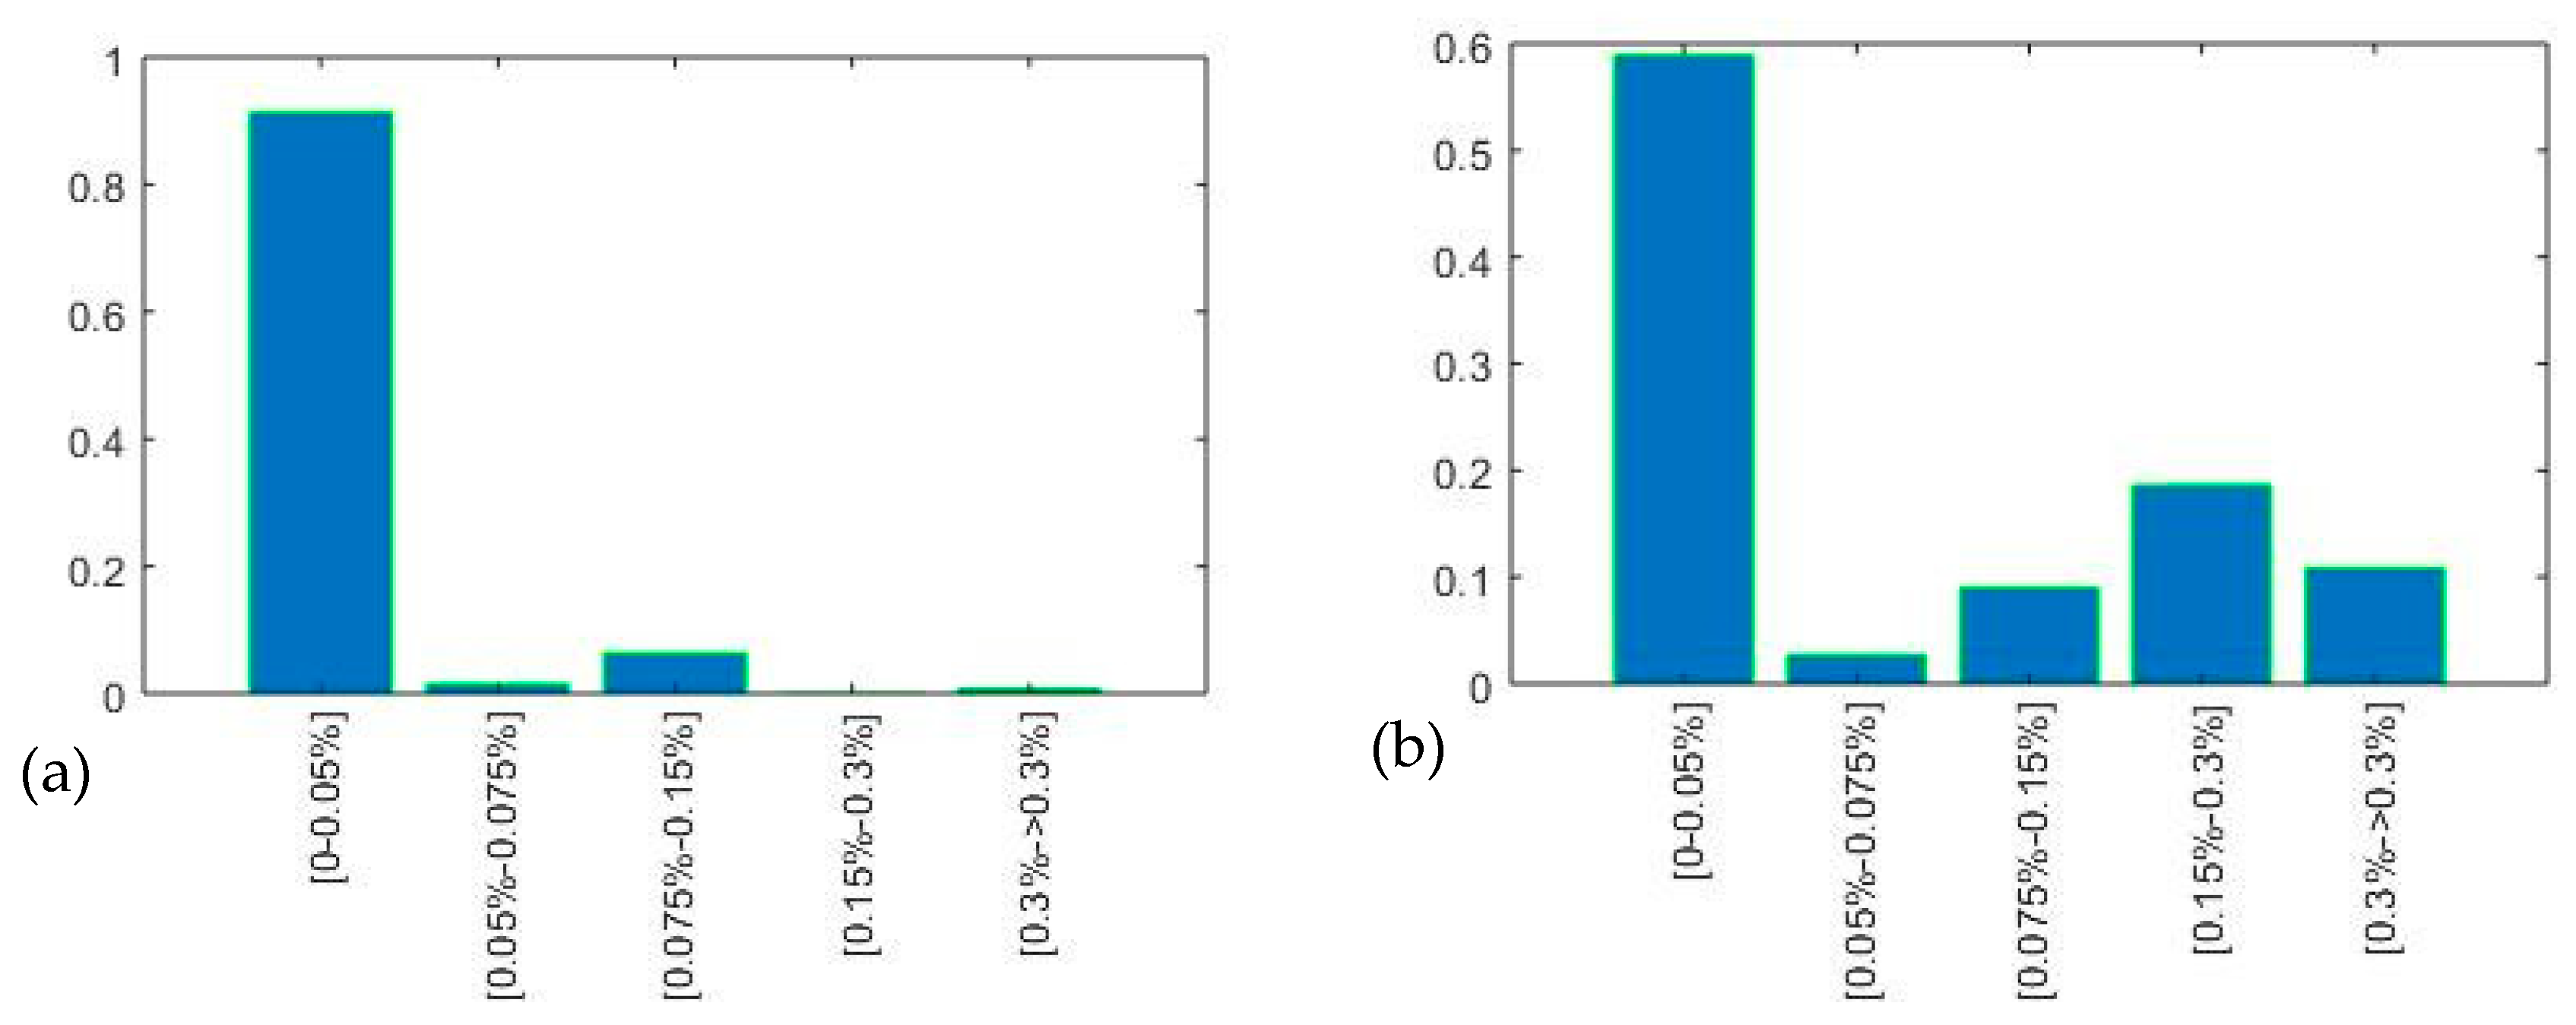
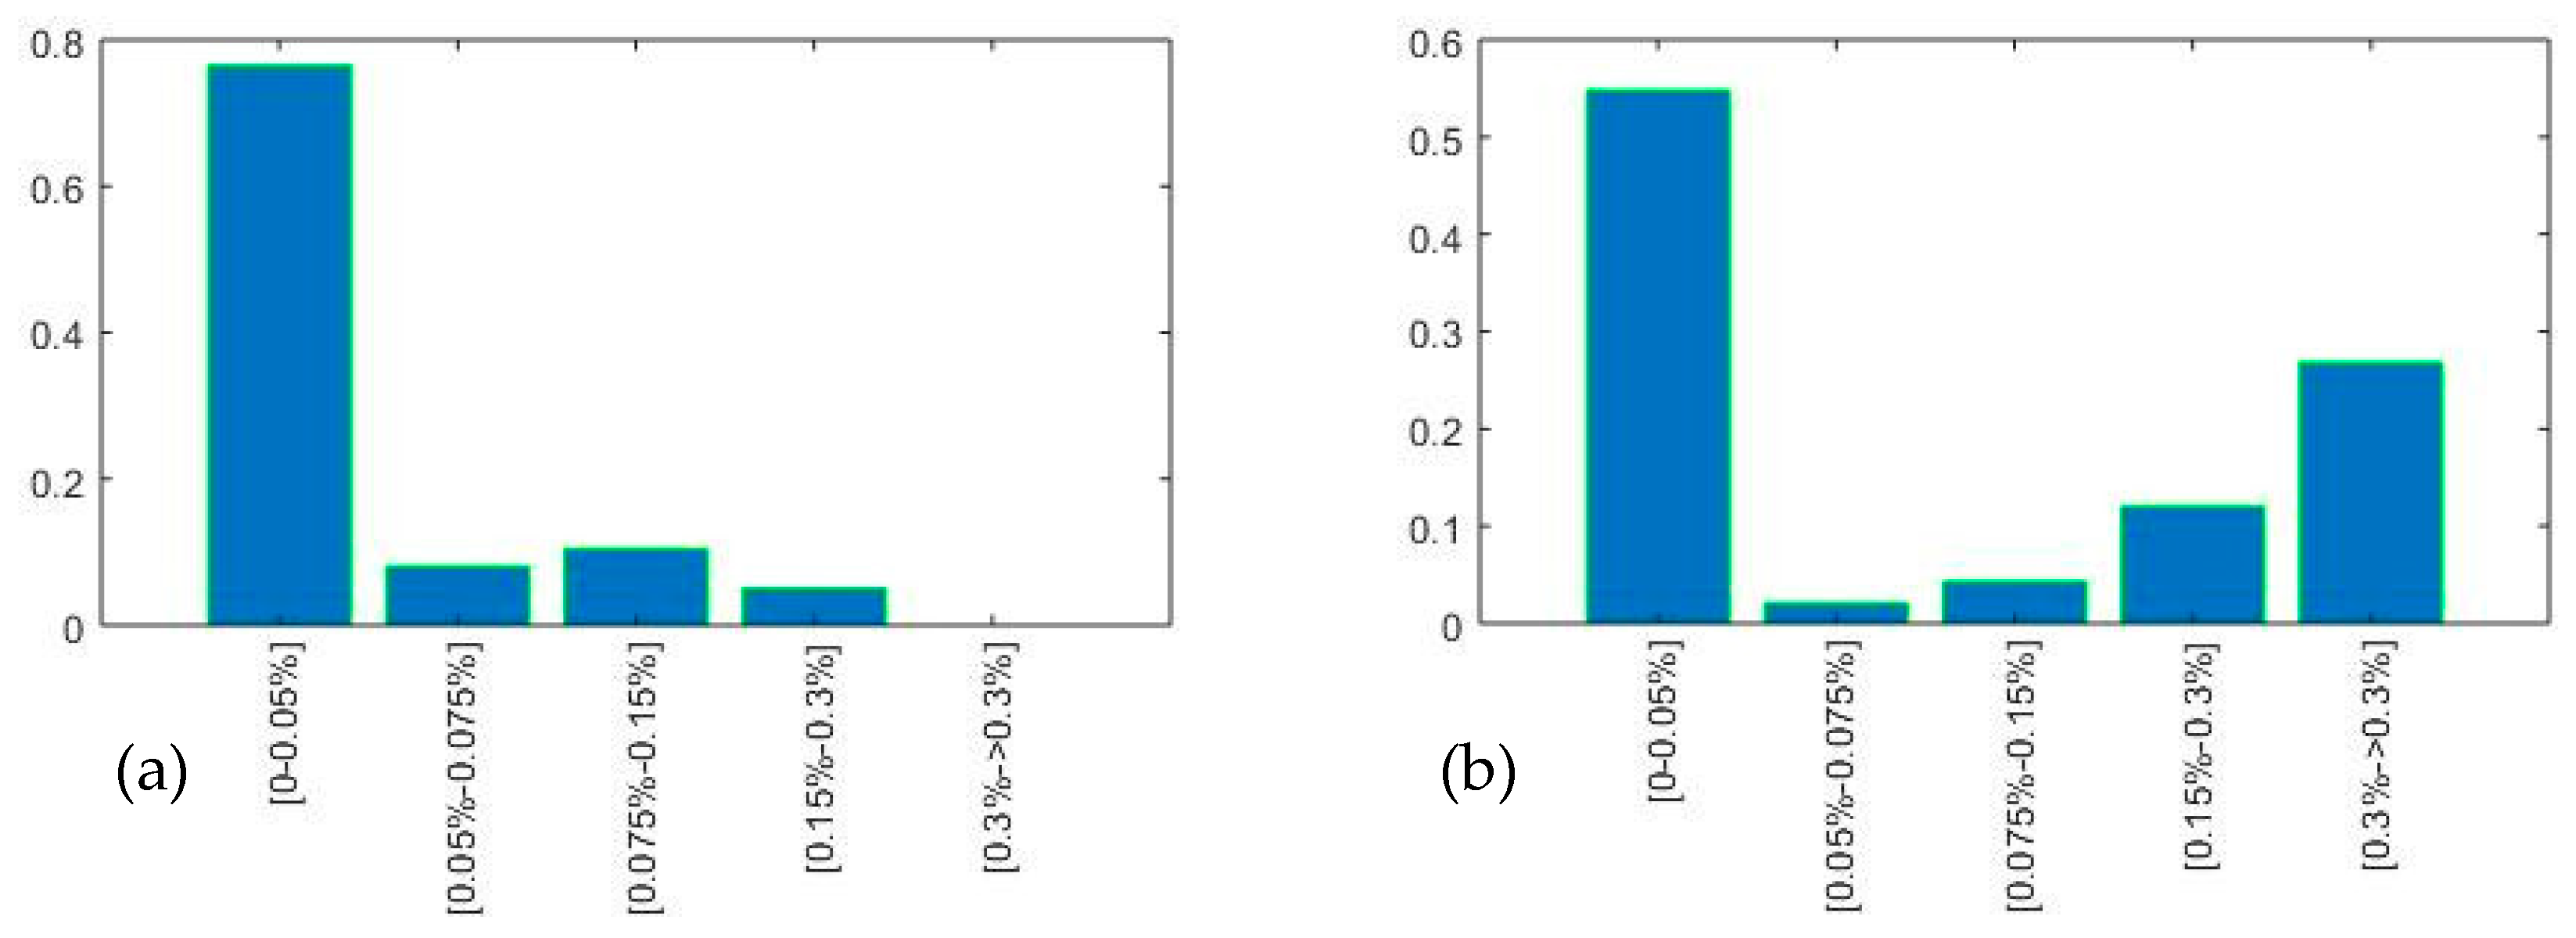
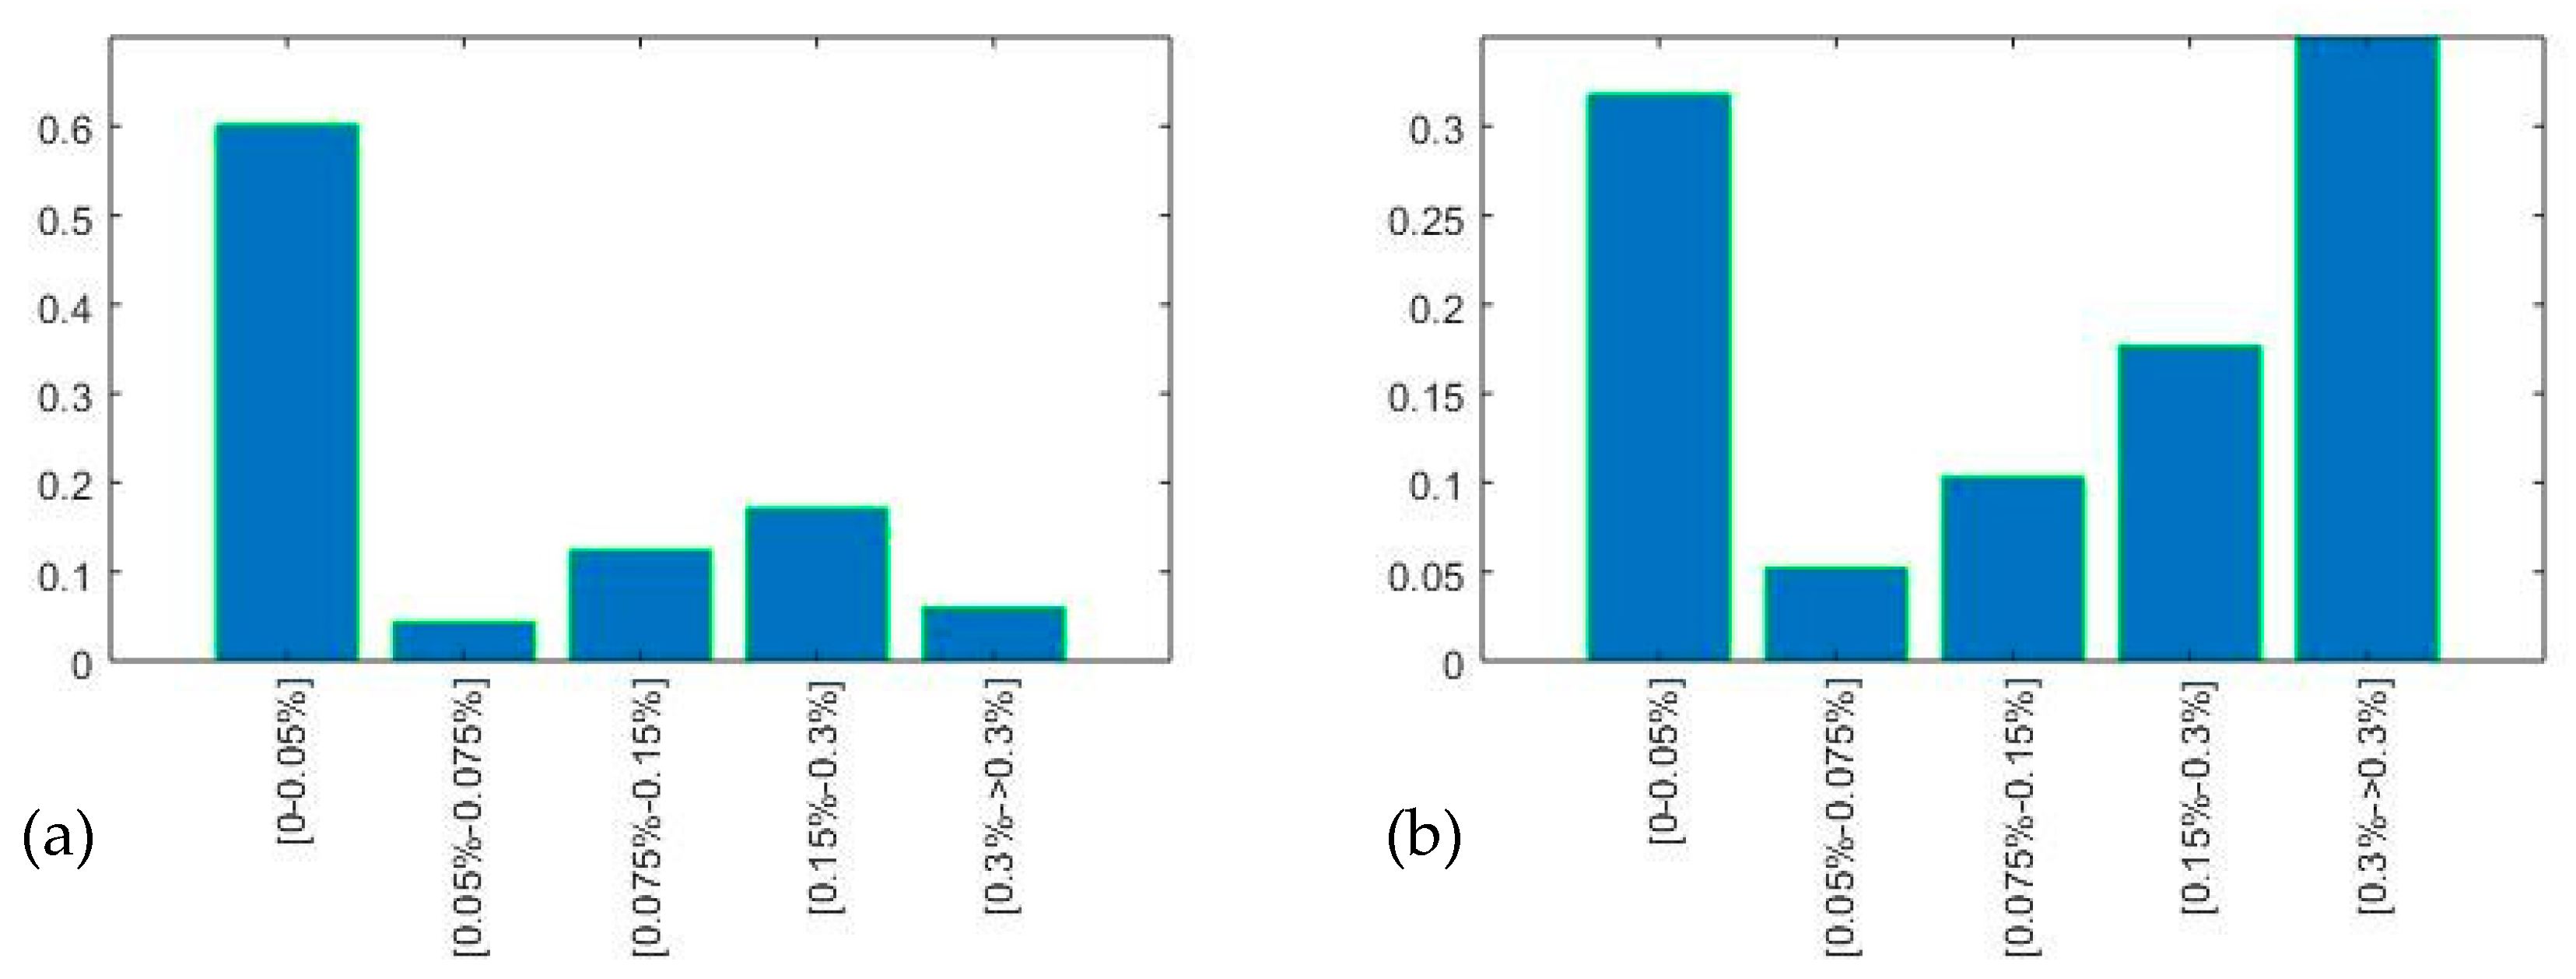
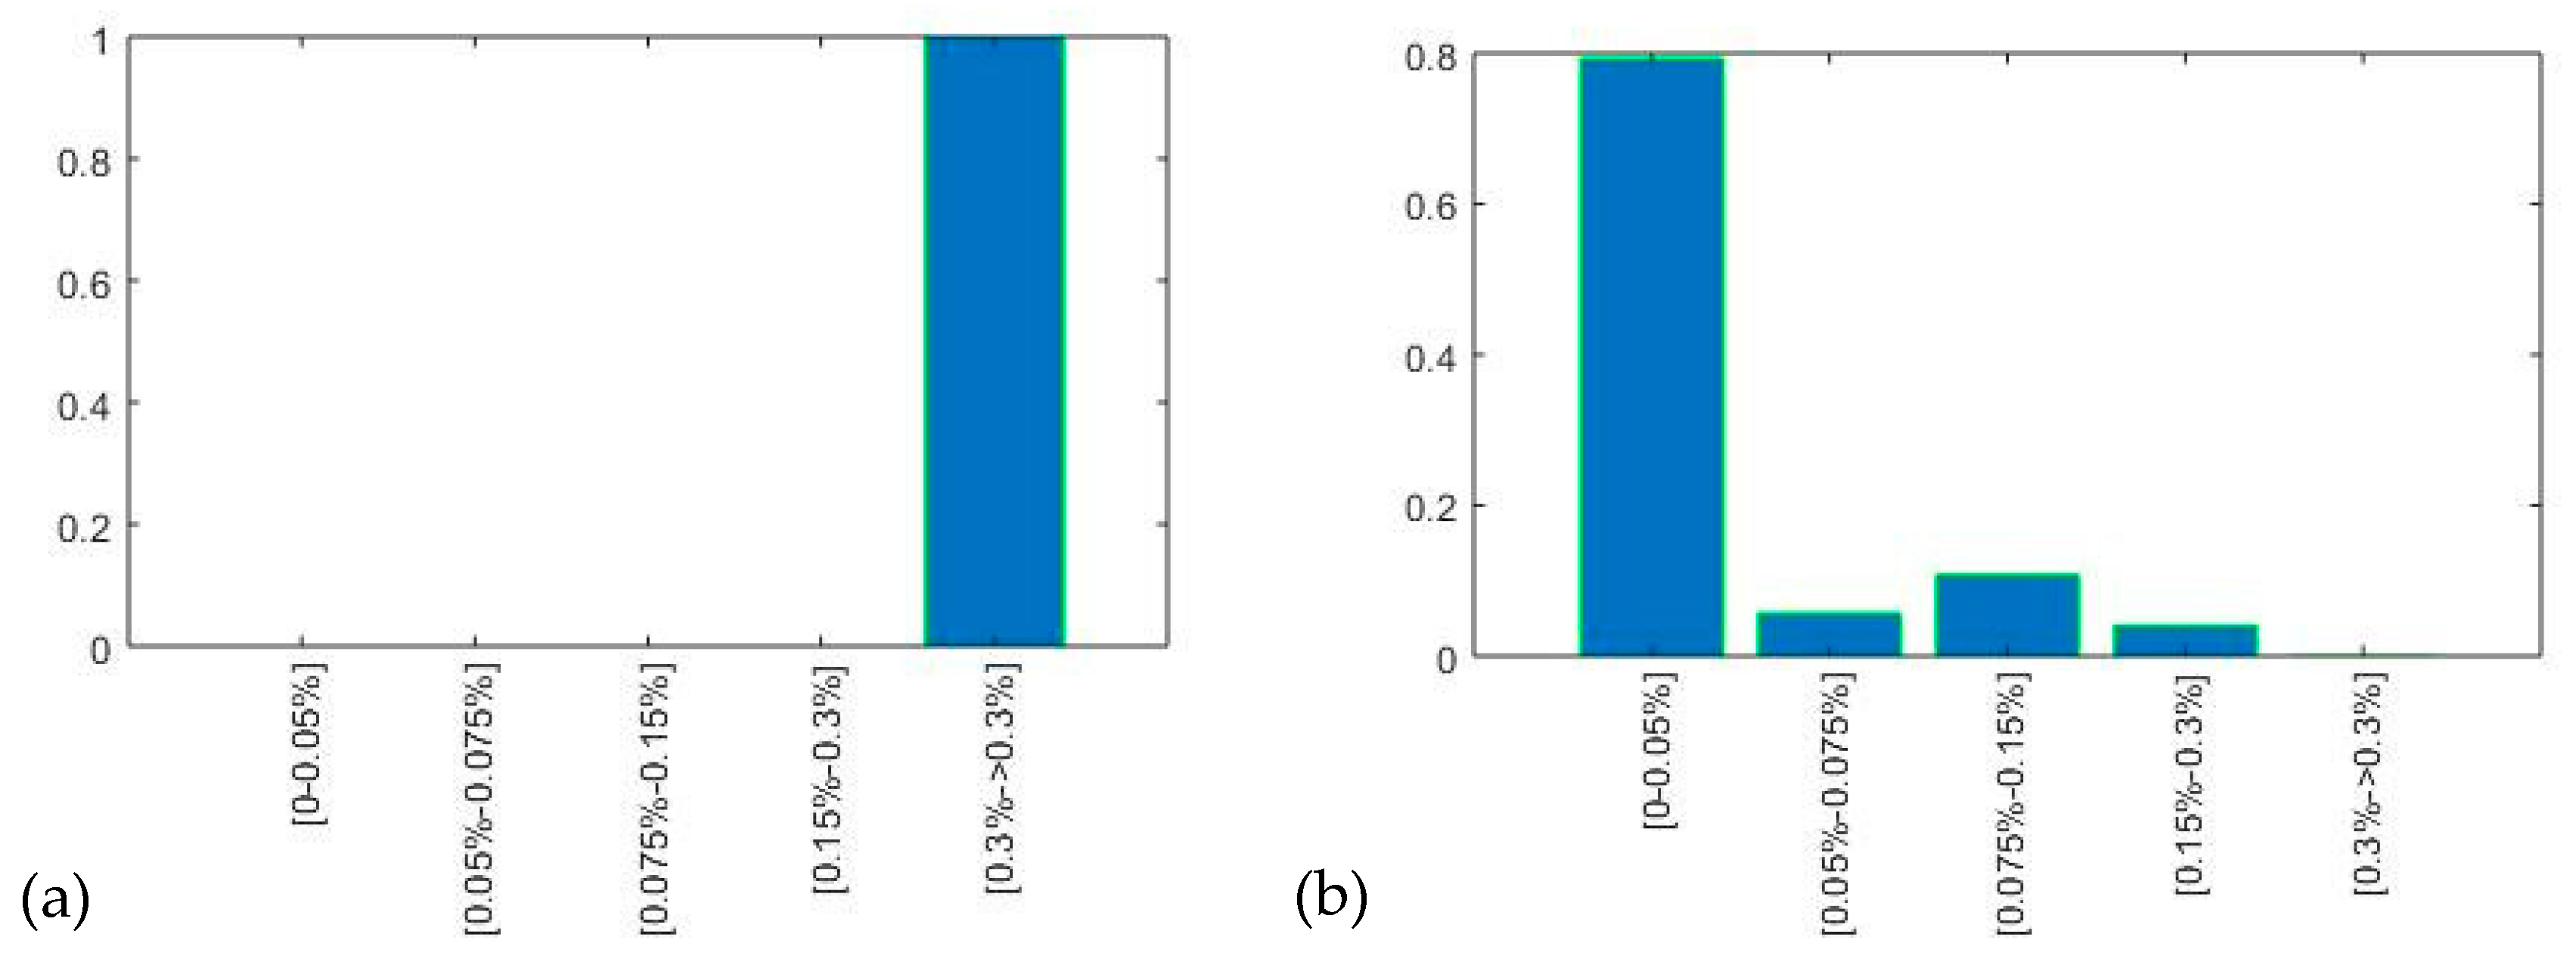
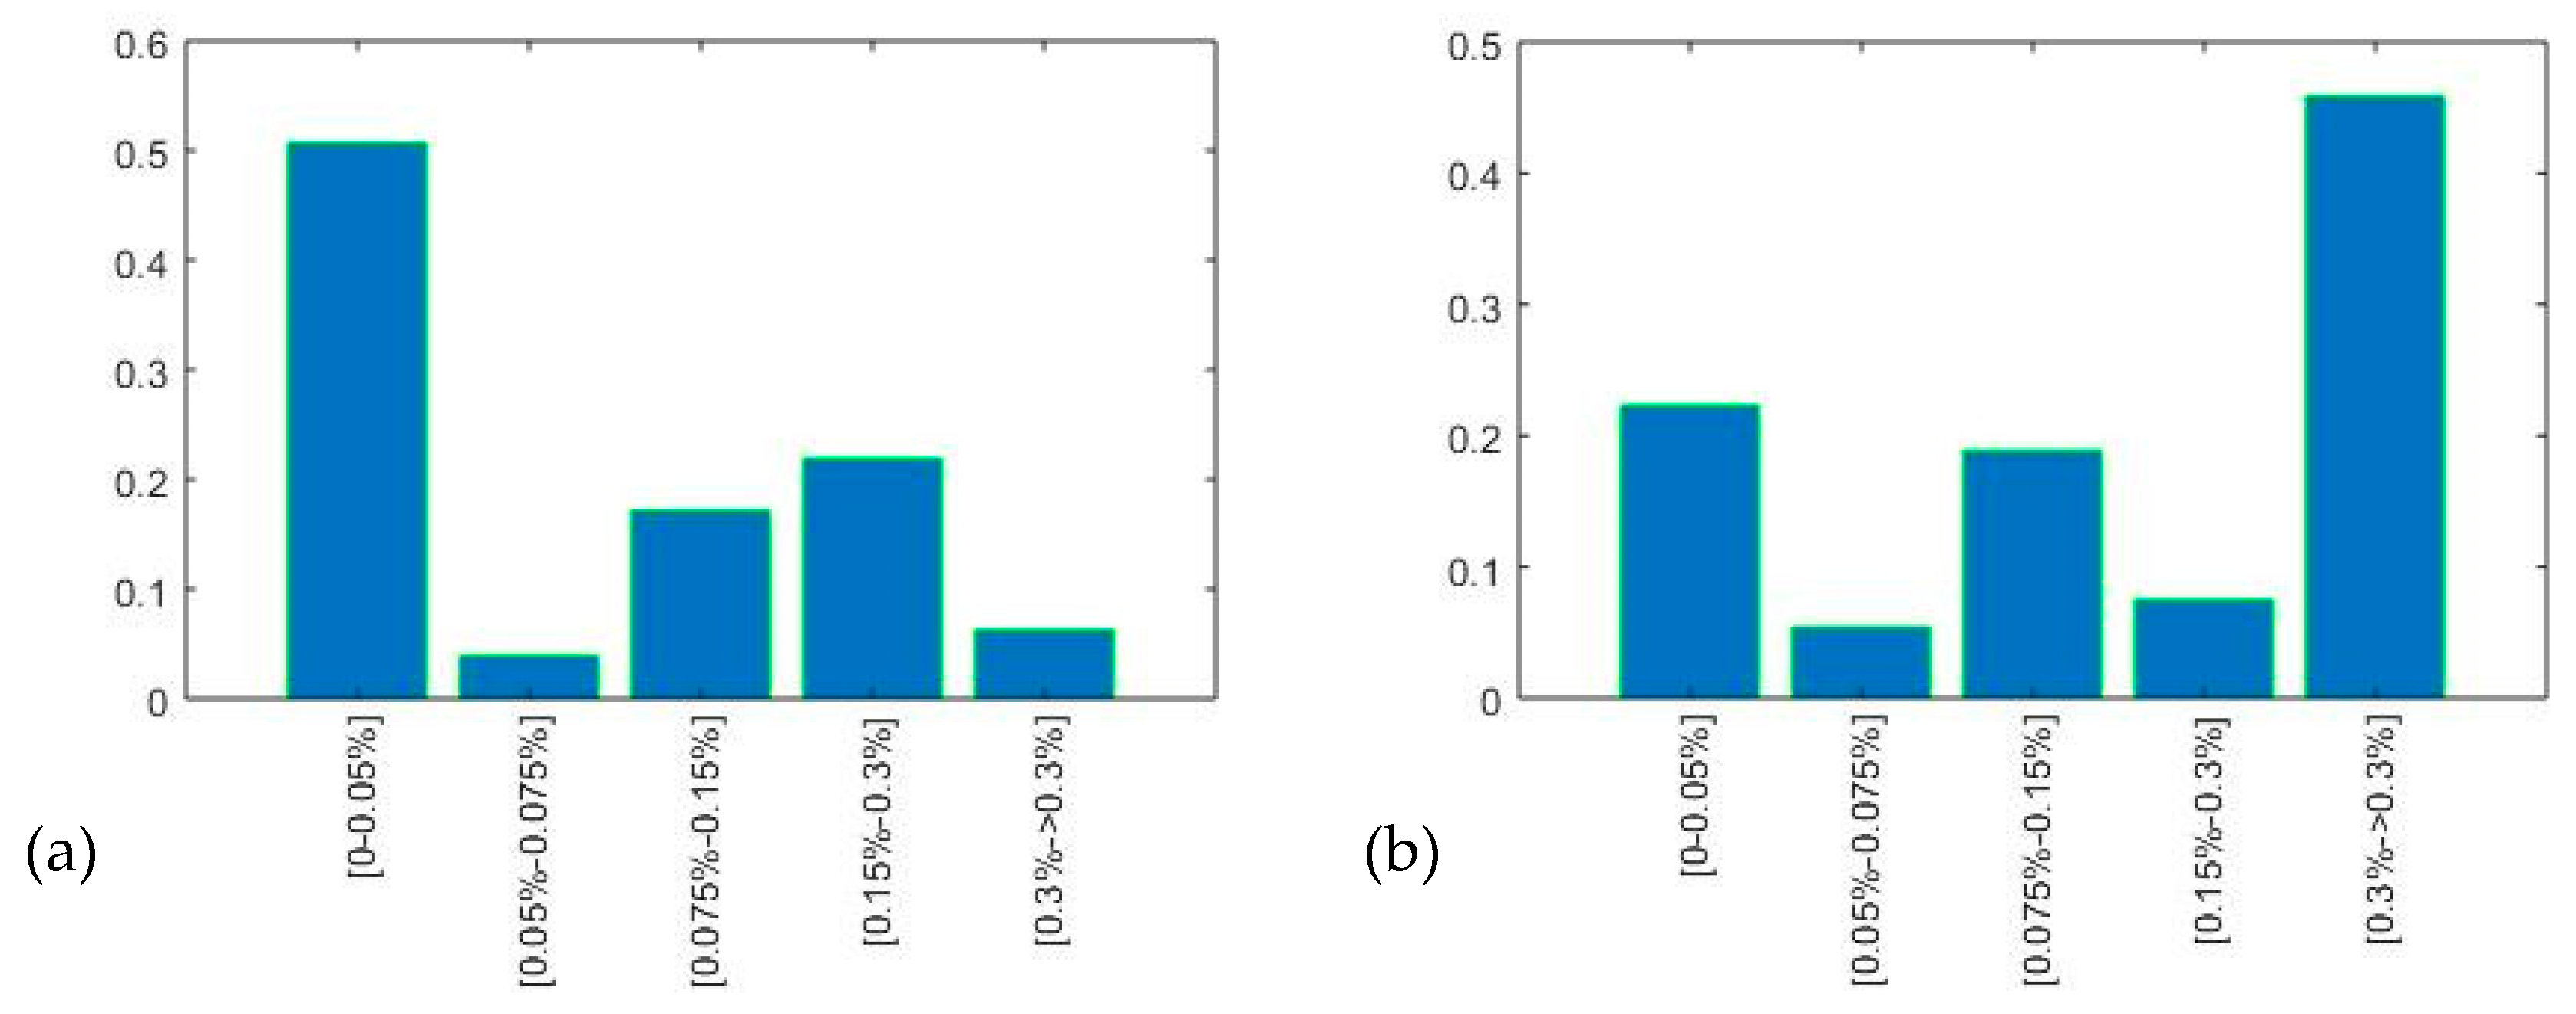
Each of the ten buildings within the study area was analyzed using the methodology. To produce clear probability estimations, the Monte Carlo simulations were run 1000 times in MATLAB (a reasonable number of simulations according to Vose [57]). Hence, for each building, a probability for any damage category to occur was generated. Figure 6, Figure 7, Figure 8, Figure 9 and Figure 10 show the resulting probability distributions for the damage associated with each building investigated as bar graphs of the damage categories (1–5). The probability values were then used to develop the settlement economic risk of this damage.
2.3.2. Building Damage Cost Analysis Using Probability Density Functions
As previously mentioned, in the settlement-induced building-damage scheme used in this case, the critical tensile strain (εcrit) levels are related to this damage. Minor critical strains are associated with negligible damage and small repair-costs, whereas larger critical strains affect the function or the main structure of a building resulting in substantial damage and costs. The consequences of this damage are described by a continuous function providing the settlement economic risk (Rs) for each building, as presented in Equation (7) [14].
where Rs is the settlement economic risk due to tunneling given by a combination of the economic cost, Cs, induced by the settlement and the probability density function (PDF) of damage occurring, fs.
The settlement economic risk, Rs, is initially calculated for each building. The sum of Rs for all buildings included in the investigated urban area gives the total economic risk for a specific settlement hazard for this urban area. The economic costs (Cs) are made up of direct costs (i.e., costs of repairing of settlement damage) and indirect costs (e.g., related to project delay, a reduced market value of damaged buildings and tenant issues) [14]. Only the direct costs are accounted for here to illustrate the approach. Due to the fact that no rigorous related damage database exists for the UK, the economic cost valuation in the proposed method was based on earlier research and not directly related to tunneling-induced settlement damage. Hence, the proposed methodology employed the “damage index” adopted by Blong [16] that enables the damage evaluation due to any hazard and any type of building to be determined. This was used to estimate the settlement damage in terms of complete replacement costs for any investigated building or building at risk. This is expressed in units of average gross charge (cost) for a new property (house) in meter squared of floor area. The average gross charge for new construction in England and Wales in the year 2016 was 2400 £/m2, while the highest reasonable gross charge reached 6600 £/m2 in the wider London area [15]. The average property area in England and Wales in the year 2016 was 90.1 m2 [15].
To estimate the damage costs from a particular hazard, the full scale of potential values from 0 to 1 corresponds to the complete range of the observed damage, i.e., from no damage to the total collapse of the building. Blong [16], after reviewing studies of damage caused by natural hazards, identified five alternative damage categories: light, moderate, heavy, severe and collapse, with a qualitative description provided for the nature of this damage. A summary of the categories used in that study is presented in Table 5, adapted from Blong [16]. Each damage category has a corresponding range of damage-values, where for estimation purposes, Blong [16] has taken the central value and called this the “central damage value” (CDV) (Table 5).
In the current approach, the five damage categories after Blong [16] are correlated with the building damage categories (No 1–5) based on the critical strains of Table 3 [12,41], caused by the tunneling-induced settlements generated within the building footprints. Subsequently, the cost of the settlement damage for each of the five damage categories is estimated from Equation (8).
Considering Equation (8) and Table 5, the average damage cost per m2 (gross) floor area is estimated for each corresponding damage category as presented in Table 6. Due to the fact that probability density functions (PDFs) are not directly defined by a number, the highest reasonable damage cost for a respective category is estimated in combination with the expertise of the authors in this field. The resulting highest value would then represent the 95% percentile in the respective category. The values of the 95% percentile cost per m2 floor area for each damage category are also summarized in Table 6. To obtain these values, the prices used were adapted using the study of Sundell et al. [14] combined with the expertise of the authors, in addition to the highest gross charge (cost) in the wider London area taken from the Office for National Statistics [15]. It is important to note that the intention here is to demonstrate how the method works rather than providing exact values for these costs, which will be dependent on the particular costs associated with a country/region or city.
Damage from various hazards often follows a skewed probability distribution [58]. The log-normal distribution is commonly employed to analyze the positively skewed damage distributions of PDF [58]. By definition, a PDF of damage is “lognormally” distributed when the log-transformed PDF of the damage is normally distributed. This can be described as a function: Y = ln(X) that is normally distributed with a mean, μ, and a variance, σ2. Then, X is lognormally distributed with parameters, mean (μ), and variance (σ2). It should be noted that μ and σ2 are not the mean and variance of the log-normal random variable, X, but are the mean and variance of the log-transformed random variable, Y and the log-normal distribution is commonly referred to as LN(μ, σ2). The log-normal PDF was selected in the present methodology to provide positive (damage) costs, Cs, and represent larger uncertainties in the correct part of the curve [58]. If the average cost per m2 is the expected value m and the 95% percentile is the variable q for each damage category, the Equations (9)–(12) can be employed to evaluate the parameters μ, and variance, σ2, of the log-normal PDF for damage cost, Cs, for each damage category [59]. The value from the log-normal distribution, m, and the 95% percentile, q, is given by Equations (9) and (10), respectively [59]:
where z0.95 is the 95% percentile of the standard normal distribution profile (approximately equal to 1.645). Then, taking the logarithms of m and q, are represented by Equations (11) and (12) [59]:
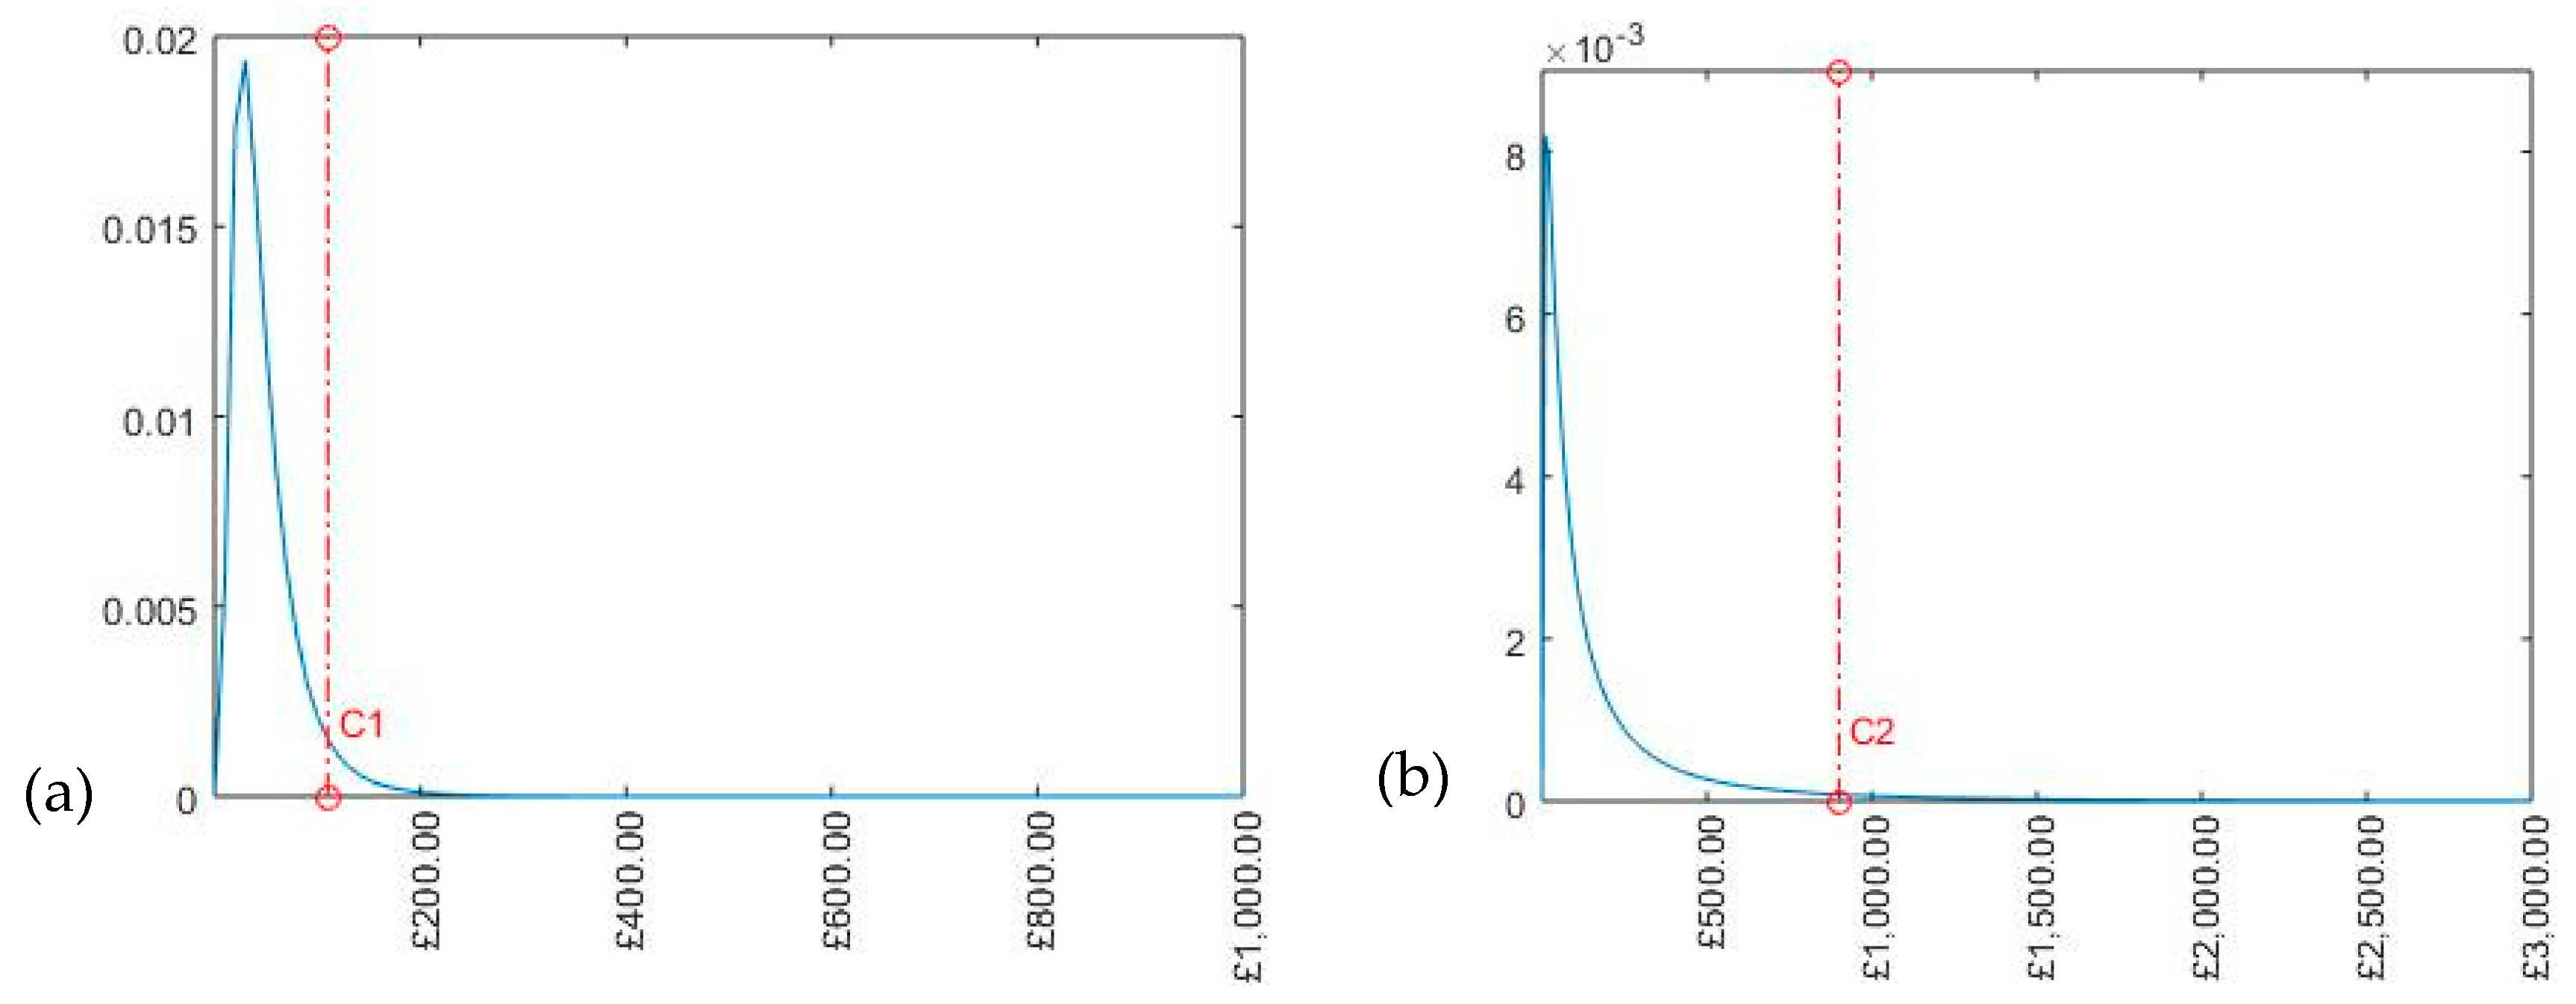
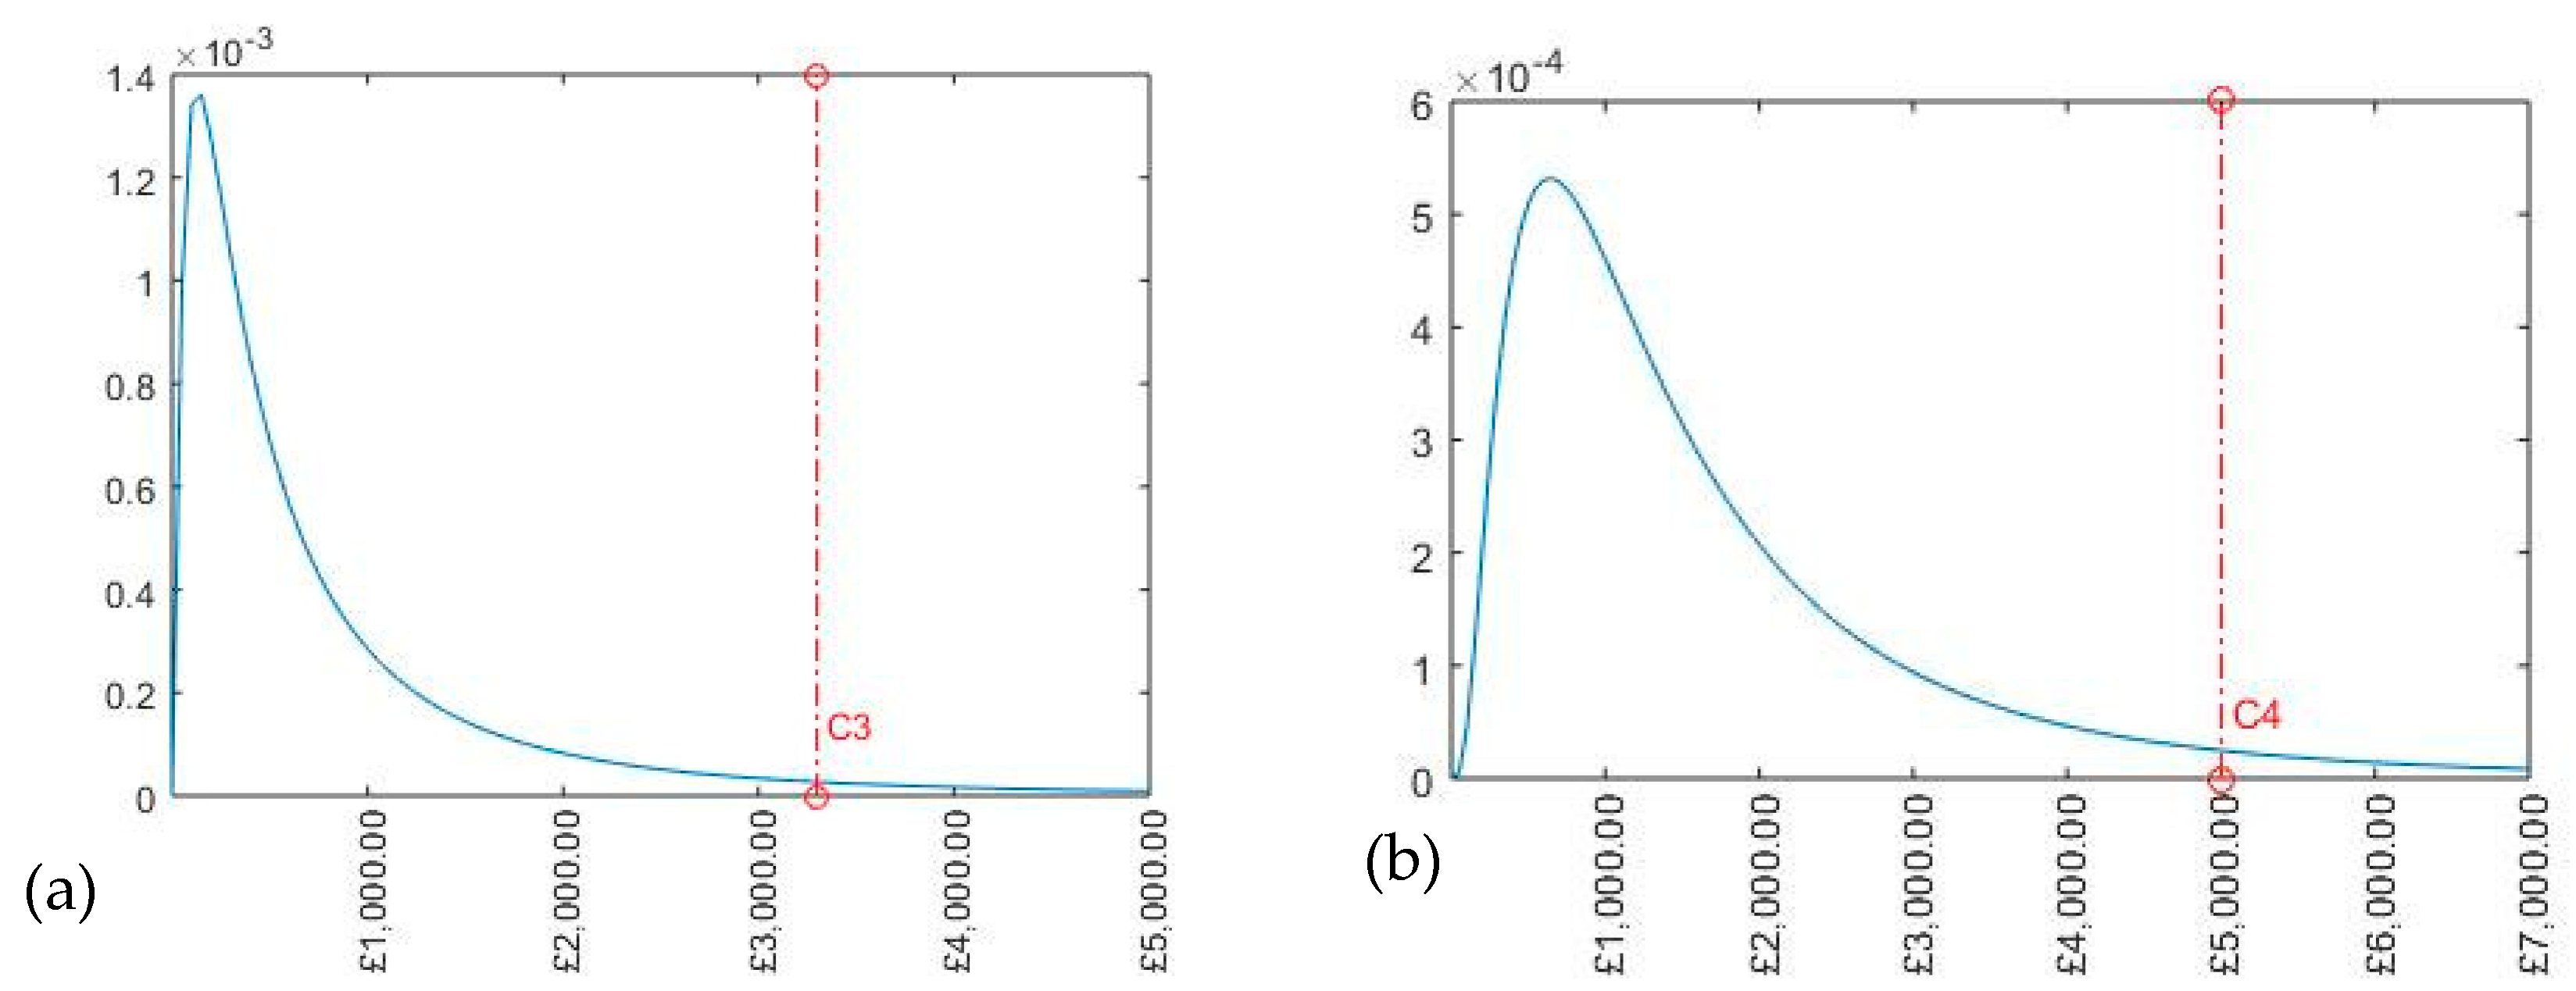
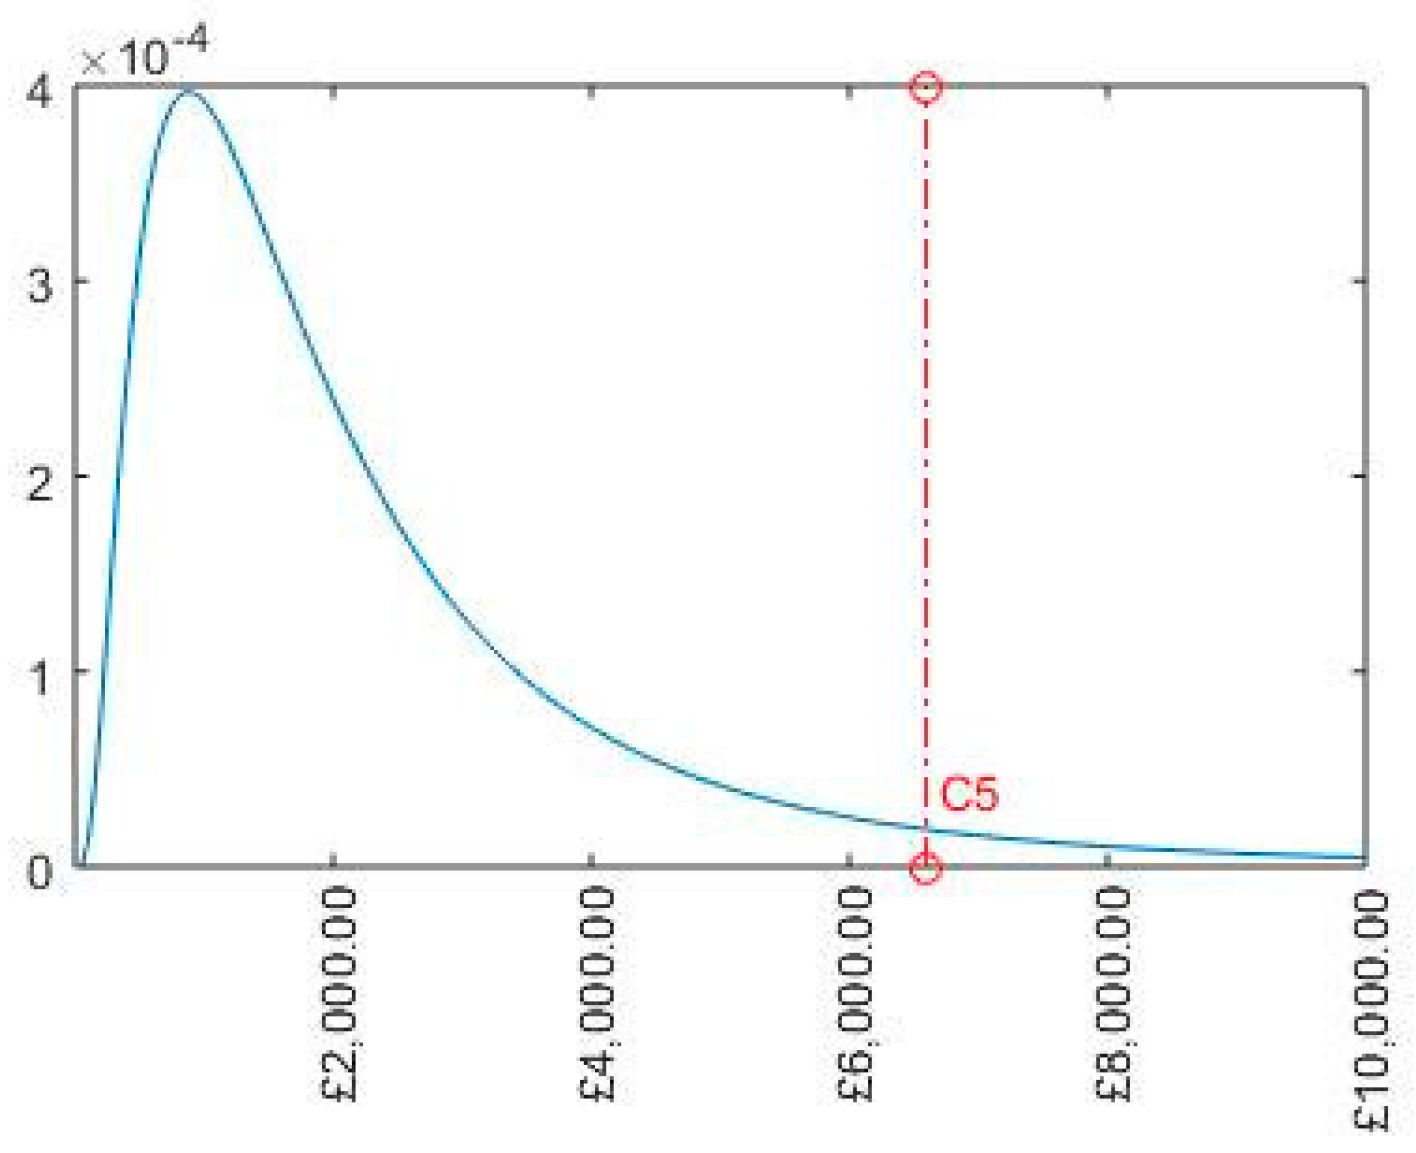
The equation with the positive solution for σ and μ is selected (unless q > m). Table 7 shows the resulting mean (μ) and variance (σ2) for the log-normal PDF, LN(μ, σ2), for the building damage costs for each damage category. Using these values, a log-normal PDF (fs) describing the variation in the corresponding (repair) cost (Cs) for each damage category is presented in Figure 11, Figure 12 and Figure 13, using MATLAB.
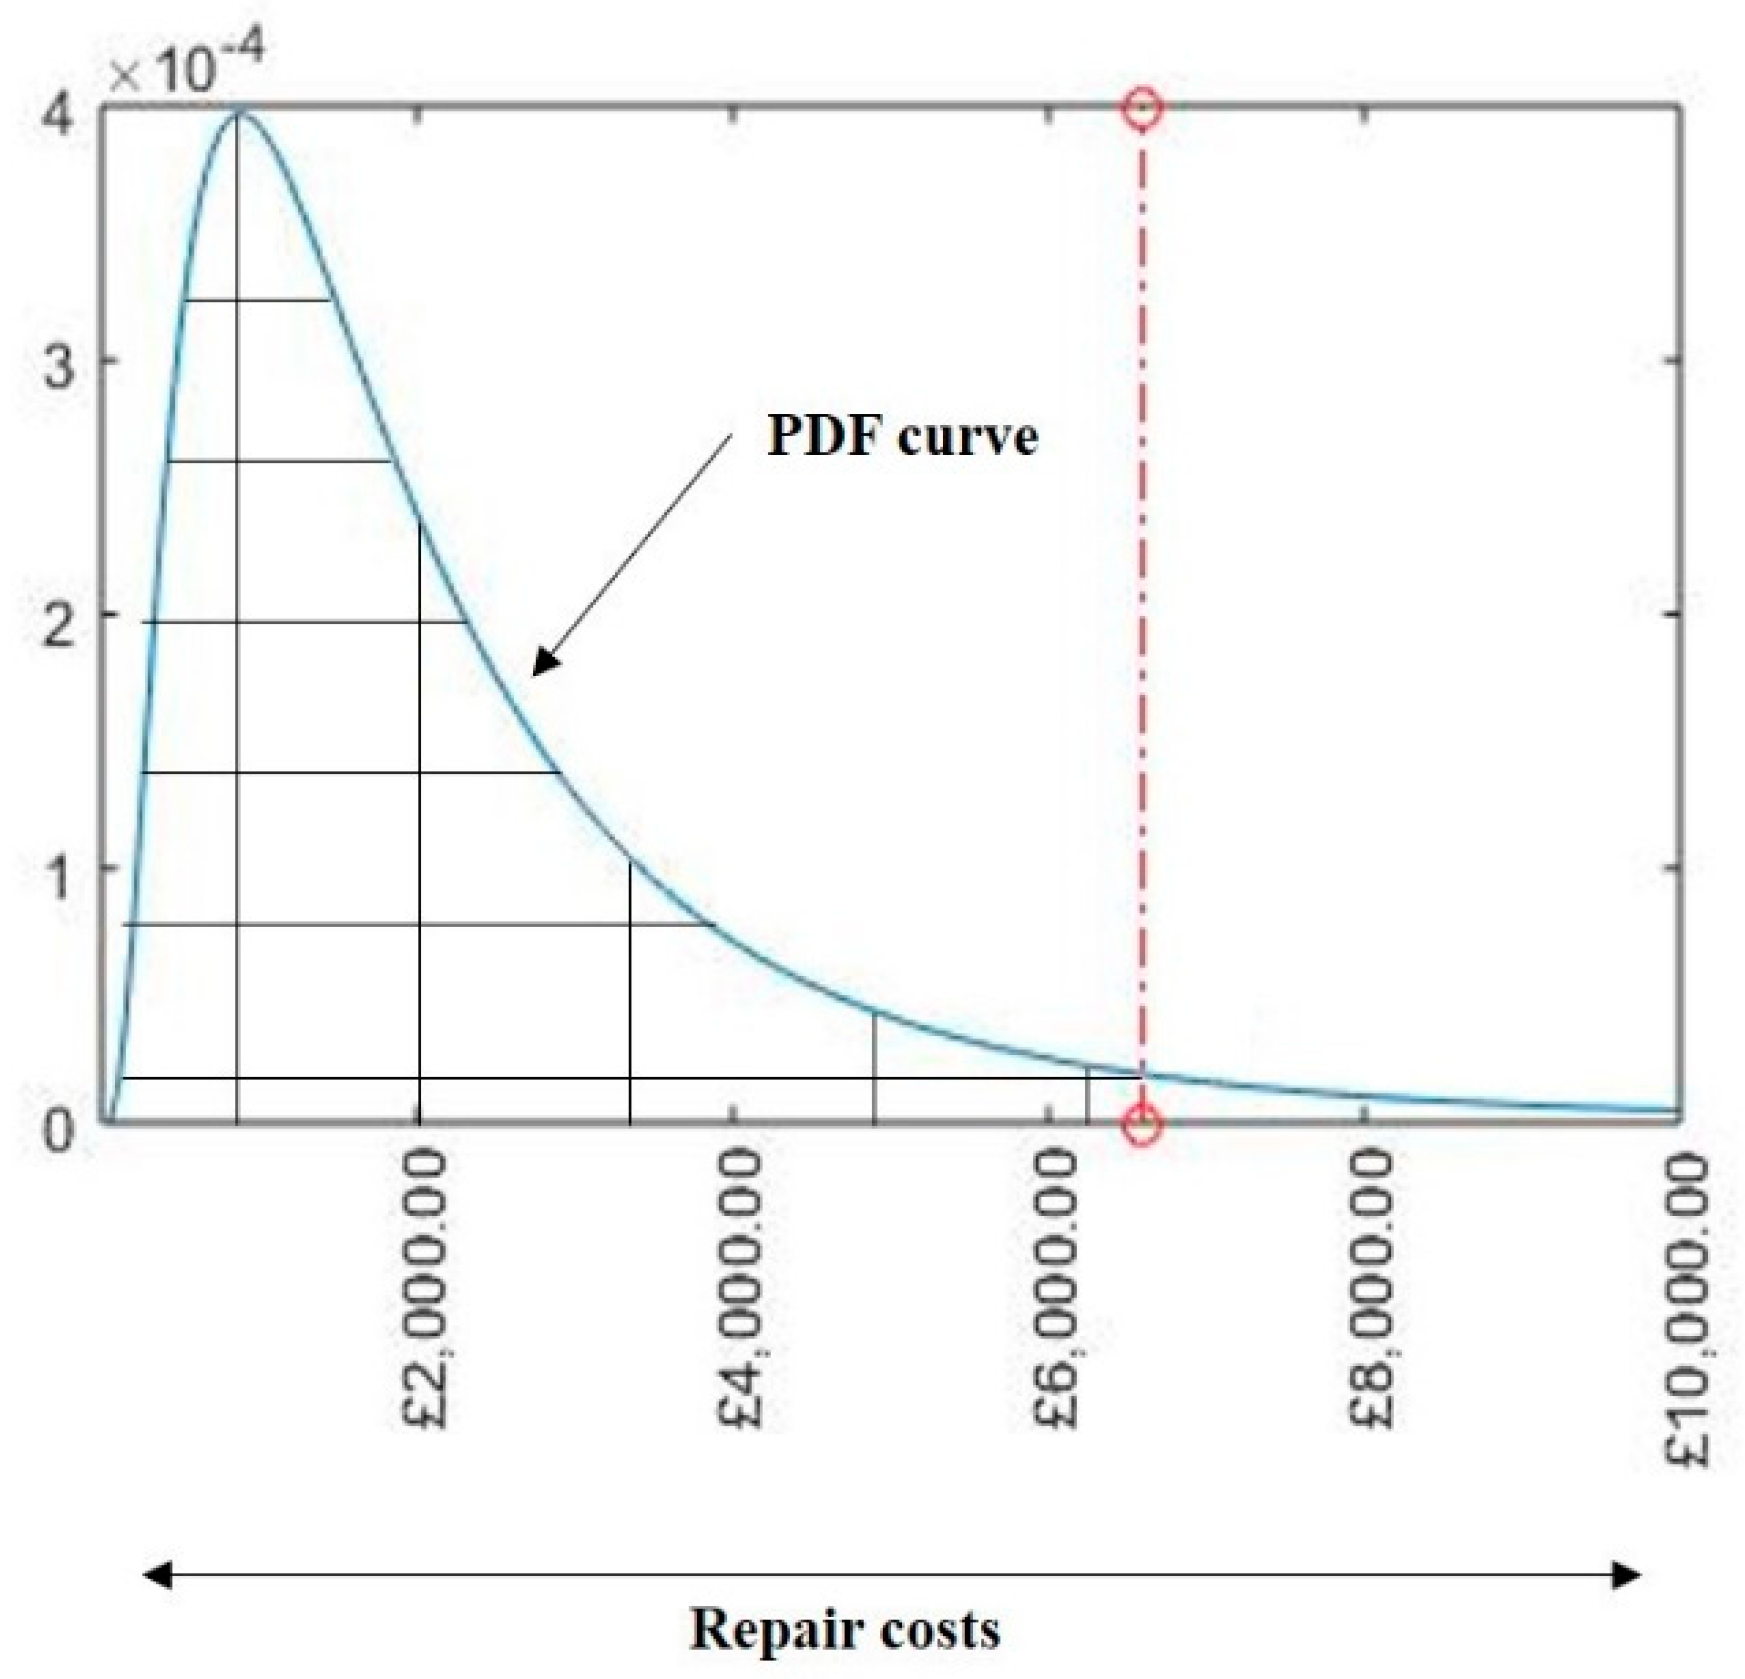
Finally, the settlement economic risk is provided for a building in relation to the probability of damage within one of the damage categories. This is estimated using Equation (7), using the integral indicated by the area bounded by the PDF curve for a damage category and by the repair costs up to the point of the cost corresponding to the probability of this damage category. By way of example, as shown in Figure 14, the settlement economic risk for the damage category No. 5 (severe) is provided using the grid-area created by the PDF curve and the repair costs up to the cost corresponding in this case to the 95% percentile probability of damage (damage category No. 5). This is also applied for the other damage categories, and their sum provides the settlement economic risk of a building. These can then be presented visually, as discussed in the next section of the paper.
3. Results: Settlement Economic Risk Assessment
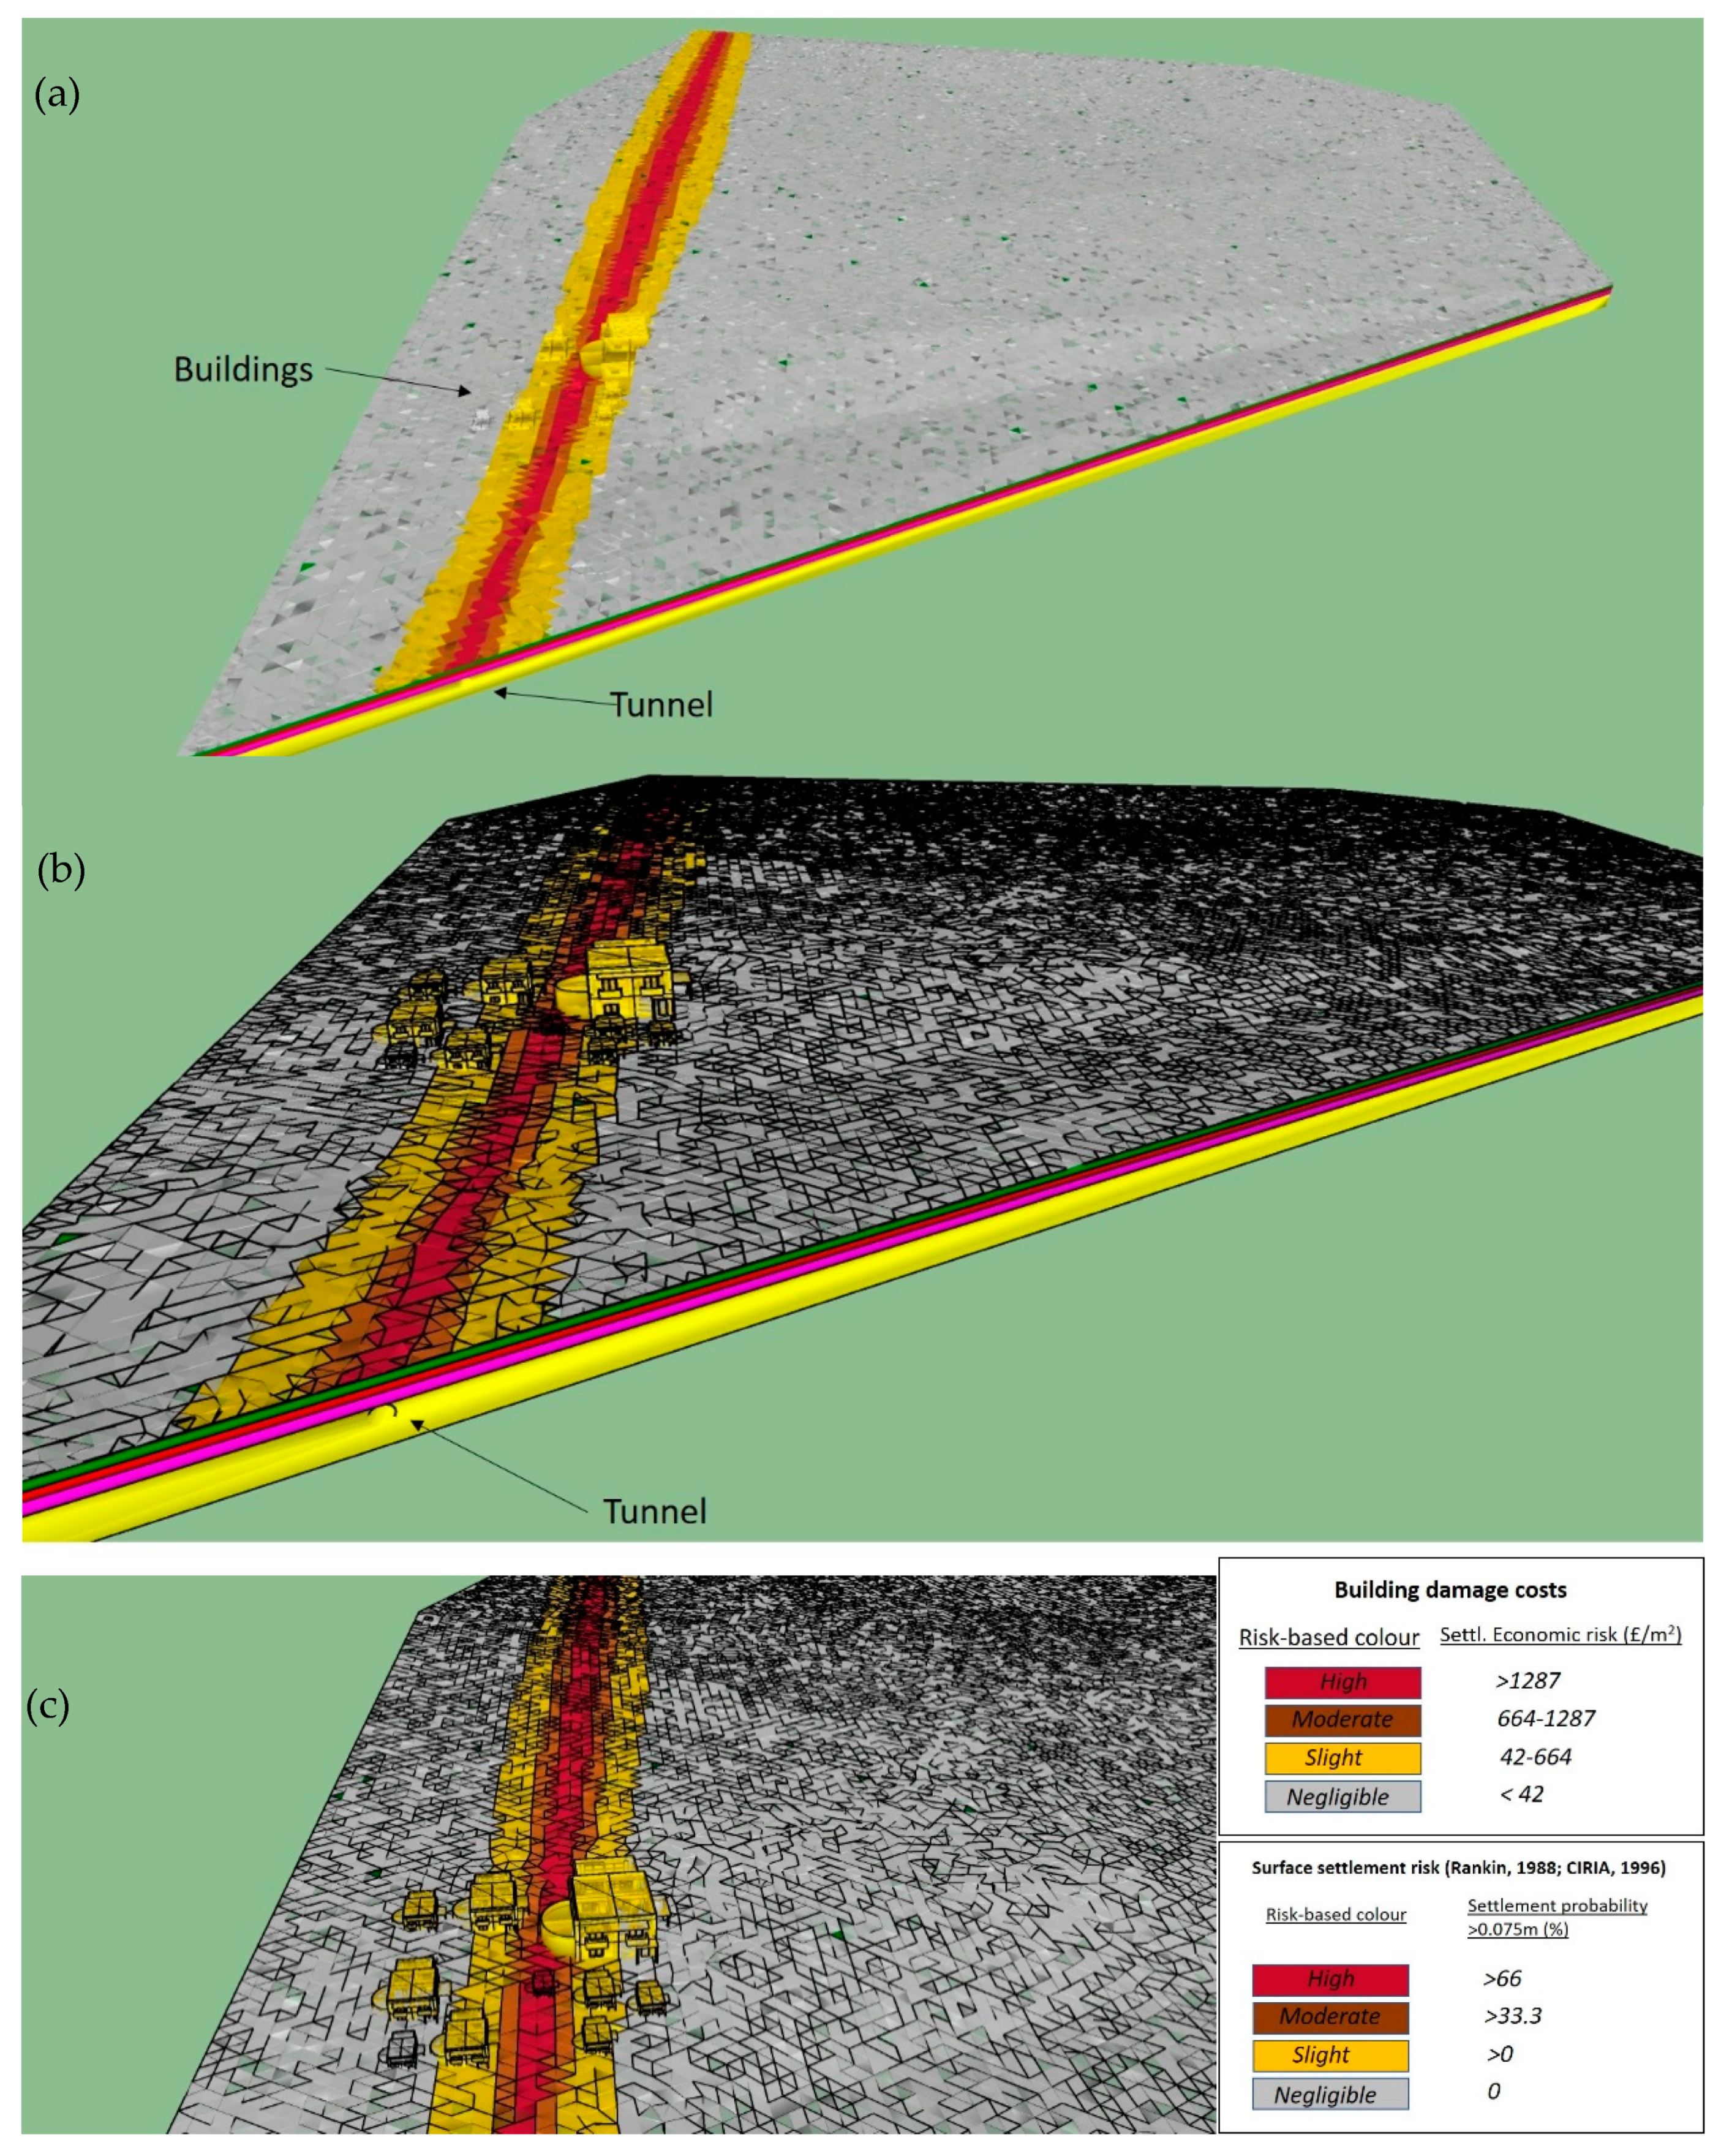
The resulting 3D visualizations using BIM demonstrate the settlement economic risk of buildings due to the tunneling-induced settlement. Colors are used in the visualizations to represent the probability of the risk (using Equation (7) and the Monte Carlo simulations). The damage Extent due to the tunneling-induced settlements, presented on the ground surface (surface settlement risk), is included in the same visualizations, using Table 2 [11,55] and Equation (1), to present the full picture of the assessment conducted. 3D visualizations of the settlement economic risk and the damage Extent are presented in Figure 15.
4. Discussion
Colors are used in the visualizations to represent different levels of risk for the buildings and the ground surface as a result of the settlement trough, demonstrating a higher risk along the tunnel centerline (the risk increases towards the tunnel centerline). Therefore, buildings closer to the tunnel centerline indicate a probability of higher economic risk due to ground settlement, although it is well known that areas of sagging or hogging are also important in determining potential building damage. Buildings lying within areas of high risk due to surface settlement obviously exhibit a higher settlement economic risk, as shown in Figure 15c. In contrast, those lying away from this zone present a lower economic risk, with slight or negligible risk-based colors (Figure 15). As a result, buildings with a brown and red color, i.e., with a moderate to high settlement economic risk, would require more detailed investigation with regard to potential damage. Due to the capabilities of BIM to capture all the details of a building, it is evident that building characteristics, such as building dimensions, had an impact on the assessment analysis outcomes and resulting visualizations. Therefore, larger buildings would tend to lead to higher risk, based on a larger corresponding area spanning the settlement trough and the potential for differential settlement and cost, using £/m2 [14], as presented in Figure 15.
A more detailed analysis of the resulting visualizations in Figure 15 would focus on the settlement economic risk of particular buildings individually. To illustrate this, Building Nos. 1, 2, 3, 7 and 10 were used. Their locations are shown in Figure 4, and their corresponding visualizations are presented in Figure 15. Building Nos. 1, 2 and 7 fell directly above the negligible, slight and high-risk zones of surface settlements, respectively and exhibited a corresponding negligible, slight and high settlement economic risk (Figure 15). However, the dimensions of the building would be the determining factor in the case of the resulting risk visualization for Building No. 3, since it is larger than Building No. 1, as shown in Figure 15—here the dimensions of this building had a strong effect on its resulting slight risk even though it is located outside the settlement impact zone of the trough (negligible surface settlement risk). Building No. 10 is located across all zones of surface settlement risk, yet with a larger proportion located within the slight risk zone, as shown in Figure 15. This, in combination with its large dimensions, provided a slight settlement economic risk for this building (Figure 15).
These examples of multidimensional visualizations using BIM provide a preliminary tool for settlement economic risk assessment associated with building damage. This advances decision-making in relation to tunneling-induced ground settlement in an urban setting. However, the framework of this tool is designed to work effectively with any other geohazard application. In addition, it is possible to alter the geotechnical factors depending on project requirements.
In an extended version of the current approach, the geometrical properties of the building elements (columns, beams, walls, doors and windows) could also be integrated within the overall response of a building to such a geohazard. Using a combination of extracted probabilistic distributions of settlement and the appropriate building damage cost probability curves, any possible scenario of damage (or damage category) could then be simulated. Such extended models would then be capable of estimating damage costs per element, element group, story and buildings within different damage categories. Regarding the actual economic value used in the uncertainty analysis, a complete cost distribution rather than a mean value can be formed. In addition, the resulting visualizations of building damage are also important, as they help to make the information more readily accessible and understandable. Presenting this type of consequence is difficult for existing settlement analysis software, and the proposed methods herein will consequently help in discussions with clients and asset owners. Therefore, demonstrating such an integrated outcome of risk assessments in 3D allows engineers/users to identify critical areas and plan for alternative routes and share them easily.
A more general observation is that such analysis prior to underground works can advise on the types of engineering design and construction processes that may be used by making the potential or likely consequences transparent, by iteration of the engineering “solutions” minimize the adverse consequences, and thereby minimize the uncertainties surrounding the greater use of underground space in urban areas and de-risk the decision-making towards far more sustainable urban environments. It should be noted that the “economic lens” used in this analysis is essential because of the economic imperative that national and local governments face, and yet there are many techniques that could be incorporated to introduce “social and environmental lenses” to the problem also [60,61].
5. Conclusions
This paper has focused on the economic risk of building damage due to ground movements from tunnel construction. It has used the example of the settlement hazard due to tunneling to clearly reveal the benefits of the adopted framework for this tool and provide the related uncertainty evaluation. This integrated computer application employed Monte Carlo simulations and analytical models and building damage assessments in relation to the “settlement trough” to investigate these building damage costs.
The risk is assessed from a detailed numerical algorithm using MATLAB in combination with the BIM framework. This combination has taken advantage of BIM’s capabilities to import building characteristics into the model for use in the analysis. It also provided the basis for the uncertainty analysis of the actual economic risk due to ground movements in an urban area using advanced statistical tools, i.e., the Monte Carlo simulations and probabilities, and using building damage assessments. The outcomes from a practical example were presented to show the benefits of multidimensional visualizations, including an integrated settlement economic risk assessment using BIM.
The proposed computer-aided tool advances analyses and sustainable decision-making because of its emphasis on the estimation of uncertainty associated with geohazards, in this case building damage costs associated with tunneling-induced settlements in an urban area. The framework for this assessment tool used the example of tunnel construction in an urban setting to demonstrate how complex ground-structure interactions can be visualized and the associated building damage risk identified and evaluated in terms of costs. Depending on the risk of incurring economic costs, the potential for damage to buildings can be investigated further. Future simulations based on the proposed framework and incorporating ground improvement processes could also be applied. While this integrated framework was demonstrated for tunneling as an example of a geohazard, the framework can be applied to any type of urban geohazard; more generally, similar uncertainty analyses could be adapted for larger-scale models also based on this framework.
Author Contributions
Writing—original draft, S.P., C.D.F.R. and D.N.C.; Writing—review & editing, C.D.F.R. and D.N.C. All authors have read and agreed to the published version of the manuscript.
Funding
This research was funded by the Engineering and Physical Sciences Research Council via grants EP/K021699 (Assessing The Underworld), EP/N010523 (Self-Repairing Cities) and EP/P013635 (UKCRIC-National Buried Infrastructure Facility).
Acknowledgments
The authors gratefully acknowledge the financial support provided by the University of Birmingham via a Post-Graduate Teaching Assistantship to the first author, and the Engineering and Physical Sciences Research Council via grants EP/K021699 (Assessing The Underworld), EP/N010523 (Self-Repairing Cities) and EP/P013635 (UKCRIC-National Buried Infrastructure Facility).
Conflicts of Interest
The authors declare no conflict of interest.
References
- Hunt, D.V.L.; Makana, L.O.; Jefferson, I.; Rogers, C.D.F. Liveable cities and urban underground space. Tunn. Undergr. Space Technol. 2016, 55, 8–20. [Google Scholar] [CrossRef]
- Rogers, C.D.F. Substructures, underground space and sustainable urban environments. Geol. Soc. Lond. Eng. Geol. Spec. Publ. 2009, 22, 177–188. [Google Scholar] [CrossRef]
- Providakis, S.; Rogers, C.D.F.; Chapman, D.N. Predictions of settlement risk induced by tunnelling using BIM and 3D visualization tools. Tunn. Undergr. Space Technol. 2019, 92, 103049. [Google Scholar] [CrossRef]
- Cattoni, E.; Miriano, C.; Boco, L.; Tamagnini, C. Time-dependent ground movements induced by shield tunneling in soft clay: A parametric study. Acta Geotech. 2016, 11, 1385–1399. [Google Scholar] [CrossRef]
- Clarke, J.A.; Laefer, D.F. Evaluation of risk assessment procedures for buildings adjacent to tunnelling works. Tunn. Undergr. Space Technol. 2014, 40, 333–342. [Google Scholar] [CrossRef] [Green Version]
- Shahin, H.M.; Nakai, T.; Ishii, K.; Iwata, T.; Kuroi, S. Investigation of influence of tunneling on existing building and tunnel: Model tests and numerical simulations. Acta Geotech. 2016, 11, 679–692. [Google Scholar] [CrossRef]
- Peck, R.B. Deep excavations and tunnelling in soft ground. In Proceedings of the 7th International Conference on Soil Mechanics and Foundation Engineering, Mexico City, Mexico, 1969; State of the Art Volume; Mexican Society of Soil Mechanics: Mexico City, Mexico, 1969; Volume 3, pp. 225–290. [Google Scholar]
- Giardina, G.; DeJong, M.J.; Chalmers, B.; Ormond, B.; Mair, R.J. A comparison of current analytical methods for predicting soil-structure interaction due to tunnelling. Tunn. Undergr. Space Technol. 2018, 79, 319–335. [Google Scholar] [CrossRef]
- Loganathan, N.; Poulos, H.G. Analytical prediction for tunneling-induced ground movements in clays. J. Geotech. Geoenviron. Eng. 1998, 124, 846–856. [Google Scholar] [CrossRef]
- Burland, J.B.; Wroth, C.P. Settlement of buildings and associated damage. In Settlement of Structures; Pentech Pr.: London, UK, 1974; pp. 611–654. [Google Scholar]
- Rankin, W. Ground movements resulting from urban tunnelling: Predictions and effects. Geol. Soc. Lond. Eng. Geol. Spec. Publ. 1988, 5, 79–92. [Google Scholar] [CrossRef]
- Mair, R.J.; Taylor, R.N.; Burland, J.B. Prediction of ground movements and assesment of risk of building damage due to bored tunnelling. In Geotechnical Aspects of Underground Construction in Soft Ground; Balkema: Rotterdam, The Netherlands, 1996; pp. 713–718. [Google Scholar]
- Chapman, D.N.; Metje, N.; Stark, A. Introduction to Tunnel Construction; CRC Press: Boca Raton, FL, USA, 2017. [Google Scholar]
- Sundell, J.; Haaf, E.; Tornborg, J.; Rosén, L. Comprehensive risk assessment of groundwater drawdown induced subsidence. Stoch. Environ. Res. Risk Assess. 2019, 33, 427–449. [Google Scholar] [CrossRef] [Green Version]
- Office for National Statistics. House Price per Square Metre and House Price per Room, England and Wales: 2004 to 2016. 2017. Available online: https://www.ons.gov.uk/releases/housepricepersquaremeterandhousepriceperroomenglandandwales2004to2016 (accessed on 15 April 2019).
- Blong, R. A new damage index. Nat. Hazards 2003, 30, 1–23. [Google Scholar] [CrossRef]
- Walker, W.E.; Haasnoot, M.; Kwakkel, J.H. Adapt or perish: A review of planning approaches for adaptation under deep uncertainty. Sustainability 2013, 5, 955–979. [Google Scholar] [CrossRef] [Green Version]
- González-Garcia, J.; Jessell, M. A 3D geological model for the Ruiz-Tolima Volcanic Massif (Colombia): Assessment of geological uncertainty using a stochastic approach based on Bézier curve design. Tectonophysics 2016, 687, 139–157. [Google Scholar] [CrossRef]
- Phoon, K.K.; Tang, C. Characterisation of geotechnical model uncertainty. Georisk Assess. Manag. Risk Eng. Syst. Geohazards 2019, 13, 101–130. [Google Scholar] [CrossRef]
- Mashhadian, M.; Abedi, S.; Noshadravan, A. Probabilistic multiscale characterization and modeling of organic-rich shale poroelastic properties. Acta Geotech. 2018, 13, 781–800. [Google Scholar] [CrossRef]
- Sun, C.G.; Kim, H.S. GIS-based regional assessment of seismic site effects considering the spatial uncertainty of site-specific geotechnical characteristics in coastal and inland urban areas. Geomat. Nat. Hazards Risk 2017, 8, 1592–1621. [Google Scholar] [CrossRef] [Green Version]
- Phoon, K.K.; Kulhawy, F.H. Evaluation of geotechnical property variability. Can. Geotech. J. 1999, 36, 625–639. [Google Scholar] [CrossRef]
- Zhang, J.; Tang, W.H.; Zhang, L.M.; Huang, H.W. Characterising geotechnical model uncertainty by hybrid Markov Chain Monte Carlo simulation. Comput. Geotech. 2012, 43, 26–36. [Google Scholar] [CrossRef]
- Wang, X.; Lu, K.; Wang, S.; Huang, X.; Kang, L. Spatiotemporal assessment of rainstorm hazard risk in Qinling mountains of China. Hum. Ecol. Risk Assess. Int. J. 2017, 23, 257–275. [Google Scholar] [CrossRef]
- Wang, Y.; Cao, Z.; Au, S.K. Efficient Monte Carlo simulation of parameter sensitivity in probabilistic slope stability analysis. Comput. Geotech. 2010, 37, 1015–1022. [Google Scholar] [CrossRef]
- Cao, Z.J.; Peng, X.; Li, D.Q.; Tang, X.S. Full probabilistic geotechnical design under various design scenarios using direct Monte Carlo simulation and sample reweighting. Eng. Geol. 2019, 248, 207–219. [Google Scholar] [CrossRef]
- Pan, Q.; Dias, D. Probabilistic evaluation of tunnel face stability in spatially random soils using sparse polynomial chaos expansion with global sensitivity analysis. Acta Geotech. 2017, 12, 1415–1429. [Google Scholar] [CrossRef]
- Zhang, L.; Li, D.Q.; Tang, X.S.; Cao, Z.J.; Phoon, K.K. Bayesian model comparison and characterization of bivariate distribution for shear strength parameters of soil. Comput. Geotech. 2018, 95, 110–118. [Google Scholar] [CrossRef]
- Wang, Y.; Cao, Z.; Li, D. Bayesian perspective on geotechnical variability and site characterization. Eng. Geol. 2016, 203, 117–125. [Google Scholar] [CrossRef]
- Schuëller, G.I.; Pradlwarter, H.J.; Koutsourelakis, P.S. A critical appraisal of reliability estimation procedures for high dimensions. Probabilistic Eng. Mech. 2004, 19, 463–474. [Google Scholar]
- Augusti, G.; Ciampoli, M. Performance-based design in risk assessment and reduction. Probabilistic Eng. Mech. 2008, 23, 496–508. [Google Scholar] [CrossRef]
- Rezaei Rad, A.; Banazadeh, M. Probabilistic risk-based performance evaluation of seismically base-isolated steel structures subjected to far-field earthquakes. Buildings 2018, 8, 128. [Google Scholar] [CrossRef] [Green Version]
- Au, S.K.; Beck, J.L. Estimation of small failure probabilities in high dimensions by subset simulation. Probabilistic Eng. Mech. 2001, 16, 263–277. [Google Scholar] [CrossRef] [Green Version]
- Peng, X.; Li, D.Q.; Cao, Z.J.; Gong, W.; Juang, C.H. Reliability-based robust geotechnical design using Monte Carlo simulation. Bull. Eng. Geol. Environ. 2017, 76, 1217–1227. [Google Scholar] [CrossRef]
- Cao, Z.; Wang, Y.; Li, D. Practical reliability analysis of slope stability by advanced Monte Carlo simulations in a spreadsheet. In Probabilistic Approaches for Geotechnical Site Characterization and Slope Stability Analysis; Springer: Berlin/Heidelberg, Germany, 2017; pp. 147–167. [Google Scholar]
- Jin, Y.F.; Yin, Z.Y.; Zhou, W.H.; Horpibulsuk, S. Identifying parameters of advanced soil models using an enhanced transitional Markov chain Monte Carlo method. Acta Geotech. 2019, 14, 1925–1947. [Google Scholar] [CrossRef]
- Benardos, A.G.; Kaliampakos, D.C. A methodology for assessing geotechnical hazards for TBM tunnelling—Illustrated by the Athens Metro, Greece. Int. J. Rock Mech. Min. Sci. 2004, 41, 987–999. [Google Scholar] [CrossRef]
- Eastman, C.; Teicholz, P.; Sacks, R.; Liston, K. A Guide to Building Information Modeling for Owners, Managers, Designers, Engineers and Contractors. In BIM Handbook, 2nd ed.; John Wiley & Sons: Hoboken, NJ, USA, 2011. [Google Scholar]
- Zhang, J.; Wu, C.; Wang, Y.; Ma, Y.; Wu, Y.; Mao, X. The BIM-enabled geotechnical information management of a construction project. Computing 2018, 100, 47–63. [Google Scholar] [CrossRef]
- Fedeski, M.; Gwilliam, J. Urban sustainability in the presence of flood and geological hazards: The development of a GIS-based vulnerability and risk assessment methodology. Landsc. Urban Plan. 2007, 83, 50–61. [Google Scholar] [CrossRef]
- Burland, J.B. Assessment of risk of damage to buildings due to tunnelling and excavation. Invited Special Lecture. In Proceedings of the IS Tokyo ′95, the 1st International Conference on Earthquake Geotechnical Engineering, Tokyo, Japan, 14–16 November 1995. [Google Scholar]
- SUPodium. SUPlugins. 2018. Available online: http://www.SUplugins.com/ifc2skp.php (accessed on 3 June 2018).
- buildingSMART. Industry Foundation Classes Edition 3. 2017. Available online: http://www.buildingsmart.org (accessed on 20 March 2017).
- Trimble Inc. Sketchup Pro 2016. 2016. Available online: https://www.sketchup.com/ (accessed on 3 November 2016).
- Mathworks Inc. Matlab R2016a. 2016. Available online: https://uk.mathworks.com/products/matlab.html (accessed on 12 December 2016).
- 3D Systems. STL File. 2018. Available online: https://uk.3dsystems.com/ (accessed on 5 March 2018).
- Chapman, D.; Providakis, S.; Rogers, C. BIM for the Underground—An enabler of trenchless construction. Undergr. Space 2020, 5, 354–361. [Google Scholar] [CrossRef]
- Graphisoft Inc. Archicad 22. 2018. Available online: http://www.graphisoft.com/archicad/ (accessed on 15 January 2018).
- Google Earth. Birmingham, UK. 2018. Available online: http://www.google.com/earth/index.html (accessed on 18 March 2018).
- Loganathan, N. An Innovative Method for Assessing Tunnelling-Induced Risks to Adjacent Structures; Parsons Brinckerhoff Inc.: New York, NY, USA, 2011. [Google Scholar]
- Waltham, T. Foundations of Engineering Geology, 2nd ed.; Spon Press: London, UK, 2002. [Google Scholar]
- Dindarloo, S.R.; Siami-Irdemoosa, E. Maximum surface settlement based classification of shallow tunnels in soft ground. Tunn. Undergr. Space Technol. 2015, 49, 320–327. [Google Scholar] [CrossRef]
- O’Reilly, M.P.; New, B.M. Settlements above Tunnels in the United Kingdom—Their Magnitude and Prediction. Tunnelling’82; The Institution of Mining and Metallurgy: London, UK, 1982; pp. 55–64. [Google Scholar]
- Xie, X.; Yang, Y.; Ji, M. Analysis of ground surface settlement induced by the construction of a large-diameter shield-driven tunnel in Shanghai, China. Tunn. Undergr. Space Technol. 2016, 51, 120–132. [Google Scholar] [CrossRef]
- CIRIA. Prediction and Effects of Ground Movements Caused by Tunnelling in Soft Ground Beneath Urban Areas; Project Report 30; Construction Industry Research and Information Association (CIRIA): London, UK, 1996. [Google Scholar]
- Boscardin, M.D.; Cording, E.J. Building response to excavation–induced settlement. J. Geotech. Eng. 1989, 115, 1–21. [Google Scholar] [CrossRef]
- Vose, D. Quantitative Risk Analysis: A Guide to Monte Carlo Simulation Modelling; John Wiley & Sons: Hoboken, NJ, USA, 1996. [Google Scholar]
- Hansen, L.P.; Singleton, K.J. Stochastic consumption, risk aversion, and the temporal behavior of asset returns. J. Political Econ. 1983, 91, 249–265. [Google Scholar] [CrossRef]
- Singh, A.K. Technology Support Center Issue: Lognormal Distribution in Environmental Applications; US Environmental Protection Agency, National Exposure Research Laboratory: Cincinnati, OH, USA, 1997. [Google Scholar]
- Makana, L.O.; Hunt, D.V.L.; Jefferson, I.; Rogers, C.D.F. Assessment of the Future Resilience of Sustainable Urban Sub-Surface Environments. Tunn. Undergr. Space Technol. 2016, 55, 21–31. [Google Scholar] [CrossRef]
- Rogers, C.D.F. Engineering Future Liveable, Resilient, Sustainable Cities Using Foresight. Civ. Eng. Proc. Inst. Civ. Eng. 2018, 171, 3–9. [Google Scholar] [CrossRef] [Green Version]
Figure 1.
Flow chart of the proposed methodology building on the (BIM) data integration method from Providakis et al. [3].
Figure 1.
Flow chart of the proposed methodology building on the (BIM) data integration method from Providakis et al. [3].

Figure 2.
Borehole locations were used for the analysis [49]. The tunnel centerline is shown by a red line.
Figure 2.
Borehole locations were used for the analysis [49]. The tunnel centerline is shown by a red line.

Figure 3.
The 3D geological and tunnel models generated using SketchUp [44], using the approach by Providakis et al. [3]. Tunnel alignment is also shown by a dotted red line.

Figure 4.
Positions of the buildings used (with their numbers) [42,48]. The tunnel centerline is marked with a dotted red line.

Figure 5.
Conceptual representation of the Monte Carlo simulations.

Figure 6.
Graphs illustrating the probability of a damage category to occur for building (a) No. 1 and (b) No. 2.
Figure 6.
Graphs illustrating the probability of a damage category to occur for building (a) No. 1 and (b) No. 2.

Figure 7.
Graphs illustrating the probability of a damage category to occur for building (a) No. 3 and (b) No. 4.
Figure 7.
Graphs illustrating the probability of a damage category to occur for building (a) No. 3 and (b) No. 4.

Figure 8.
Graphs illustrating the probability of a damage category to occur for building (a) No. 5 and (b) No. 6.
Figure 8.
Graphs illustrating the probability of a damage category to occur for building (a) No. 5 and (b) No. 6.

Figure 9.
Graphs illustrating the probability of a damage category to occur for building (a) No. 7 and (b) No. 8.
Figure 9.
Graphs illustrating the probability of a damage category to occur for building (a) No. 7 and (b) No. 8.

Figure 10.
Graphs illustrating the probability of a damage category to occur for building (a) No. 9 and (b) No. 10.
Figure 10.
Graphs illustrating the probability of a damage category to occur for building (a) No. 9 and (b) No. 10.

Figure 11.
The variation in repair costs of buildings due to settlement using the probability density functions (PDF), for (a) damage category No. 1 (negligible) and (b) damage category No. 2 (very slight). The red dotted line shows the 95% percentile cost.
Figure 11.
The variation in repair costs of buildings due to settlement using the probability density functions (PDF), for (a) damage category No. 1 (negligible) and (b) damage category No. 2 (very slight). The red dotted line shows the 95% percentile cost.

Figure 12.
The variation in repair costs of buildings due to settlement using the PDF, for (a) damage category No. 3 for the (slight) and (b) damage category No. 4 the (moderate). The red dotted line shows the 95% percentile cost.
Figure 12.
The variation in repair costs of buildings due to settlement using the PDF, for (a) damage category No. 3 for the (slight) and (b) damage category No. 4 the (moderate). The red dotted line shows the 95% percentile cost.

Figure 13.
The variation in repair costs of buildings due to settlement using the PDF, for damage category (No. 5) (severe). The red dotted line shows the 95% percentile cost.
Figure 13.
The variation in repair costs of buildings due to settlement using the PDF, for damage category (No. 5) (severe). The red dotted line shows the 95% percentile cost.

Figure 14.
The example of the PDF curve for the damage category No. 5 (severe) with a gridded area embedded to estimate the settlement economic risk. The red dotted line indicates the cost for the probability of damage, in this case, the 95% percentile (damage category No. 5).
Figure 14.
The example of the PDF curve for the damage category No. 5 (severe) with a gridded area embedded to estimate the settlement economic risk. The red dotted line indicates the cost for the probability of damage, in this case, the 95% percentile (damage category No. 5).

Figure 15.
3D visualizations of the resulting settlement economic risk due to settlements using BIM through (a) wide, (b) close and (c) closer views in SketchUp [44].
Figure 15.
3D visualizations of the resulting settlement economic risk due to settlements using BIM through (a) wide, (b) close and (c) closer views in SketchUp [44].


Table 1.
Mean and standard deviation values of the geotechnical factors investigated. The mean values are typical representative values of the geotechnical factors used for the site investigated, adapted from Waltham [51], Dindarloo and Siami-Irdemoosa [52], O’Reilly and New [53] and Xie et al. [54].
| Factor (X) | Mean (μ) | Standard Deviation (σ) |
|---|---|---|
| Ground loss | 0.175 | 0.04 |
| Soil Poisson’s ratio | 0.25 | 0.03 |
| Soil friction angle | 35 | 4 |
| Risk Category | Maximum Slope of Building | Maximum Settlement of Building (mm) | Description of the Risk |
|---|---|---|---|
| 1 | <1/500 | <10 | Negligible: superficial damage unlikely |
| 2 | 1/500 to 1/200 | 10 to 50 | Slight: possible superficial damage unlikely to have structural significance |
| 3 | 1/200 to 1/50 | 50 to 75 | Moderate: expected superficial damage and possible structural damage to the building, possible damage to relatively rigid pipelines |
| 4 | >1/50 | >75 | High: expected structural damage to buildings and rigid pipelines or possible damage to other pipelines |
| Damage Category No. | Damage Severity | Critical (Limiting) Tensile Strain (%) |
|---|---|---|
| 1 | Negligible | 0–0.05 |
| 2 | Very slight | 0.05–0.075 |
| 3 | Slight | 0.075–0.15 |
| 4 | Moderate | 0.15–0.3 |
| 5 | Severe to very severe | >0.3 |
Table 4.
The mean and standard deviation values of the ratio of Young’s modulus and shear modulus, E/G, used in the present analysis.
Table 4.
The mean and standard deviation values of the ratio of Young’s modulus and shear modulus, E/G, used in the present analysis.
| E/G | 2.7 | 0.03 |
Table 5.
Central damage value (CDV) examples adapted from Blong [16].
Table 5.
Central damage value (CDV) examples adapted from Blong [16].
| Damage | CDV | Range | Geohazard |
|---|---|---|---|
| Light | 0.02 | 0.01–0.05 | Hairline cracks (<0.1 mm) |
| Moderate | 0.10 | 0.05–0.20 | Minor foundation settlement |
| Heavy | 0.40 | 0.20–0.60 | Walls out of perpendicular by several degrees; floors inclined/heaved; open cracks in walls |
| Severe | 0.75 | 0.60–0.90 | Structure grossly distorted; partition walls and brick infill at least partly collapsed; footings lose bearing; service pipes disrupted |
| Collapse | 1.00 | 0.90–1.00 | Partial/total collapse |
Table 6.
Average and 95% percentile damage costs for each damage category adapted from Burland [41], Mair et al. [12], Blong [16], Office for National Statistics [15] and Sundell et al. [14].
| Damage Category (No) | Damage Severity | Critical Tensile Strain (%) | Average Damage Cost Per m2 Floor Area | 95% Percentile Damage Cost Per m2 Floor Area |
|---|---|---|---|---|
| 1 | Negligible | 0–0.05 | 0.02 × 2400 £/m2 = 48 £/m2 | 110 £/m2 |
| 2 | Very slight | 0.05–0.075 | 0.10 × 2400 £/m2 = 240 £/m2 | 900 £/m2 |
| 3 | Slight | 0.075–0.15 | 0.40 × 2400 £/m2 = 960 £/m2 | 3300 £/m2 |
| 4 | Moderate | 0.15–0.3 | 0.75 × 2400 £/m2 = 1800 £/m2 | 5000 £/m2 |
| 5 | Severe to very severe | >0.3 | 1.00 × 2400 £/m2 = 2400 £/m2 | 6600 £/m2 |
Table 7.
Calculated mean and variance for each damage category after Sundell et al. [14].
Table 7.
Calculated mean and variance for each damage category after Sundell et al. [14].
| Damage Category | Mean (μ) | Variance (σ2) | LN (μ, σ2) |
|---|---|---|---|
| 1 | 3.6780 | 0.3863 | LN (3.6780, 0.3863) |
| 2 | 4.5077 | 1.9460 | LN (4.5077, 1.9460) |
| 3 | 6.1957 | 1.3426 | LN (6.1957, 1.3426) |
| 4 | 7.1503 | 0.6904 | LN (7.1503, 0.6904) |
| 5 | 7.4481 | 0.6703 | LN (7.4481, 0.6703) |
Publisher’s Note: MDPI stays neutral with regard to jurisdictional claims in published maps and institutional affiliations. |
© 2020 by the authors. Licensee MDPI, Basel, Switzerland. This article is an open access article distributed under the terms and conditions of the Creative Commons Attribution (CC BY) license (http://creativecommons.org/licenses/by/4.0/).
Share and Cite
MDPI and ACS Style
Providakis, S.; Rogers, C.D.F.; Chapman, D.N. Assessing the Economic Risk of Building Damage due to the Tunneling-Induced Settlement Using Monte Carlo Simulations and BIM. Sustainability 2020, 12, 10034. https://doi.org/10.3390/su122310034
AMA Style
Providakis S, Rogers CDF, Chapman DN. Assessing the Economic Risk of Building Damage due to the Tunneling-Induced Settlement Using Monte Carlo Simulations and BIM. Sustainability. 2020; 12(23):10034. https://doi.org/10.3390/su122310034
Chicago/Turabian StyleProvidakis, Stylianos, Chris D. F. Rogers, and David N. Chapman. 2020. "Assessing the Economic Risk of Building Damage due to the Tunneling-Induced Settlement Using Monte Carlo Simulations and BIM" Sustainability 12, no. 23: 10034. https://doi.org/10.3390/su122310034
Note that from the first issue of 2016, this journal uses article numbers instead of page numbers. See further details here.