Article

Radar Remote Sensing to Supplement Pipeline Surveillance Programs through Measurements of Surface Deformations and Identification of Geohazard Risks

1
School of Mining and Geosciences, Nazarbayev University, Room 6.239, Block 6, 53 KabanbayBatyr Ave, Nur-Sultan 010000, Kazakhstan
2
Institute of Geodesy and Geoinformation Science, Technical University of Berlin, Room H 5123, Main Building, 10623 Berlin, Germany
3
Institute for Cartography, Dresden University of Technology, Westflügel Zimmer W136, 10 Hülsse-Bau, Helmholtzstr, 01069 Dresden, Germany
*
Author to whom correspondence should be addressed.
Remote Sens. 2020, 12(23), 3934; https://doi.org/10.3390/rs12233934
Submission received: 22 October 2020 / Revised: 19 November 2020 / Accepted: 19 November 2020 / Published: 1 December 2020

Abstract

:
This research focused on the quantitative assessment of the surface deformation velocities and rates and their natural and man-made controlling factors as the potential risks along the seismically active 70 km section of buried oil and gas pipeline in Azerbaijan using Persistent Scatterer Interferometric Synthetic Aperture Radar (PS-InSAR) and Small Baseline Subset (SBAS) remote sensing analysis. Both techniques showed that the continuous subsidence was prevailing in the kilometer range of 13–70 of pipelines crossing two seismic faults. The ground uplift deformations were observed in the pipeline kilometer range of 0–13. Although both PS-InSAR and SBAS measurements were highly consistent in deformation patterns and trends along pipelines, they showed differences in the spatial distribution of ground deformation classes and noisiness of produced results. High dispersion of PS-InSAR measurements caused low regression coefficients with SBAS for the entire pipeline kilometer range of 0–70. SBAS showed better performance than PS-InSAR along buried petroleum and gas pipelines in the following aspects: the complete coverage of the measured points, significantly lower dispersion of the results, continuous and realistic measurements and higher accuracy of ground deformation rates against the GPS historical measurements. As a primary factor of ground deformations, the influence of tectonic movements was observed in the wide scale analysis along 70 km long and 10 km wide section of petroleum and gas pipelines; however, the largest subsidence rates were observed in the areas of agricultural activities which accelerate the deformation rates caused by the tectonic processes. The diverse spatial distribution and variation of ground movement processes along pipelines demonstrated that general geological and geotechnical understanding of the study area is not sufficient to find and mitigate all the critical sites of subsidence and uplifts for the pipeline operators. This means that both techniques outlined in this paper provide a significant improvement for ground deformation monitoring or can significantly contribute to the assessment of geohazards and preventative countermeasures along petroleum and gas pipelines.

Graphical Abstract

1. Introduction

Ground movement (subsidence or uplift) of just a few centimeters is a serious risk for petroleum and gas pipelines in the Azerbaijan–Georgia–Turkey region. If it is not detected timely, the stress on the pipe structure may result in a small leak and major rupture with large consequences to the nearby communities and environmental sensitivities. Ground movement is characteristic to the areas with unstable geology and with a high level of anthropogenic impact of subsurface fluid extraction or injection.
The general objective of these studies is to quantitatively assess the ground deformations, their natural and man-made controlling factors as the potential risks along a 70 km long seismically active section of buried Baku–Tbilisi–Ceyhan Oil (BTC), South Caucasus Gas (SCP), Western Route Oil (WREP) and South Caucasus Pipeline Expansion Gas (SCPX) pipelines in Azerbaijan. The first detailed objective of the present studies will be to measure and map ground deformation velocities and rates along buried oil and gas pipelines over the period of 2017–2019 using Persistent Scatterer Interferometric Synthetic Aperture Radar (PS-InSAR) and Small Baseline Subset (SBAS) remote sensing techniques. The second detailed objective will be to compare and validate the produced ground deformation results from two interferometric techniques. This will allow us to evaluate the suitability aspects of these two interferometric techniques for quantitative geotechnical hazard and risk assessment along oil and gas pipelines. The third detailed goal will be to quantitatively and qualitatively cross-correlate and assess the ground deformation measurements against landcover classes, seismic faults, soil types and climate conditions to better understand natural and man-made controlling factors along pipelines.
Surface deformation caused either by natural or man-made processes obviously create operational risks for the pipeline operators in the transportation process of petroleum and gas products. Therefore, regular quantitative and qualitative risk assessment and mitigation of geotechnical risks for the integrity of pipelines is inevitable to ensure their safe operations. Early warning of ground movement—vulnerable areas contribute to efficient use of geotechnical resources for the cost reduction and safety.
Radar satellite monitoring is the globally proven technology for the cost-effective monitoring, quantitative and qualitative risk assessment and detection of surface movements and prediction of geotechnical hazards independent of weather and lightning conditions. The traditional geodetic ground movement monitoring techniques are mainly based on conventional geodetic measurements (tacheometry, leveling, and GPS geodesy) which are highly-precise but limited to discrete points, time consuming, expensive field survey activities and limited historical baseline for continuation of measurements.
Nowadays pipeline operators use radar and optical remote sensing to detect third party interference caused by construction or agricultural activities, illegal hot-taping for product theft and geohazards, such as landslides, subsidence or uplift of seismic faults or mud volcanoes, erosions and eroding river crossings. A number of studies were published focused on the prediction of erosion-vulnerable areas along these pipelines in Azerbaijan. However the quantitative assessment of ground deformation processes (subsidence or uplift) using radar technologies has also been studied for some small terminal and landslide areas of BTC, SCP, WREP and SCPX pipelines to meet commercial purposes making produced results inaccessible for public audience.
There are many studies on the application of InSAR technology for petroleum and gas, mining and also transportation networks [1,2,3,4,5,6,7,8,9]. Many of them demonstrated successful results and proved the reliability of InSAR measurements for different surface deformation monitoring applications [10,11,12,13,14]. There is a limited number of studies on the application of Interferometric Synthetic Aperture Radar (InSAR) which has been successfully deployed to measure surface motions along pipelines [15,16,17,18,19]. Sims et al. [20] clearly emphasized the need for the development of InSAR technologies in developing countries. Sims et al. [20] also indicated following technical challenges and limitations for use of InSAR on pipeline infrastructure in developing countries: lack of sufficient interferometric stack of radar images for entire range of pipelines, landcover types (e.g., croplands, snow, glacier, forest or dense tall vegetation cover) with regular natural or man-made changes and also topographic effects (mountains and shadows) causing temporal decorrelation with measurement gaps and introducing errors when the InSAR technique is used.
To the extent of our knowledge, there are no deep scientific investigations and published papers focused on the use of interferometric technologies for petroleum and gas pipelines in Azerbaijan, Georgia and Turkey, since most of them were performed within the commercial framework for some of the areas of interest without public access to society. The novel aspects of the present studies are based on the enhancement of interferometric measurements from radar images with advanced geospatial interpolation analysis of point clouds for ground deformation velocities and rates to detect of spatial patterns, hotspots and trends of ground movement.
The present studies hold the practical scientific value and advantage for the petroleum and gas industry with the focus on pipeline operators, since the prediction, relevant justified investment and mitigation of risks require the combined quantitative and qualitative assessment of actual ground movements and evaluation of potential consequences. Another practical value is the ability to remotely monitor ground movements, reducing the number of expensive, time-consuming and dangerous field studies [21]. SAR measurements would significantly contribute to the correlation analysis of space monitoring results with the regular inline inspections of the buried pipelines or any other types of insitu geotechnical measurements. It is obvious that in case of above-ground pipelines, applied interferometric technology will provide remote deformation measurements for both ground and pipelines. These studies will support the engineering community to establish the uncertainties and limitations of both PS-InSAR and SBAS ground deformation measurements using medium-resolution Sentinel-1 radar satellite images for the pipeline monitoring applications. Besides, these studies will contribute to the engineering community in the selection of more suitable ground deformation techniques among PS-InSAR, SBAS or insitu geodetic measurements to serve organizational risk management goals prior to the investments for technological changes in pipeline monitoring. However, this research is focused on the buried oil and gas pipelines and it is almost impossible to make any conclusions in terms of the condition of pipelines.

2. Interferometric Data Processing

2.1. Study Area

The corridor of Baku-Tbilisi-Ceyhan oil, South Caucasus gas, Western Route oil and South Caucasus gas pipelines starts at the Sangachal Terminal in Azerbaijan, crosses Georgia and terminatesat the Turkey Ceyhan Marine Terminal (Figure 1a). The BTC pipeline is 1768 km long (443 km in Azerbaijan, 249 km in Georgia and 1076 km in Turkey). SCP pipeline is a 692 km long (443 km in Azerbaijan and 249 km in Georgia), WREP pipeline is 829 km long (455 km in Azerbaijan and 374 km in Georgia) and the SCPX pipeline is 489 km long (424 km in Azerbaijan, 63 km in Georgia and 2 km in Trans-Anatolian Natural Gas Pipeline (TANAP) interconnection). The pipelines pass through areas of active seismic faults in Azerbaijan, Georgia and Turkey [22,23,24,25,26]. BTC, SCP and SCPX pipelines are properly earthquake engineered through the design of trapezoidal trenches to reduce soil resistance either side of the pipe to allow it to move more freely in case of significant ground movements whereas the WREP pipeline is old and was designed based on lower protection principles against ground movements.
The present research focused on the pipeline corridors of Azerbaijan section within 0–70 km range (Figure 1a–c) since this range of pipelines cross most active reverse type of seismic faults at KP25 and KP50. The depth of the buried pipelines varies between 1–2.5 m, whereas at the rivers, roads, rails and seismic faults, it can reach up to 31 m. Ground water level varies in the range of 3–8 m increasing from west to east. The average precipitation along this section of pipeline is 150–250 mm. The precipitation increases from east to west because of the elevation factor along the right of way of pipelines. The average annual air temperature along pipelines is 15 °C. This section of pipeline is characterized by silt loam, silty clay, silty clay loam, clay loam, clay, sandy clay loam with hilly terrain. The spatial distribution of soil types with silt content and hilly terrain prevails in the majority of areas what makes this section of pipelines vulnerable to erosion processes [22]. Soil moisture increased from east to west and is variable in the range of 3–15% since toward west more agricultural activities take place. The pipeline corridor crosses different landcover types, such as agricultural, barelands, grasslands, industrial, residential areas, mud volcanoes and water (Figure 1d).

2.2. Quantitative Assessment of Ground Deformations along Petroleum and Gas Pipelines Using PS-InSAR and SBAS

PS-InSAR is a proven differential interferometric technique which involves processing of multi-temporal Synthetic Aperture Radar (SAR) data to identify persistently scattering ground features and their motion rates with millimeter precision [27,28,29,30,31,32]. The PS-InSAR concept for the measurement of precise surface displacement is based on finding of permanent scatters with phase stability over a long period of time, removal of atmospheric phase contribution, Digital Elevation Model error and system/thermal noise etc. [33]. The advantage of PS-InSAR technique is that it overcomes the problems of geometrical and temporal decorrelation in urban and rocky areas by using a large amount of radar images [33].
The SBAS interferometric technique is based on the generation of interferograms through the processing of small spatial and temporal baseline interferometric pairs in order to reduce decorrelation and topographic effects [34,35]. Although many studies recommended to use PS-InSAR for urban areas and rocks which preserve constant scattering characteristics in the sequence of radar observations [36,37] and to use SBAS for large areas with different landcover types because it maximizes coherence and has noise mitigation capabilities [35,38], we decided to perform both SBAS and PS-InSAR methods for the present studies to understand the differences and practical values for geotechnical, geological and engineering decision making along petroleum and gas pipelines. The pipeline corridor crosses different landcover types, such as agricultural, barelands, grasslands, industrial, residential areas, mud volcanoes and water; therefore, hypothetically both methods could perform differently along pipelines.
High-density and accuracy of InSAR ground deformation measurements acquired over wide areas and long time periods obviously qualify this technique for the risk management of aboveground and buried petroleum and gas pipelines [39]. Therefore, PS-InSAR and SBAS are considered as the cost-effective remote sensing tools which contribute to the prediction and mitigation of geotechnical and geological risks for safe, simplified and optimized operation and maintenance of petroleum and gas assets.
However, it is necessary to emphasize that the applicability and quality of InSAR technology depends on the scale of study area and type of infrastructure, therefore in some specific cases of detailed infrastructure monitoring this technology may not be selected as the optimal to replace the ground-based geodetic measurements [40].
For regular ground deformation risk assessment and maintenance of petroleum and gas assets, it is highly recommended to use highest spatial and temporal resolution radar satellite images (TerraSAR-X, Radarsat-2 or COSMO-SkyMed) to achieve maximum point density with the highest possible horizontal and vertical precision. Unfortunately, the only accessible source of radar images for the present studies were Sentinel 1A and Sentinel 1B which are freely accessible to the research community from the European Space Agency (ESA).
The monitoring and characterization of ground deformation processes along the 70 km section of oil and gas pipelines have been carried out by using a stack of total of 59 Sentinel-1 satellite images using PS-InSAR and SBAS techniques. Sentinel-1 satellite images were acquired in C-band (wavelength 5.55 cm) with a revisiting time of 6 days considering both satellites (Sentinel-1A and Sentinel-1B) and an achievable ground resolution of 5 m × 20 m (range × azimuth) for the Single Look Complex (SLC) product. The radar images cover the period January 2018—December 2019 and have been acquired in descending orbit with VV + VH polarizations, IW beam mode, Path-6 and Absolute Orbit-29828.Sentinel-1 VV polarization bands were used since co-polarized bands provide higher coherency [41]. The relative orbits of acquisitions are six and. Low temporal baseline of Sentinel-1 contributed to the prevention of significant temporal decorrelations in the coherency of pixels [42]. Accuracy and precision of the computed surface displacements are limited by the decorrelation of the SAR signals, the atmospheric delays and the phase-unwrapping error [43]. The following workflow shown in Figure 2 was used for PS-InSAR and SBAS techniques, geospatial interpolations and spatial statistical analysis.
The main processing steps of PS-InSAR consist of interferogram generation, multi-temporal persistent scatterers (PS-InSAR) processing and removal of atmospheric phase screen [44]. The main processing steps of SBAS consist of differential interferogram generation from selected SAR image pairs with a small orbital separation (baseline) to reduce the spatial decorrelation and topographic effects, filtering of atmospheric artifacts based on the availability of both spatial and temporal information and removal of topographic phase contribution [45]. Shuttle Radar Topography Mission (SRTM) [46] with 1 arc-second (~30 m pixel size) DEM from NASA and precise orbits from the European Space Agency (ESA) were used for the coregistration and for topographic phase removal from the interferometric phase [41]. The resolution of the DEM was sufficient for the removal of the topographical component from the interferograms and calculation of the residual topographic error [42].
SBAS- and PS-InSAR-based generated ground deformation monthly rates were quality controlled using time-series high-precision GPS measurements conducted for two known subsiding positions—KP28 + 300 and KP52 + 500—located along the corridor of oil and gas pipelines. Regression analyses were performed to evaluate a correlation between SBAS, PS-InSAR and ground-based continuous measurements with high-precision differential GPS equipment. The ground-based GPS measurements were performed in parallel with the acquisition of satellite images to avoid of temporal decorrelation. The contextual information of seismic faults, mud volcanoes and historical records of earthquakes were also used to understand how PS-InSAR- and SBAS- detected ground deformations are spatially related to the natural tectonic factors. The combined use of SNAP (Sentinel Application Platform) from European Space Agency (ESA) and ArcGIS Pro from Environmental Systems Research Institute (ESRI) allowed us to produce interferometric measurements and further geospatial analytics.

3. Results

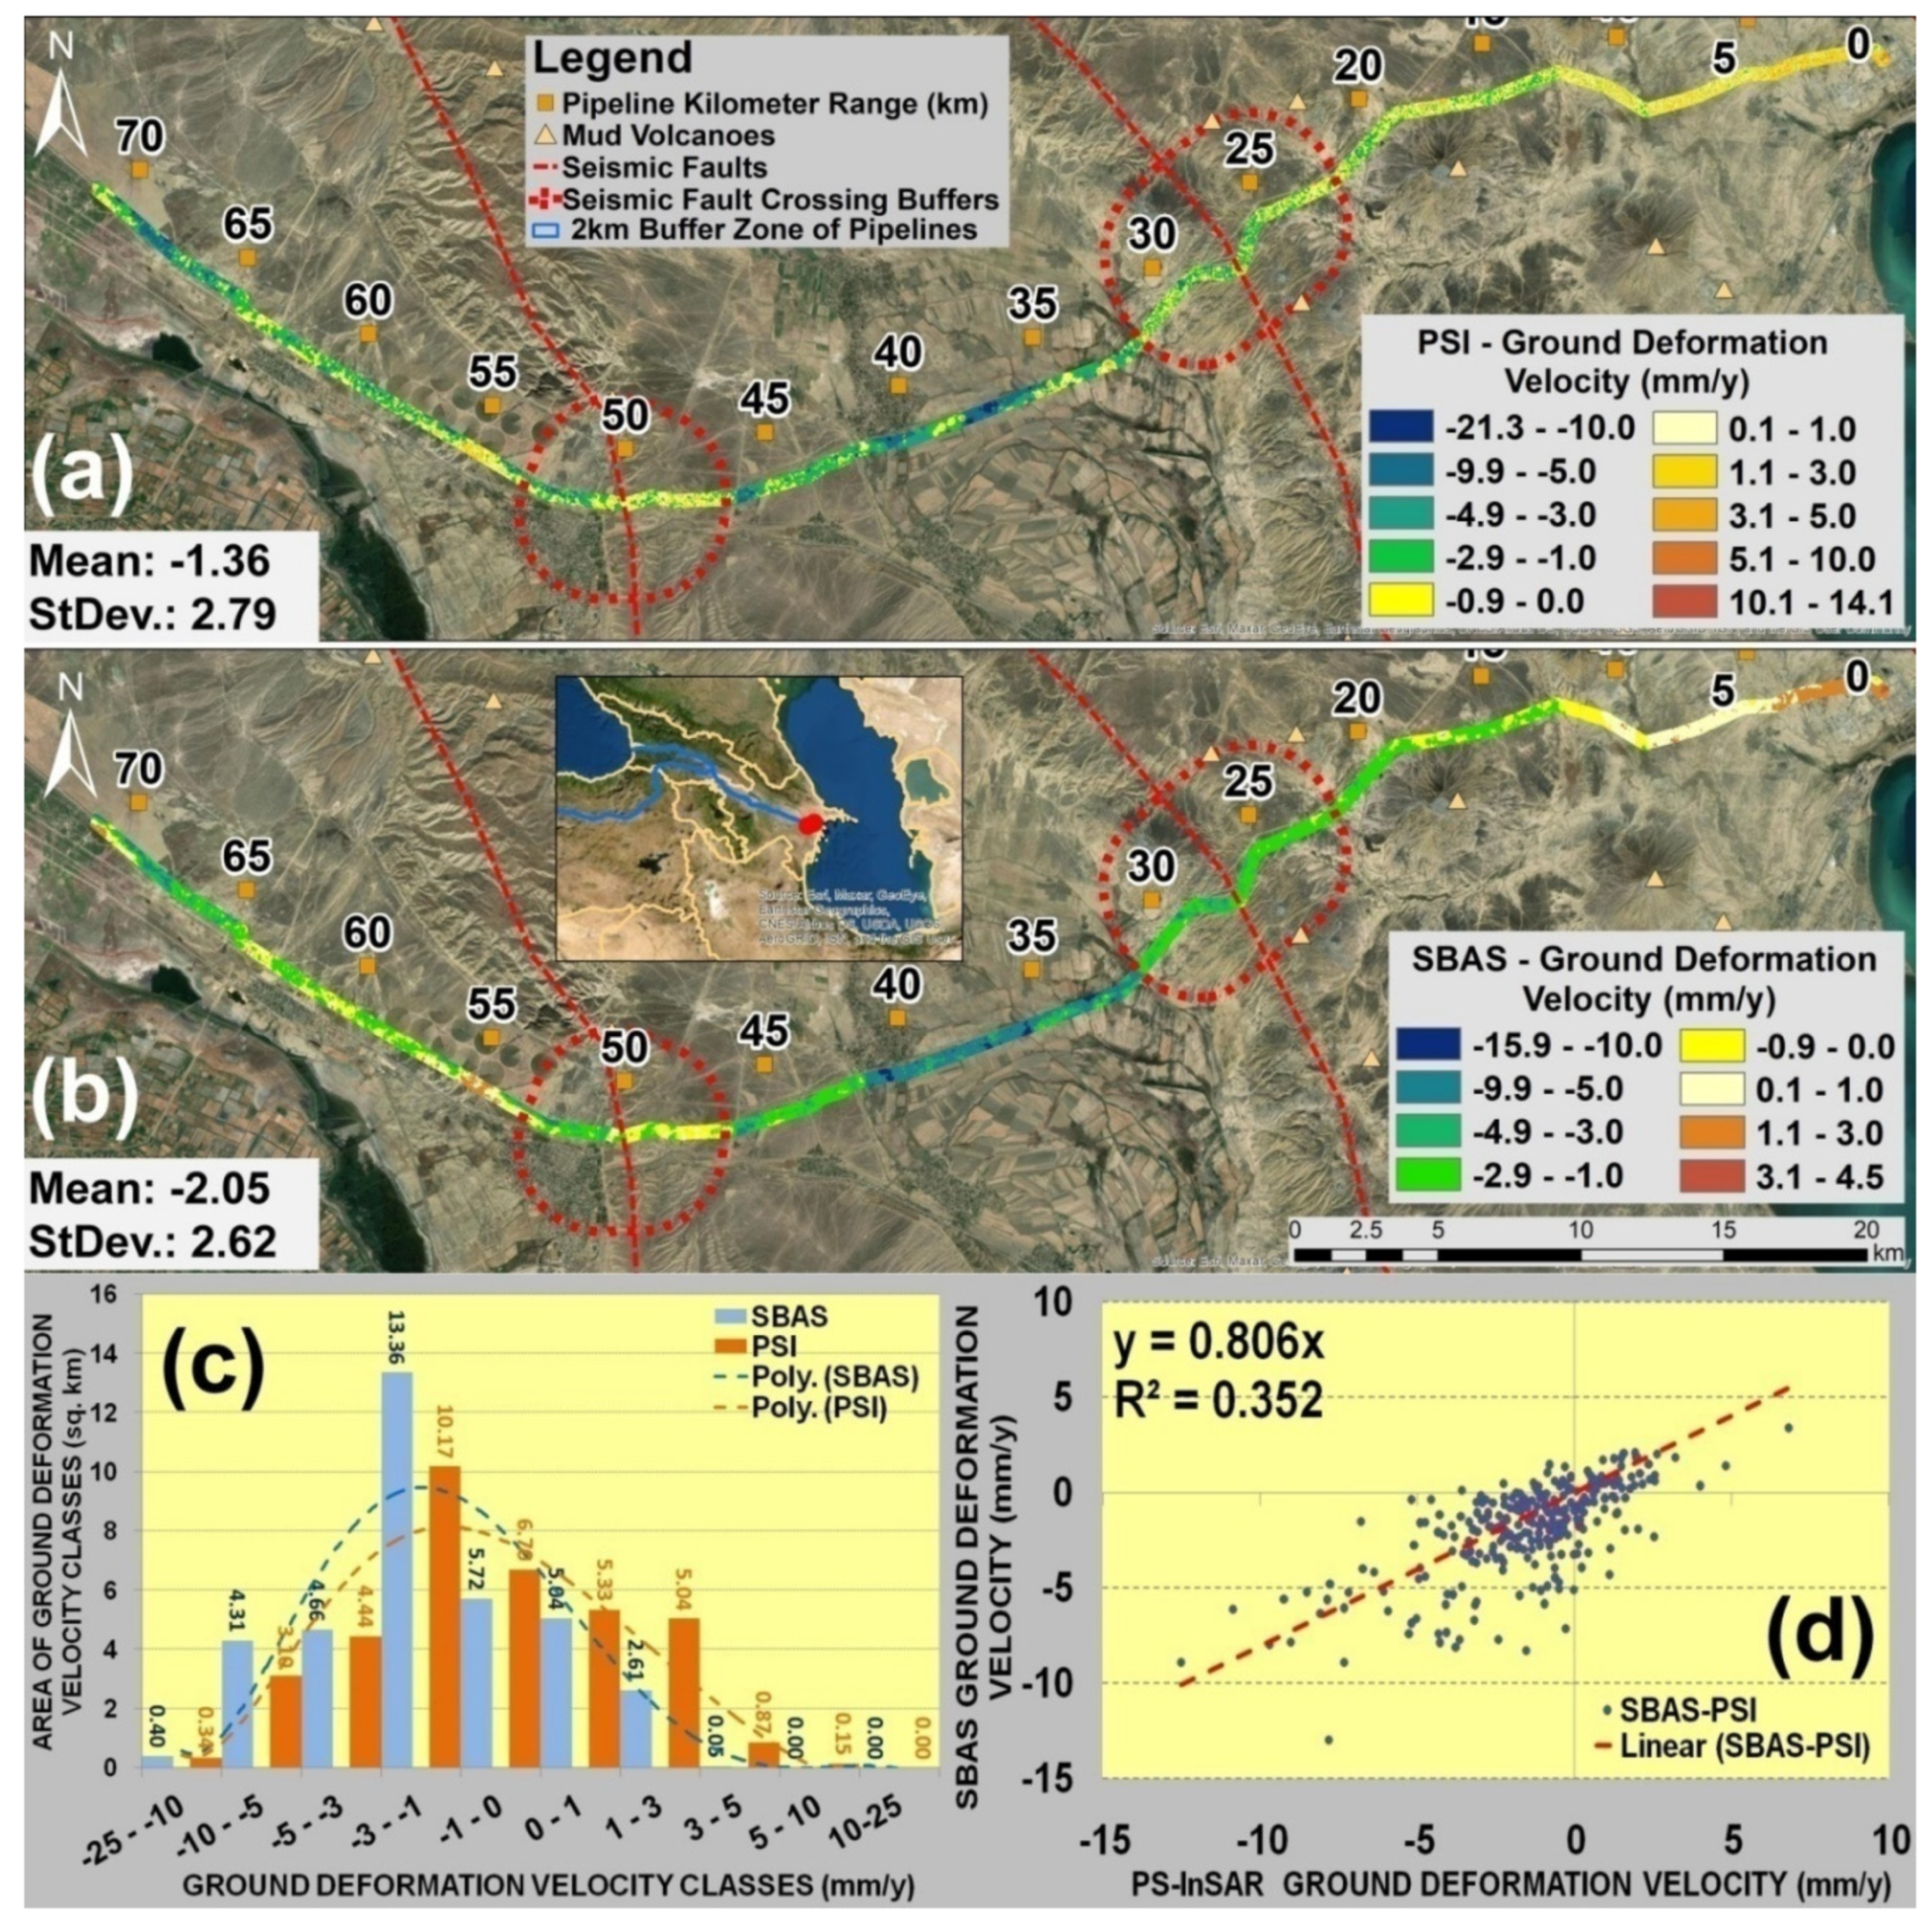
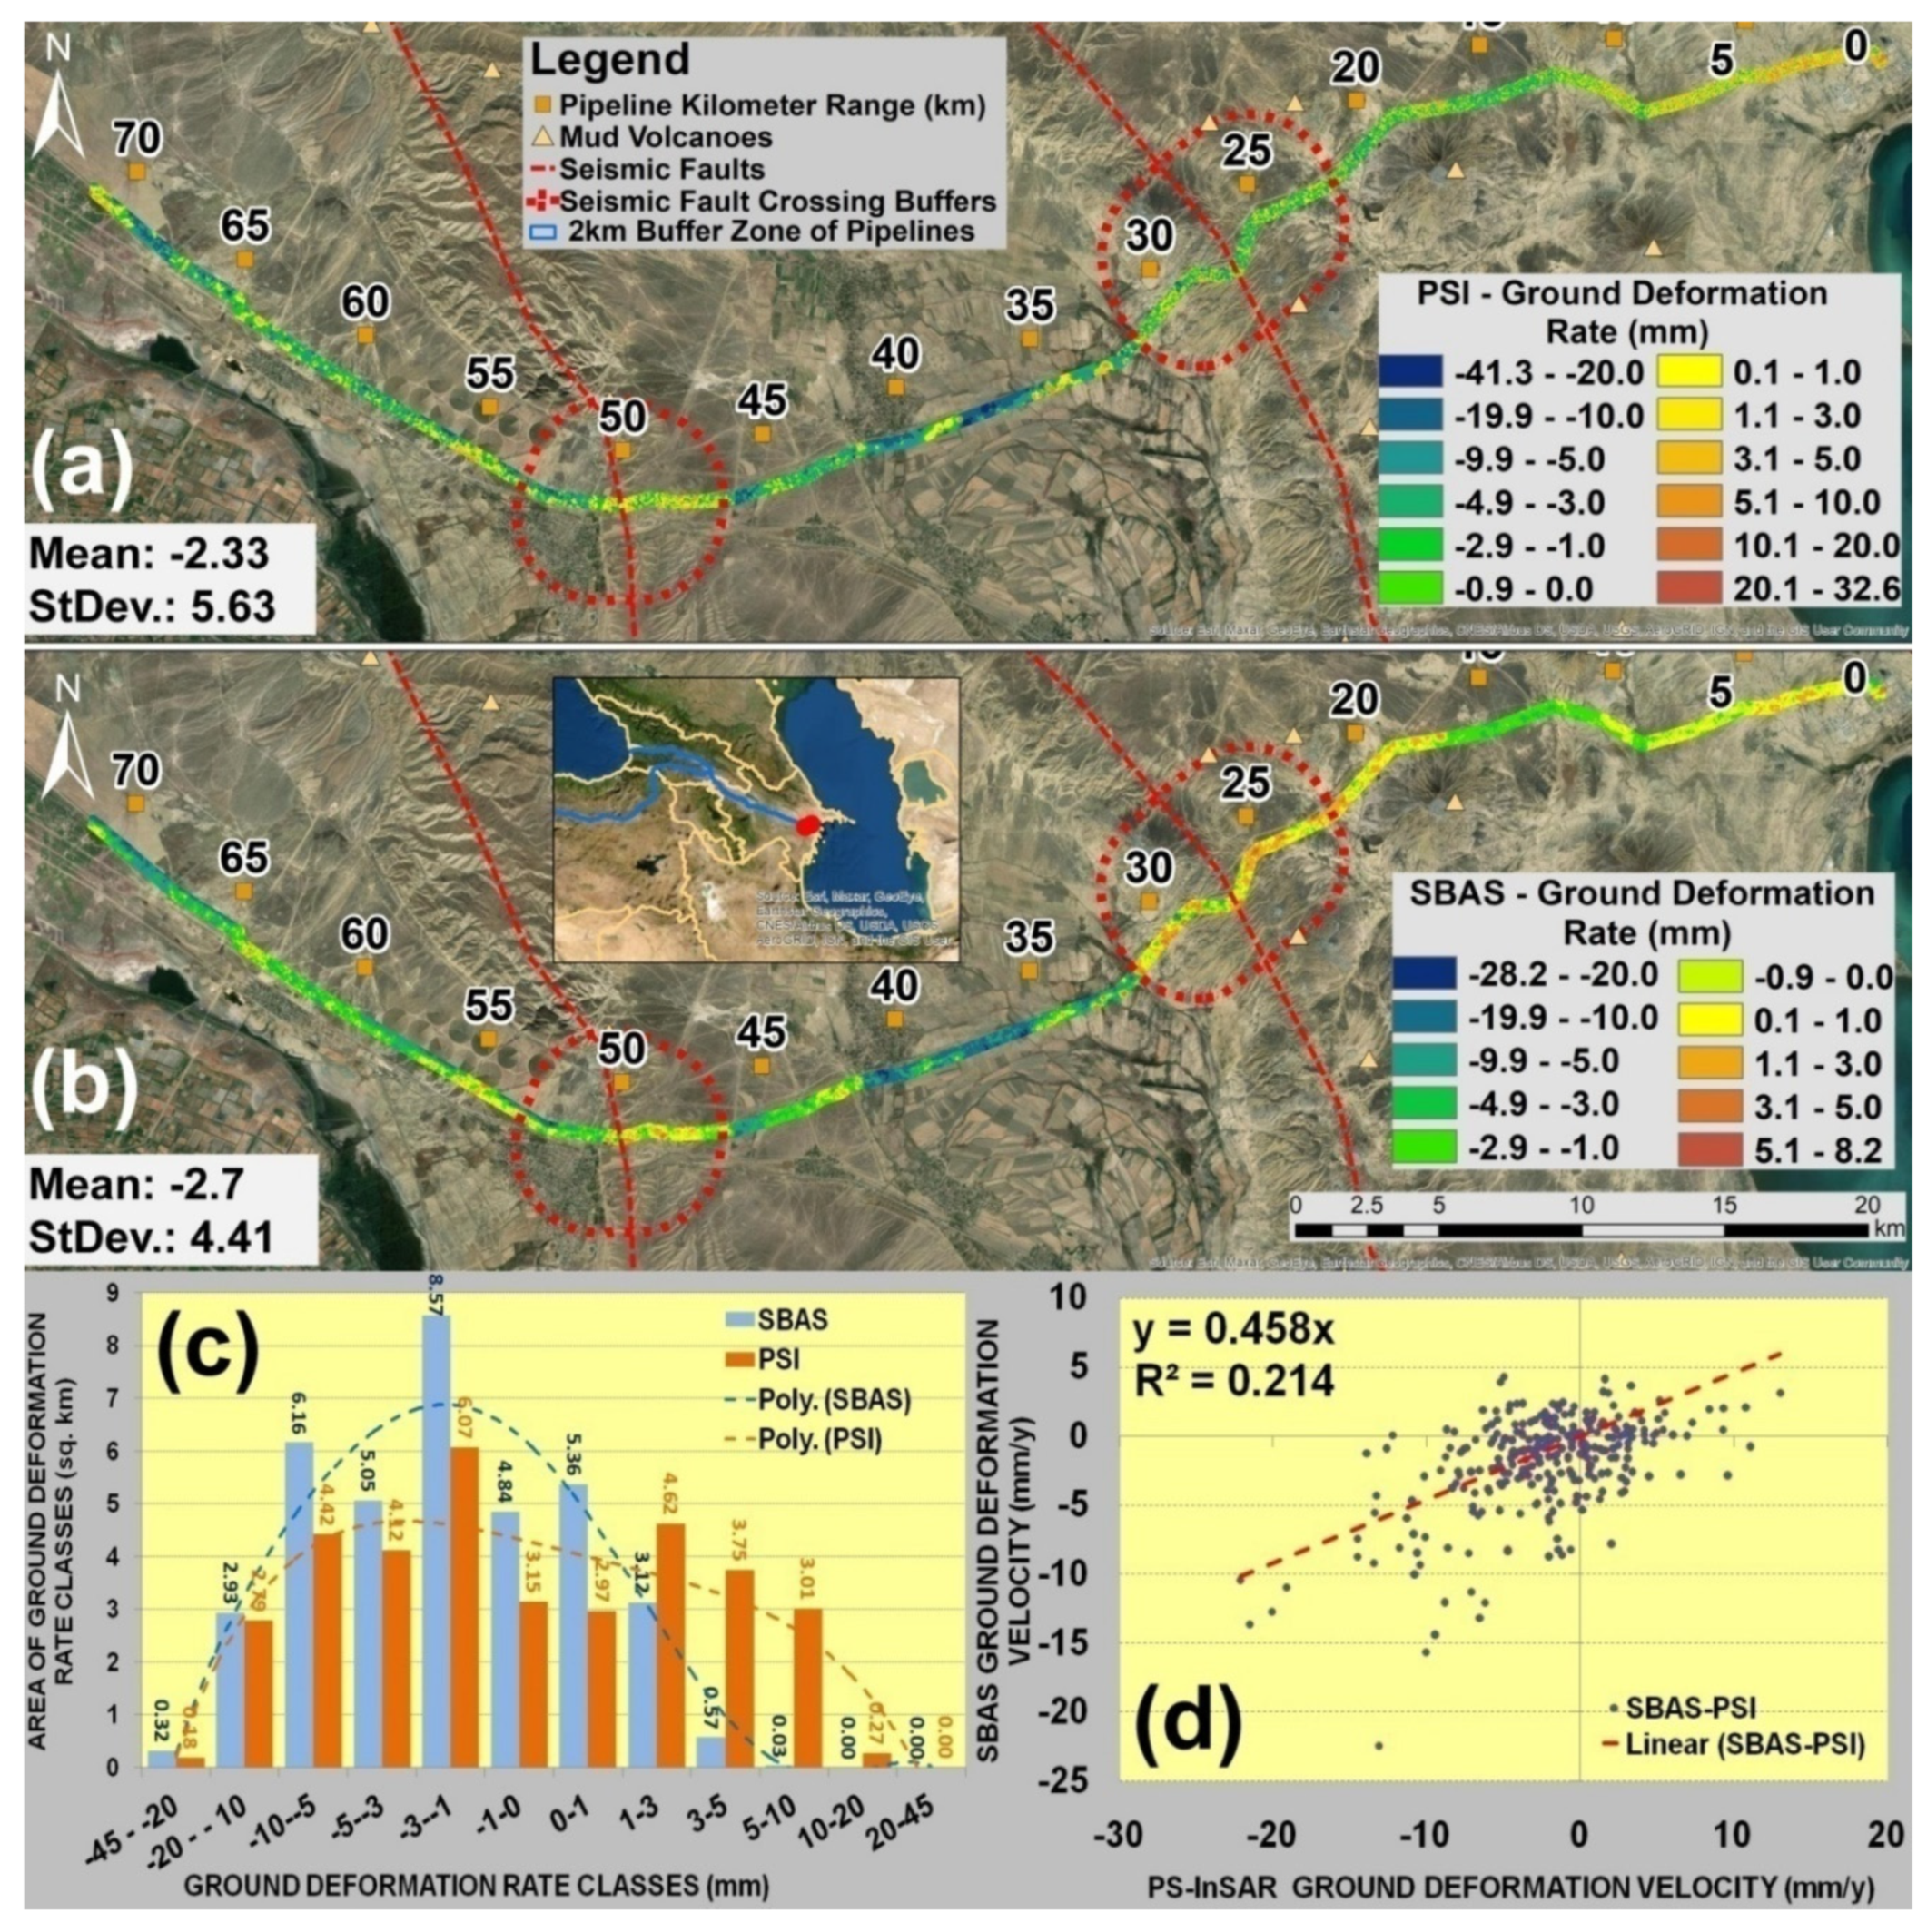
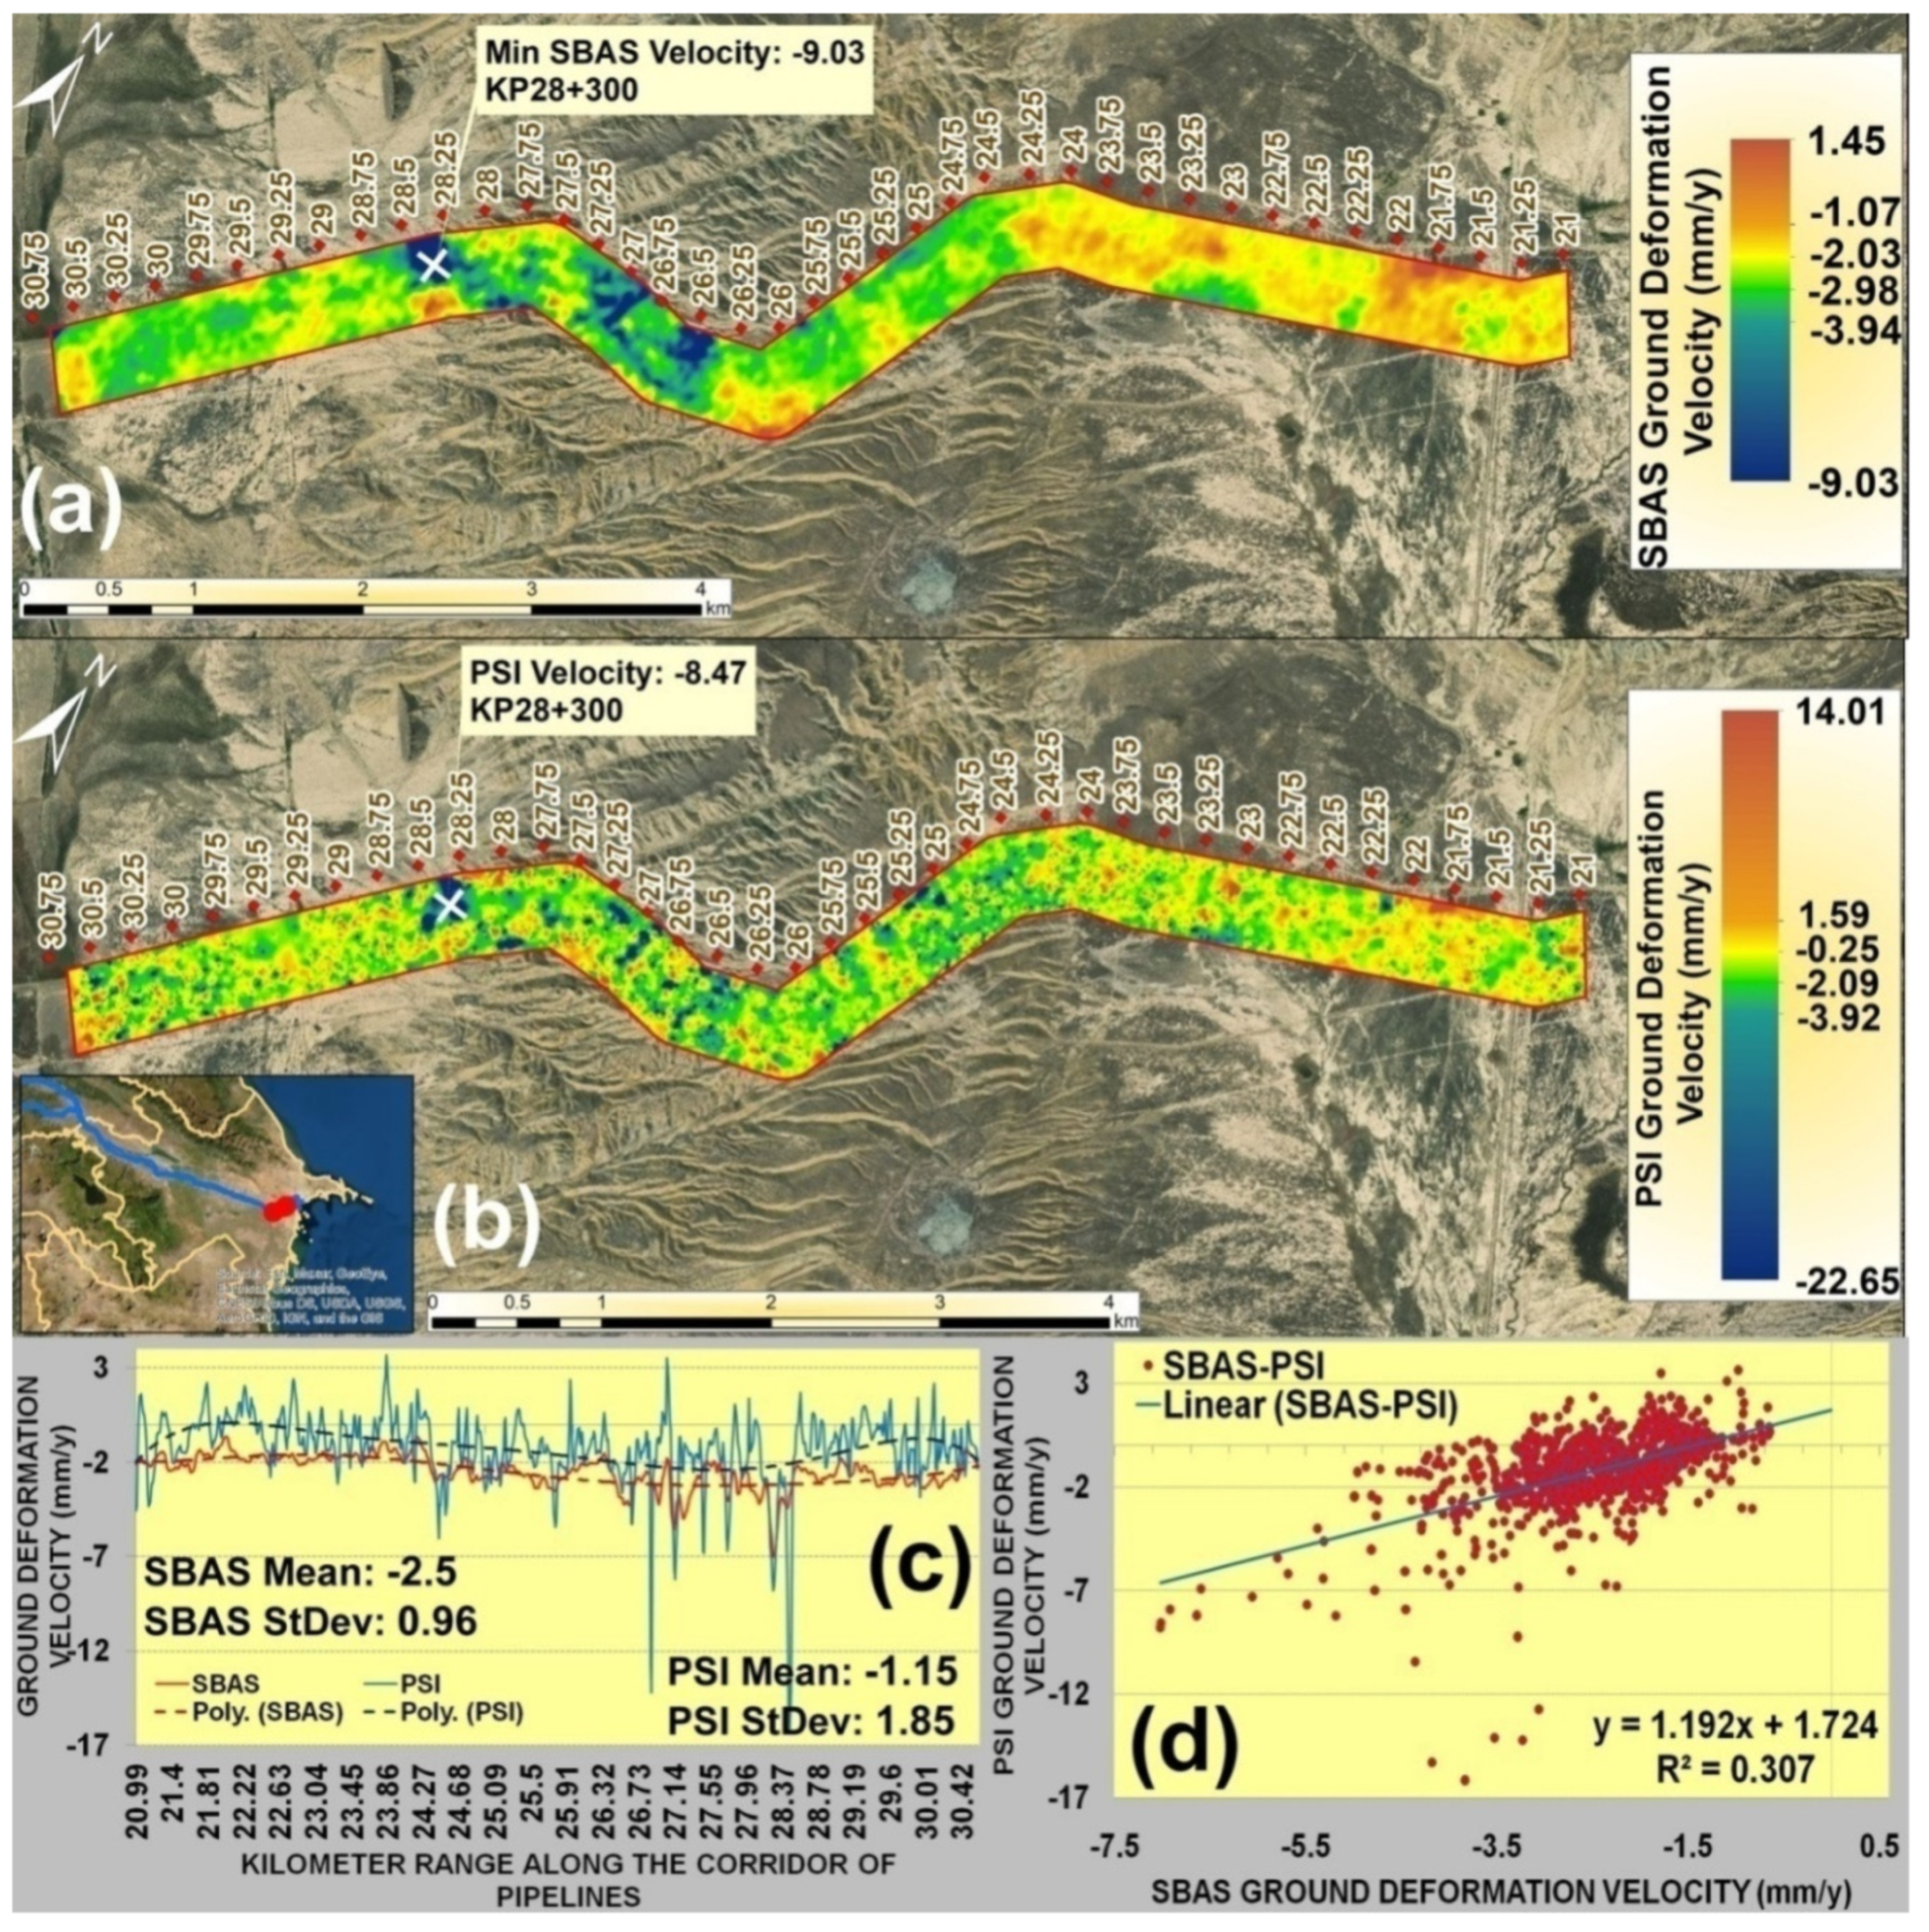
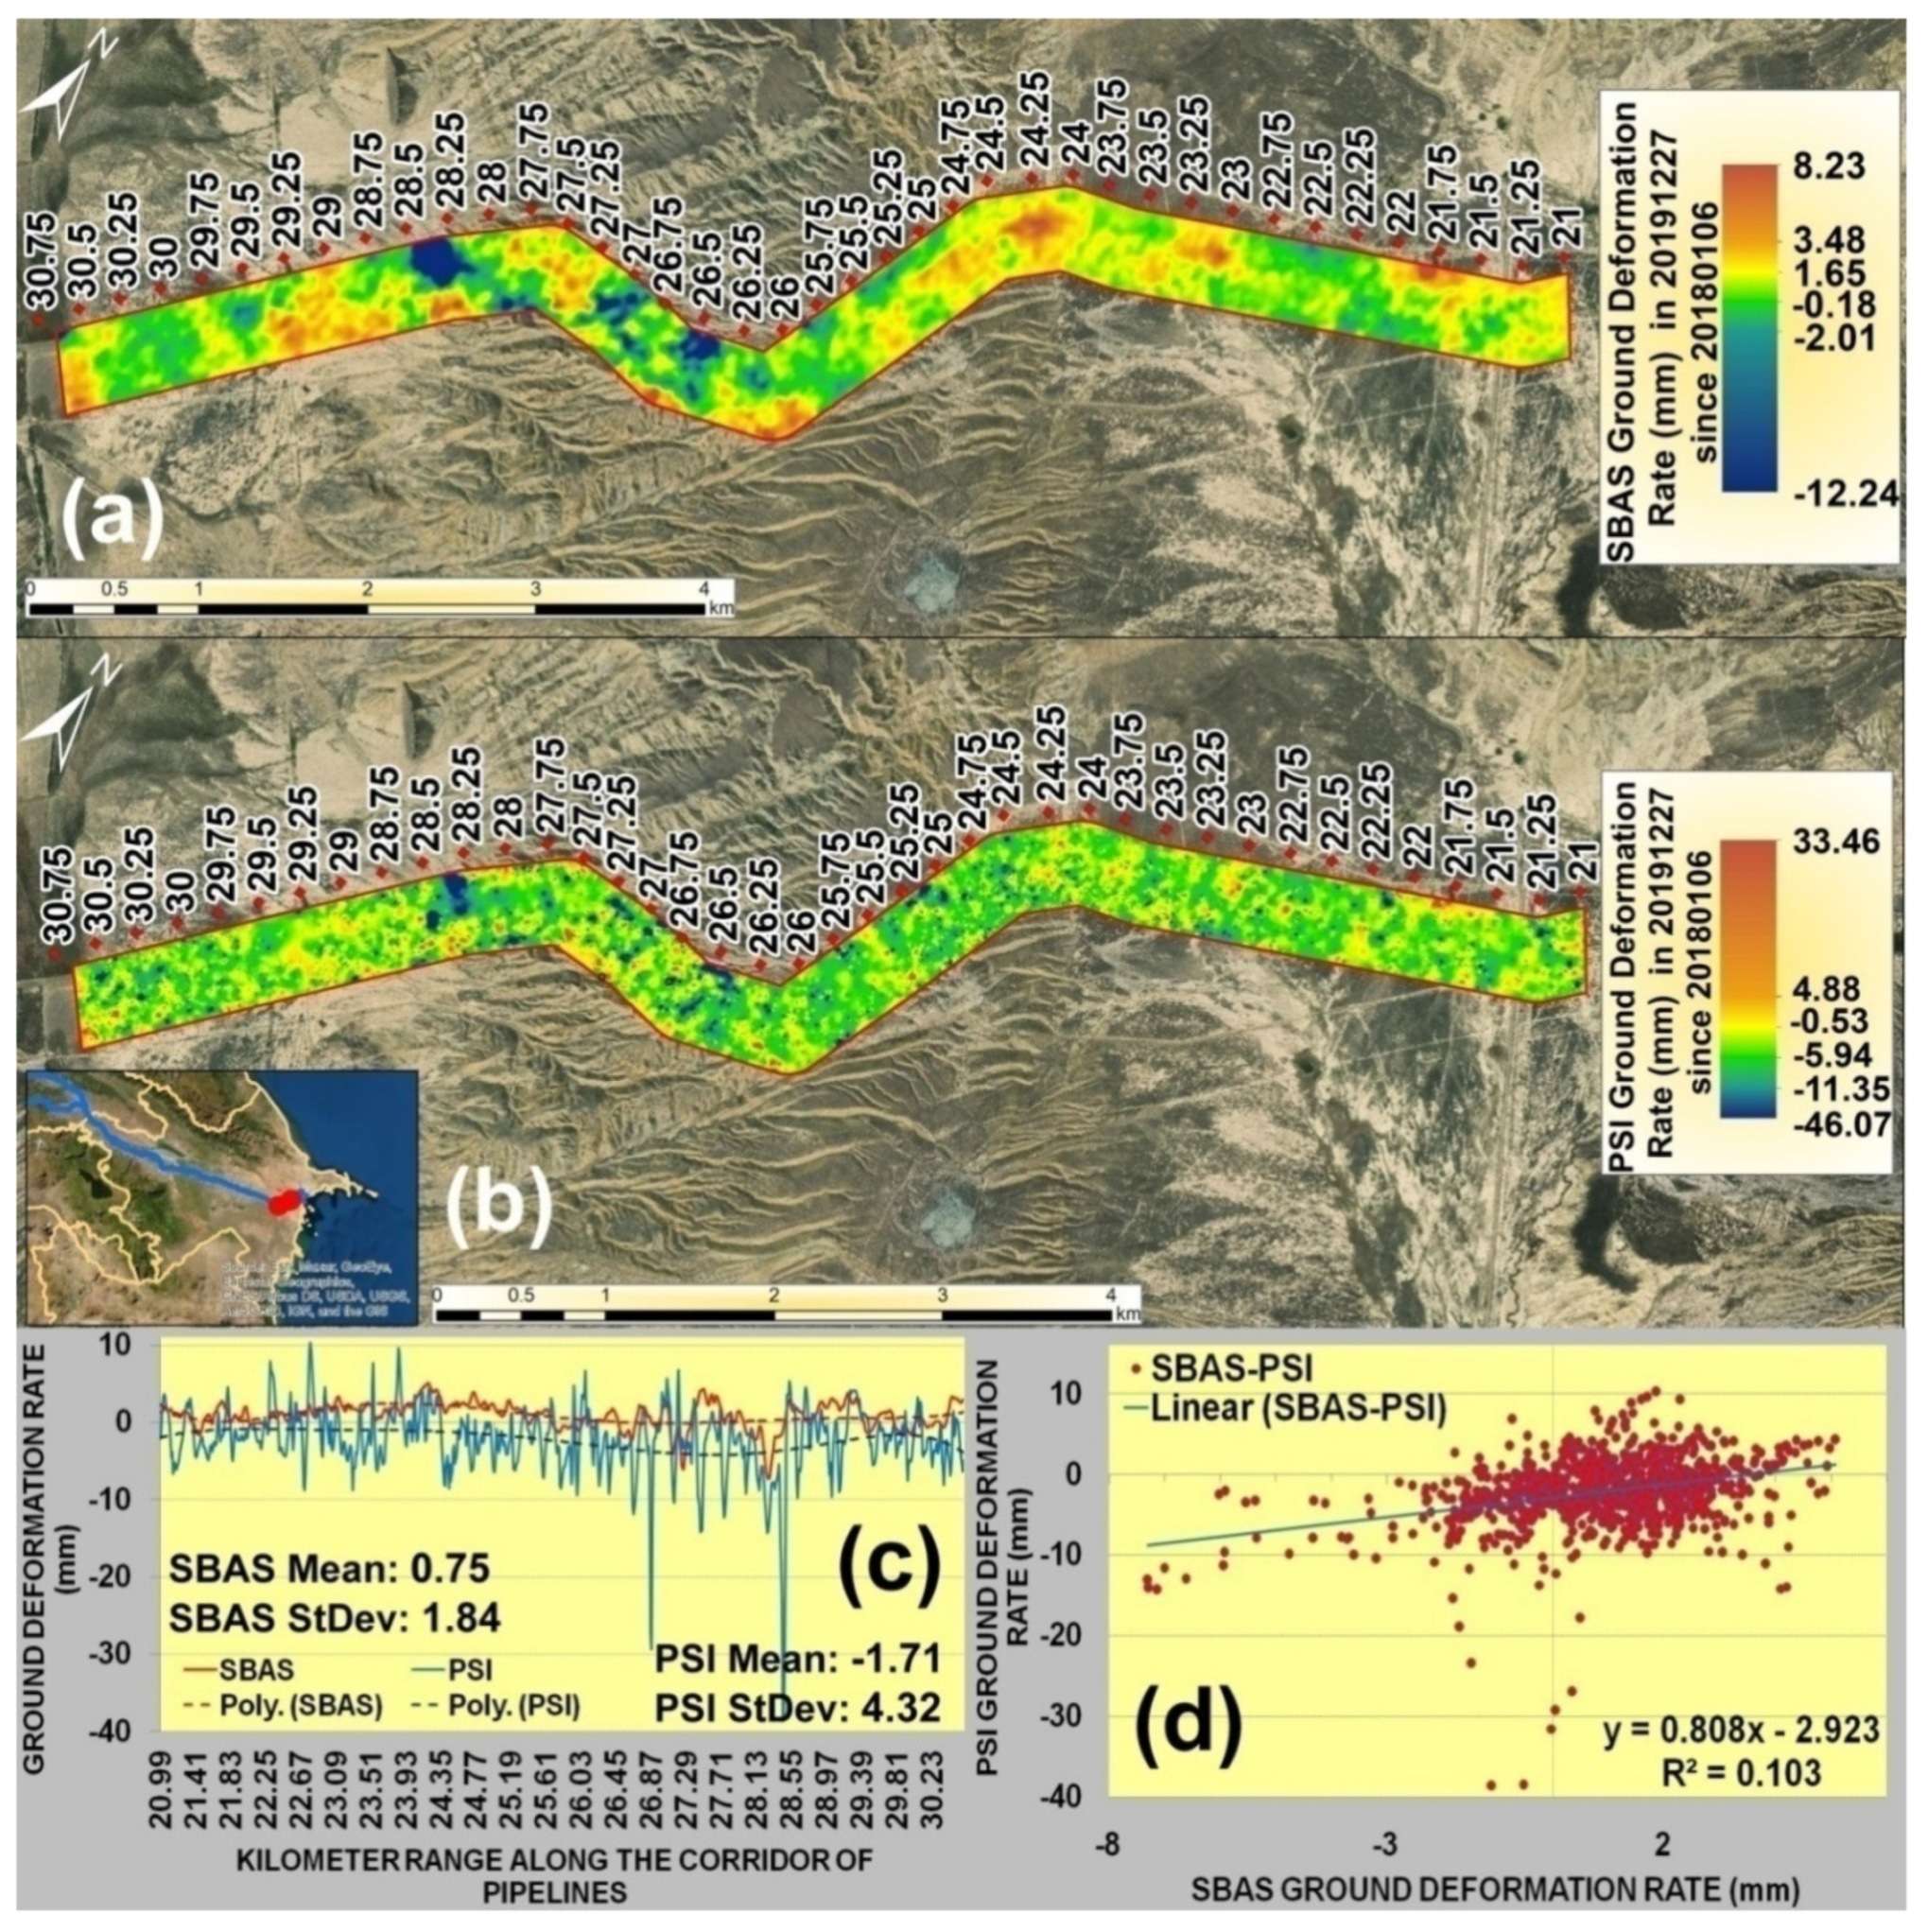
3.1. Ground Deformations Detected from PS-InSAR and SBAS

The connection graphs of SAR images in Figure 3a,b, present that all 59 radar images were well connected in time in order to follow the displacement monitoring over the period of 2018–2019 (Figure 3a–d). Over 3.42 million PS and 5.37 million SBAS points were computed from the processing of the Sentinel-1 radar satellite images for 70 km pipeline range with10 km buffer zone. The density of the measured points by the PS-InSAR is coarser than those by the SBAS, due to the existence of croplands along pipelines. As a result of multi-temporal PS-InSAR and SBAS analyses, two main products were produced: (1) ground deformation velocity, and (2) time-series of displacements for measured points. Ground deformation values were calculated relative to a common reference SAR image acquired on 6 January 2018.
PS-InSAR and SBAS analyses enable the retrieval of the average Line-Of-Sight (LOS) subsidence or uplift rates [47]. For the accurate computation of the vertical velocity from LOS, it is critical to perform the PS-InSAR and SBAS computations from both ascending and descending satellite passes [48]. However, it was not possible for the present research because of non-sufficient computing power and space for PS-InSAR processing. PS-InSAR results in a line-of-sight (LOS) velocity for each coherent point, towards or away from the satellite and if it is simply assumed that all motion is vertical, the vertical velocity was obtained through dividing the LOS displacement rates by the cosine of the radar incidence angle [21,49,50].
As follows from Figure 3e,f and the afore-mentioned limitations of PS-InSAR, a lower number of PSI points was measured for croplands (Figure 1d) because of temporal decorrelation caused by low reflectivity and coherence. However it is possible to state with the confidence that PS-InSAR did not reflect the reality for the south-western part of the model outside of pipeline 2 km buffer zone because these areas most probably under the impact of subsidence rather than uplifts as follows from SBAS measurements (Figure 4a,b).It was critical to perform the IDW interpolations to cover the gaps in the developed grid models of ground deformations for simplified interpretation of movements and further geospatial analysis. However, it was certainly not possible to improve the quality of data for the gaps in the PS-InSAR model. This obviously caused the uncertainty in the research but would not significantly affect the overall statistical accuracy and reliability of results produced for the corridor of pipelines and seismic faults which contained sufficient number of measured PS-InSAR points (Figure 3e,f).
Even though the pipeline buffer that is subject to the risk assessment is variable in the range of 40–500 m, PS-InSAR and SBAS computations for the 10 km buffer zone of pipelines were inevitable to understand the large scale ground deformation patterns of seismic faults along 70 km section of pipelines.
Then, two selected seismic fault areas crossing petroleum and gas pipelines were investigated from a local perspective. PS-InSAR and SBAS computed ground deformation velocity and hotspots of subsidence and uplifts are presented in Figure 4a,b, respectively. Negative displacement values are represented by cool colors (shades of blue color) and positive displacement values (shades of brown color) for the period of observation.
From the Figure 4a,b, it is possible to observe the extended subsidence patterns in the KP13–70 range. The ground uplift deformations were observed in the pipeline range of KP0–13. The prevailing majority of negative values are also reflected in Figure 4c, which represents PS-InSAR and SBAS ground deformation velocity profiles based on 5 km interval stations along pipelines. The negative mean values of both PS-InSAR and SBAS measurements are indicators of the subsiding processes in the study area (Figure 4a–c).
The minimum and maximum ground deformation velocities were observed to be −24.37 and 24.48 mm/y for PS-InSAR and −35.40 and 52.43 mm/y for SBAS measurements, respectively, along the 70 km range of pipelines with a conditional buffer zone of 10 km (Figure 4a,b). The histogram of PS-InSAR and SBAS measurements in Figure 4d show that SBAS contained more negative pixel values than PS-InSAR. This could be related to the limited measurements of PS-InSAR in agricultural lands.
The minimum and maximum ground deformation rates in 27 December 2019 with the Baseline of 6 January 2018 were observed to be −59.72 and 59.26 mm/y for PS-InSAR and −81 and 102.81 mm/y for SBAS measurements, respectively, along the 70 km range of pipelines with a conditional buffer zone of 10 km (Figure 4e,f). As it is possible to observe the PS-InSAR and SBAS maps in Figure 4e,f, mean and standard deviation values of ground deformation rates provided different representation of vulnerable areas to ground movements which is crucial for the pipeline operators to analyze total ground movement over the period of two years for proper decision making. It is obvious that the combined use of ground deformation velocities and rates would significantly benefit the prioritization of critical areas and ground validation activities by pipeline operators.
From Figure 4c, it is possible to observe that the most significantly subsiding areas were observed in the pipeline range of KP30–45 located between two seismic faults and KP65–72. The hotspot and trend surfaces of the ground deformation velocities showed that there is a clear subsidence process occurring between two seismic faults (Figure 5a–d).This can also be observed in the three-dimensional representation of ground deformation velocities in Figure 6a–d. As shown in Figure 5c,d, the lack of measured points of ground deformation velocities by PS-InSAR technique caused the PS-InSAR and SBAS differences in the hotspots and directions of subsidence trends. SBAS showed higher reliability in terms of the coverage of the study area with the measurements of ground deformation velocities and rates.
Local scale analyses were performed along the 0km section of pipelines with a 250 m buffer zone for the detailed quantitative ground movement assessment of the two seismic faults. Even though the SBAS revealed a wider range of minimum and maximum values within the 10 km buffer zone of pipelines (Figure 4c and Figure 7a) compared to PS-InSAR, the minimum and maximum vertical ground deformation velocities were observed to be −21.3 and 14.1 mm/y for PS-InSAR and −15.9 and 4.5 mm/y for SBAS measurements, respectively, along a 70 km range of pipelines with the buffer zone of 250 m (Figure 7b and Figure 8a,b). Although both PS-InSAR and SBAS are highly consistent in deformation patterns and trends along pipelines, they showed differences in the spatial distribution of ground deformation classes (Figure 8c) and noisiness of produced results (Figure 4c). SBAS contained more negative values with the mean of −2.05 mm/y that was lower than in PS-InSAR equal to −1.36 mm/y (Figure 8a–c). SBAS produced less dispersed results than PS-InSAR and this was reflected in the low regression coefficient of 0.35 and higher standard deviation of PS-InSAR equal to 2.79, whereas the standard deviation of SBAS was 2.62 (Figure 4c and Figure 8a–d). The ground deformation rates on 27 December 2019, since 6 January 2018, from PS-InSAR measurementsvariedfrom−41.3 mm to 32.6 mm, while the rates shown by the SBAS results ranged from −28.2 to 8.2 mm along 70 km range of pipelines with the buffer zone of 250 m (Figure 7b and Figure 9a,b). SBAS ground deformation rate measurements contained more negative values than PS-InSAR and this was also reflected in the lower SBAS mean value equal to −2.7 mm than PS-InSAR with the mean value of −2.33 mm (Figure 9a–c). The standard deviation of PS-InSAR was higher than SBAS because PS-InSAR results were more affected by noise (Figure 9a–c). The correlation coefficient between PS-InSAR and SBAS results was relatively low, equal to 0.21, and this is primarily caused by the significantly dispersed PS-InSAR results (Figure 9d).
As it is possible to observe in Figure 8a,b and Figure 9a,b the significant variability of ground deformations was observed along the entire range of oil and gas pipelines with random distribution of uplift and subsidence processes. Therefore, it is obvious that the prediction of the potential subsidence or uplift locations based on the single insitu geotechnical and geological assessment of the natural hazards holds a lot of uncertainties without wide and detailed scale airborne and satellite space observation technologies. The justification of the budget for the geotechnical maintenance activities along long-range oil and gas pipelines requires sophisticated prioritization and planning of the remediation sites and clear quantitative and qualitative risk assessment proving the activeness of these sites and effectiveness of the remediation measures.
The ground deformation velocities within the range of Seismic Fault KP21–31 revealed the minimum and maximum values of −9.03 and 1.45 mm/y for SBAS and −22.65 and 14.01 mm/y for PS-InSAR, respectively (Figure 7c and Figure 10a,b). As it is possible to observe in Figure 10a–c, PS-InSAR produced significantly dispersed results, whereas SBAS produced a more continuous deformation surface. This is also reflected in the higher standard deviation of PS-InSAR ground deformation velocities equal to 1.85, compared to SBAS, and a low correlation coefficient between SBAS and PS-InSAR equal to 0.31 (Figure 10d). The ground deformation rates on 27 December 2019 since 6 January 2018 within the Seismic Fault KP21–31 range revealed the minimum and maximum values of −12.24 and 8.23 mm for SBAS and −46.07 and 33.46 mm/y for PS-InSAR, respectively (Figure 7c and Figure 11a,b). The standard deviation of PS-InSAR ground deformation rates equal to 4.32 was observed to be higher than in SBAS because of the significant dispersion of PS-InSAR results (Figure 11c) and as expected low correlation coefficient equal to 0.10 was observed between SBAS and PS-InSAR results (Figure 11d).Despite the fact that SBAS and PS-InSAR produced identical deformation patterns, the range of ground deformation velocities and rates produced by PS-InSAR was significantly wider in terms of minimum and maximum values (Figure 10a,b and Figure 11a,b). As mentioned before, PS-InSAR produced significantly sparse results, which means that the quality of ground deformation measurements varied depending on the earth surface scattering properties.
The ground deformation velocities within the range of Seismic Fault KP46–54 revealed the minimum and maximum values of −8.31 and 2.05 mm/y for SBAS and −19.14 and 9.41 mm/y for PS-InSAR, respectively (Figure 7c and Figure 12a,b).For the Seismic Fault KP46–54, PS-InSAR also revealed higher standard deviation of ground deformation velocities than SBAS, and a low correlation coefficient equal to 0.17 was observed between SBAS and PS-InSAR ground deformation velocities because of the afore-mentioned negative impact of produced dispersion (Figure 7c and Figure 12c,d).
The ground deformation rates on 27 December 2019, since 6 January 2018, within the range of Seismic Fault KP46–54 revealed the minimum and maximum values of −21.65 and 5.1 mm for SBAS and −46.09 and 22.24 mm for PS-InSAR, respectively (Figure 7c and Figure 13a,b). For the ground deformation rates, PS-InSAR produced higher standard deviation than SBAS and low correlation coefficient between SBAS and PS-InSAR equal to 0.16 (Figure 7c and Figure 13c,d).
Based on the differences in minimal and maximal values of ground deformation velocities and rates, both seismic faults are more vulnerable to subsidence processes rather than uplifts. SBAS and PS-InSAR revealed similar ground deformation patterns, but there were significant variations in the measured values because the PS-InSAR results were significantly dispersed (Figure 4c, Figure 10c, Figure 11c, Figure 12c and Figure 13c). PS-InSAR produced more dispersion in the results and this would obviously complicate the prioritization of vulnerable sites to ground deformation processes by pipeline operators. SBAS produced more continuous surface of ground deformation velocities and rates which provided high probability, reliability and confidence of occurring subsidence and uplift patterns and trends along petroleum and gas pipelines. However, this was not sufficient enough to judge the quality of the SBAS and PS-InSAR measurements, but we can state with confidence that the detected patterns of ground deformation velocities and rates once again proved the existence of uncertainties and complexities of insitu based visual inspections and geodetic measurements applied often by pipeline operators for the assessment, early warning and mitigation of pipeline risks.
The time series of cumulative ground displacement rates between SBAS and PS-InSAR were compared for the most subsiding positions of the Seismic Faults at KP21–31 and KP46–54 ranges with existing historical GPS measurements for the validation purposes. PS-InSAR, SBAS and GPS measurements at KP28 + 300 and KP52 + 500 showed identical cumulative ground deformation trends (Figure 10a,b, Figure 12a,b and Figure 14a,b). However, PS-InSAR measurements were more dispersed than SBAS, and this was reflected in the higher similarity of trend lines of SBAS and GPS measurements (Figure 14a,b). In quantitative terms, the regression analysis and RMSE evaluations between SBAS and PS-InSAR measurements revealed the correlation coefficient equal to 0.79 and RMSE equal to 4.9 mm for KP28 + 300 and the correlation coefficient equal to 0.92 and RMSE equal to 6 mm for KP52 + 500 (Figure 14c,d).This allows us to assume that SBAS and PS-InSAR measurements are subject to approximate variations in the range of 4.9–6 mm, which should be considered as a limitation by pipeline operators in terms of the existing compliance standards for acceptance.
As mentioned before, PS-InSAR and SBAS measurements were validated using the time-series of high-precision GPS measurements with long-term observations on the ground for two known subsiding points at KP28 + 300 and KP52 + 750 (Figure 10a,b and Figure 12a,b). The validation of SBAS ground deformation rates using high-precision GPS measurements revealed the encouraging level of agreement with the regression coefficient equal to 0.94 and RMSE equal to 1.51 mm for KP28 + 300 and the regression coefficient equal to 0.9 and RMSE equal to 2.51 mm for KP52 + 500 (Figure 15a,b). The validation of PS-InSAR ground deformation rates using high-precision GPS measurements revealed the lower level of agreement with the regression coefficient equal to 0.74 and RMSE equal to 4.45 mm for KP28 + 300 and the regression coefficient equal to 0.89 and RMSE equal to 4.7 mm for KP52 + 500 (Figure 15c,d).
Although the GPS measurements showed minor variations in comparison to SBAS and larger with PS-InSAR, the achieved accuracy allows us to state without any doubt that the deformation trends clearly confirm the presence of subsidence processes at the seismic faults. According to Grebby et al. [37], the residual discrepancy between the three datasets is related to the comparison between point-based and areal measurements, LOS cosine corrections, and other variations in the field operating conditions and applied filtering techniques of produced dispersions.

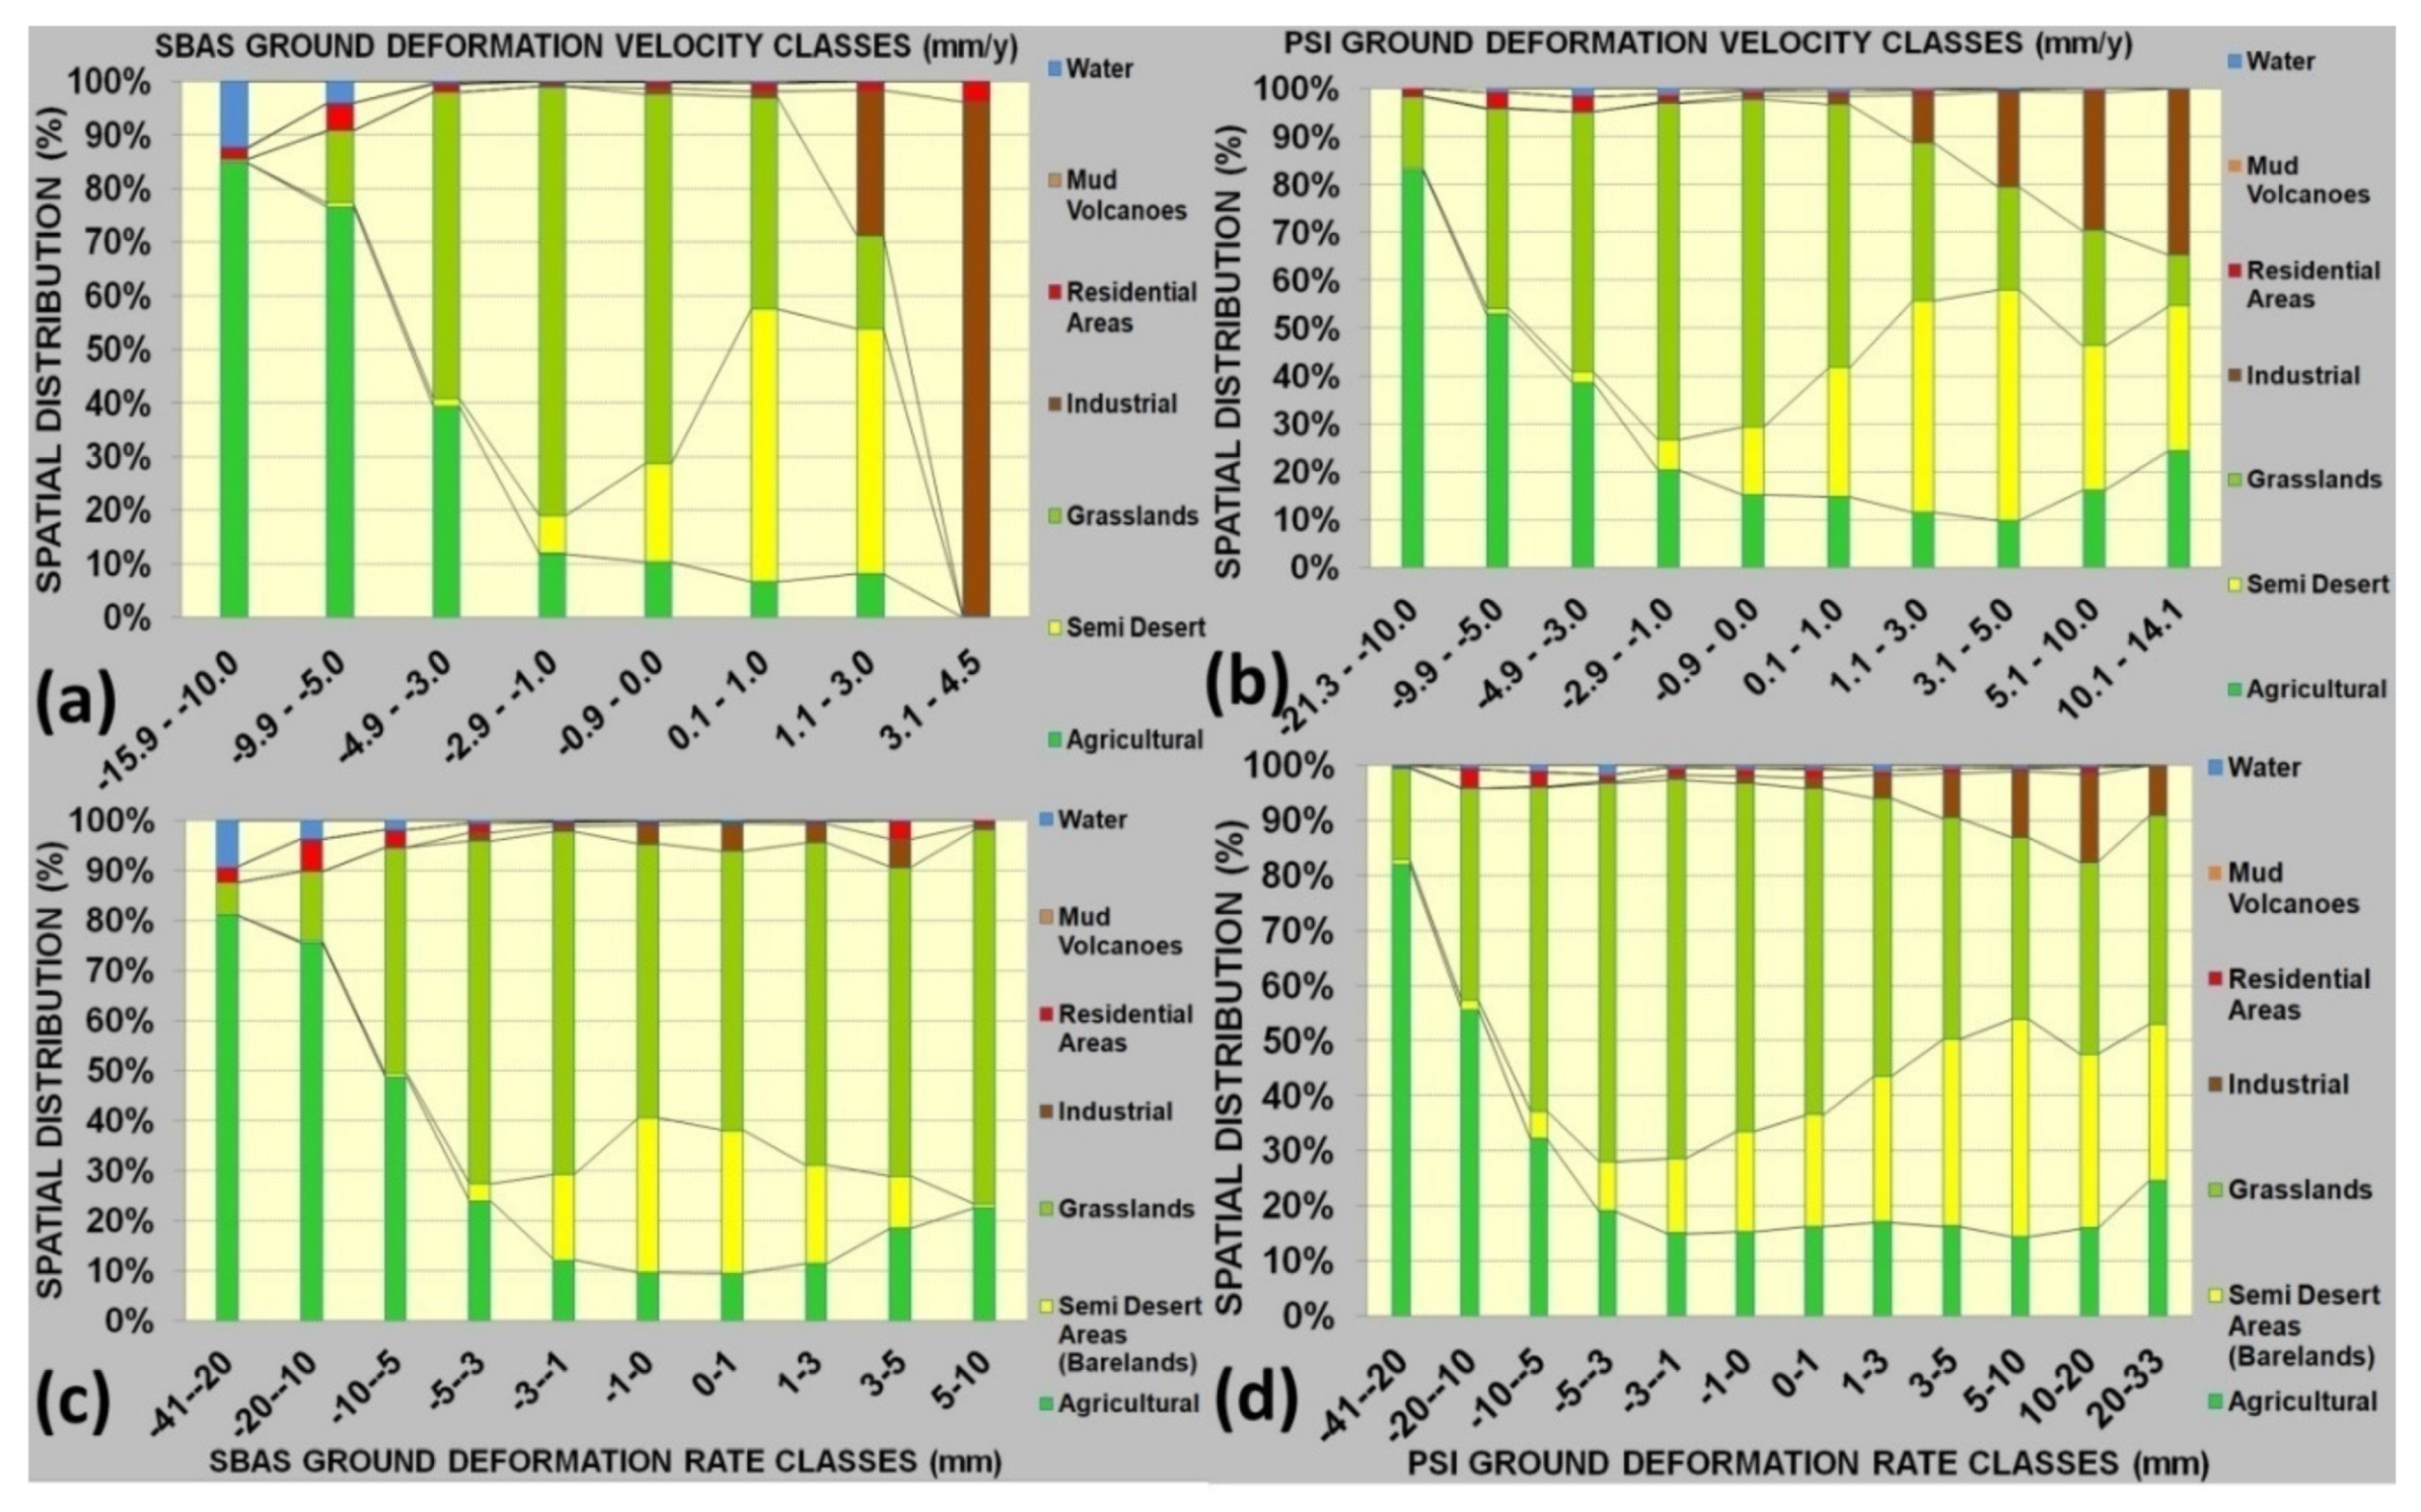
3.2. Quantification of Ground Deformation Velocity within the Landcover Classes

The landcover was developed using the Sentinel-2 MSI sensor satellite images acquired for the low-cloudiness time period of July–August 2019. The object-based classification approach was used for the classification of the following landcover classes: agricultural, semi-desert areas (barelands), grasslands, industrial, residential areas, mud volcanoes and water. The landcover was developed using the Object Based Image Analysis (OBIA) approach (Figure 1d), and reclassified SBAS and PS-InSAR ground deformation velocities allowed us to quantify the ground deformation velocities within the landcover classes for the analysis of the spatial distribution (Figure 16a,b). In Figure 8a,b, it is possible to observe that the most subsiding KP30–45 and KP60–72 pipeline ranges cross the agricultural lands, whereas the uplifting KP0–13 pipeline range crosses the semi-desert barelands with a number of mud volcanoes. The spatial trends of ground subsidence and uplifts allow us to conclude that there is obviously a primary controlling factor of natural tectonic impacts. As follows from Figure 1a–c, this natural tectonic factor is also reflected in the majority of earthquakes and mud volcanoes located along the seismic faults. Nevertheless, the subsidence hotspots (KP30–45 and KP60–72) are crossed by croplands and this allows us to assume that agricultural activities, such asthe overuse of groundwater, irrigation and ploughing, etc., are also secondary controlling factors of subsidence processes along petroleum and gas pipelines. This is also reflected in Figure 16a–d, where the largest spatial distribution of subsidence velocity class was prevailing within the agricultural landcover class along oil and gas pipelines with the 10km and 250 m buffer zones, respectively.

4. Discussions

These studies demonstrated the practical values for the measurements of ground deformation velocity and rates using SBAS and PS-InSAR measurements along the corridor of buried oil and gas pipelines. The results show that the surface deformation obtained by the SBAS and PS-InSAR measurements is highly consistent in magnitude and trend [38]. The outcomes of this research suggest that the SBAS and PS-InSAR techniques can have a high potential for the optimized and simplified monitoring and risk management of ground deformations along pipelines, but the use of only this technique for the assessment of ground movement risks to petroleum and gas infrastructure needs to be carefully evaluated [51]. It is well known that the PS-InSAR technique is assigned for the deformation monitoring of natural or man-made objects with a stable signal phase and high coherence over a stack of SAR images [38]. This allows us to use PS-InSAR for monitoring of above-ground pipelines, infrastructure-like pipeline terminals and pump stations, exposed rocks and other types of solid surface with a precision of a couple of millimeters per year [52]. Therefore PS-InSAR produced more dispersion in the present studies because of the variable scattering surface properties along the 70 km section of buried pipelines. However, PS-InSAR measurements allowed us to determine the ground deformation patterns and trends along the pipelines. PS-InSAR would be more effective for the present studies if it was used for the pipeline terminals and pump stations and any other types of the facilities. For the buried linear oil and gas assets, it is highly recommended to install corner reflectors as the permanent scatterers in the prioritized vulnerable areas along the corridor of pipelines and regularly monitor them. This would significantly reduce the uncertainties for the pipeline operators in the decision making for the mitigation of ground deformation risks. SBAS performed better in terms of the complete coverage of the measured point cloud, significantly lower dispersion of the results, more continuous and realistic presentation of the measurements and higher accuracy of ground deformation rates against the GPS historical measurements. However, it is probable to expect that SBAS would not be as precise and effective as PS-InSAR for the above-ground pipelines, pipeline terminals and pump stations.
Since the BTC, SCP, SCPX and WREP pipelines are buried, for the present studies it was obviously impossible to judge about the conditions of the pipelines in terms of any kind of deformations but it was only feasible to analyze the status of ground movements. Even if the SBAS and PS-InSAR techniques could be used as the predictors for the prioritization of potential risky sites, there are still operational uncertainties to fully replace insitu measurements based on the visual inspections and geodetic measurements. The justification of remediation costs requires detailed geotechnical and engineering assessments on the ground with the consideration of geodetic measurements, readings from piezometers, inclinometers, pipeline in-line inspections like different types of piggings, direct current voltage gradient (dcvg) and close interval potential surveys, depth of pipelines, existing trapezoidal trench standards, etc. to understand how seriously pipelines are affected. If there are no specific changes in the shape of pipelines and other conditions, then this will raise a number of questions in terms of probability of failure and consequences for the evaluation prior to the investments. It is also necessary to emphasize the availability of historical recordings of actual pipeline incidents caused by the ground deformation processes for the increase in the confidence level prior to the investment.
However, very often for the sites of interest, there are no historical records from geodetic measurements to set-up a baseline for the continuous monitoring, and in this case, time-series of space satellite observations are irreplaceable. It is also necessary to emphasize that single point measurements using ground-based geodetic techniques are not sufficient to analyze broader spatial patterns of ground movements.
Even though there are many studies focused on the SBAS and PS-InSAR techniques, the present research demonstrated the coupling of SBAS and PS-InSAR with the geospatial machine learning—based clustering, interpolation and concentration analysis which contributed to the development and understanding of broader picture of the ground deformation processes along petroleum and gas pipelines. The majority of SBAS and PS-InSAR studies primarily analyzed and summarized results using generated point clouds of ground movement velocities and rates but, as presented in this research, the running of advanced spatial interpolation and concentration statistics would significantly contribute to more comprehensive research results.
Both SBAS and PS-InSAR studies showed the prevailing and continuous subsidence patterns in the KP13–70 range of pipelines, crossing two active seismic faults. The ground uplift deformations were observed in the pipeline range of KP0-KP13. The spatial distribution of vulnerable areas to ground deformation processes was diverse and random all along the 70 km of pipelines, which means that it would be complicated to find all of these locations using purely ground-based expeditions and visual inspections.
Even though SBAS demonstrated more suitable results than PS-InSAR for the detection of ground deformation processes along petroleum and gas pipelines, it is highly recommended to advance these studies with the integration of other geological, geotechnical, seismic, thermal and climatic information to better understand controlling natural and man-made factors. Besides, it is crucial to also use other techniques, such as Intermittent SBAS and SqueeSAR and cross-validate the results [49,53,54,55]. Besides, it is also crucial to apply high-resolution SAR images, such as TerraSAR-X, Radarsat-2 and COSMO-SkyMed, to understand how much this would enhance the accuracy and reliability of the SBAS and PS-InSAR results. It is necessary to admit that, nowadays, not all areas are covered by time-series of SAR images to perform PS-InSAR or SBAS analysis and it is quite costly to obtain a stack of SAR images for the pipeline operators that may not always be justified and accepted for the investment to remediation activities.
To the extent of our awareness, for the present study area of BTC, SCP, SCPX and WREP pipelines, these studies of public accessibility arethe first in a sequence of works that seek to answer whether or not SBAS- and PS-InSAR-based techniques hold practical value for the pipeline operators to highlight areas of ground deformations at seismic faults and also along entire range of pipelines. However, the erosion vulnerability of these pipelines was well studied by [22,23,24,25,26] using optical multi-temporal remote sensing. These studies concluded that the first 70 km of BTC, SCP, SCPX and WREP pipelines are most vulnerable to erosion occurrences which create risks of pipeline damage by natural and anthropogenic factors. In particular this was related to the soil types with high silt content, low vegetation cover and hilly terrain. This means that there is obviously an impact from ground deformation processes which should also be investigated in the spatial relationship to naturally occurred erosion processes along petroleum and gas pipelines. In order to achieve better risk management, underlying geotechnical studies are crucial and inevitable to understand possible soil consolidations due to pumping activities for agricultural purposes, since they cause lowering of water-table elevation and the properties of the underlying soil [56,57]. Based on the pipeline-related studies by Hole et al. [21], it is recommended to run PS-InSAR in both ascending and descending acquisition models to resolve the LOS measurements into vertical deformation. Vertical displacement can only be estimated from a single LOS measurement if motion azimuth and the angle between slope motion and a level plane are assumed for the area of interest [21]. As mentioned before, in the present studies, it was not feasible to perform computations for both ascending and descending acquisitions because of nonsufficient computing power and storage space; therefore, a single LOS measurement was obtained from the descending flight direction and approximated to the vertical movement, as proposed by Gee et al. [49], Dai et al. [50] and Hole et al. [21]. Additionally, Singhroy et al. [58] and Hole et al. [21] used the corner reflectors along buried oil pipelines to detect subtle ground and pipeline movements, thereby reducing the need for frequent ground-based survey campaigns and increased the reliability, precision and confidence level of measurements. Sharma et al. [59] coupled the InSAR displacements, GIS analyses, field data and geomechanical modeling to optimize our understanding of landslide geohazards along pipelines. Ianoschi et al. [39] determined the feasibility of gas pipeline monitoring by PS-InSAR using TerraSAR-X (3 × 3 m) radar satellite images and application of high-resolution images added significant amount of information and details in terms of point density. Considering the afore-mentioned InSAR studies along pipelines, it is possible to conclude that, for the best performance of SBAS and PS-InSAR techniques along petroleum and gas pipelines, it is necessary to process both ascending and descending passes for the computation of precise vertical movement; install corner reflectors as permanent reflectors along vulnerable areas of pipeline movements for the reliability, precision, confidence and also for areas with a lack of objects of high scattering properties; apply both high and low resolution radar images; collect all possible geological and geotechnical contextual information from ground-based surveys and other sources to perform combined analysis; run other SAR ground deformation techniques to cross-validate the results; improve point cloud filtering principles of SBAS and PS-InSAR measurements. Another limitation is to automate the separation of natural and man-made caused ground changes, which can be mistakenly reflected as the subsidence or uplift—e.g., development of petroleum and gas infrastructure or excavation activities, etc. Ianoschi et al. [39] performed PS-InSAR with further classification and characterization of persistent scatterers (PS) in terms of ground or building reflections based on thresholding approach above which PS points were classified as buildings and remaining points in the dataset were attributed to ground [60,61]. This is crucial in the prioritization of critical points for further field investigations along petroleum and gas pipelines. Therefore, it is necessary to proceed with further investigations of present studies, particularly with the application of other ground movement detection techniques and also integration of more geospatial information to understand natural and man-made controlling factors of ground movement processes and improve the reliability of produced results.

5. Conclusions

We performed SBAS and PS-InSAR analysis along petroleum and gas pipelines to identify the spatial patterns of ground surface deformations with respect to the location of active seismic faults. Our conclusions are as follows:
1. As a primary factor of ground deformations, the influence of tectonic movements was observed in the wide scale analysis along 70 km long and 10 km wide section of petroleum and gas pipelines with the prevailing and continuous subsidence in the KP13–70 range of pipelines crossing two active seismic faults. However, the largest subsidence rates were observed in the areas of croplands, where agricultural activities, such as overuse of groundwater, irrigation and ploughing etc. accelerate the surface deformation rates caused by the tectonic processes. The ground uplift deformations were observed in the pipeline range of KP0-KP13.
2. SBAS performed better than PS-InSAR along buried petroleum and gas pipelines in the following aspects: the complete coverage of the measured points, significantly lower dispersion of the results, continuous and realistic measurements and higher accuracy of ground deformation rates against the GPS historical measurements. The validation of ground deformation rates at KP28 + 300 using high-precision GPS measurements revealed the encouraging level of agreement with the regression coefficients equal to 0.94 for SBAS and 0.74 for PS-InSAR. The validation of ground deformation rates at KP52 + 500 using high-precision GPS measurements revealed the encouraging level of agreement with the regression coefficients equal to 0.9 for SBAS and 0.89 for PS-InSAR. This means that the SBAS-based approach outlined in this paper is a significant improvement over current ground-based monitoring practices along pipelines. However, it is necessary to emphasize that PS-InSAR could perform better for the terminals, pump stations and aboveground pipelines since the PS-InSAR technique relies on the intensity of the backscattered radar waves to measure permanent scatterers as man-made structures with strongest returns.
3. Local scale analyses were performed along 70 km section of pipelines with 250 m buffer zone for the detailed quantitative ground movement assessment of two seismic faults. Although both PS-InSAR and SBAS measurements were highly consistent in deformation patterns and trends along pipelines, they showed differences in the spatial distribution of ground deformation classes and noisiness of produced results. High dispersion of PS-InSAR measurements caused low regression coefficients with SBAS for the pipeline profile range of 70 km and seismic faults at KP21–31 and KP46–54. The minimum and maximum vertical ground deformation velocities were observed to be −21.3 and 14.1 mm/y for PS-InSAR and −15.9 and 4.5 mm/y for SBAS measurements, respectively, along a 70 km range of pipelines with the buffer zone of 250m. The ground deformation velocities within the range of Seismic Fault KP21–31 revealed the minimum and maximum values of −9.03 and 1.45 mm/y for SBAS and −22.65 and 14.01 mm/y for PS-InSAR, respectively. The ground deformation velocities within the range of Seismic Fault KP46–54 revealed the minimum and maximum values of −8.31 and 2.05 mm/y for SBAS and −19.14 and 9.41 mm/y for PS-InSAR, respectively. The wider range of PS-InSAR values was directly related to the produced dispersion results, which makes it more complicated for the pipeline operators to prioritize vulnerable areas to ground deformation processes along pipelines. The regression analysis and RMSE evaluations between SBAS and PS-InSAR ground deformation measurements revealed the correlation coefficient equal to 0.79 and RMSE equal to 4.9 mm for KP28 + 300 and the correlation coefficient equal to 0.92 and RMSE equal to 6 mm for KP52 + 500. This allows us to assume that SBAS and PS-InSAR measurements are subject to approximate variations in the range of 4.9–6 mm, which should be considered as a limitation by pipeline operators in terms of the existing compliance standards for acceptance.
4. The spatial distribution and variation of ground movement processes along pipelines demonstrated that general geological and geotechnical understanding of the study area is not sufficient to find and mitigate all the critical areas of subsidence and uplifts for the pipeline operators. The prediction of the potential subsidence or uplift locations based on the field visual verifications holds a lot of uncertainties without wide and detailed scale airborne and satellite space observation technologies. The justification of the budget for the geotechnical maintenance activities along long-range oil and gas pipelines requires sophisticated prioritization and planning of the remediation sites and clear quantitative and qualitative risk assessment proving the activeness of these sites and effectiveness of the remediation measures.
5. Even though SBAS demonstrated a reliable approach for the detection of ground deformation processes along petroleum and gas pipelines, it is highly recommended to advance these studies with the integration of other geological, geotechnical, thermal and climatic information to better understand controlling natural and man-made factors. Besides, it is also crucial to use other techniques, such as ISBAS and SqueeSAR and cross-validate the results. It is also recommended to apply high-resolution SAR images to understand how much this would enhance the accuracy and reliability of the present studies.

Author Contributions

Scientific research and writing of original draft: E.B.; Review and editing: M.B. and M.K. All authors have read and agreed to the published version of the manuscript.

Funding

This research was funded by the Nazarbayev University through the Faculty-development Competitive Research Grant (FDCRGP)—Funder Project Reference: 080420FD1917.

Acknowledgments

The authors would like to thank Nazarbayev University. This research was funded by the Nazarbayev University through the Faculty-development Competitive Research Grant (FDCRGP)—Funder Project Reference: 080420FD1917.

Conflicts of Interest

The authors declare no conflict of interest.

References

  1. Zhang, A.; Lu, J.; Kim, J.-W. Detecting mining-induced ground deformation and associated hazards using spaceborne InSAR techniques. Geomat. Nat. Hazards Risk 2017, 9, 211–223. [Google Scholar] [CrossRef]
  2. Shi, J.; Yang, H.; Peng, J.; Wu, L.; Xu, B.; Liu, Y.; Zhao, B. InSAR Monitoring and Analysis of Ground Deformation Due to Fluid or Gas Injection in Fengcheng Oil Field, Xinjiang, China. J. Indian Soc. Remote Sens. 2018, 47, 455–466. [Google Scholar] [CrossRef]
  3. Liu, Y.; Huang, H.; Liu, Y.; Bi, H. Linking land subsidence over the Yellow River delta, China, to hydrocarbon exploitation using multi-temporal InSAR. Nat. Hazards 2016, 84, 271–291. [Google Scholar] [CrossRef]
  4. Yan, S.; Shi, K.; Li, Y.; Liu, J.; Zhao, H. Integration of satellite remote sensing data in underground coal fire detection: A case study of the Fukang region, Xinjiang, China. Front. Earth Sci. 2019, 14, 1–12. [Google Scholar] [CrossRef]
  5. Mikhailov, V.O.; Kiseleva, E.A.; Smol’Yaninova, E.I.; Dmitriev, P.N.; Golubev, V.I.; Timoshkina, E.P.; Khairetdinov, S.A. Satellite Radar Interferometry: New Technologies for Satellite Monitoring of Mining Areas and Displacements of Natural and Man-Made Objects. Seism. Instrum. 2018, 54, 515–520. [Google Scholar] [CrossRef]
  6. Rucker, M.L.; Panda, B.B.; Meyers, R.A.; Lommler, J.C. Using InSAR to detect subsidence at brine wells, sinkhole sites, and mines. Carbonates Evaporites 2013, 28, 141–147. [Google Scholar] [CrossRef]
  7. Zheng, M.; Deng, K.-Z.; Du, S.; Liu, J.; Liu, J.; Feng, J. Joint Probability Integral Method and TCPInSAR for Monitoring Mining Time-Series Deformation. J. Indian Soc. Remote Sens. 2018, 47, 63–75. [Google Scholar] [CrossRef]
  8. Singhroy, V.; Li, J.; Charbonneau, F. High Resolution Rapid Revisit InSAR Monitoring of Surface Deformation. Can. J. Remote Sens. 2015, 41, 458–472. [Google Scholar] [CrossRef]
  9. Chang, L.; Ku, O.; Hanssen, R.F. Identification of deformation pattern changes caused by enhanced oil recovery (EOR) using InSAR. Int. J. Remote Sens. 2018, 40, 1495–1505. [Google Scholar] [CrossRef] [Green Version]
  10. Colesanti, C.; Ferretti, A.; Prati, C.; Rocca, F. Monitoring landslides and tectonic motions with the Permanent Scatterers Technique. Eng. Geol. 2003, 68, 3–14. [Google Scholar] [CrossRef]
  11. Zhang, Q.; Li, Y.; Zhang, J.; Luo, Y. InSAR technique applied to the monitoring of the Qinghai–Tibet Railway. Nat. Hazards Earth Syst. Sci. 2019, 19, 2229–2240. [Google Scholar] [CrossRef] [Green Version]
  12. Wasowski, J.; Bovenga, F.; Nutricato, R.; Nitti, D.O.; Chiaradia, M.T. Advanced satellite radar interferometry for deformation monitoring and infrastructure control in open-cast mines and oil/gas fields. Innov. Infrastruct. Solut. 2018, 3, 68. [Google Scholar] [CrossRef]
  13. Ji, L.; Zhang, Y.; Wang, Q.; Xin, Y.; Li, J. Detecting land uplift associated with enhanced oil recovery using InSAR in the Karamay oil field, Xinjiang, China. Int. J. Remote Sens. 2016, 37, 1527–1540. [Google Scholar] [CrossRef]
  14. Yang, C.; Zhang, D.; Zhao, C.; Han, B.; Sun, R.; Du, J.; Chen, L. Ground Deformation Revealed by Sentinel-1 MSBAS-InSAR Time-Series over Karamay Oilfield, China. Remote Sens. 2019, 11, 2027. [Google Scholar] [CrossRef] [Green Version]
  15. Sircar, S.; Power, D.; Randell, C.; Youden, J.; Gill, E. Lateral and subsidence movement estimation using InSAR. In Proceedings of the IEEE International Geoscience and Remote Sensing Symposium, IGARSS ’04, Anchorage, AK, USA, 20–24 September 2004. [Google Scholar] [CrossRef]
  16. Singhroy, V.; Alasset, P.-J.; Couture, R.; Poncos, V. InSAR monitoring of landslides on permafrost terrain in Canada. IEEE Int. Geosci. Remote Sens. Symp. 2007, 2007IGARSS, 2451–2454. [Google Scholar] [CrossRef]
  17. Guthrie, R.; Reid, E.; Richmond, J.; Ghuman, P.; Cormier, Y. InSAR and the Pipeline Geohazards Toolbox: Instructions for Use As of 2018. In Proceedings of the Operations, Monitoring, and Maintenance; Materials and Joining, Calgary, AB, Canada, 24–28 September 2018. [Google Scholar] [CrossRef]
  18. Riedmann, M.; Sims, R.; Rogg, C.; Schleider, O. Application of ground movement and automated route planning technologies for pipeline planning and management—The PIPEMON project. In Proceedings of the 6th International Pipeline Conference, Calgary, AB, Canada, 25–29 September 2006; p. 9. [Google Scholar]
  19. Zirnig, W.; Pride, R.; Lingenfelder, I.; Chiles, R.; Hausamann, D. The PRESENSE and PIPEMON projects—Defining the ways of using space-borne earth observation services for pipeline monitoring. In Proceedings of the IGRC Conference, Vancouver, BC, Canada, 1–4 November 2004; p. 14. [Google Scholar]
  20. Sims, R.; Riedmann, M. Ground motion monitoring using InSAR: Example applications for mining and pipeline operations with consideration of potential for developing countries. In Proceedings of the ISPRS Commission VII (WG2 & WG7), Istanbul, Turkey, 16–18 May 2007. [Google Scholar]
  21. Hole, J.; Holley, R.; Giunta, G.; Lorenzo, G.; Thomas, A. InSAR assessment of pipeline stability using compact active transponders. In Proceedings of the Fringe 2011, Frascati, Italy, 19–23 September 2011; p. 53. [Google Scholar]
  22. Bayramov, E.R. Quantitative Assessment of Vegetation Renaturation and Soil Degradation and Their Control by Climate and ground Factors along Rights-of-Way of Petroleum/Gas Pipelines, Azerbaijan. Ph.D. Thesis, Dresden University of Technology, Dresden, Germany, 2013. [Google Scholar]
  23. Bayramov, E.; Buchroithner, M.F.; McGurty, E. Determination of main climate and ground factors controlling vegetation cover regrowth along oil and gas pipelines using multiple, spatial and geographically weighted regression procedures. Environ. Earth Sci. 2011, 66, 2047–2062. [Google Scholar] [CrossRef]
  24. Bayramov, E.; Buchroithner, M.; McGurty, E. Quantitative assessment of vegetation cover and soil degradation factors within terrain units for planning, monitoring and assessment of renaturation along oil and gas pipelines. Geocarto Int. 2012, 27, 535–555. [Google Scholar] [CrossRef]
  25. Bayramov, E.; Buchroithner, M.F.; McGurty, E. Prediction reliability, quantitative differences and spatial variations of erosion models for long-range petroleum and gas infrastructure. Georisk Assess. Manag. Risk Eng. Syst. Geohazards 2012, 6, 252–272. [Google Scholar] [CrossRef]
  26. Bayramov, E.; Buchroithner, M.F.; McGurty, E. Differences of MMF and USLE Models for Soil Loss Predictionalong BTC and SCP Pipelines. J. Pipeline Syst. Eng. Pr. 2013, 4, 81–96. [Google Scholar] [CrossRef]
  27. Kampes, B. Displacement Parameter Estimation using Permanent Scatterer Interferometry. Ph.D. Thesis, Delft University of Technology, Delft, The Netherlands, 2015. [Google Scholar]
  28. Ferretti, A.; Fumagalli, A.; Novali, F.; Prati, C.; Rocca, F.; Rucci, A. A New Algorithm for Processing Interferometric Data-Stacks: SqueeSAR. IEEE Trans. Geosci. Remote Sens. 2011, 49, 3460–3470. [Google Scholar] [CrossRef]
  29. Hooper, A.; Zebker, H.; Segall, P.; Kampes, B. A new method for measuring deformation on volcanoes and other natural terrains using InSAR persistent scatterers. Geophys. Res. Lett. 2004, 31. [Google Scholar] [CrossRef]
  30. Honglei, Y.; Jun-huan, P. Monitoring Urban Subsidence with Multi-master Radar Interferometry Based on Coherent Targets. J. Ind. Soc. Remote Sens. 2015, 43, 529–538. [Google Scholar]
  31. D’Aria, D.; Ferretti, A.; Guarnieri, A.M.; Tebaldini, S. SAR Calibration Aided by Permanent Scatterers. IEEE Trans. Geosci. Remote Sens. 2009, 48, 2076–2086. [Google Scholar] [CrossRef]
  32. Perissin, D.; Ferretti, A. Urban-Target Recognition by Means of Repeated Spaceborne SAR Images. IEEE Trans. Geosci. Remote Sens. 2007, 45, 4043–4058. [Google Scholar] [CrossRef]
  33. Lu, L.; Liao, M. Subsidence measurement with ps-insar techniques in Shanghai urban. Int. Arch. Photogramm. Remote Sens. Spatial Inf. Sci. 2008, 37, B7. [Google Scholar]
  34. Berardino, P.; Costantini, M.; Franceschetti, G.; Iodice, A.; Pietranera, L.; Rizzo, V. Use of differential SAR interferometry in monitoring and modelling large slope instability at Maratea (Basilicata, Italy). Eng. Geol. 2003, 68, 31–51. [Google Scholar] [CrossRef]
  35. Virk, A.S.; Singh, A.; Mittal, S.K. Advanced MT-InSAR Landslide Monitoring: Methods and Trends. J. Remote Sens. GIS 2018, 7, 1–6. [Google Scholar] [CrossRef]
  36. Lanari, R.; Casu, F.; Manzo, M.; Zeni, G.; Berardino, P.; Manunta, M.; Pepe, A. An overview of the small baseline subset algorithm: ADInSAR technique for surface deformation analysis. Pure Appl. Geophys. 2007, 164, 637–661. [Google Scholar]
  37. Grebby, S.; Orynbassarova, E.; Sowter, A.; Gee, D.; Athab, A. Delineating ground deformation over the Tengiz oil field, Kazakhstan, using the Intermittent SBAS (ISBAS) DInSAR algorithm. Int. J. Appl. Earth Obs. Geoinf. 2019, 81, 37–46. [Google Scholar] [CrossRef]
  38. Gheorghe, M.; Armaş, I. Comparison of Multi-Temporal Differential Interferometry Techniques Applied to the Measurement of Bucharest City Subsidence. Proc. Environ. Sci. 2016, 32, 221–229. [Google Scholar] [CrossRef] [Green Version]
  39. Ianoschi, R.; Schouten, M.; Leezenberg, P.B.; Dheenathayalan, P.; Hanssen, R. Satellite radar interferometry for risk management of gas pipeline networks. In Proceedings of the ‘ESA Living Planet Symposium 2013’, Edinburgh, UK, 9–13 September 2013. [Google Scholar]
  40. Chang, L.; Dollevoet, R.; Hanssen, R.F. Monitoring Line-Infrastructure with Multisensor SAR Interferometry: Products and Performance Assessment Metrics. IEEE J. Sel. Top. Appl. Earth Obs. Remote Sens. 2018, 11, 1593–1605. [Google Scholar] [CrossRef] [Green Version]
  41. Imamoglu, M.; Kahraman, F.; Çakir, Z.; Sanli, F.B. Ground Deformation Analysis of Bolvadin (W. Turkey) by Means of Multi-Temporal InSAR Techniques and Sentinel-1 Data. Remote Sens. 2019, 11, 1069. [Google Scholar] [CrossRef] [Green Version]
  42. Solari, L.; Bianchini, S.; Franceschini, R.; Barra, A.; Monserrat, O.; Thuegaz, P.; Bertolo, D.; Crosetto, M.; Catani, F. Satellite interferometric data for landslide intensity evaluation in mountainous regions. Int. J. Appl. Earth Obs. Geoinf. 2020, 87, 102028. [Google Scholar] [CrossRef]
  43. Yunjun, Z.; Fattahi, H.; Amelung, F. Small baseline InSAR time series analysis: Unwrapping error correction and noise reduction. Comput. Geosci. 2019, 133, 104331. [Google Scholar] [CrossRef] [Green Version]
  44. Osmanoğlu, B.; Sunar, F.; Wdowinski, S.; Cabral-Cano, E. Time series analysis of InSAR data: Methods and trends. ISPRS J. Photogramm. Remote Sens. 2016, 115, 90–102. [Google Scholar] [CrossRef]
  45. Lauknes, T.R.; Dehls, J.; Larsen, Y.; Høgda, K.A.; Weydahl, D.J. A comparison of SBAS and PS ERS InSAR for subsidence monitoring in Oslo, Norway. In Proceedings of the Fringe 2005 Workshop, ESA ESRIN, Frascati, Italy, 28 November–2 December 2005. [Google Scholar]
  46. Farr, T.G.; Rosen, P.A.; Caro, E.; Crippen, R.; Duren, R.; Hensley, S.; Kobrick, M.; Paller, M.; Rodriguez, E.; Roth, L.; et al. The Shuttle Radar Topography Mission. Rev. Geophys. 2007, 45. [Google Scholar] [CrossRef] [Green Version]
  47. Bonì, R.; Bosino, A.; Meisina, C.; Novellino, A.; Bateson, L.; McCormack, H. A Methodology to Detect and Characterize Uplift Phenomena in Urban Areas Using Sentinel-1 Data. Remote Sens. 2018, 10, 607. [Google Scholar] [CrossRef] [Green Version]
  48. Aslan, G.; Çakir, Z.; Lasserre, C.; Renard, F. Investigating Subsidence in the Bursa Plain, Turkey, Using Ascending and Descending Sentinel-1 Satellite Data. Remote Sens. 2019, 11, 85. [Google Scholar] [CrossRef] [Green Version]
  49. Gee, D.; Sowter, A.; Novellino, A.; Marsh, S.; Gluyas, J. Monitoring land motion due to natural gas extraction: Validation of the Intermittent SBAS (ISBAS) DInSAR algorithm over gas fields of North Holland, The Netherlands. Mar. Pet. Geol. 2016, 77, 1338–1354. [Google Scholar] [CrossRef]
  50. Dai, K.; Liu, G.; Li, Z.; Li, T.; Yu, B.; Wang, X.; Singleton, A. Extracting Vertical Displacement Rates in Shanghai (China) with Multi-Platform SAR Images. Remote Sens. 2015, 7, 9542–9562. [Google Scholar] [CrossRef] [Green Version]
  51. Tofani, V.; Raspini, F.; Catani, F.; Casagli, N. Persistent Scatterer Interferometry (PSI) Technique for Landslide Characterization and Monitoring. Remote Sens. 2013, 5, 1045–1065. [Google Scholar] [CrossRef] [Green Version]
  52. Gehlot, S.; Ketelaar, V.B.H.; Verbree, E.; Hanssen, R.F. Conceptual Framework for PS-InSAR Interpretation Assisted by Geo-information Technology. In Proceedings of the ISPRS Workshop on “High Resolution Earth Imaging for Geospatial Information”, Hannover, Germany, 17–20 May 2005. [Google Scholar]
  53. Gee, D.; Bateson, L.; Marsh, S.; Grebby, S.; Novellino, A.; Cigna, F.; Marsh, S.; Banton, C.; Wyatt, L. Ground Motion in Areas of Abandoned Mining: Application of the Intermittent SBAS (ISBAS) to the Northumberland and Durham Coalfield, UK. Geoscience 2017, 7, 85. [Google Scholar] [CrossRef] [Green Version]
  54. Sowter, A.; Bateson, L.; Strange, P.; Ambrose, K.; Syafiudin, M.F. DInSAR estimation of land motion using intermittent coherence with application to the South Derbyshire and Leicestershire coalfields. Remote Sens. Lett. 2013, 4, 979–987. [Google Scholar] [CrossRef] [Green Version]
  55. Sowter, A.; Che Amat, M.; Cigna, F.; Marsh, S.; Athab, A.; Alshammari, L. Mexico City land subsidence in 2014–2015 with sentinel-1 IW TOPS: Results using the Intermittent SBAS (ISBAS) technique. Int. J. Appl. Earth Obs. Geoinf. 2016, 52, 230–242. [Google Scholar]
  56. Stamatopoulos, C.; Petridis, P.; Parcharidis, I.; Foumelis, M. A method predicting pumping-induced ground settlement using back-analysis and its application in the Karla region of Greece. Nat. Hazards 2018, 92, 1733–1762. [Google Scholar] [CrossRef]
  57. Chai, J.C.; Shen, S.L.; Zhu, H.H.; Zhang, X.L. 1D analysis of land subsidence in Shanghai. Lowland Technol. Int. 2005, 7, 33–41. [Google Scholar]
  58. Singhroy, V.; Li, J.; Blais-Stevens, A.; Fobert, M.-A. Insar Monitoring of Pipeline Routes. In Proceedings of the IGARSS 2018—2018 IEEE International Geoscience and Remote Sensing Symposium; Institute of Electrical and Electronics Engineers (IEEE), Valencia, Spain, 22–27 July 2018; pp. 212–215. [Google Scholar]
  59. Sharma, J.; Busler, J.; Francioni, M.; Stead, D.; Donati, D.; Onsel, E.; Clague, J.; Brideau, M.A. Monitoring Landslides along Pipeline Corridors Using a Combined Satellite-Based InSAR and Geomechanical Modelling Approach. In Proceedings of the GeoVancouver 2016, Vancouver, BC, Canada, 2–5 October 2016. [Google Scholar]
  60. Dheenathayalan, P.; Hanssen, R. Target characterization and interpretation of deformation using persistent scatterer interferometry and polarimetry. In Proceedings of the 5th International Workshop on Science and Applications of SAR Polarimetry and Polarimetric Interferometry, ‘POLInSAR 2011’, Frascati, Italy, 24–28 January 2011. [Google Scholar]
  61. Dheenathayalan, P.; Caro Cuenca, M.; Hanssen, R.F. Different approaches for psi target characterization for monitoring urban infrastructure. In Proceedings of the 8th International Workshop on Advances in the Science and Applications of SAR Interferometry, ‘FRINGE 2011’, Frascati, Italy, 19–23 September 2011. [Google Scholar]
Figure 1. (a) Map of Corridors of Oil and Gas Pipelines with the Indication of Seismic Faults, Earthquakes, Mud Volcanoes; (b) Detailed Map of Study Area with the Worldview-2 Satellite Imagery Background; (c) Detailed Map of Study Areas with the Hillshaded Terrain Background; (d) Landcover Types along the Corridor of Oil and Gas Pipelines.
Remotesensing 12 03934 g001
Figure 2. Workflow for PS-InSAR, SBAS and Spatial Statistics.
Remotesensing 12 03934 g002
Figure 3. Connection Graphs: (a) Time-Position Plot for PS-InSAR; (b) Time-Baseline Plot for PS-InSAR; (c) Time-Position for SBAS; (d) Time-Baseline Plot for SBAS; (e) Density of PS-InSAR Measured Ground Deformation Points; (f) Density of SBAS Measured Ground Deformation Points.
Remotesensing 12 03934 g003
Figure 4. (a) Map of PS-InSAR Ground Deformation Velocity along Petroleum and Gas Pipelines; (b) Map of SBAS Ground Deformation Velocity along Petroleum and Gas Pipelines; (c) PS-InSAR and SBAS 5km Interval Profile View of Ground Deformation Velocity; (d) Histogram of PS-InSAR and SBAS Pixel Distribution; (e) PS-InSAR Map of Ground Movement Rates (on 27 December 2019 with the Baseline of 6 January 2018); (f) SBAS Map of Ground Movement Rates (on 27 December 2019 with the Baseline of 6 January 2018).
Remotesensing 12 03934 g004
Figure 5. (a) Map of PS-InSAR Hotspots of Ground Deformation Velocities; (b) Map of SBAS Hotspots of Ground Deformation Velocities; (c) Map of PS-InSAR Trends of Ground Deformation Velocities; (d) Map of SBAS Trends of Ground Deformation Velocities.
Remotesensing 12 03934 g005
Figure 6. Three-Dimensional Representation of PS-InSAR and SBAS Ground Deformation Velocities (Visual Exaggeration: 3 times): (a) PS-InSAR South-West View; (b) PS-InSAR South-East View; (c) SBAS South-West View; (d) SBAS South-East View.
Remotesensing 12 03934 g006
Figure 7. Graphs of Statistical Indicators for: (a) 70 km Section of Pipelines with 10 km Buffer Zone; (b) 70 km Section of Pipelines with 250 m Buffer Zone; (c) Seismic Fault KP21–31; (d) Seismic Fault KP45–54.
Remotesensing 12 03934 g007
Figure 8. Map of Ground Deformation Velocity along 70 km Petroleum and Gas Pipelines Corridor within 250 m Buffer Zone; (a) for PS-InSAR; (b) for SBAS; (c) Area of Ground Deformation Velocity Classes; (d) Regression Analysis between PS-InSAR and SBAS Ground Deformation Velocity for 250 m Interval Points along Pipelines.
Remotesensing 12 03934 g008
Figure 9. Map of Ground Deformation Rates along 70 km Petroleum and Gas Pipelines Corridor within 250 m Buffer Zone; (a) for PS-InSAR; (b) for SBAS; (c) Area of Ground Deformation Rate Classes; (d) Regression Analysis between PS-InSAR and SBAS Ground Deformation Rates for 250 m Interval Points along Pipelines.
Remotesensing 12 03934 g009
Figure 10. Detailed Map of the Ground Deformation Velocity for 250 m Buffer Zone of Pipeline Corridor Crossing the Seismic Faults at KP21–31 range: (a) for SBAS; (b) for PS-InSAR;(c) Profile View of PS-InSAR and SBAS Ground Deformation Velocity for the Seismic Fault at KP21–31 range; (d) Regression Analysis between PS-InSAR and SBAS Ground Deformation Velocity for 10m Interval Points along Pipelines within KP21–31 range.
Remotesensing 12 03934 g010
Figure 11. Detailed Map of the Ground Deformation Rates for 250 m Buffer Zone of Pipeline Corridor Crossing the Seismic Faults at KP21–31 Range: (a) for SBAS; (b) for PS-InSAR; (c) Profile View of PS-InSAR and SBAS Ground Deformation Rates for the Seismic Fault at KP21–31 Range; (d) Regression Analysis between PS-InSAR and SBAS Ground Deformation Rates for 10m Interval Points along Pipelines within KP21–31 Range.
Remotesensing 12 03934 g011
Figure 12. Detailed Map of the Ground Deformation Velocity for 250 m Buffer Zone of Pipeline Corridor Crossing the Seismic Faults at KP46–54 range: (a) for SBAS; (b) for PS-InSAR; (c) Profile View of PS-InSAR and SBAS Ground Deformation Velocity for the Seismic Fault at KP46–54 range; (d) Regression Analysis between PS-InSAR and SBAS Ground Deformation Velocity for 10m Interval Points along Pipelines within KP46–54 Range.
Remotesensing 12 03934 g012
Figure 13. Detailed Map of the Ground Deformation Rates for 250 m Buffer Zone of Pipeline Corridor Crossing the Seismic Faults at KP46–54 Range: (a) for SBAS; (b) for PS-InSAR; (c) Profile View of PS-InSAR and SBAS Ground Deformation Rates for the Seismic Fault at KP46–54 range; (d) Regression Analysis between PS-InSAR and SBAS Ground Deformation Rates for 10m Interval Points along Pipelines within KP46–54 range.
Remotesensing 12 03934 g013
Figure 14. (a) Graph of Ground Deformation Rates for SBAS, PS-InSAR and GPS Measurements at KP28 + 300; (b) Graph of Ground Deformation Rates for SBAS, PS-InSAR and GPS Measurements at KP52 + 500; (c) Regression Analyses between SBAS and PS-InSAR Ground Deformation Rates at KP28 + 300; (d) Regression Analyses between SBAS and PS-InSAR Ground Deformation Rates at KP52 + 500.
Remotesensing 12 03934 g014
Figure 15. (a) Validation of SBAS Ground Deformation Rates using High-precision GPS Measurements at KP28 + 300; (b) Validation of SBAS Ground Deformation Rates using High-precision GPS Measurements at KP52 + 500; (c) Validation of PS-InSAR Ground Deformation Rates using High-precision GPS Measurements at KP28 + 300; (d) Validation of PS-InSAR Ground Deformation Rates using High-precision GPS Measurements at KP52 + 500.
Remotesensing 12 03934 g015
Figure 16. Spatial Distribution of Ground Deformation Velocity within Landcover Classes along 70 km Long Section of Pipelines (a) for SBAS within 10 km Buffer Zone (b) for PS-InSAR within 10 km Buffer Zone (c) SBAS within 250 m buffer zone (d) for PS-InSAR within 250 buffer zone.
Remotesensing 12 03934 g016
Publisher’s Note: MDPI stays neutral with regard to jurisdictional claims in published maps and institutional affiliations.

