Article

Cost–Benefit Analysis of Municipal Sludge as a Low-Grade Nutrient Source: A Case Study from South Africa

by
Eyob Habte Tesfamariam
*,
Zekarias Mihreteab Ogbazghi
*,
John George Annandale
and
Yemane Gebrehiwot
Department of Plant and Soil Sciences, University of Pretoria, Private Bag: X20, Hatfield, 0028 Pretoria, South Africa
*
Authors to whom correspondence should be addressed.
Sustainability 2020, 12(23), 9950; https://doi.org/10.3390/su12239950
Submission received: 16 October 2020 / Revised: 16 November 2020 / Accepted: 17 November 2020 / Published: 28 November 2020

Abstract

:
Municipal sludge has economic value as a low-grade fertilizer as it consists of appreciable amounts of the macro and micronutrients. When using sludge as fertilizer, the economic aspect should be taken into account. In this study, the following specific objectives were identified: (a) to investigate the economic feasibility of using sludge as a fertilizer; (b) to estimate the maximum economic distance sludge can be transported as a fertilizer; and (c) to test the economic feasibility of selling sludge using commercial inorganic fertilizer as a bench mark. The study showed that for anaerobically digested, paddy dried, municipal sludge consisting of 3% N, 2% P, and 0.3% K the economic feasibility of transporting the sludge was limited to a diameter of 20 km in the arid zone, 28 km in the semi-arid zone, 51 km in the sub humid zone, 66 km in the humid zone, and 75 km in the super-humid zone. Therefore, the economic feasibility of using sludge as a substitute for or complementary to commercial inorganic fertilizer is dictated by the distance between the wastewater care work and the farm, sludge nutrient concentration, agro-ecological zone (rain and temperature), and the real-time commercial inorganic fertilizer price.

1. Introduction

World human population growth in general is expected to place significant new demands on already strained renewable and non-renewable natural resources, thereby causing environmental degradation, while reinforcing social inequity and poverty. With this in mind, the UN adopted the Sustainable Development Goals (SDGs) in 2015 with the theme “Transforming our world: the 2030 Agenda for Sustainable Development [1]. This ambitious agenda hopes to address 17 core areas of public concern of which 15 (excepting goals 4 and 17) relate directly or indirectly to waste recycling, with predominant conceptual emphasis on food security, health, and environment. Recycling of wastewater sludge in agricultural lands increases soil organic matter [2], plant available P (Olsen-P) [3], total P, N, and K [3], and improves the overall soil physiochemical properties by decreasing soil bulk density while increasing soil aggregate stability and cation exchange capacity [4]. However, there are concerns from pathogens, heavy metals, and emerging contaminants added along with the sludge to agricultural lands [5]. Nonetheless, not all sludges are qualified for use in agricultural lands. Hence, many countries have developed sludge guidelines to characterise sludge based on the stability of sludge (vector attraction), pathogen content, and concentration of trace metals [6,7]. Studies related to the fate of emerging contaminants from sludges applied in agricultural lands are inconclusive because the fate of emerging contaminants in agricultural soils is reported to be influenced by the type of soil amendment, soil properties, and chemical properties of sludge [8]. This study, therefore, assumes that the sludge type considered is class A, according to [7] or class A1a, according to South African sludge guideline [6].
The nutrient fertilizer value of sludge depends on the total major plant nutrient (N, P, K) composition [9] and nutrient availability for plant uptake [10]. Generally, sludge is applied according to crop nitrogen requirements [11]. The nitrogen fertilizer value of sludge, however, depends on the total N content and the nitrogen mineralization rate of the sludge [12]. This depends on the source of the sludge and the processing of the wastewater and sewage sludge treatment [9]. Generally, sewage sludge is a poor source of potassium [10] because in most cases it has less than 1% by mass and has a lower K:N ratio (1:6 to 1:10) compared with that of crops (about 1:1.4 to 1:1.6). In contrast, the P:N ratio of sludge (1:2 to 2:1) is much higher than the P:N ratio of crops (1:6 to 1:10). Hence, N-based sludge application could lead to soil P accumulation, which could lead to environmental pollution through P losses via runoff to surface water bodies [13].
Economic evaluation is the comparative analysis of alternative courses of action in terms of both costs (resource use) and consequences (outcomes, effects) [14]. Previous studies have proven the fertilizer value of municipal sludge and its role as a soil conditioner across a range of climates, soil types, and cropping systems [15]. It is important to note that sludge is a low-grade nutrient source (2–5% N, 1.2–4% P, and 0.3–0.5% K), and its economic value as fertilizer also diminishes with an increase in distance between the wastewater treatment plant and the farm. This is mainly due to an increase in transportation cost.
Planning to adapt sludge as a fertilizer supplement on farm systems requires both long term considerations, such as the carry over effects of nutrients on follow up years, and short-term considerations, such as year-to-year fluctuations in fertilizer price and transportation costs. Economic evaluation models are formidable tools to conduct assessment on the short and long-term economic value of sludge using simple equations. Economic evaluation of sludge through cost–benefit analyses should take into account the fertilizer value of sludge (N, P, and K), transportation cost, and spreading cost. In this study, a cost–benefit analysis of sludge was conducted to investigate the ideal perimeter around water care works where sludge could be economically transported using commercial inorganic fertilizer as a benchmark. Sludge nutrient content and composition varies across wastewater treatment plants as well as within wastewater treatment plants at different times of the year. Similarly, the price of commercial inorganic fertilizer is volatile due to the volatility of the raw materials. Thus, a dynamic robust calculator which takes into account real-time sludge nutrient composition, commercial inorganic fertilizer price, and transport and spreading costs is vital to accommodate such variation and provide real-time assessment.
There is little published work, if any, about the maximum distance that sludge can be economically transported for use as a low-grade fertilizer as those studies would need real-time sludge nutrient composition, commercial inorganic fertilizer price, and transport and spreading costs. Thus, developing a simple model (equation or set of equations) that would take into account these variables to estimate the economically feasible distance that a sludge can be used as a fertilizer is of paramount importance for both the wastewater treatment plants and farmers. To promote the beneficial agricultural use of municipal sludge as a low-grade source of the primary macro nutrients, the following specific objectives were identified: (a) to investigate the economic feasibility of using sludge as a substitute or complementary source of plant nutrients to commercial inorganic fertilizer; (b) to estimate the maximum economic distance that sludge can be transported as a fertilizer; and (c) to test the economic feasibility of selling sludge using commercial inorganic fertilizer as a bench mark.

2. Materials and Methods

2.1. Economic Evaluation Input Requirements

In this section, the cost–benefit analysis of the fertilizer value of sludge is computed using commercial fertilizer as a benchmark. This economic evaluation is based on the long-term field trial conducted at the East Rand Water Care Works (ERWAT) [15,16] and a laboratory experiment conducted at the Soil Science Laboratory, Department of Plant and Soil Sciences of the University of Pretoria. The economic evaluation of sludge consisted of the following three interrelated sections: (1) transport related information, (2) commercial inorganic fertilizer price related information, and (3) cost–benefit analysis. Details of the variables for each of the three sections are presented below. The currency that we used for this cost–benefit analysis study was United States dollars ($).
(a)
Transportation
  • Farm distance (D) from wastewater treatment plant (km)
  • Rate of truck (r) ($)
  • Transport cost per km ($)
  • Number of loads (L)
  • Spreading cost per ton of sludge ($)
(b)
Commercial inorganic fertilizer price information
  • Nitrogen price per kg ($)
  • Nitrogen content of fertilizer (%)
  • Phosphorus price per kg ($)
  • Phosphorus content of fertilizer (%)
  • Potassium price per kg ($)
  • Potassium content of fertilizer (%)
(c)
Cost–benefit analysis
  • Total cost of applying municipal sludge ($)
  • Total cost of applying commercial fertilizer ($)
  • Maximum economic distance (km)
  • Maximum selling cost ($)

2.2. Economic Assumptions and Scenarios

An assumption allows an economist to break down a complex process in order to develop a theory and realm of understanding [17]. Economists use assumptions in order to simplify economics processes so that they are easier to understand. This cost–benefit analysis of municipal sludge is based on certain assumptions that can be broadly classified into four categories.

2.2.1. Assumptions on Economic Value of Sludge as Fertilizer

These assumptions on the economic value of sludge as fertilizer refer to the price of plant available nutrients (N, P, and K) and those for inorganic commercial fertilizers. We assumed that the monetary value of plant available nutrients (N, P, and K) from sludge are the same as those for inorganic commercial fertilizers. The following commercial fertilizer sources were used as a benchmark in this study: limestone ammonium nitrate (LAN) (28% N), double superphosphate (H2PO4) (19.6% P), and potassium chloride (KCl) (50% K). The prices of each fertilizer as of March 2020 are presented in Table 1.

2.2.2. Assumptions on Plant Available Nutrients from Sludge

One factor considered when applying sludge to agricultural soils is the amount of N that will be available to the plant during a given time period (growing season) [18,19]. The release of plant available N from organic sources such as sewage sludge applied to agricultural soils is a function of the soil temperature and soil water content [19,20]. Sewage sludge is a slow-release fertilizer compared to inorganic fertilizers. The plant availability of N from sludge for the current study is estimated based on laboratory incubation studies conducted by [21] adjusted to site-specific release rates using the Swb-Sci model [22]. The model was previously validated with independent data sets [19]. This study considered an anaerobically digested ferric chloride treated sludge, which was used to calibrate and validate the SWB-Sci model. The sludge had mean N, P, and K contents of 3%, 2%, and 0.3%, respectively. Computer model simulation of nitrogen mineralization from the above mentioned sludge reached a steady release rate following four consecutive years of sludge application in the semi-arid, sub-humid, humid, and super-humid zones. In the arid agro-ecological zone, however, it took longer. For the current study, however, four years was used for the steady state mineralization rate in arid zones. According to the model simulation results, the rate of N mineralization at steady state from anaerobically digested sludge dried on concrete beds was 24% for arid zone, 28% for semi-arid, 29% for sub-humid zone, 37% for humid zone, and 42% for super-humid zone [22].
The plant availability of P from the candidate sludge was estimated based on studies conducted by [23]. While K from sludge was considered as 100% plant available. In most cases sludge is applied according to crop N requirements, which results in excess P application but under fertilization of K because sludge is a poor source of K (0.3%). According to [23], the mean relative availability of P from ferric chloride treated sludge was about 65% of the total P applied. For the sludge economic value computation, however, only the amount of P needed by crops to satisfy crop requirements for a given target yield was used. Sludge application rate across zones and sites was estimated based on the annual sludge nitrogen release rates adjusted to match the crop N requirements (Table 2).
The sludge recommendation rate for each agro-ecological zone was calculated using Equation (1).
Sludge recom. = Crop N requirement/(Mineralization rate ∗ Sludge N)
where
  • Crop N requirement is the crop N requirement (metric ton ha−1),
  • Sludge recom. is the sludge recommendation rate (metric ton ha−1),
  • Mineralization rate is the annual N release rate of the sludge (%), and
  • Sludge N is the nitrogen content of the sludge (%).

2.2.3. Assumptions on Costs of Sludge, Commercial Fertilizer, and Maximum Selling Price

The total cost of using sludge on farms where sludge is applied according to crop nutrient requirement includes the transportation cost of delivering sludge from wastewater care works to the farm (TRCS) and the spreading cost (SPCS). According to the reports from wastewater care works, the TRCS mainly depends on the distance between wastewater care work and the farm (D (km)), the number of loads (N (ha−1)), and the rate of the truck (r ($ km−1)). The rate of the truck (r) varies from place to place according to the agreement made between wastewater managers and transporters. In most cases the rate of 30 ton trucks is between $3.61 and $4.16 per km (source: Visser Plant Hire) and in this study it is assumed to be $4.02 per km. The r is also defined as the transportation cost of sludge per km per load. According to the reports from wastewater care works, the transportation cost of sludge is then calculated by (TRCS = DNr) (Source: Visser Plant Hire). A similar equation was used to calculate the transportation cost of commercial fertilizer (TRCC = DNr).
Most commercial farmers use lime spreader to apply sludge on farms. According to the information from Agri Precision Services, the spreading cost of sludge (SPCS) or spreading cost of commercial fertilizer (SPCF) per ton was $3.83 (Source: Agri Precision Services).
In this economic evaluation it was assumed that the maximum selling price of sludge (MSP) should be less than the total cost of commercial fertilizer (TCCF) and greater or equal to the total cost of sludge (TCS). If the MSP of sludge is <TCCF and ≥ to the TCS, it is fair enough to transport the sludge to the designated farm.

2.3. Economic Interpretations

Economic interpretations are systems of simultaneous equations with an equal or greater number of economic variables [25]. This economic evaluation allows both the economic value of sludge as fertilizer and costs to be calculated and compared using the following criteria. The economic value of sludge is the total value of available nutrients from sludge (TVANS ($ ha−1)) and is computed using Equation (2).
TVANS = TVAN + TVUP + TVAK
where
  • TVAN is the total value of plant available nitrogen per ton of sludge ($ ha−1),
  • TVUP is the total value of phosphorus used by plants per ton of sludge ($ ha−1), and
  • TVAK is the total value of available potassium per ton of sludge ($ ha−1).
The total cost (TCS) incurred for a maximum economic distance (MED) that the sludge can be transported should be less than or equal to TVANS (Equation (2)). This is due to the transportation cost of sludge because its economic value diminishes with increase in distance between the wastewater care work and the farm. Therefore, the MED is the distance (km) where the total costs of sludge (TCS) is ≤ TVANS. The total cost of sludge (TCS) ($ ha−1) is computed using Equation (3).
TCS = TRCS + SPCS
where TRCS is the transportation cost of sludge ($ ha−1) and SPCS is the spreading cost of sludge ($3.83 ha−1 default value used in this study).
The economic evaluation also used Equation (4) to estimate the total cost of commercial fertilizer (TCCF ($ ha−1)) to meet the crop requirement. The TCCF is the sum of the total prices of nutrients from commercial fertilizer (TPNCF ($ ha−1)), the transporting cost (TRCC (S ha−1)), and the spreading cost (SPCC ($ ha−1)) of inorganic fertilizers.
TCCF = TPNCF + TRCC + SPCC
where TPNCF = TPCN + TPCP+ TPCK and
  • TPCN is the total price of commercial inorganic nitrogen fertilizer ($ ha−1),
  • TPCP is the total price of commercial inorganic phosphorus fertilizer ($ ha−1),
  • TPCK is the total price of commercial inorganic potassium fertilizer ($ ha−1),
  • TRCC is the transportation cost of commercial inorganic fertilizer ($ ha−1), and
  • SPCC is the spreading cost of commercial inorganic fertilizer ($3.83 ha−1 default value used in this study).
The maximum selling price of sludge (MSP) ($ metric-ton−1) is then computed using Equation (5):
MSP = (TCCF − TCS)/Sludge recom
A flow diagram indicating the relationship among the various equations used to compute MED and MSP is presented in Figure 1.

2.4. Study Site

Economic evaluation was done to complete the cost–benefit analysis of using sludge as a fertilizer on selected cities for five of the six major agro-ecological zones of South Africa (Table 3) using commercial fertilizer as a bench mark. Site selection depended on the availability of maize yield and commercial fertilizer data. The potential maize yield of the representative sites and commercial inorganic fertilizer recommendations for each site were obtained from the fertilizer society of South Africa’s guideline [24,26] (Table 3).
Sludge application rate was estimated based on the annual sludge nitrogen release rates for each site adjusted to match the crop N requirements (Table 3, column 8). Maize was selected as the test crop because it is one of the most widely cultivated crops across the globe and accounts for 51% of the cultivated land in South Africa [27].

3. Results and Discussion

3.1. Economic Value of Sludge as Fertilizer

The economic value of sludge as fertilizer is the total value of available nutrients from sludge (TVANS). To assess the economic value of sludge as fertilizer across five of the six South African agro-ecological zones, an anaerobically digested sludge dried in concrete beds with 3% N, was used. The land size used for this assessment was 1 ha. The TVANS ranged from $ 80.86 in arid lands, where the sludge recommendation rate is 5.1 t ha−1, to $ 354.06 in super-humid agro-ecological zone, with sludge recommendation rates of 13.5 t ha−1 (Table 4). Results from this study showed that TVANS varied significantly across South African agro-ecological zones (Table 4). This is mainly because sludge application rate is dictated by the crop nitrogen requirement, which is influenced by the climate, in particular rain and temperature. For instance, in the arid agro-ecological zone of Kimberley the TVANS ($108.42) was three times lower than in the super-humid zone of Nelspruit ($354.06) (Table 4). This is mainly due to the lower rainfall, and therefore lower crop nutrient requirements, lower N availability, and sludge recommendations (Table 3, column 8) in Kimberly (6.54 t ha−1) than in Nelspruit (13.5 t ha−1). The total value of available nutrients from sludge also varied between sites within an agro-ecological zone. For instance, in the sub-humid agro-ecological zone, the TVANS in Johannesburg ($258.53) was 20% higher than that in Port Alfred and Bethlehem ($207.29). Similarly, in the humid zone the TVANS in Durban ($318.96) was 17% higher than that in Cape Town and East London ($264.13).
Generally, it is believed that areas with higher rainfall need higher nutrient requirements, which is true, and therefore higher sludge application rate, which may or may not be true. For instance, this study showed that sludge recommendations for the humid zone of Johannesburg (790 mm rain) is 13.8 metric-t ha−1 compared to that of Nelspruit (1003 mm rain) in the super-humid zone, with sludge recommendation rates of 13.5 metric-t ha−1. This is mainly attributed to the higher sludge decomposition rate and therefore higher nutrient availability from a given mass of sludge in Nelspruit (42%) compared to that in Johannesburg (37%).

3.2. Cost of Sludge vs. Cost of Commercial Inorganic Fertilizer

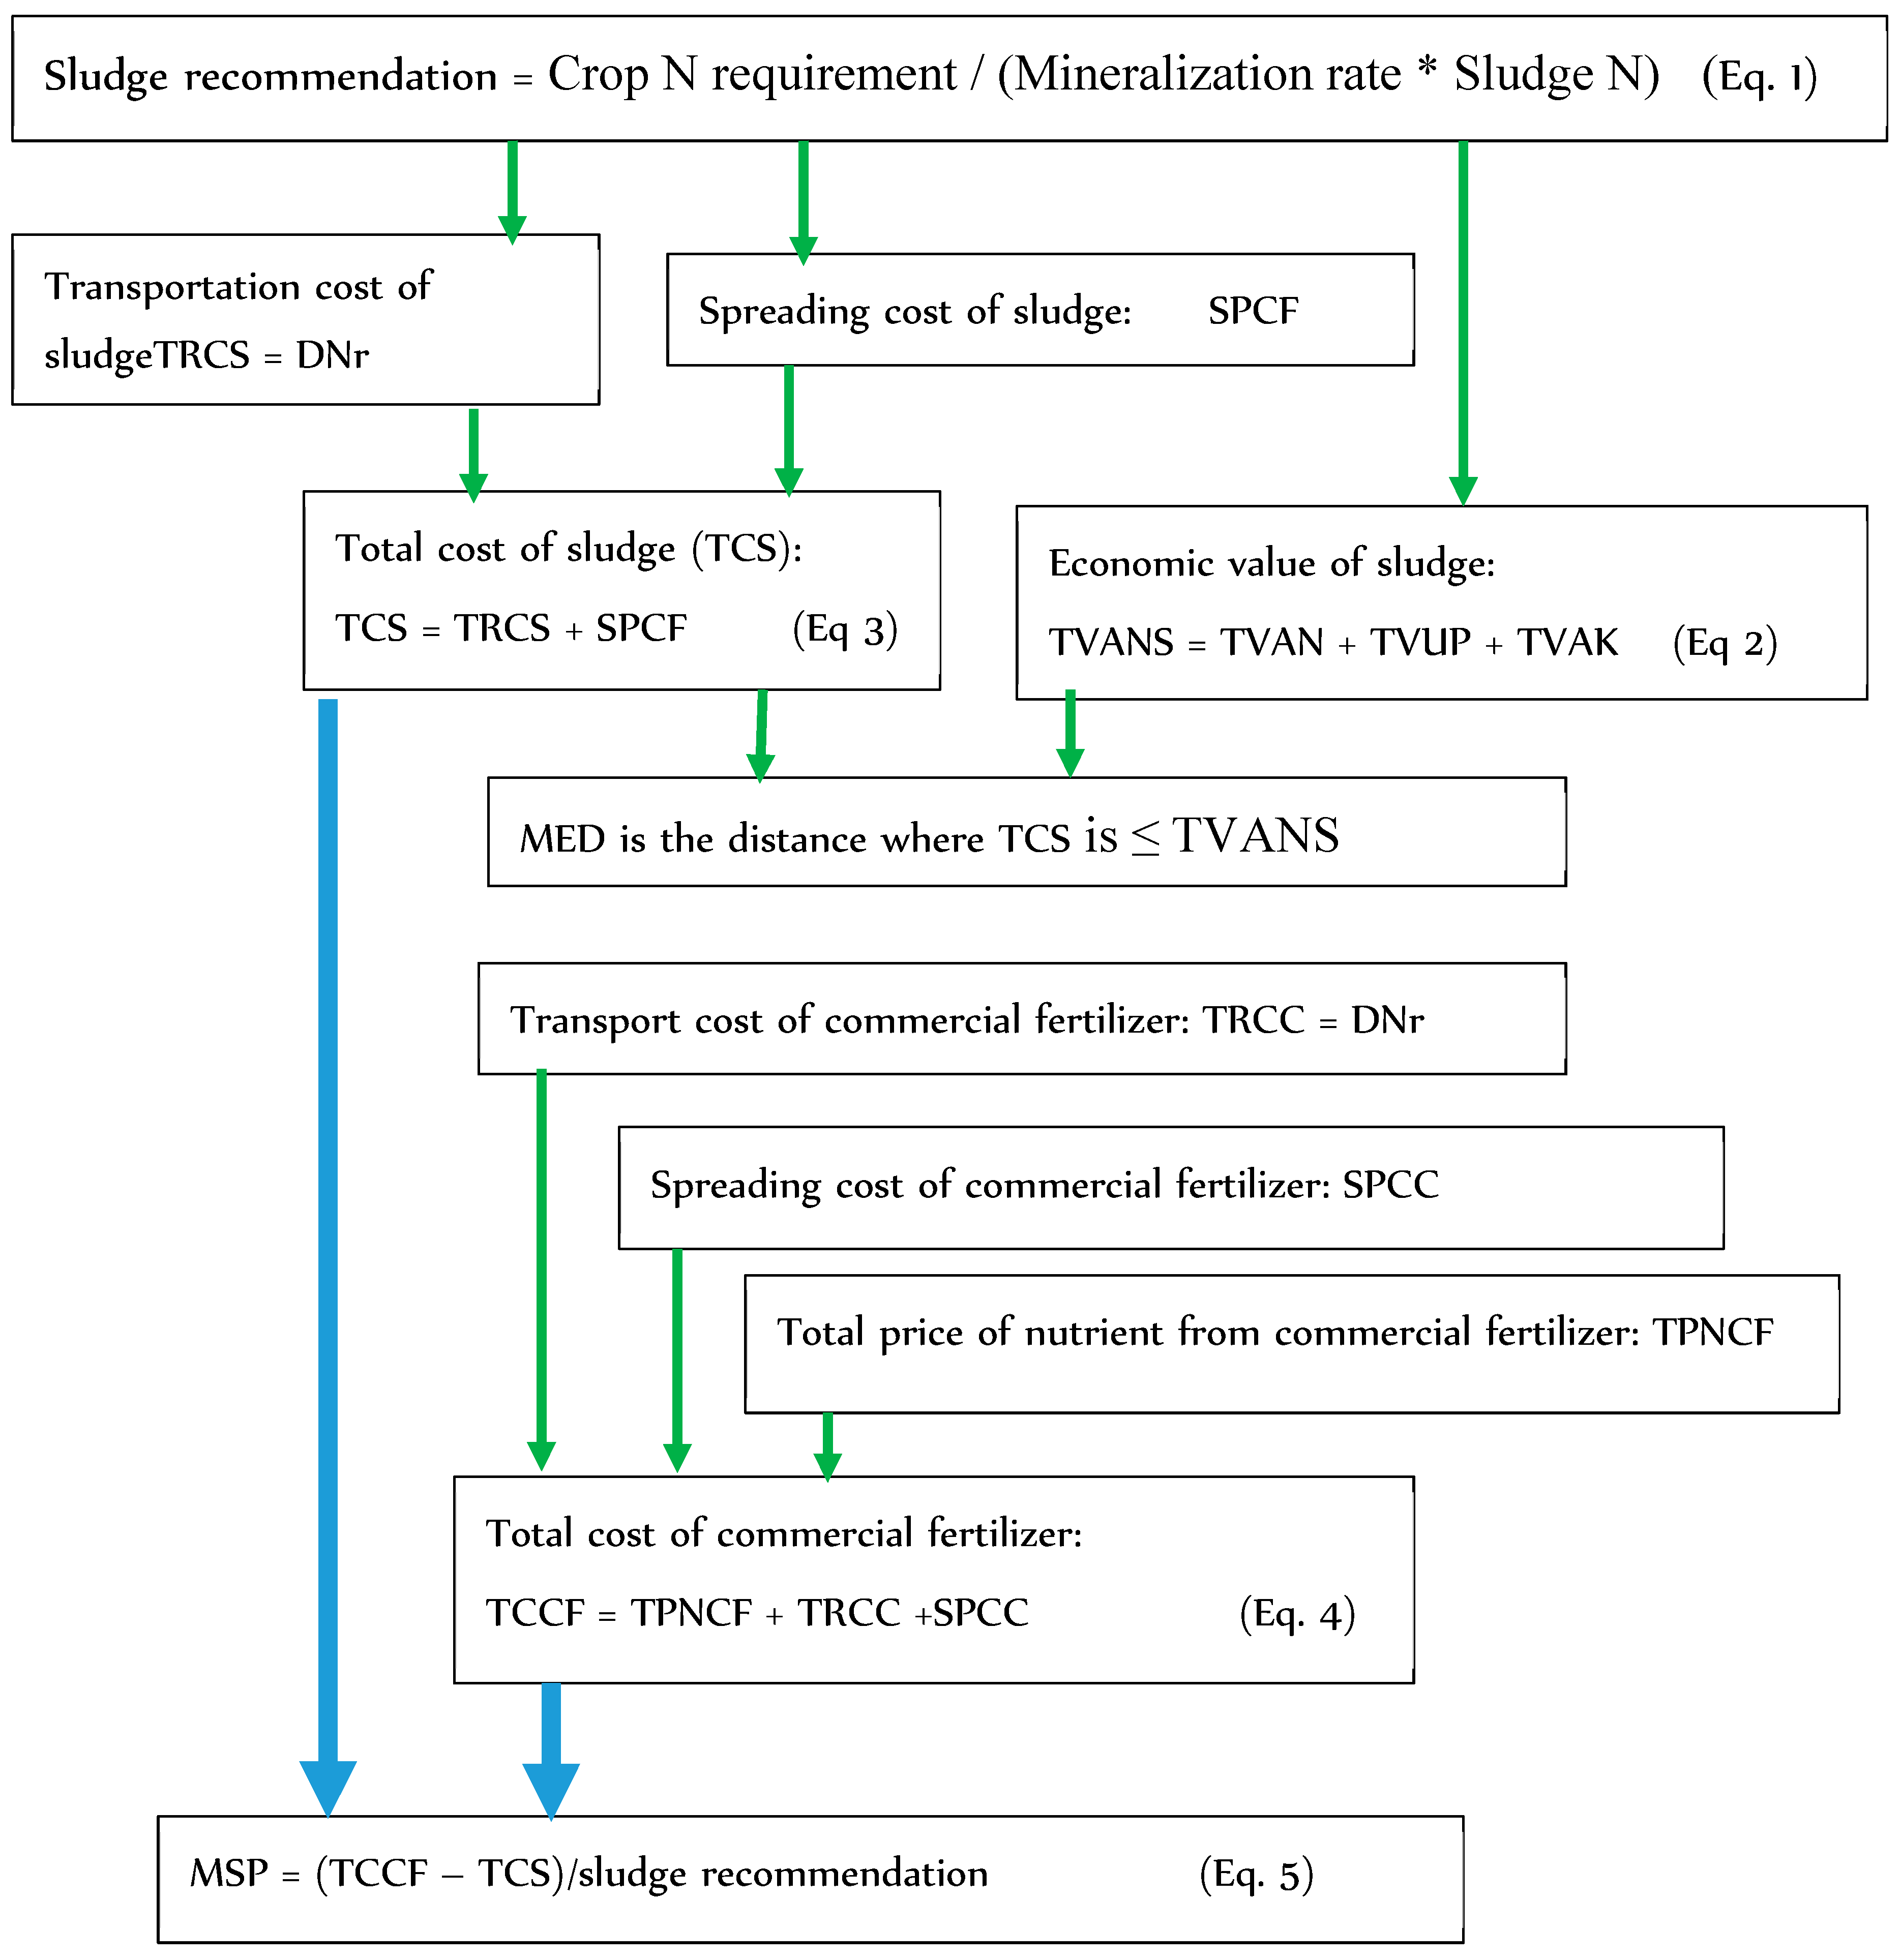
In order to assess the economic feasibility of using sludge as a low-grade fertilizer, a preliminary total cost comparative analysis was done between commercial inorganic fertilizer and municipal sludge applied according to crop N requirements to 1 ha of land within a 1 km perimeter of a wastewater treatment plant. As described in the Materials and Methods section, the total cost of commercial inorganic fertilizer includes the sum of the nutrient prices (TPNCF), the transporting cost (TRCC), and the spreading cost (SPCC). The total cost for sludge, however, includes the transport and the spreading costs only.
The results show that the total cost of commercial fertilizer (TCCF) was higher than the total cost of sludge (TCS) (Table 5) across South African agro-ecological zones.
The TCCF was four times higher in the arid and eight times in the super-humid than TCS. For instance, in the arid city of Kimberley the TCS ($28.92) was a quarter of the TCCF ($121.33) (Table 5). Similarly, in the super-humid zone of Nelspruit the TCS ($55.73) was one eighth of the TCCF ($441.58). The main factor that contributed to the consistent increase of the TCCF across all zones and sites in South Africa was the price of nutrients (N, P, and K). In contrast, the spreading cost of commercial fertilizer (SPCC) was a quarter of the sludge spreading cost (SPCS) in arid zones and one eighth of that in humid zone. This is mainly due to the higher nutrient content and therefore low mass of commercial fertilizer (Table 3, columns 5–7) needed to be spread to meet crop requirements compared to sludge (Table 3, column 8). For instance, the spreading cost of sludge (13.8 ton) to satisfy dryland maize nutrient requirements planted on 1 ha of land in the sub-humid agro-ecological zone of Johannesburg is $52.85. This is in contrast to the spreading cost of a commercial inorganic fertilizer applied to satisfy similar crop demands ($4.22). The main costs of sludge use in agricultural lands, spreading and transport costs, are both sensitive to sludge application rates while the transport cost is also sensitive to the distance between the wastewater treatment plant and the farm. Therefore, it is of vital importance to assess the maximum economic distance that sludge can be used as a low-grade fertilizer.

3.3. Maximum Economic Distance of Sludge

The maximum economic distance (MED) of sludge is the predicted economic distance that the sludge can be transported. It is the distance (D) where the total cost of sludge (TCS) is less than or equal the total price of available nutrients from sludge (TVANS) (Equation (2)). The economic distance (perimeter around water care works) in which sludge could be used as a low-grade fertilizer varied across agro-ecological zones: 20 km in arid, 28 km in semi-arid, 51 km in sub-humid, 66 km in humid, and 75 km in super-humid agro-ecological zones (Table 6).
The economic distance estimated in this study, however, could vary depending on the sludge N content and the real-time fertilizer price. Therefore, computations to assess economic distance to use sludge as a nutrient source should use real-time commercial inorganic fertilizer price, sludge N content, sludge nutrient release rate, and the distance between the wastewater treatment plant and the farm.

3.4. Economic Feasibility of Selling Sludge

In this economic evaluation, it was assumed that the maximum selling price (MSP) of sludge should be less than the total cost of commercial inorganic fertilizer (TCCF) and greater or equal to the total cost of sludge (TCS). Results from the current study show that MSP varied across agro-ecological zones ranging from $14.22 per metric-ton in the arid zone to $28.58 per metric-ton in the super-humid zone (Table 7). This variation is attributed mainly to the concurrent increase of TCCF with the availability of rainfall (Table 7). The increase in the MSP observed with the increase in the rainfall regime is attributed mainly to the relative increase in the N mineralization per unit mass of sludge added, which resulted in a relatively lower sludge application rate increment per additional crop N requirement. The commercial inorganic fertilizer required per unit crop N demand, however, increased almost linearly leading to higher total cost of fertilizer (TCCF).
The current study shows that it is economically feasible to sell sludge within a given perimeter around wastewater plants, depending on the agro-ecological zone. Recent statistics from [28] suggest that farmers’ perceptions of the fertilizer value of organic manures are poor, but Table 5 and Table 7 showed that farmers have major expenses and consistent increases in commercial inorganic fertilizer compared with municipal sludge. Farmers will have the highest improvement in savings for nutrients supplied from municipal sludge, which could result in a major savings in fertilizer costs without loss of yield and with less environmental pollution.

4. Conclusions

The economic value of using sludge in agricultural lands varied across agro-ecological zones. The lowest economic value was in the arid zone, increasing with the availability of rainfall, to the highest value in the super-humid zone. Similarly, the maximum economic distance that sludge can be transported economically increased with the availability of rainfall. Therefore, the economic feasibility of using sludge as a replacement for or complementary to commercial inorganic fertilizer is dictated by the distance between the wastewater works and the farm (transport costs), sludge nutrient concentration, agro-ecological zone (rain and temperature), and current commercial inorganic fertilizer price. The methodology used in the current investigation was conservative for it relied only on measurable factors and excluding other biosolid benefits that are difficult to measure. Some of the benefits that are difficult to measure and were excluded include improved soil quality in biosolid-amended soils and avoided costs of non-beneficial disposal. Hence, in light of these additional but hard to measure factors, the hauling distance could increase beyond the recommended distance.

Author Contributions

Conceptualization, E.H.T.; Formal analysis, Z.M.O.; Funding acquisition, E.H.T.; Investigation, Z.M.O.; Methodology, Z.M.O., E.H.T., and Y.G.; Project administration, E.H.T.; Supervision, E.H.T., J.G.A., and Y.G.; Writing—original draft, Z.M.O.; Writing—review and editing, E.H.T., J.G., and Y.G. All authors have read and agreed to the published version of the manuscript.

Funding

The research was funded by the Water Research Commission of South Africa (WRC) (Project title: Quantifying the fertilizer value of municipal sludges for agriculture. Grant number K5/2131/3). The authors would like also to sincerely acknowledge funding from EnviSafeBioC project-contract No PPI/APM/2018/1/00029/U/001 for funding. The project is financed by the Polish National Agency for Academic Exchange.

Acknowledgments

The authors would like to express their appreciation and gratitude to East Rand Water Care Works (ERWAT) for providing land to conduct the long-term field trial.

Conflicts of Interest

The authors declare no conflict of interest.

References

  1. UN General Assembly. Transforming Our World: The 2030 Agenda for Sustainable Development, 21 October 2015, A/RES/70/1. Available online: https://www.refworld.org/docid/57b6e3e44.html (accessed on 19 November 2020).
  2. Hamdia, H.; Hchmia, S.; Khelilb, M.N.; Zoghlama, L.R.; Benzartic, S.; Mokni-Tlilia, S.; Hassena, A.; Nedidia, N. Repetitive land application of urban sewage sludge: Effect of amendment rates and soil texture on fertility and degradation parameters. Catena 2019, 172, 11–20. [Google Scholar] [CrossRef]
  3. Urra, J.; Alkorta, I.; Mijangos, I.; Epelde, L.; Garbisu, C. Applcation of sewage sludge to agricultural soil increases the abundance of antibotic resistance genes without altering the composition of prokaryotic communities. Sci. Total Environ. 2019, 647, 1410–1420. [Google Scholar] [CrossRef] [PubMed]
  4. Zuo, W.; Gu, C.; Zhang, W.; Xu, K.; Wang, Y.; Bai, Y.; Shan, Y.; Dai, Q. Sewage sludge amendment improved soil properties and sweet sorghum yield and quality n a newly reclaimed mudflat land. Sci. Total Environ. 2019, 654, 541–549. [Google Scholar] [CrossRef] [PubMed]
  5. Nicholson, F.; Bhogal, A.; Taylor, M.; McGrath, S.; Withers, P. Long-term effects of biosolids on soil quality and fertility. Soil Sci. 2018, 183, 89–98. [Google Scholar] [CrossRef]
  6. Snyman, H.G.; Herselman, J.E. Guidelines for the Utilisation and Disposal of Waste Water Sludge; WRC Rep. TT 262/06; Water Research Commission: Pretoria, South Africa, 2006. [Google Scholar]
  7. U.S. EPA. A Plain English Guide to the EPA Part 503 Biosolids Rule; EPA/832/R-93/003; U.S. EPA: Washington, DC, USA, 1994.
  8. Snow, D.D.; Cassada, D.A.; Biswas, S.; Malakar, A.; D’Alessio, M.; Carter, L.J.; Johnson, R.D.; Sallach, J.B. Detection, occurrence, and fate of emerging contaminants in agricultural environments. Water Environ. Res. 2019, 91, 1103–1113. [Google Scholar] [CrossRef] [PubMed]
  9. Grobelak, A.; Grosser, A.; Kacprzak, M.; Kamizela, T. Sewage sludge processing and management in small and medium-sized municipal wastewater treatment plant-new technical solution. J. Environ. Manag. 2019, 234, 90–96. [Google Scholar] [CrossRef] [PubMed]
  10. Kominko, H.; Gorazda, K.; Wzorek, Z. The possiblity of organo-mineral fertilizer production from sewage sludge. Waste Biomass Valor. 2017, 8, 1781–1791. [Google Scholar] [CrossRef] [Green Version]
  11. Tesfamariam, E.H.; Annandale, J.G.; Steyn, J.M.; Truter, W.F.; Debusho, L.K.; Talore, D.G. Yield, resource use efficiency and trace metal uptake of weeping lovegrass grown on municipal sludge-amended soil. J. Sci. Food Agric. 2018, 98, 478–486. [Google Scholar] [CrossRef] [PubMed]
  12. Cogger, C.G.; Bary, A.I.; Sullivan, D.M.; Myhre, E.A. Biosolids processing effects on first and second year available nitrogen. Soil Sci. Soc. Am. J. 2004, 68, 162–167. [Google Scholar] [CrossRef]
  13. Sharpley, A.N.; Bergström, L.; Aronsson, H.; Bechmann, M.; Bolster, C.H.; Börling, K.; Djodjic, F.; Jarvie, H.P.; Schoumans, O.F.; Stamm, C.; et al. Future agriculture with minimized phosphorus losses to waters: Research needs and direction. Ambio 2015, 44, 163–179. [Google Scholar] [CrossRef] [PubMed] [Green Version]
  14. Drummond, M. Economic Evaluation in health care: Is it really useful or are we just kidding ourselves? Aust. Econ. Rev. 2004, 37, 3–11. [Google Scholar] [CrossRef]
  15. Tesfamariam, E.H.; Annandale, J.G.; Steyn, J.M.; Stirzaker, R.J.; Mbakwe, I. Municipal sludge as source of nitrogen and phosphorus in perennial pasture Eragrostis curvula production: Agronomic benefits and environmental impacts. Water SA 2013, 39, 507–514. [Google Scholar] [CrossRef] [Green Version]
  16. Ogbazghi, Z.M.; Tesfamariam, E.H.; Annandale, J.G.; De Jager, P.C. Mobility and uptake of Zinc, Cadmium, Nickel, and Lead in sludge-amended soils planted to dryland maize and irrigated maize-oat rotation. J. Enviorn. Qual. 2014. [Google Scholar] [CrossRef] [PubMed] [Green Version]
  17. Lumen Boundless Economics. Economics Model. Available online: https://courses.lumenlearning.com/boundless-economics/chapter/economic-models/ (accessed on 19 November 2020).
  18. Spellman, F.R. Wastewater treatment operations. Math Concepts and Calculations, 2nd ed.; CRS Press: Boca Raton, FL, USA, 2014; pp. 125–131. [Google Scholar]
  19. Tesfamariam, E.H.; Annandale, J.G.; Steyn, J.M.; Stirzaker, R.J.; Mbakwe, I. Use of the SWB-Sci model for nitrogen management in sludge amended land. Agric. Water Manag. 2015, 152, 262–276. [Google Scholar] [CrossRef] [Green Version]
  20. Guntiňas, M.E.; Leiros, M.C.; Trasar-Cepeda, C.; Gil-Sotres, F. Effects of moisture and temperature on net soil nitrogen mineralization: A laboratory study. Eur. J. Soil Biol. 2012, 48, 73–80. [Google Scholar] [CrossRef]
  21. Malobane, M.E. Using the Organic Carbon Fractions of the Van Soest Method to Determine Compounds Responsible for C and N Mineralization from Sludge Amended Soils. Master’s Thesis, University of Pretoria, Pretoria, South Africa, 2014; pp. 56–64. [Google Scholar]
  22. Ogbazghi, Z.M.; Tesfamariam, E.H.; Annandale, J.G. Modelling N mineralisation from sludge-amended soils across agro-ecological zones: A case study from South Africa. J. Ecol. Model. 2016, 322, 19–30. [Google Scholar] [CrossRef]
  23. Van der Merwe, P. Phosphorus Phyto-Availability and Fertilizer Value of Petrochemical and Municipal Wastewater Sludges. Master’s Thesis, University of Pretoria, Pretoria, South Africa, 2014; pp. 34–40. [Google Scholar]
  24. Fertilizer Society of South Africa. Fertilizer handbook. The Fertilizer Society of South Africa, 6th ed.; FSSA: Edenvale, South Africa, 2007; pp. 99–123.
  25. Ayalew, W.; King, J.M.; Bruns, E.; Rischkowsky, B. Economic evaluation of smallholder subsistence livestock production: Lessons from an Ethiopian goat development program. Ecol. Econ. 2003, 45, 473–485. [Google Scholar] [CrossRef] [Green Version]
  26. Du Plessis, J. Maize Production; Department of Agriculture, ARC-Grains Crop Institute, RSA: Pretoria, South Africa, 2003; Available online: www.nda.agric.za/publications (accessed on 19 November 2020).
  27. FAO. Fertilizer Use by Crops in South Africa; FAO: Rome, Italy, 2005. [Google Scholar]
  28. Chalmers, A.G.; Church, B.M.; Dyer, C.J.; Leech, P.K. Survey of fertiliser practice. Fertiliser use on farm crops. In England and Wales 1990; ADAS/FMA: London, UK, 1991. [Google Scholar]
Figure 1. Flow diagram indicating the relationship among the various equations (Equations (1) to (5)) used in this study.
Sustainability 12 09950 g001
Table 1. Fertilizer price in March 2020 in the market, South Africa.
Fertilizer TypePlant Available (%)Price (USD kg−1)
LAN, KAN281.14
H2PO419.62.46
KCl500.92
Table 2. Sludge recommendation rates (metric tons ha1) for maize grown on farms around selected South African cities across five South African agro-ecological zones. (Sludge recommendation rates (Equation (1)) are estimated based on crop N requirements according to recommendations by the Fertilizer Society of South Africa [24]).
Agro-Ecological ZoneSelected SitesCrop N RequirementSludge RecommendationNutrients Added when Sludge Added According to Crop N Requirement
PK
(kg ha−1)(Metric Ton ha−1)(kg ha−1)(kg ha−1)
Arid (ARD)Springbok (SPB)375.110215.3
Kimberley (KM)476.513019.5
Semi-arid (SMA)Bloemfontein (BLM)758.917826.7
Rustenburg (RST)738.717426.1
Polokwane (PLK)657.715423.1
Sub-humid (SUH)Johannesburg (JHB)12013.827641.4
Port Alfred (PA)9010.320630.9
Bethlehem (BTL)9010.320630.9
Humid (HM)Durban (DBN)15013.527040.5
East London (EL)13011.723435.1
Cape Town (CT)13011.723435.1
Super-humid (SPH)Nelspruit (NLS)17013.527040.5
NB: the values used in the crop N requirement (column 3) are mean values.
Table 3. Potential maize yield and annual commercial fertilizer and sludge application rate recommendations (Equation (1)) for selected sites across South African agro-ecological zones for soils with clay content >25% [24].
Agro-Ecological ZoneSelected SitesMean Annual Rainfall (mm)Potential Maize Yield (Metric-t ha−1)Commercial FertilizerSludge Recommendation (Metric-t ha−1)
N (kg ha−1)P (kg ha−1)K (kg ha−1)
Arid (ARD)Springbok (SPB)222.52.5–33710205.1
Kimberley (KM)3544.54715256.5
Semi-arid (SMA)Bloemfontein (BLM)478.46.5–77525458.9
Rustenburg (RST)465.86.57325458.7
Polokwane (PLK)391.866620357.7
Sub-humid (SUH)Johannesburg (JHB)790.98–9120349013.8
Port Alfred (PA)756.77–890317010.3
Bethlehem (BTL)725.77–890317010.3
Humid (HMDurban (DBN)965.710–10.51504510513.5
East London (EL)806.48–9130349011.7
Cape Town (CT)811.88–9130349011.7
Super-humid (SPH)Nelspruit (NLS)1003.311–121705012513.5
NB: the values used in the crop N requirement (column 5) are mean values.
Table 4. Sludge application rate (Equation (1)) and total value of available nutrients from sludge (TVANS (Equation (2))) applied to 1 ha of agricultural land of rain-fed maize according to crop N requirement [24] across sites within ago-ecological zones in South Africa.
ZoneSiteSludge Rate (Metric-t ha−1)Total Value of Available Nutrients from Sludge (TVANS) ($)TVANS ($ ha−1)
Avail N (kg)Price N ($ ha−1)Avail P (kg)Uptake P (kg)Price P ($ ha−1)Avail K (kg)Price K ($ ha−1)
ARDSPK5.13742.18961024.6015.314.0880.86
KM6.54753.581221536.9019.517.94108.42
SMABLM8.97585.501682561.5026.724.56171.56
RST8.77383.221642561.5026.124.01168.73
PLK7.76574.101452049.2023.121.25144.55
SUHJHB13.8120136.802603483.6441.438.09258.53
PA10.390102.601943176.2630.928.43207.29
BTH10.390102.601943176.2630.928.43207.29
HMDBN13.5150171.0025445110.7040.537.26318.96
EL11.7130148.202213483.6435.132.29264.13
CT11.7130148.202213483.6435.132.29264.13
SPHNLS13.5170193.8025450123.0040.537.26354.06
NB: Avail = Available.
Table 5. The total costs of sludge (TCS (Equation (3))) vs. total cost of commercial fertilizer (TCCF (Equation (4))) across sites to meet rain-fed maize nutrient requirements [24] planted on 1 ha of land within a 1 km perimeter of a wastewater treatment plant.
ZoneSiteCosts of SludgePrices of Commercial Fertilizer
TRCS ($ ha−1)SPCS ($ ha−1)TCS ($ ha−1)TPNCF ($ ha−1)TRCC ($ ha−1)SPCC ($ ha−1)TCCF ($ ha−1)
ARDSPK4.0219.5323.5585.184.023.8393.03
KM24.9028.92113.483.83121.33
SMABLM34.0938.11188.403.83196.25
RST33.3237.34186.123.83193.97
PLK29.4933.51156.643.83164.49
SUHJHB52.8556.87303.244.22311.48
PA39.4543.47243.263.83251.11
BTH39.4543.47243.263.83251.11
HMDBN51.7155.73378.305.37387.69
EL44.8148.83314.643.83322.49
CT44.8148.83314.643.83322.49
SPHNLS51.7155.73431.805.76441.58
Table 6. The total value of available nutrients (TVANS (Equation (2))) from sludge compared to the total cost of sludge (TCS (Equation (3))) at varying distances (d) for 1 ha of agricultural farm.
D (km)KimberleyPolokwaneJohannesburgDurbanNelspruit
TCS ($ ha−1)TVANS ($ ha−1)TCS ($ ha−1)TVANS ($ ha−1)TCS ($ ha−1)TVANS ($ ha−1)TCS ($ ha−1)TVANS ($ ha−1)TCS ($ ha−1)TVANS ($ ha−1)
128.92108.4233.51144.5556.87258.5355.73318.9655.73354.06
440.9845.5768.9367.7967.79
857.0661.6585.0183.8783.87
1273.1477.73101.0999.9599.95
1689.2293.81117.17116.03116.03
20105.30109.89133.25132.11132.11
21109.32113.91137.27136.13136.13
22117.93141.29140.15140.15
28142.05165.41164.27164.27
29146.07169.43168.29168.29
30173.45172.31172.31
51257.87256.73256.73
52261.89260.75260.75
66317.03317.03
67321.05321.05
75353.21
76357.23
77
Table 7. Maximum selling price (MSP (Equation (5))) per ton of sludge derived from TCS (Equation (3)), TCCF (Equation (4)), and sludge recom. (Equation (1)) for selected sites across zones in South Africa.
ZoneSiteTCS ($ ha−1)TCCF ($ ha−1)Sludge Recom. (metric-t ha−1)MSP metric-ton−1 ($)
AridKimberley28.92121.336.514.22
Semi-aridPolokwane33.51164.497.717.01
Sub-humidJohannesburg56.87311.4813.818.45
HumidDurban55.73387.6913.524.59
Super-humidNelspruit55.73441.5813.528.58
Publisher’s Note: MDPI stays neutral with regard to jurisdictional claims in published maps and institutional affiliations.

