Home Country Institutions and Outward FDI: An Exploratory Analysis in Emerging Economies


1
Facultad de Ciencias Naturales e Ingeniería, Universidad Jorge Tadeo Lozano, Bogotá 11001, Colombia
2
Escuela de Administración, Universidad del Rosario, Bogotá 11001, Colombia
3
Facultad de Ciencias Económicas y Sociales, Universidad de La Salle, Bogotá 11001, Colombia
*
Author to whom correspondence should be addressed.
Sustainability 2020, 12(23), 10010; https://doi.org/10.3390/su122310010
Submission received: 3 October 2020
/
Revised: 26 November 2020
/
Accepted: 27 November 2020
/
Published: 30 November 2020
(This article belongs to the Special Issue FDI and Institutional Quality: New Insights and Future Perspectives from Emerging and Advanced Economies)
Abstract
:Although the internationalization of economies is driven by specific industry conditions or business-specific differences, the institutions that exist as background conditions directly determine firms’ strategies and interactions in the international environment. This paper contributes to the discussion on the relationship between institutional quality and outward FDI (OFDI). We used 30 indicators in 48 emerging economies in the period 2007–2017; we collected the indicators from alternative secondary sources. After we applied Factor Analysis, six factors were retained. We named the components as follows: “Transparency of government” (F1), “Research, development and innovation, R&D+I” (F2), “Inequality” (F3), “Rules on inward FDI (IFDI)” (F4), “Education and training” (F5), and “Financial market” (F6). The panel data model outcomes suggest that Factor 2, Research, development and innovation, has a significant and positive effect on OFDI. Factor 6, the Financial market, has a significant and negative effect on OFDI. When we include lagged values of OFDI stocks the results also show that the government measures transparency positively and significantly affects OFDI stocks. These findings imply that the institutional environment creates two streams of OFDI: leverage and escapism.
1. Introduction
Institutions are crucial for understanding the shape of human interaction. “In consequence, they structure incentives in human exchange, whether political, social, or economic” [1]. After the publication of North’s work, the institutionalist literature increased exponentially, allowing the use and debate of the concept in many fields, from economics to politics and management. Many development economists and academics from sociology, anthropology and political science recognized the consistency of North’s arguments; they were sure of the value of their insights into the development process and, in particular, into the economic significance of institutions other than markets. The works of Ostrom [2] and Acemoglu, Johnson and Robinson [3] are under the influence of North’s work, and they are the basis of the analysis that influenced the literature in development, internationalization and competitiveness.
In this sense, it is widely acknowledged, both on empirical and theoretical discussions, that the institutional quality is closely related to growth and economic development. The set of institutions (inclusive and extractive) in a specific economy is called the institutional framework [3,4,5,6,7].
It is also widely accepted that the internationalization of economies is not only driven by specific industry conditions [8] or business-specific differences [9] but also by the institutions that exist as background conditions that directly determine the strategies and interactions of firms with the institutional environment [10,11,12,13,14,15,16,17,18,19,20].
Home country institutions’ importance for economic actors’ performance is well known in the literature [1,21,22]. Extant literature regarded the home market’s structural environment as either supportive or constraining decisions for foreign expansion. The rationale is that strategic decisions, such as the outward FDI (OFDI) undertaking, are guided by industrial and firm-specific resources and reflect the formal and informal supports-constraints faced by managers in a specific institutional context.
Literature shows two different structural forces that influence firms’ OFDI decisions from emerging markets [23]. On the one hand, in emerging markets, institutional environments are troubled by a poor defense of property rights, insufficient laws and judicial regulation, an unpredictable political climate and other ineffective institutions that serve the sector. In essence, these inefficiencies affect the availability and quality of factor inputs and thus limit companies’ production pursuits. Therefore, internationalization is a reaction to the escape of domestic markets from the stifling bureaucratic climate. On the other hand, emerging markets governments promote local companies through a combination of formal and informal incentives to seek international expansion [23]. Despite their lack of clear ownership benefits, such institutional support helps emerging market firms resolve foreign liability and seek international expansion. Firms would have a distinct tendency to adapt to the stresses of the home country’s institutional environment.
For this study, we reviewed works with an explicit focus on the institutional framework in emerging economies. We established three criteria to identify relevant articles to analyze within the limits of the present study: (1) that they describe the role of institutions in emerging economies; (2) that they are published in journals (Q1 and Q2) that can be accessed through Scopus; and (3) that they are published between the years 2000 and 2020. The findings of the literature review will be discussed in detail in Section 3.
Nonetheless, significant literature focuses on establishing the relation between institutional quality and OFDI [24,25,26,27,28,29,30,31,32,33,34,35]; this paper contributes to the existing literature in at least three ways. First, our paper differs from previous studies in the data sources used and the indicators selected to measure institutional quality; we used the Fragile States Index as an alternative source. Second, we propose a methodological approach that combines multivariate analysis and panel data techniques, which allows us to reduce the number of variables and avoid collinearity problems keeping the most representative variables to explain how institutional framework affects OFDI. Third, we selected Emerging and Developing economies because they are beneficial for studying the causes and consequences of institutional variations; for this purpose, we built a data panel with 30 variables for 48 countries in the years 2007–2017.
This paper is structured as follows; Section 2 briefly reviews the theoretical approaches and develops the hypothesis; Section 3 describes the literature review findings and the methodological approach; Section 4 presents the results and discussion; Section 5 and Section 6 present the conclusions, limitations and future research directions.
2. Theoretical Approaches and Hypothesis Development on Institutional Quality and Outward FDI
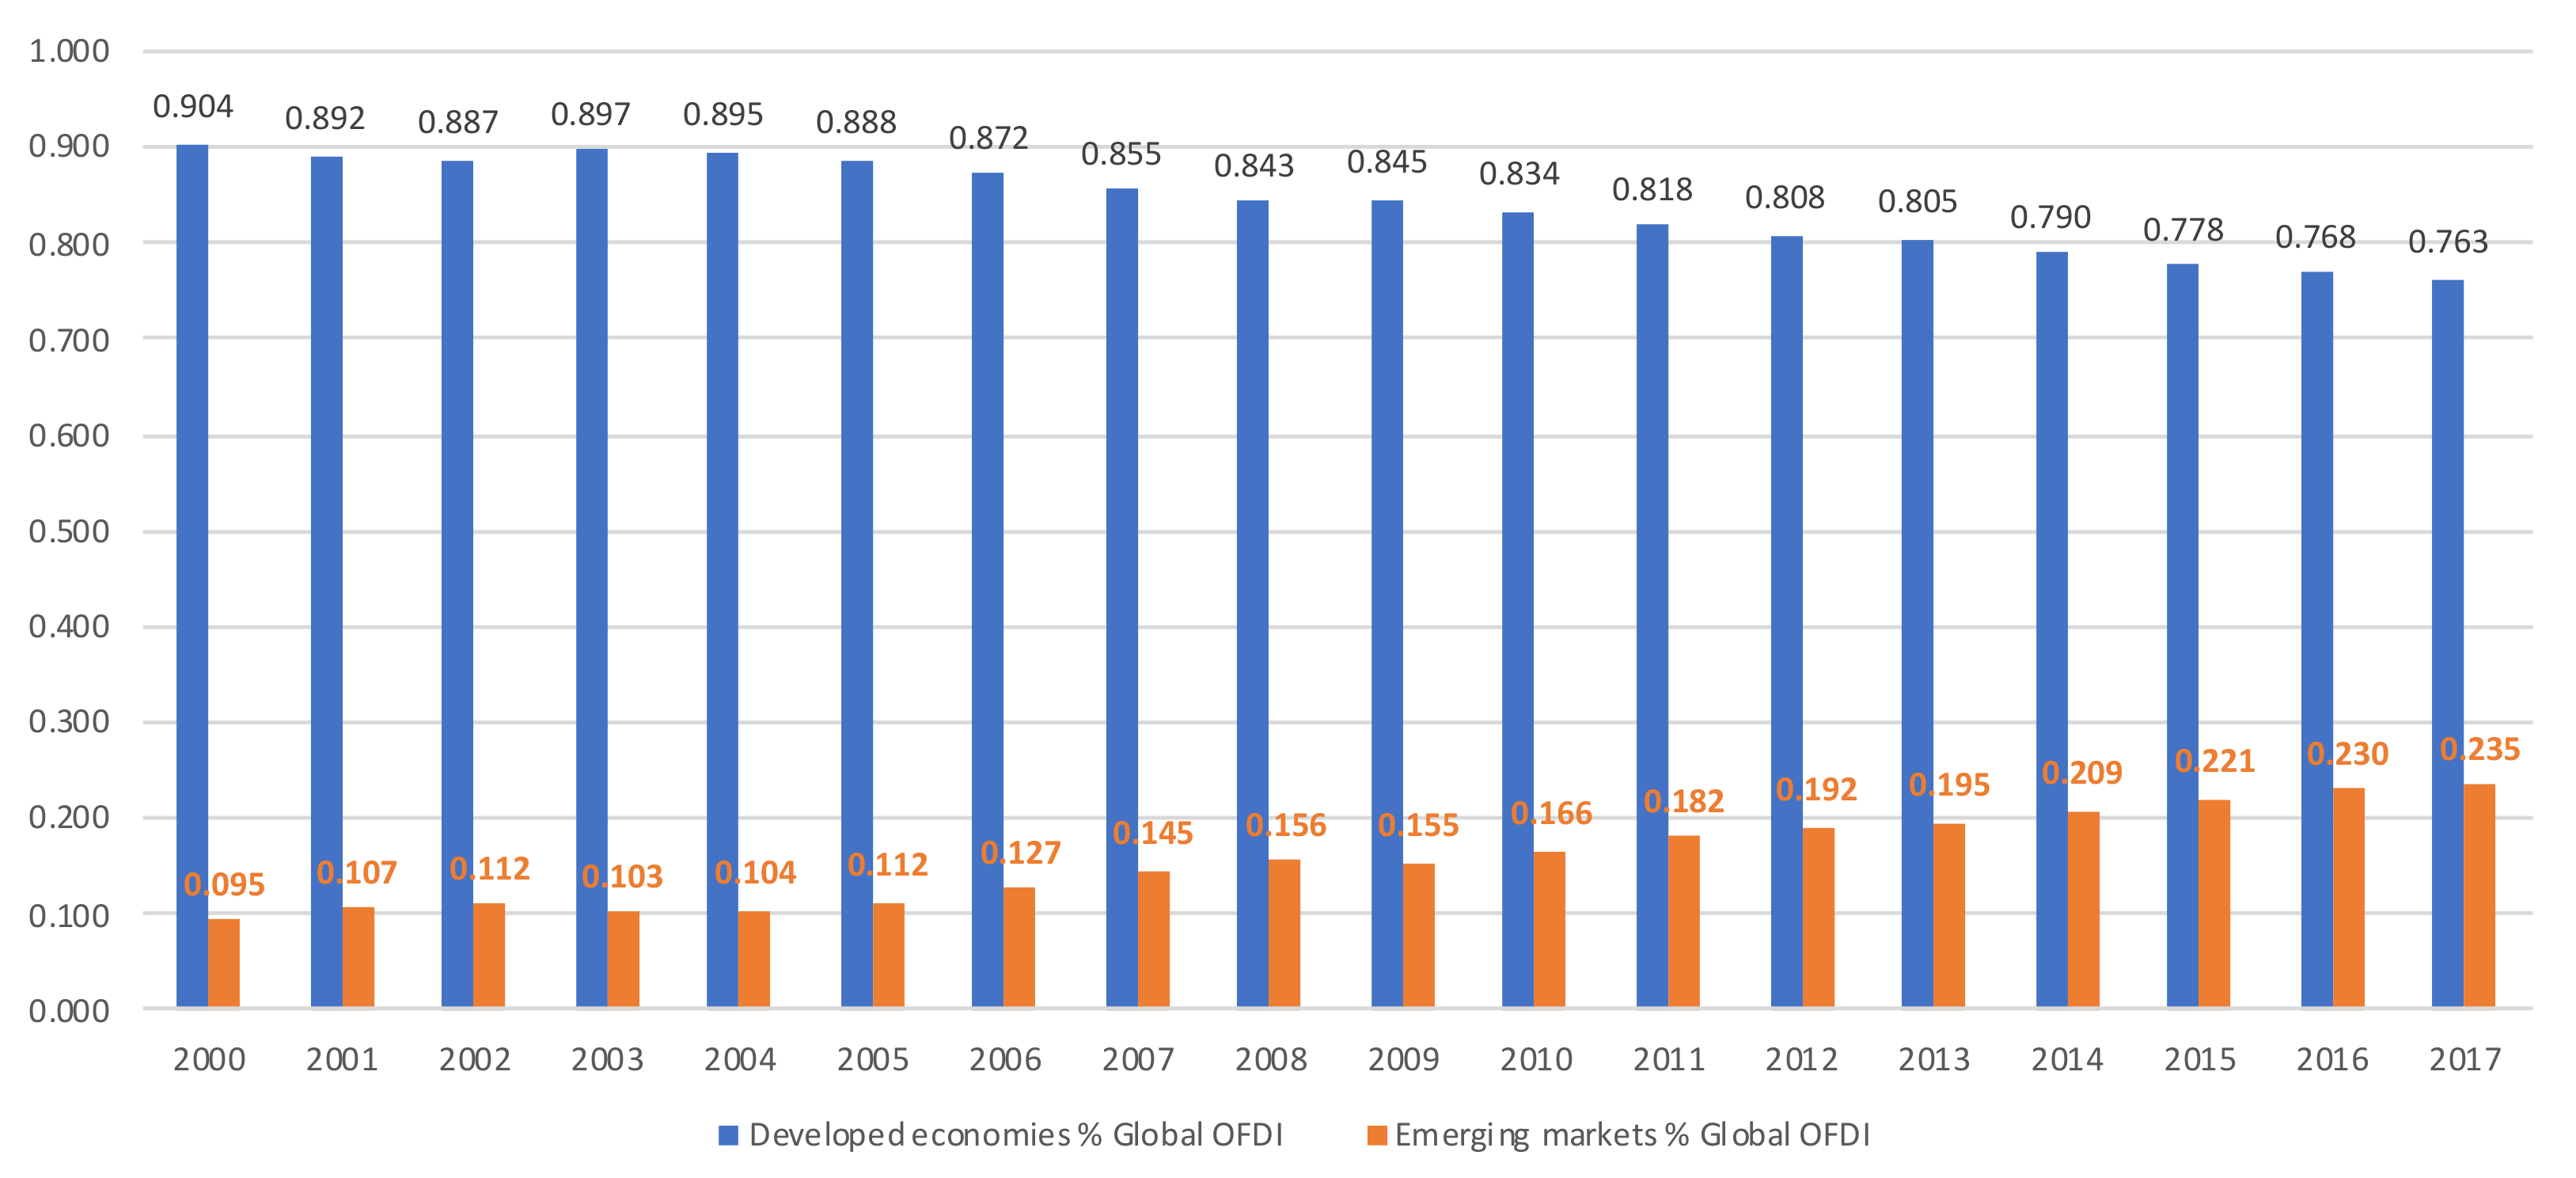
The stocks of OFDI grew dramatically in recent years, from nearly 1% of global stocks in 2000 up to 23.5% in 2017, see Figure 1. The rise of OFDI has different motivations, including the need to develop new markets, the need for a way to leverage capital and technology, as well as the need for a way to gain knowledge in international markets [24,36,37]. Another point of view is the escape OFDI, in this case, firms look for international markets to avoid institutional misalignments or uneven conditions hindering competition in their home countries [38,39,40].
In the first case, it is necessary to consider the institutional framework that contributes to developing firms’ ownership advantages as proposed by Dunning. These advantages include unique assets relating to technological know-how, marketing expertise and managerial skills that help the firm to compete in local and foreign markets [12,19,20,42].
According to Dunning [19] as well as Narula and Kodiyat [30], firms require a good knowledge infrastructure to foster innovation and absorptive capacity, which are known to be some of the ownership advantages needed for a firm to pursue OFDI. An adequate home country knowledge environment ensures the creation and dissemination of knowledge, the protection of knowledge and creating a skilled workforce [30].
One crucial component of the home country knowledge environment is the protection of intellectual property; the stronger the protection of intellectual property, the better the research and development (R&D) of firms [43]. A rule of law that protects intellectual property promotes the R&D endeavor of firms at home, and fosters them to engage in OFDI to gain ground-breaking capabilities [38,39,40,41,42,43,44,45,46]; hence, strong intellectual property protection positively influences OFDI.
Another pillar of the home country knowledge environment is skilled human capital; having a well-trained labor force is essential for a firm to deal with the complexities of managing and operating in international contexts. The availability of a skilled workforce helps in the process of assimilation, adoption and application of new knowledge and reduces firms’ in-house training costs [30,31]. Therefore, home country policies oriented to the development of skilled human resources are likely to influence OFDI positively.
A country’s OFDI is related to the “stage of its economic development, the structure of its factor endowments and markets; its political and economic systems; and the nature and extent of market failure in the transaction of intermediate products across national boundaries.” [19] Therefore, having national institutions that are strong to ensure the efficient allocation of factors and improve economic performance is a prerequisite for OFDI. In contrast, countries where institutions are weak can have several economic problems such as a lack of productivity, reduced investment rates and lower GDP growth, which deters OFDI [3,46,47,48,49].
Hence, we wanted to explore which dimensions of home country institutions motivate OFDI and which dimensions deter it. We hypothesized:
- H1: Perceived political and legal hazards positively moderate OFDI
- H2: Perceived financial constraints positively moderate OFDI
- H3: Uneven access to factor endowments negatively moderates OFDI
- H4: Human capital positively moderates OFDI
- H5: High levels of research and development positively moderate OFDI
- H6: Protection of inward FDI positively moderates OFDI
3. Methodology
This section is divided into two; the first part shows the literature review findings, and the second shows the methodological approach of this study.
3.1. Literature Review Findings
In the literature review, we centered our attention on methodological approaches focused on the institutional framework in emerging economies; the results are shown in Table 1.
In the literature review, we found some recurrent data sources that were used to analyze the institutional framework. It is important to highlight that some of the sources are used in more than one article. In Table 2, we summarize our findings.
Finally, in the review we found a number of variables analyzed relevant to the nature and methodology of each paper. In Table 3, we organized these variables into types.
3.2. Research Context and Data
In accordance with the IMF Fiscal Monitor classification, we constructed a strongly balanced panel of 48 emerging economies over the period 2007–2017. The emerging economies are eight countries in Latin America and the Caribbean (LAC), 13 countries in Europe, 12 countries in Asia, eight countries in the Middle East and North Africa (MENA) and six countries in Africa (Table 4).
OFDI, measured as the log of outward FDI stocks, is our dependent variable from the United Nations Conference on Trade and Development (UNCTAD) Statistics [41]. We selected 30 indicators to explain variance within institutional conditions recollected by secondary sources. Missing data were completed using linear interpolation. These collected data have been checked and normalized before conducting a multivariate statistical analysis. Table A1 in the Appendix A provides the matrix of correlations of the indicators used in the empirical analysis.
We collected some indicators from the Fragile States Index (FSI) published by the Fund for Peace. This index combines cohesion, economic, political, social and cross-cutting indicators [78] that we consider to be relevant for the aim of this research. We extracted six of them: factionalized elites, group grievance, uneven economic development, human flight, brain drain, state legitimacy and public services.
From the global competitiveness index (GCI) published by the World Economic Forum [79], we took 24 indicators from 7 pillars: institutions, infrastructure, higher education and training, goods market efficiency, financial market development, technological readiness and innovation. Table A2 in the Appendix A presents the description, dimension, unit and data source of the indicators selected.
3.3. Methods
To explore the linkage between institutional quality and OFDI, we applied two techniques of data analysis. First, we used factor analysis to reduce the data set’s dimensionality while preserving as much statistical information as possible. Second, we used a panel data estimation to determine how institutional quality, measured through the dimensions identified through factor analysis, affects OFDI.
3.3.1. Factor Analysis
We conducted a factor analysis to determine if we can capture most of the variation between countries using a smaller number of new variables (principal-component factors), where each of these new variables is a linear combination of all or some of the 30 variables included in the original data set. To be sure that the data were suited for factor analysis, we used the Kaiser-Meyer-Olkin (KMO) measure of sampling adequacy; the result was close to 1 (see Table A3 in the Appendix A), indicating that the data are adequate for factor analysis [80]. Also, we specified the factor analysis method, where the commonalities are assumed to be one, and the factors are uncorrelated.
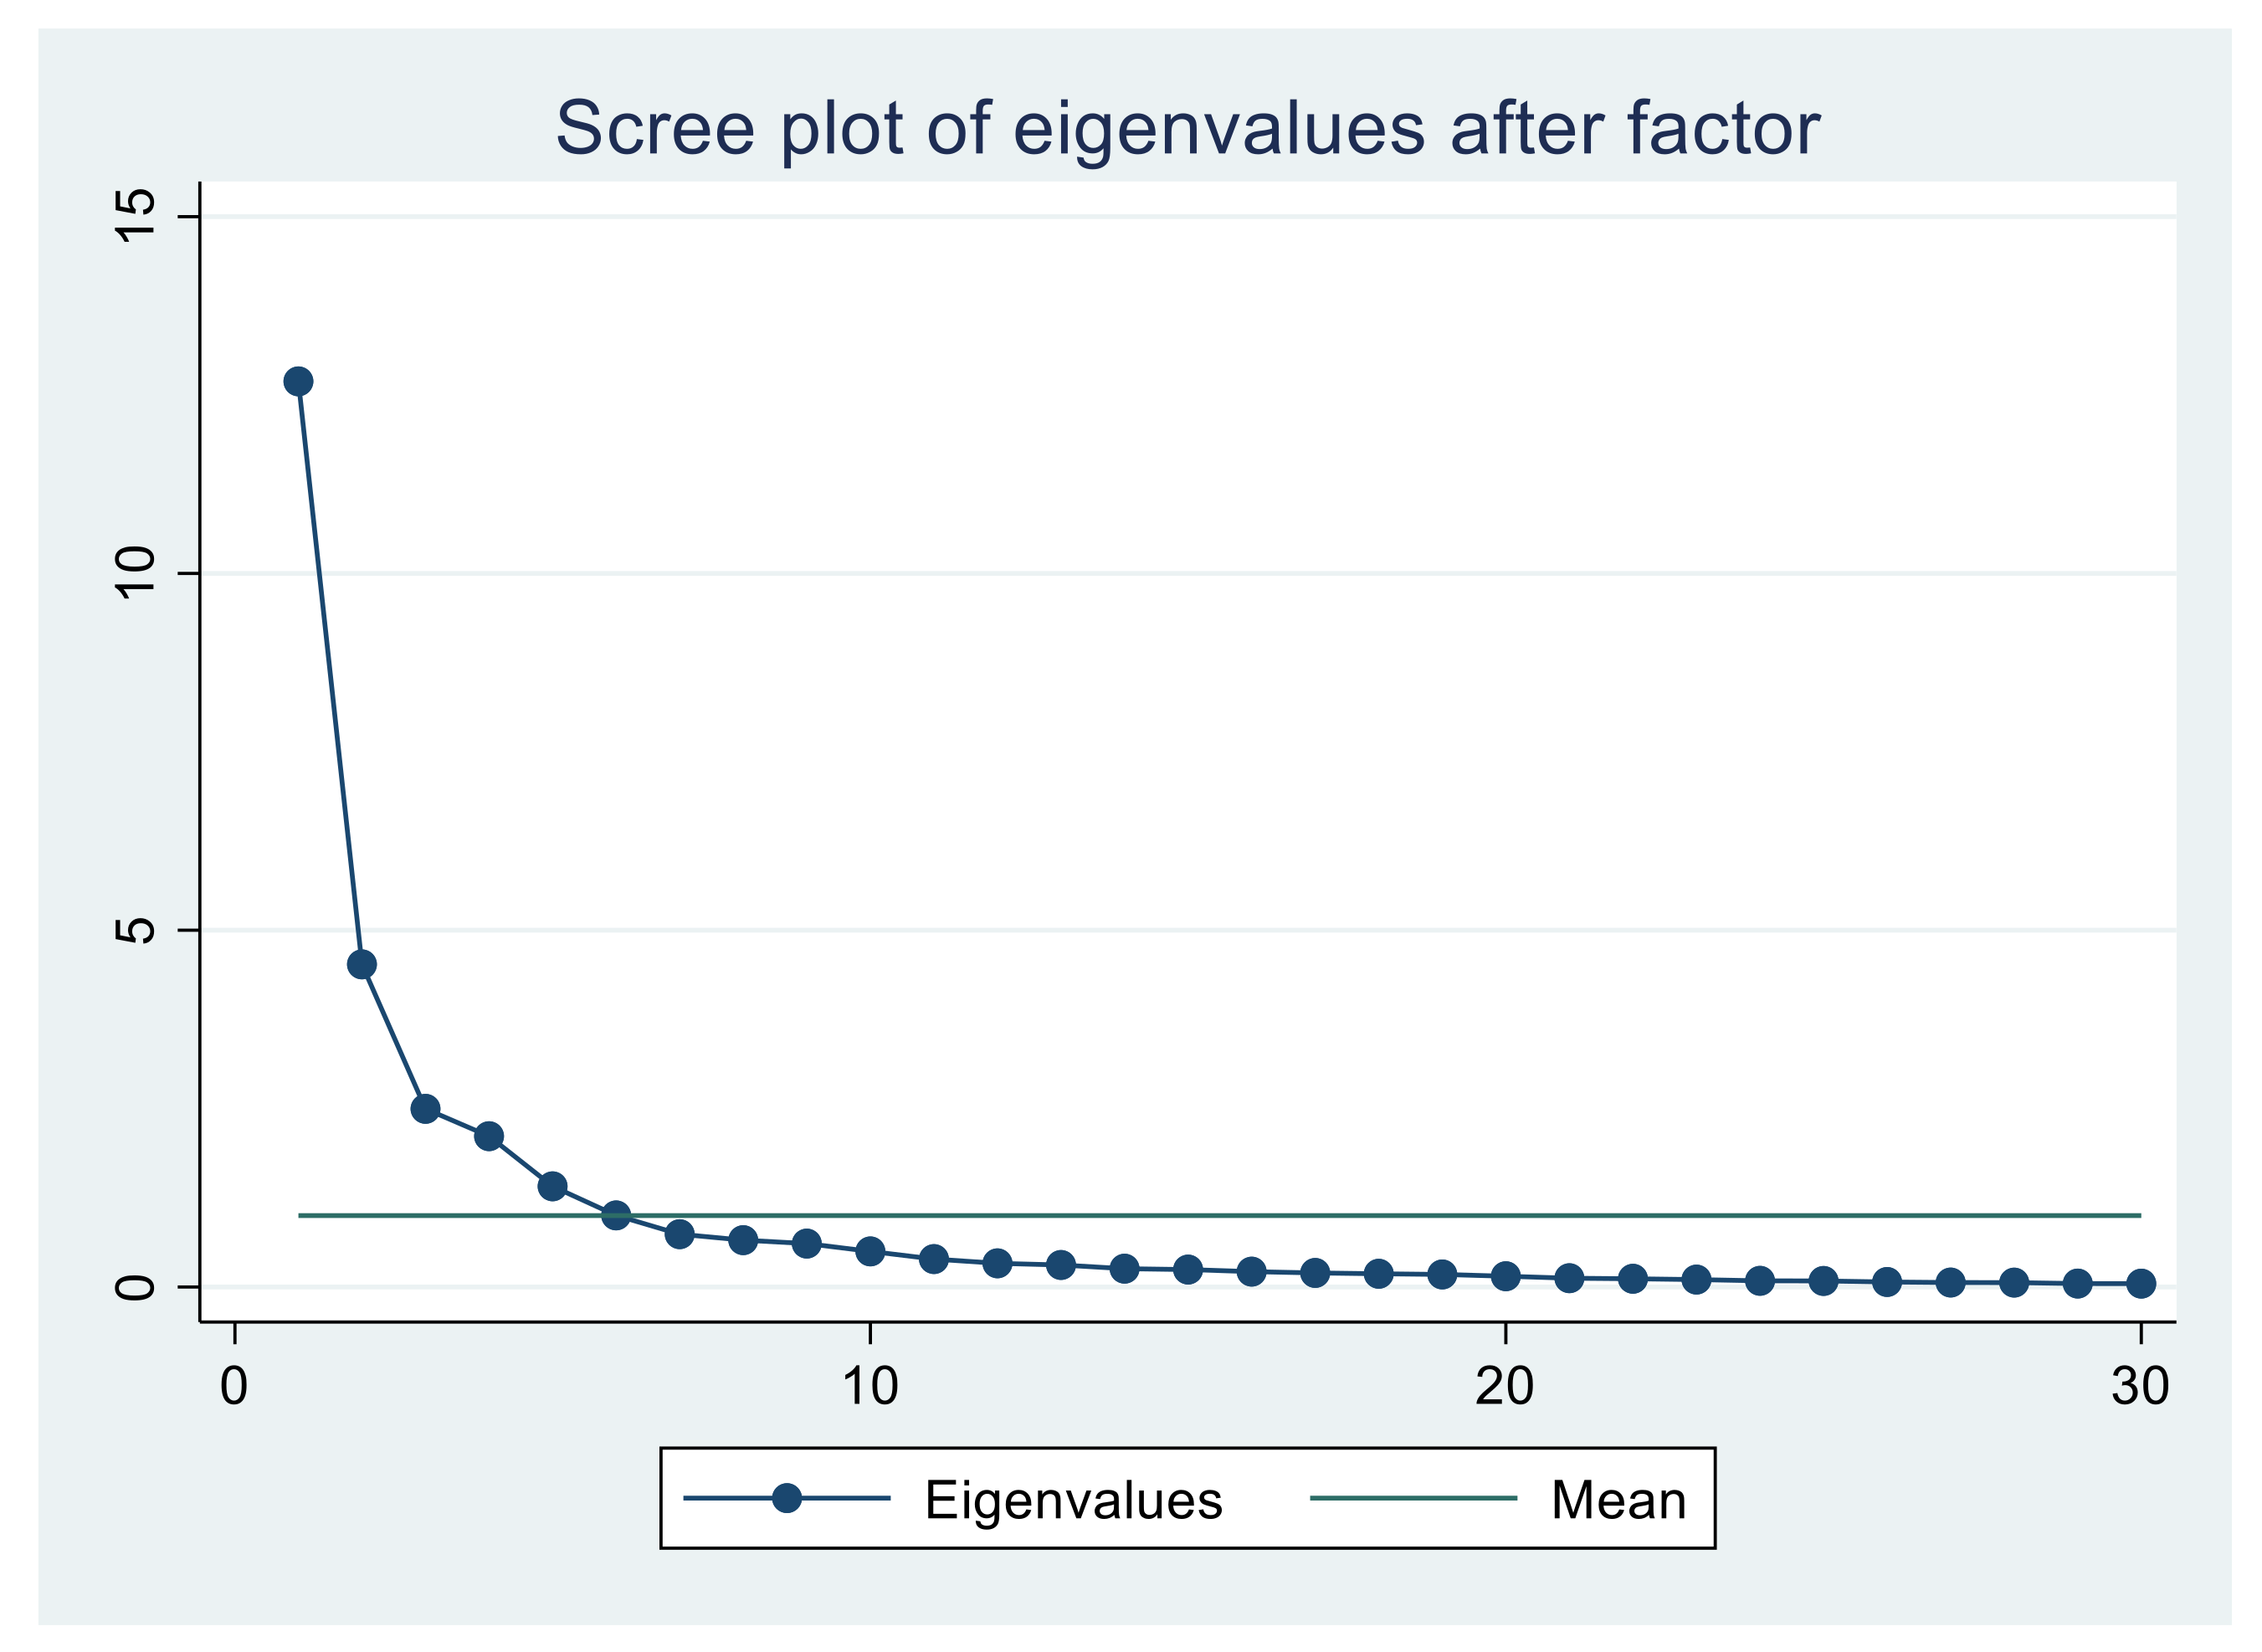
To determine the number of principal factors that should be retained, there are many methods; we considered the three most used methods. The first method is percentage of variance ( PVA), which considers setting a percentage of variance to account for, usually at least 90% [81]. The second is Kaiser’s criteria, which only consider retained factors where the eigenvalues are greater than one [82]; the third method is a scree plot to observe a significant drop in the singular values right after the correct dimension or “elbow” point of the plot [83,84], see Figure 2. We retained the principal factors by using the Catell criteria.
3.3.2. Data Panel
We used 48 emerging and developing economies and 11 years that correspond to 528 observations. The dependent variable used is the logarithm of OFDI stocks in each country. We used the six principal factors retained from previous analysis as a proxy of institutional quality and as independent variables, considering that factor analysis transformation is conducted in such a way that the first factor accounts for as much of the variability in the data as possible, and each succeeding component accounts for as much of the remaining variability as possible.
We estimated several panel data models. We began with an OLS robust model (1), followed by random (2), and fixed (3) models to compare coefficients and significances. Standard errors adjusted for clustered heteroscedasticity were used too.
Moreover, we conducted a series of robustness tests to reduce concerns about unobserved heterogeneity and provide additional confidence in our results. First, we used the Lagrangian multiplier test (LM) to identify whether ordinary least square (OLS) or random effects (RE) provides a better model. Additionally, given our data’s longitudinal nature, to determine whether to use fixed or random-effects specifications, we ran a Hausman [85] test standard and the test type Wald proposed by Wooldridge [86] for robust standard errors. In this test, rejecting Ho suggests that the random-effects model is not adequate because it generates inconsistent estimators.
4. Results and Discussion
Followed the criteria explained in section methods, we found that 11 factors explain at least 90% of the variance. Simultaneously, only 6 of them had eigenvalues greater than the unit (View Appendix A, Table A4). Moreover, the scree plot shows that the most significant change in the slope occurs at factor six; therefore, the first six factors should be retained. Around 80% of the total variation can be captured by the first six factors, each representing a different institutional quality aspect in a country.
We named the factors after the factor’s major loadings, as shown in Table 5; complete results are shown in Table A5 in the Appendix A. The extracted factors were subsequently used as new variables to represent institutional conditions. These are transparency of the government, research, development, and innovation, inequality, rules for inward FDI, education and training and financial market.
The first factor included heavy loadings of diversion of public funds, public trust in politicians and favoritism in decisions of government officials, which capture perceptions of the extent to which agents have confidence in and abide by society’s rules and have credibility in the government and public-sector development. We thus called this factor “transparency of the government.”
The second factor was focused on indicators as university-industry collaboration in R&D, capacity for innovation, company spending on R&D and availability of research and training services, all of which promote innovation and competitiveness through helping businesses to adapt rapidly to a changing environment, making it intuitively sensible to interpret this factor as “R&D+I.”
The third factor consisted of the Fragile States Index components on group grievance, factionalized elites, state legitimacy, economic inequality, human flight and public services. Therefore, this final index can readily be interpreted as a measure of structural inequality, mainly focused on divisions based on social or political characteristics and their role in access to services or resources.
The fourth factor captured the indicators related to the rules for inward FDI as the prevalence of foreign ownership, the business impact of rules on FDI as well as the relationship between FDI and technology transfers. Thus, it considered the government’s openness and explained its regulatory quality to formulate and implement policies and regulations that permit private sector development.
The fifth factor included the quality of math and science education, scientists and engineers’ availability, and the education system’s quality. Hence, the “education and training” is an indicator of the possibility of generating more value and transfer and adaptive knowledge to promote competitiveness.
Finally, the sixth factor measured financing through the local equity market and venture capital availability. It was expected that an underdeveloped financial market fosters OFDI due to the need for a competitive source of capital.
The unbundling of institutions allowed us to examine which of these different dimensions matter for outward FDI stocks in emerging markets. Table 6 presents the results of estimated models for OFDI stocks from 48 emerging economies in the 2007–2017 period.
We applied the Breusch-Pagan test (LM test), and we concluded that the RE estimator is preferable to OLS because the p-value is lower than 0.05. Then, the rejection of the OLS model is consistent. In this case, our results may suggest that transparency of the government and research and development plus innovation promote outward FDI, while inequality and financial market reduce it (model 2).
As displayed in model 2, the positive coefficients for both factor 1 and factor 2 (p-value < 0.05, p-value < 0.01, respectively) indicate that the measure of the transparency of government is positively correlated with outward FDI, as well as with R&D+I. In this way, the estimates in model 2 provide partial support for H1 and H5, suggesting that, in this case, a strong institutional framework encourages OFDI. Our findings supported the notion that fair and clear governmental actions within emerging markets introduce competition and market transparency that promote new forms of corporate governance encouraging international ventures [87]. They also supported the idea that the production capacity of innovative features (R&D+I) depends on the market structure, government policies and the resources available, which is positively linked to the tendency of the OFDI [88,89].
In contrast, the negative and significant at the 0.01 level coefficients for the third and sixth factors show both structural inequality and financial market are negatively related to outward FDI, indicating that a weak institutional framework discourages OFDI. These results provide partial support for H2 and H3, and are in line with the notion that institutions can be a problem in politics (corruption, instability, policies), law (economic liberalization, regulations) and society (norms, attitudes, culture) that may affect the internationalization of firms and their strategies [11,90]. The remaining two factors do not significantly affect OFDI stocks.
However, by performing a Hausman test, we could reject the hypothesis that the coefficients are the same in both random and fixed effects models, so random effects are dismissed in favor of fixed effects (p-value < 0.05). In general, the results indicated that R&D+I and financial market factors affect OFDI. Thus, we confirmed our previous results about H5 y H2.
Here, we found that the more capacity for innovation and spending on research and development, the higher the involvement in OFDI, because the relevant coefficient was found to be positive and significant at the 0.10 level (model 3). This suggests that emerging markets firms tend to seek strategic assets to acquire and integrate particular knowledge to improve the research and development capabilities [91].
We also found support for H2 because the financial market’s coefficient was negative and significant at the 0.01 level (model 3). We found that more financing through the local equity market and venture capital availability exists in the home country’s economy, thereby discouraging OFDI. This suggested that the availability of resources to minimize the cost of capital in the home country is more attractive for emerging market firms [92,93]. In this case, transparency of the government, inequality, rules for inward FDI and education were not statistically significant.
On the other hand, the statistically significant positive coefficient of lagged values of OFDI stocks showed that OFDI stocks are influenced by the previous year’s OFDI (model 5) as expected. These results also showed that government transparency positively and significantly affects OFDI stocks, indicating that high transparency increases OFDI. Models 2 and 5 showed a positive relationship between the transparency of the government factor and the outward FDI. These results support H1, which states that perceived political and legal hazards positively moderate OFDI.
This finding makes sense because the literature indicates that the institutional environment creates two streams of OFDI: leverage and escapism [17,94]. Firms are willing to invest abroad because they have institutional support or are trying to escape from institutional hazards. Emerging-markets companies mainly consider investing abroad to escape from their home countries’ poor institutional climates [55,95,96].
Also, the signs of our control variables were typical as expected: GDP per capita was positively associated with outward FDI, and inflation displayed a negative association (model 7). The findings for the institutional quality point towards the importance of the financial market because the coefficient remained statistically significant with the same (negative) sign as in random and fixed effects models. Thus, the estimates in models 2, 3 and 7 provided support for H2. In hypothesis 2, we suggested that perceived financial constraints positively moderate ODFI; here, we found support for a negative relationship between financial markets and outward FDI. Specifically, we argued that increasing open access to capital resources promotes local firms’ finance [33,97]. Our findings confirmed that firms often have difficulty expanding overseas because of the constraints from underdeveloped financial markets in their home country [58].
Our results indicated that the fourth factor never gained significance. We failed to find support for H4 and H6. The results revealed that the coefficients for rules for inward FDI and education and training are insignificant. This means that rules for inward FDI and education and training have no significant effect on OFDI. Although this result surprised us, prior studies that support the idea that there are positive effects of inward FDI on OFDI exist, though they are focused on the firm level in China [98,99,100], not on the country level and covering multiple countries.
In sum, empirical results demonstrate that institutional framework had a strong influence on the outward foreign direct investment (OFDI). Our results provide evidence that outward FDI depends on home country institutions.
5. Conclusions
Which dimensions of home country institutions motivates outward FDI (OFDI) and which dimensions deter it was the research question. Consequently, this paper has explored the association between different institutional factors and outward FDI stocks for a panel of 48 emerging markets over the period of 2007–2017. We employed 30 indicators to form six factors to represent institutional conditions using factor analysis. These are transparency of the government, research, development, and innovation, inequality, rules for inward FDI, education and training and financial market.
Our findings revealed that not all institutional quality indicators have a significant effect on outward FDI in emerging markets. Specifically, our study provided new insights to extend our understanding of the relationship between institutional framework and outward FDI, while considering some unexplored moderating effects. We found that research and development plus innovations and transparency of the government have significant positive effects on OFDI stocks, while the financial market has a significant negative impact.
Another finding was the negative relationship between financial markets and external FDI. Specifically, we supported the idea that increasing open access to capital resources facilitates funding in local firms. Our findings reinforce the view that firms frequently find it challenging to grow overseas due to the constraints of underdeveloped financial markets in their home countries.
These results show that we have a limited understanding of the real effect of the home country institutional environment; our panel involves a very diverse number of emerging economies; while some of the findings could support the idea of institutional leverage, others could be related to institutional escapism.
These findings promote an interest in probing the role played by home country institutions behind outward internationalization. In addition, improving institutional quality in firms’ home country is essential to outward FDI in emerging economies.
6. Limitations and Future Directions
Our research used macroeconomic information and analyzed 48 different emerging economies; one limitation is the availability of firm’s information in each economy, for the same period, to perform a detailed analysis to identify the real effect (leverage or escape) of the home country’s institutional framework. Future research should include controls for geographic location, type of government, legal origin, religion and other informal institutions.
Author Contributions
The authors worked together for this research, but, per structure, conceptualization R.E.B.R., methodology, software validation and resources, R.E.B.R. and M.I.B.C., formal analysis, M.I.B.C., writing—original draft preparation R.E.B.R. and M.I.B.C., and writing—review and editing, R.E.B.R. All authors have read and agreed to the published version of the manuscript.
Funding
This research received no external funding.
Conflicts of Interest
The authors declare no conflict of interest.
Appendix A

Table A1.
Correlation matrix.
| 1 | 2 | 3 | 4 | 5 | 6 | 7 | 8 | 9 | 10 | 11 | 12 | 13 | 14 | 15 | |
|---|---|---|---|---|---|---|---|---|---|---|---|---|---|---|---|
| 1. fsi_fe | 1 | ||||||||||||||
| 2. fsi_gg | 0.86 | 1 | |||||||||||||
| 3. fsi_ei | 0.53 | 0.58 | 1 | ||||||||||||
| 4. fsi_bd | 0.52 | 0.52 | 0.69 | 1 | |||||||||||
| 5. fsi_sl | 0.85 | 0.70 | 0.57 | 0.52 | 1 | ||||||||||
| 6. fsi_ps | 0.58 | 0.63 | 0.84 | 0.77 | 0.60 | 1 | |||||||||
| 7. gci_pr | −0.34 | −0.32 | −0.08 | −0.23 | −0.30 | −0.22 | 1 | ||||||||
| 8. gci_ipp | −0.38 | −0.35 | −0.29 | −0.36 | −0.36 | −0.38 | 0.84 | 1 | |||||||
| 9. gci_dpf | −0.27 | −0.30 | −0.26 | −0.32 | −0.23 | −0.38 | 0.76 | 0.75 | 1 | ||||||
| 10. gci_ptp | −0.11 | −0.15 | −0.18 | −0.31 | −0.03 | −0.25 | 0.64 | 0.69 | 0.86 | 1 | |||||
| 11. gci_fdg | −0.16 | −0.18 | −0.15 | −0.27 | −0.09 | −0.26 | 0.70 | 0.69 | 0.90 | 0.90 | 1 | ||||
| 12. gci_bgr | 0.03 | 0.04 | −0.03 | −0.11 | 0.06 | −0.02 | 0.56 | 0.58 | 0.70 | 0.79 | 0.77 | 1 | |||
| 13. gci_tgp | −0.20 | −0.16 | −0.09 | −0.24 | −0.18 | −0.16 | 0.76 | 0.70 | 0.71 | 0.72 | 0.73 | 0.69 | 1 | ||
| 14. gci_ci | −0.12 | −0.08 | −0.25 | −0.22 | −0.17 | −0.19 | 0.37 | 0.62 | 0.40 | 0.41 | 0.43 | 0.38 | 0.36 | 1 | |
| 15. gci_qri | −0.37 | −0.37 | −0.29 | −0.40 | −0.38 | −0.40 | 0.45 | 0.62 | 0.45 | 0.35 | 0.42 | 0.31 | 0.41 | 0.64 | 1 |
| 16. gci_csr | −0.12 | −0.11 | −0.04 | −0.17 | −0.09 | −0.11 | 0.50 | 0.64 | 0.52 | 0.54 | 0.58 | 0.51 | 0.49 | 0.80 | 0.72 |
| 17. gci_uic | −0.22 | −0.20 | −0.17 | −0.34 | −0.23 | −0.24 | 0.41 | 0.61 | 0.41 | 0.47 | 0.49 | 0.44 | 0.56 | 0.66 | 0.78 |
| 18. gci_ase | −0.03 | −0.06 | −0.14 | −0.18 | 0.01 | −0.20 | 0.37 | 0.34 | 0.51 | 0.43 | 0.52 | 0.39 | 0.32 | 0.34 | 0.43 |
| 19. gci_qi | −0.39 | −0.35 | −0.42 | −0.49 | −0.40 | −0.50 | 0.64 | 0.76 | 0.67 | 0.65 | 0.62 | 0.50 | 0.69 | 0.41 | 0.50 |
| 20. gci_qes | −0.03 | −0.09 | −0.18 | −0.13 | −0.03 | −0.21 | 0.39 | 0.51 | 0.61 | 0.59 | 0.61 | 0.65 | 0.47 | 0.52 | 0.60 |
| 21. gci_qms | −0.17 | −0.22 | −0.44 | −0.28 | −0.21 | −0.49 | 0.24 | 0.36 | 0.49 | 0.40 | 0.42 | 0.36 | 0.24 | 0.38 | 0.54 |
| 22. gci_art | −0.33 | −0.29 | −0.30 | −0.38 | −0.34 | −0.35 | 0.49 | 0.63 | 0.47 | 0.42 | 0.49 | 0.39 | 0.51 | 0.69 | 0.72 |
| 23. gci_eap | −0.26 | −0.22 | −0.01 | −0.20 | −0.26 | −0.10 | 0.75 | 0.71 | 0.62 | 0.54 | 0.64 | 0.55 | 0.66 | 0.47 | 0.55 |
| 24. gci_tax | 0.03 | 0.11 | 0.15 | 0.07 | 0.03 | 0.07 | −0.33 | −0.32 | −0.38 | −0.41 | −0.34 | −0.38 | −0.36 | −0.01 | 0.03 |
| 25. gci_pfo | −0.33 | −0.25 | 0.03 | 0.01 | −0.27 | 0.03 | 0.46 | 0.37 | 0.24 | 0.12 | 0.22 | 0.29 | 0.37 | 0.09 | 0.30 |
| 26. gci_bir | −0.00 | 0.02 | 0.19 | 0.14 | 0.02 | 0.16 | 0.60 | 0.39 | 0.45 | 0.36 | 0.45 | 0.53 | 0.54 | 0.18 | 0.23 |
| 27. gci_flm | 0.08 | 0.04 | 0.33 | 0.18 | 0.11 | 0.21 | 0.61 | 0.41 | 0.50 | 0.38 | 0.49 | 0.41 | 0.39 | 0.24 | 0.29 |
| 28. gci_vca | −0.07 | −0.13 | −0.03 | −0.19 | −0.07 | −0.16 | 0.61 | 0.63 | 0.72 | 0.68 | 0.72 | 0.61 | 0.51 | 0.52 | 0.49 |
| 29. gci_alt | −0.35 | −0.29 | −0.32 | −0.37 | −0.37 | −0.37 | 0.58 | 0.67 | 0.50 | 0.49 | 0.49 | 0.41 | 0.61 | 0.37 | 0.48 |
| 30. gci_ftf | −0.19 | −0.17 | 0.04 | −0.08 | −0.16 | −0.06 | 0.57 | 0.45 | 0.43 | 0.34 | 0.48 | 0.43 | 0.49 | 0.21 | 0.41 |
| 16 | 17 | 18 | 19 | 20 | 21 | 22 | 23 | 24 | 25 | 26 | 27 | 28 | 29 | 30 | |
| 16. gci_csr | 1 | ||||||||||||||
| 17. gci_uic | 0.75 | 1 | |||||||||||||
| 18. gci_ase | 0.47 | 0.31 | 1 | ||||||||||||
| 19. gci_qi | 0.44 | 0.59 | 0.32 | 1 | |||||||||||
| 20. gci_qes | 0.66 | 0.57 | 0.59 | 0.45 | 1 | ||||||||||
| 21. gci_qms | 0.43 | 0.37 | 0.60 | 0.38 | 0.76 | 1 | |||||||||
| 22. gci_art | 0.73 | 0.74 | 0.47 | 0.57 | 0.58 | 0.43 | 1 | ||||||||
| 23. gci_eap | 0.64 | 0.61 | 0.43 | 0.59 | 0.48 | 0.24 | 0.64 | 1 | |||||||
| 24. gci_tax | −0.05 | −0.03 | 0.01 | −0.30 | −0.16 | −0.07 | 0.03 | −0.20 | 1 | ||||||
| 25. gci_pfo | 0.23 | 0.24 | 0.14 | 0.23 | 0.13 | −0.03 | 0.36 | 0.51 | −0.04 | 1 | |||||
| 26. gci_bir | 0.35 | 0.20 | 0.31 | 0.22 | 0.30 | 0.10 | 0.29 | 0.58 | −0.18 | 0.74 | 1 | ||||
| 27. gci_flm | 0.51 | 0.18 | 0.41 | 0.15 | 0.33 | 0.03 | 0.28 | 0.57 | −0.17 | 0.34 | 0.59 | 1 | |||
| 28. gci_vca | 0.72 | 0.46 | 0.49 | 0.42 | 0.57 | 0.36 | 0.52 | 0.60 | −0.19 | 0.26 | 0.46 | 0.65 | 1 | ||
| 29. gci_alt | 0.41 | 0.63 | 0.27 | 0.80 | 0.40 | 0.29 | 0.62 | 0.64 | −0.29 | 0.31 | 0.25 | 0.15 | 0.32 | 1 | |
| 30. gci_ftf | 0.43 | 0.39 | 0.37 | 0.30 | 0.35 | 0.18 | 0.44 | 0.60 | −0.15 | 0.71 | 0.77 | 0.53 | 0.52 | 0.38 | 1 |
Source: Author elaboration.
Table A2.
Description, dimension, unit, and data source of indicators.
| Indicators | Description | Dimension | Unit | Data Source |
|---|---|---|---|---|
| fsi_fe | Factionalized Elites | Systemic | Scale 1–10 (worst) | Fragile States Index (The fund for peace) |
| fsi_gg | Group Grievance | Systemic | Scale 1–10 (worst) | |
| fsi_ei | Economic Inequality | Systemic | Scale 1–10 (worst) | |
| fsi_bd | Human Flight and Brain Drain | Resource | Scale 1–10 (worst) | |
| fsi_sl | State Legitimacy | Systemic | Scale 1–10 (worst) | |
| fsi_ps | Public Services | Resource | Scale 1–10 (worst) | |
| gci_pr | Property rights protected | Systemic | Scale 1–7 (best) | Global Competitiveness Index, 1st pillar: institutions (World Economic Forum) |
| gci_ipp | Intellectual property protection | Systemic | Scale 1–7 (best) | |
| gci_dpf | Diversion of public funds | Political | Scale 1–7 (best) | |
| gci_ptp | Public trust in politicians | Political | Scale 1–7 (best) | |
| gci_fdg | Favoritism in decisions of government officials | Political | Scale 1–7 (best) | |
| gci_bgr | The burden of government regulation | Systemic | Scale 1–7 (best) | |
| gci_tgp | Transparency of government policymaking | Political | Scale 1–7 (best) | |
| gci_ci | Capacity for innovation | Resource | Scale 1–7 (best) | Global Competitiveness Index, 12th pillar: innovation (World Economic Forum) |
| gci_qri | Quality of scientific research institutions | Resource | Scale 1–7 (best) | |
| gci_csr | Company spending on R&D | Resource | Scale 1–7 (best) | |
| gci_uic | University-industry collaboration in R&D | Resource | Scale 1–7 (best) | |
| gci_ase | Availability of scientists and engineers | Resource | Scale 1–7 (best) | |
| gci_qi | Quality of overall infrastructure | Resource | Scale 1–7 (best) | Global Competitiveness Index, 2nd pillar: infrastructure (World Economic Forum) |
| gci_qes | Quality of the education system | Resource | Scale 1–7 (best) | Global Competitiveness Index, 5th pillar: higher education and training (World Economic Forum) |
| gci_qms | Quality of math and science education | Resource | Scale 1–7 (best) | |
| gci_art | Availability of research and training services | Systemic | Scale 1–7 (best) | |
| gci_eap | Effectiveness of anti-monopoly policy | Systemic | Scale 1–7 (best) | Global Competitiveness Index, 6th pillar: goods market efficiency (World Economic Forum) |
| gci_tax | Total tax rate | Systemic | % of profits | |
| gci_pfo | Prevalence of foreign ownership | Systemic | Scale 1–7 (best) | |
| gci_bir | The business impact of rules on FDI | Systemic | Scale 1–7 (best) | |
| gci_flm | Financing through the local equity market | Resource | Scale 1–7 (best) | Global Competitiveness Index, 8th pillar: financial market development (World Economic Forum) |
| gci_vca | Venture capital availability | Resource | Scale 1–7 (best) | |
| gci_alt | Availability of latest technologies | Resource | Scale 1–7 (best) | Global Competitiveness Index, 9th pillar: technological readiness (World Economic Forum) |
| gci_ftf | FDI and technology transfer | Resource | Scale 1–7 (best) |
Source: Author elaboration.
Table A3.
KMO Test.
| Variable | kmo |
|---|---|
| fsi_fe | 0.7592 |
| fsi_gg | 0.7849 |
| fsi_ei | 0.8254 |
| fsi_bd | 0.8634 |
| fsi_sl | 0.8258 |
| fsi_ps | 0.8448 |
| gci_pr | 0.9061 |
| gci_ipp | 0.912 |
| gci_dpf | 0.929 |
| gci_ptp | 0.9296 |
| gci_fdg | 0.9346 |
| gci_bgr | 0.9306 |
| gci_tgp | 0.9471 |
| gci_ci | 0.8515 |
| gci_qri | 0.9035 |
| gci_csr | 0.9094 |
| gci_uic | 0.8875 |
| gci_ase | 0.8754 |
| gci_qi | 0.9551 |
| gci_qes | 0.9028 |
| gci_qms | 0.7823 |
| gci_art | 0.9537 |
| gci_eap | 0.9614 |
| gci_tax | 0.8038 |
| gci_pfo | 0.8034 |
| gci_bir | 0.8196 |
| gci_flm | 0.8178 |
| gci_vca | 0.9348 |
| gci_alt | 0.9173 |
| gci_ftf | 0.8854 |
| Overall | 0.8929 |
Source: Author elaboration.
Table A4.
Factor Extraction.
| Factor | Eigenvalue | Difference | Proportion | Cumulative |
|---|---|---|---|---|
| Factor1 | 12.69255 | 8.17076 | 0.4231 | 0.4231 |
| Factor2 | 4.52179 | 2.025 | 0.1507 | 0.5738 |
| Factor3 | 2.49679 | 0.3834 | 0.0832 | 0.657 |
| Factor4 | 2.11339 | 0.70302 | 0.0704 | 0.7275 |
| Factor5 | 1.41037 | 0.40727 | 0.047 | 0.7745 |
| Factor6 | 1.0031 | 0.26279 | 0.0334 | 0.8079 |
| Factor7 | 0.74031 | 0.08379 | 0.0247 | 0.8326 |
| Factor8 | 0.65652 | 0.04794 | 0.0219 | 0.8545 |
| Factor9 | 0.60858 | 0.10995 | 0.0203 | 0.8748 |
| Factor10 | 0.49863 | 0.10722 | 0.0166 | 0.8914 |
| Factor11 | 0.39141 | 0.05993 | 0.013 | 0.9044 |
| Factor12 | 0.33148 | 0.02339 | 0.011 | 0.9155 |
| Factor13 | 0.30809 | 0.05125 | 0.0103 | 0.9258 |
| Factor14 | 0.25684 | 0.01258 | 0.0086 | 0.9343 |
| Factor15 | 0.24426 | 0.02912 | 0.0081 | 0.9425 |
| Factor16 | 0.21514 | 0.01784 | 0.0072 | 0.9496 |
| Factor17 | 0.1973 | 0.01219 | 0.0066 | 0.9562 |
| Factor18 | 0.18511 | 0.00927 | 0.0062 | 0.9624 |
| Factor19 | 0.17584 | 0.02509 | 0.0059 | 0.9682 |
| Factor20 | 0.15075 | 0.02785 | 0.005 | 0.9733 |
| Factor21 | 0.1229 | 0.00784 | 0.0041 | 0.9774 |
| Factor22 | 0.11506 | 0.01139 | 0.0038 | 0.9812 |
| Factor23 | 0.10367 | 0.01696 | 0.0035 | 0.9847 |
| Factor24 | 0.08671 | 0.00194 | 0.0029 | 0.9876 |
| Factor25 | 0.08477 | 0.01481 | 0.0028 | 0.9904 |
| Factor26 | 0.06996 | 0.0076 | 0.0023 | 0.9927 |
| Factor27 | 0.06237 | 0.0011 | 0.0021 | 0.9948 |
| Factor28 | 0.06127 | 0.01325 | 0.002 | 0.9968 |
| Factor29 | 0.04802 | 0.00101 | 0.0016 | 0.9984 |
| Factor30 | 0.04702 | . | 0.0016 | 1 |
Note: LR test: independent vs. saturated: chi2(435) = 1.9e + 04 Prob > chi2 = 0.0000. Source: Authors elaboration.
Table A5.
Factor loadings (pattern matrix) and unique variances.
| Variable | Factor1 | Factor2 | Factor3 | Factor4 | Factor5 | Factor6 | Uniqueness |
|---|---|---|---|---|---|---|---|
| fsi_fe | −0.0389 | −0.1131 | 0.8866 | −0.1944 | 0.1115 | −0.0450 | 0.1474 |
| fsi_gg | −0.0736 | −0.0453 | 0.8763 | −0.1255 | 0.0085 | −0.1178 | 0.1950 |
| fsi_ei | −0.1079 | −0.0447 | 0.7589 | 0.2115 | −0.3225 | 0.2476 | 0.2005 |
| fsi_sl | 0.0037 | −0.1644 | 0.8544 | −0.1605 | 0.0966 | 0.0353 | 0.2067 |
| gci_pr | 0.6905 | 0.2735 | −0.2330 | 0.4377 | −0.0600 | 0.2009 | 0.1585 |
| gci_ipp | 0.6561 | 0.5150 | −0.3086 | 0.2149 | 0.0021 | 0.0515 | 0.1602 |
| gci_bgr | 0.7525 | 0.2134 | 0.1722 | 0.2343 | 0.2806 | −0.0486 | 0.2226 |
| gci_art | 0.2026 | 0.7681 | −0.2532 | 0.2502 | 0.2277 | −0.0429 | 0.1886 |
| gci_eap | 0.4996 | 0.5187 | −0.1023 | 0.4949 | −0.0103 | 0.0941 | 0.2170 |
| gci_tax | −0.6666 | 0.2262 | 0.0377 | −0.0038 | 0.0903 | 0.1548 | 0.4709 |
| gci_pfo | 0.0611 | 0.1233 | −0.1500 | 0.9018 | −0.0607 | −0.0361 | 0.1404 |
| gci_bir | 0.3450 | 0.0586 | 0.1583 | 0.8310 | 0.1063 | 0.1179 | 0.1368 |
| gci_dpf | 0.8180 | 0.1850 | −0.2314 | 0.1617 | 0.2894 | 0.2114 | 0.0886 |
| gci_ptp | 0.8780 | 0.2229 | −0.0480 | 0.0155 | 0.2337 | 0.0705 | 0.1173 |
| gci_fdg | 0.8165 | 0.2543 | −0.0748 | 0.1593 | 0.2774 | 0.1637 | 0.1340 |
| gci_tgp | 0.7413 | 0.3209 | −0.0671 | 0.3392 | 0.0020 | −0.1468 | 0.2064 |
| fsi_bd | −0.2145 | −0.1924 | 0.7079 | 0.1823 | −0.1460 | 0.1343 | 0.3433 |
| fsi_ps | −0.1646 | −0.0897 | 0.8183 | 0.1777 | −0.3208 | 0.1160 | 0.1473 |
| gci_ci | 0.2242 | 0.8155 | −0.0569 | −0.0737 | 0.1443 | 0.1337 | 0.2373 |
| gci_qri | 0.1208 | 0.7504 | −0.3233 | 0.1913 | 0.2884 | 0.0811 | 0.1915 |
| gci_csr | 0.3201 | 0.8075 | 0.0285 | 0.1296 | 0.2114 | 0.2773 | 0.1063 |
| gci_uic | 0.2677 | 0.8390 | −0.1106 | 0.1290 | 0.1070 | −0.1886 | 0.1486 |
| gci_ase | 0.2414 | 0.2455 | −0.0118 | 0.2049 | 0.6944 | 0.2190 | 0.3091 |
| gci_qi | 0.6401 | 0.4017 | −0.3823 | 0.0961 | 0.0571 | −0.2993 | 0.1807 |
| gci_qes | 0.4017 | 0.4524 | 0.0453 | 0.1068 | 0.6592 | 0.0032 | 0.1859 |
| gci_qms | 0.1968 | 0.2505 | −0.2267 | −0.0330 | 0.8318 | −0.0562 | 0.1510 |
| gci_flm | 0.4032 | 0.1984 | 0.2148 | 0.4334 | 0.0035 | 0.6287 | 0.1689 |
| gci_vca | 0.5643 | 0.4005 | −0.0165 | 0.1896 | 0.2432 | 0.4894 | 0.1863 |
| gci_alt | 0.4914 | 0.4700 | −0.2904 | 0.2406 | −0.0190 | −0.4327 | 0.2078 |
| gci_ftf | 0.2554 | 0.1991 | −0.0622 | 0.8029 | 0.1699 | 0.1013 | 0.2075 |
Source: Authors elaboration.
References
- North, D.C. Institutions, Institutional Change and Economic Performance; Cambridge University Press: Cambridge, UK, 1990; ISBN 9780521397346. [Google Scholar]
- Ostrom, E. Governing the Commons; Cambrigde University Press: Cambridge, UK, 1990; ISBN 9780511807763. [Google Scholar]
- Acemoglu, D.; Johnson, S.; Robinson, J.A. The Colonial Origins of Comparative Development: An Empirical Investigation. Am. Econ. Rev. 2001, 91, S0022050701228113. [Google Scholar] [CrossRef] [Green Version]
- Acemoglu, D.; Johnson, S. Unbundling Institutions. J. Polit. Econ. 2005, 113, 949–995. [Google Scholar] [CrossRef] [Green Version]
- Acemoglu, D.; Johnson, S. Institutions, Corporate Governance. Corp. Gov. Cap. Flows Glob. Econ. 2003, 1, 327. [Google Scholar]
- Acemoglu, D.; Johnson, S.; Robinson, J.A. Reversal of fortune: Geography and institutions in the making of the modern world income distribution. Q. J. Econ. 2002, 117, 1231–1294. [Google Scholar]
- Robinson, J.A.; Acemoglu, D. Why Nations Fail: The Origins of Power, Prosperity and Poverty; Crown Publishers: New York, NY, USA, 2012; ISBN 978-0-307-71923-2. [Google Scholar]
- Porter, M.E. Competitive Strategy; Free Press: New York, NY, USA, 1990; ISBN 0029253608. [Google Scholar]
- Barney, J. Firm Resources and Sustained Competitive Advantage. J. Manag. 1991, 17, 99–120. [Google Scholar] [CrossRef]
- Ingram, P.; Silverman, B.S. Introduction: The new institutionalism in strategic management. In The New Institutionalism in Strategic Management; Emerald (MCB UP): Bingley, UK, 2002; Volume 19, pp. 1–30. ISBN 978-0-7623-0903-0. [Google Scholar]
- Peng, M.W.; Wang, D.; Jiang, Y. An institution-based view of international business strategy: A focus on emerging economies. J. Int. Bus. Stud. 2008, 39, 920–936. [Google Scholar] [CrossRef] [Green Version]
- Dunning, J.H.; McQueen, M. The eclectic theory of international production: A case study of the international hotel industry. Manag. Decis. Econ. 1981, 2, 197–210. [Google Scholar] [CrossRef]
- Rodriguez, P.; Uhlenbruck, K.; Eden, L. Government corruption and the entry strategies of multinationals. Acad. Manag. Rev. 2005, 30, 383–396. [Google Scholar]
- Wan, W.P.; Hoskisson, R.E. Home country environments, corporate diversification strategies, and firm performance. Acad. Manag. J. 2003, 46, 27–45. [Google Scholar] [CrossRef]
- Hitt, M.A. International strategy and institutional environments. Cross Cult. Strateg. Manag. 2016, 23, 206–215. [Google Scholar] [CrossRef]
- Cuervo-Cazurra, A.; Dau, L.A. Structural reform and firm exports. Manag. Int. Rev. 2009. [Google Scholar] [CrossRef]
- Cuervo-Cazurra, A.; Ramamurti, R. Home country underdevelopment and internationalization: Innovation-based and escape-based internationalization. Compet. Rev. 2017, 27, 217–230. [Google Scholar] [CrossRef]
- Özçelik, E.; Taymaz, E. Does innovativeness matter for international competitiveness in developing countries?: The case of Turkish manufacturing industries. Res. Policy 2004, 33, 409–424. [Google Scholar] [CrossRef]
- Dunning, J.H. The eclectic paradigm of international production: A restatement and some possible extensions. J. Int. Bus. Stud. 1988, 19, 1–31. [Google Scholar] [CrossRef]
- Dunning, J.H. Explaining Changing Patterns of International Production: In Defense of the Eclectic Approach. Oxf. Bull. Econ. Stat. 1979, 41, 269–295. [Google Scholar] [CrossRef]
- Peng, M.W. Towards an institution-based view of business strategy. Asia Pacific J. Manag. 2002, 251–267. [Google Scholar] [CrossRef]
- Scott, W.R. Institutions and Organizations-Foundations for Organizational Science; Sage Publications, Inc.: Thousand Oaks, CA, USA, 2001; ISBN 9780761920007. [Google Scholar]
- Luo, Y.; Xue, Q.; Han, B. How emerging market governments promote outward FDI: Experience from China. J. World Bus. 2010, 45, 68–79. [Google Scholar] [CrossRef]
- Gammeltoft, P. Emerging multinationals: Outward FDI from the BRICS countries. Int. J. Technol. Glob. 2008, 4, 5–22. [Google Scholar] [CrossRef]
- Goldstein, A.; Pusterla, F. Emerging economies’ multinationals: General features and specificities of the Brazilian and Chinese cases. Int. J. Emerg. Mark. 2010, 5, 289–306. [Google Scholar] [CrossRef]
- Nayyar, R.; Mukherjee, J. Home country impact on Outward FDI from India. J. Policy Model. 2019. [Google Scholar] [CrossRef]
- Rasiah, R.; Gammeltoft, P.; Jiang, Y. Home government policies for outward FDI from emerging economies: Lessons from Asia. Int. J. Emerg. Mark. 2010, 5, 333–357. [Google Scholar] [CrossRef]
- Ahmad, M.; Hall, S.G. Economic growth and convergence: Do institutional proximity and spillovers matter? J. Policy Model. 2017, 39, 1065–1085. [Google Scholar] [CrossRef] [Green Version]
- Peres, M.; Ameer, W.; Xu, H. The impact of institutional quality on foreign direct investment inflows: Evidence for developed and developing countries. Econ. Res. Istraživanja 2018, 31, 1–19. [Google Scholar] [CrossRef] [Green Version]
- Narula, R.; Kodiyat, T.P. The growth of outward FDI and the competitiveness of the underlying economy: The case of India. UNU-MERIT Work. Pap. 2013, 1–26. [Google Scholar] [CrossRef]
- Narula, R.; Kodiyat, T.P. How weaknesses in home country location advantages can constrain EMNE growth: The example of India. Multinatl. Bus. Rev. 2016, 24, 249–278. [Google Scholar] [CrossRef]
- Tolentino, P.E. Home country macroeconomic factors and outward FDI of China and India. J. Int. Manag. 2010, 16, 102–120. [Google Scholar] [CrossRef]
- Sun, S.L.; Peng, M.W.; Lee, R.P.; Tan, W. Institutional open access at home and outward internationalization. J. World Bus. 2015, 50, 234–246. [Google Scholar] [CrossRef] [Green Version]
- Buckley, P.J.; Cross, A.R.; Tan, H.; Xin, L.; Voss, H. Historic and emergent trends in chinese outward direct investment. Manag. Int. Rev. 2008, 48, 715–748. [Google Scholar] [CrossRef]
- Tan, D.; Meyer, K.E. Business groups’ outward FDI: A managerial resources perspective. J. Int. Manag. 2010, 16, 154–164. [Google Scholar] [CrossRef] [Green Version]
- Mathews, J.A. Dragon multinationals: New players in 21st century globalization. Asia Pacific J. Manag. 2006, 23, 5–27. [Google Scholar] [CrossRef]
- Luo, Y.; Tung, R.L. International expansion of emerging market enterprises: A springboard perspective. J. Int. Bus. Stud. 2007, 38, 481–498. [Google Scholar] [CrossRef]
- Barnard, H.; Luiz, J.M. Escape FDI and the dynamics of a cumulative process of institutional misalignment and contestation: Stress, strain and failure. J. World Bus. 2018, 53, 605–619. [Google Scholar] [CrossRef] [Green Version]
- Enderwick, P. Viewpoint escape FDI from emerging markets: Clarifying and extending the concept. Int. J. Emerg. Mark. 2017, 12, 418–426. [Google Scholar] [CrossRef]
- Cuervo-Cazurra, A.; Narula, R.; Un, A. Internationalization motives: Sell more, buy better, upgrade and escape. Multinatl. Bus. Rev. Int. 2015, 23, 25–35. [Google Scholar] [CrossRef]
- United Nations Conference on Trade and Development UNCTADstat. Available online: https://unctadstat.unctad.org/wds/ReportFolders/reportFolders.aspx?sCS_ChosenLang=en (accessed on 6 February 2019).
- Williamson, P.; Wan, F. Emerging market multinationals and the concept of ownership advantages. Int. J. Emerg. Mark. 2018, 13, 557–567. [Google Scholar] [CrossRef] [Green Version]
- Lokesha, B.; Leelavathy, D. Determinants of Foreign Direct Investment: A Macro Perspective. Indian J. Ind. Relat. 2012, 47, 459–469. [Google Scholar]
- Papageorgiadis, N.; Mcdonald, F.; Wang, C.; Konara, P. The characteristics of intellectual property rights regimes: How formal and informal institutions affect outward FDI location. Int. Bus. Rev. 2019, 101620. [Google Scholar] [CrossRef]
- Ahmad, F.; Draz, M.U.; Yang, S.C. What drives OFDI? Comparative evidence from ASEAN and selected Asian economies. J. Chin. Econ. Foreign Trade Stud. 2018, 11, 15–31. [Google Scholar] [CrossRef]
- Hall, R.E.; Jones, C.I. Why do Some Countries Produce So Much More Output Per Worker than Others? Q. J. Econ. 1999, 114, 83–116. [Google Scholar] [CrossRef]
- Knack, S.; Keefer, P. Institutions and economic performance: Cross-country tests using alternative institutional measures. Econ. Polit. 1995, 7, 207–227. [Google Scholar] [CrossRef]
- Mauro, P. Corruption and Growth. Q. J. Econ. 1995, 110, 681–712. [Google Scholar] [CrossRef]
- Rodrik, D.; Subramanian, A.; Trebbi, F. Institutions Rule: The Primacy of Institutions Over Geography and Integration in Economic Development. J. Econ. Growth 2004, 9, 131–165. [Google Scholar] [CrossRef]
- Lu, J.; Liu, X.; Wright, M.; Filatotchev, I. International experience and FDI location choices of Chinese firms: The moderating effects of home country government support and host country institutions. J. Int. Bus. Stud. 2014, 45, 428–449. [Google Scholar] [CrossRef] [Green Version]
- Adomako, S.; Amankwah-Amoah, J.; Dankwah, G.O.; Danso, A.; Donbesuur, F. Institutional voids, international learning effort and internationalization of emerging market new ventures. J. Int. Manag. 2019, 25. [Google Scholar] [CrossRef]
- Wang, C.; Hong, J.; Kafouros, M.; Boateng, A. What drives outward FDI of Chinese firms? Testing the explanatory power of three theoretical frameworks. Int. Bus. Rev. 2012, 21, 425–438. [Google Scholar] [CrossRef]
- Hoskisson, R.E.; Wright, M.; Filatotchev, I.; Peng, M.W. Emerging Multinationals from Mid-Range Economies: The Influence of Institutions and Factor Markets. J. Manag. Stud. 2013, 50, 1295–1321. [Google Scholar] [CrossRef] [Green Version]
- Estrin, S.; Meyer, K.E.; Nielsen, B.B.; Nielsen, S. Home country institutions and the internationalization of state owned enterprises: A cross-country analysis. J. World Bus. 2016, 51, 294–307. [Google Scholar] [CrossRef] [Green Version]
- Yamakawa, Y.; Peng, M.W.; Deeds, D.L. What drives new venture to internationalize from emreging economies. Theory Pract. 2008, 1, 59–82. [Google Scholar] [CrossRef] [Green Version]
- Stoian, C.; Mohr, A. Outward foreign direct investment from emerging economies: Escaping home country regulative voids. Int. Bus. Rev. 2016, 25, 1124–1135. [Google Scholar] [CrossRef]
- Song, Y.; Wu, Y.; Deng, G.; Deng, P. Intermediate Imports, Institutional Environment, and Export Product Quality Upgrading: Evidence from Chinese Micro-Level Enterprises. Emerg. Mark. Financ. Trade 2019, 1–27. [Google Scholar] [CrossRef]
- Duran, P.; van Essen, M.; Heugens, P.; Kostova, T.; Peng, M.W. The impact of institutions on the competitive advantage of publicly listed family firms in emerging markets. Glob. Strateg. J. 2019, 9, 243–274. [Google Scholar] [CrossRef]
- Mihailova, I.; Panibratov, A.; Latukha, M. Dismantling institutional complexity behind international competitiveness of emerging market firms. Thunderbird Int. Bus. Rev. 2020, 62, 77–92. [Google Scholar] [CrossRef]
- Gaur, A.S.; Ma, X.; Ding, Z. Perceived Home Country Supportiveness/Unfavorableness and Emerging Market Firms’ Outward FDI. In Proceedings of the Academy of Management Proceedings, Philadelphia, PA, USA, 1–5 August 2014; p. 14850. [Google Scholar]
- Wei, Z.; Nguyen, Q.T.K.K. Subsidiary strategy of emerging market multinationals: A home country institutional perspective. Int. Bus. Rev. 2017, 26, 1009–1021. [Google Scholar] [CrossRef]
- Deng, P.; Zhang, S. Institutional quality and internationalization of emerging market firms: Focusing on Chinese SMEs. J. Bus. Res. 2018, 92. [Google Scholar] [CrossRef]
- Cárdenas, G.; García, S.; Salas, A. Institutional framework and governance in Latin America. Int. J. Emerg. Mark. 2018, 13, 1088–1107. [Google Scholar] [CrossRef]
- Panicker, V.S.; Mitra, S.; Upadhyayula, R.S. Institutional investors and international investments in emerging economy firms: A behavioral risk perspective. J. World Bus. 2019, 54, 322–334. [Google Scholar] [CrossRef]
- Paul, J.; Benito, G.R.G. A review of research on outward foreign direct investment from emerging countries, including China: What do we know, how do we know and where should we be heading? Asia Pacific Bus. Rev. 2018, 24, 90–115. [Google Scholar] [CrossRef]
- Meyer, K.E.; Estrin, S.; Bhaumik, S.K.; Peng, M.W. Institutions, resources, and entry strategies in emerging economies. Strateg. Manag. J. 2008, 30, 1–43. [Google Scholar] [CrossRef]
- Hong, J.; Wang, C.; Kafouros, M. The role of the state in explaining the internationalization of emerging market enterprises. Br. J. Manag. 2015, 26, 45–62. [Google Scholar] [CrossRef]
- Zhu, H. (Susan); Ma, X.; Sauerwald, S.; Peng, M.W. Home Country Institutions Behind Cross-Border Acquisition Performance. J. Manag. 2019, 45, 1315–1342. [Google Scholar] [CrossRef]
- Gölgeci, I.; Assadinia, S.; Kuivalainen, O.; Larimo, J. Emerging-market firms’ dynamic capabilities and international performance: The moderating role of institutional development and distance. Int. Bus. Rev. 2019, 28. [Google Scholar] [CrossRef] [Green Version]
- Liou, R.S.; Chao, M.C.H.; Yang, M. Emerging economies and institutional quality: Assessing the differential effects of institutional distances on ownership strategy. J. World Bus. 2016, 51, 600–611. [Google Scholar] [CrossRef]
- Zhang, J.; Zhou, C.; Ebbers, H. Completion of Chinese overseas acquisitions: Institutional perspectives and evidence. Int. Bus. Rev. 2011, 20, 226–238. [Google Scholar] [CrossRef]
- Wu, B.; Deng, P. Internationalization of SMEs from emerging markets: An institutional escape perspective. J. Bus. Res. 2020, 108, 337–350. [Google Scholar] [CrossRef]
- Luo, Y. Strategic responses to perceived corruption in an emerging market: Lessons from MNEs investing in China. Bus. Soc. 2011, 50, 350–387. [Google Scholar] [CrossRef]
- Pisani, N.; Ricart, J.E. Offshoring Innovation to Emerging Countries: The Effects of IP Protection and Cultural Differences on Firms’ Decision to Augment Versus Exploit Home-Base-Knowledge; Springer: Berlin/Heidelberg, Germany, 2018; Volume 58, ISBN 0123456789. [Google Scholar]
- Marano, V.; Tashman, P.; Kostova, T. Escaping the iron cage: Liabilities of origin and CSR reporting of emerging market multinational enterprises. J. Int. Bus. Stud. 2017, 48, 386–408. [Google Scholar] [CrossRef]
- Estrin, S.; Meyer, K.E.; Pelletier, A. Emerging Economy MNEs: How does home country munificence matter? J. World Bus. 2018, 53, 514–528. [Google Scholar] [CrossRef]
- Wang, C.; Hong, J.; Kafouros, M.; Wright, M. Exploring the role of government involvement in outward FDI from emerging economies. J. Int. Bus. Stud. 2012, 43, 655–676. [Google Scholar] [CrossRef]
- Fund for Peace. Fragile States Index; The Fund for Peace: Washington, DC, USA, 2019. [Google Scholar]
- WEF The Global Competitiveness Report 2016–2017; World Economic Forum: Geneva, Switzerland, 2016; pp. 1–400.
- Kaiser, M.O. Kaiser-Meyer-Olkin measure for identity correlation matrix. J. R. Stat. Soc. 1974, 52, 296–298. [Google Scholar]
- Pires, J.C.M.; Pereira, M.C.; Alvim-Ferraz, M.C.M.; Martins, F.G. Identification of redundant air quality measurements through the use of principal component analysis. Atmos. Environ. 2009. [Google Scholar] [CrossRef]
- Jolliffe, I.T. Principal Component Analysis, Second Edition. Encycl. Stat. Behav. Sci. 2002. [Google Scholar] [CrossRef]
- Cattell, R.B. The scree test for the number of factors. Multivar. Behav. Res. 1966. [Google Scholar] [CrossRef] [PubMed]
- Vidal, R.; Yi, M.; Sastry, S. Generalized Principal Component Analysis (GPCA). IEEE Trans. Pattern Anal. Machine Intell. 2003, 27, 1945–1959. [Google Scholar] [CrossRef] [Green Version]
- Hausman, J.A. Specification Tests in Econometrics. Econometrica 1978, 46, 1251–1271. [Google Scholar] [CrossRef] [Green Version]
- Wooldridge, J.M. Econometric Analysis of Cross Section and Panel Data; The MIT Press: Cambridge, MA, USA, 2002; ISBN 0262232197. [Google Scholar]
- Sauvant, K.P.; Mendoza, K.; Irmak, I. The Rise of Transnational Corporations from Emerging Markets; Sauvant, K.P., Mendoza, K., Ince, I., Eds.; Edward Elgar Publishing: Cheltenham, UK, 2010; ISBN 9781848441460. [Google Scholar]
- Driffield, N.; Love, J.H. Foreign direct investment, technology sourcing and reverse spillovers. Manch. Sch. 2003. [Google Scholar] [CrossRef]
- Grubaugh, S.G. Determinants of Direct Foreign Investment. Rev. Econ. Stat. 1987. [Google Scholar] [CrossRef]
- Acemoglu, D.; Robinson, J.A. Institutions, Political Economy and Growth. Nobel Prize 2012 Presentation 2012, (unpublished). [Google Scholar]
- Lu, J.; Liu, X.; Wang, H. Motives for Outward FDI of Chinese Private Firms: Firm Resources, Industry Dynamics, and Government Policies. Manag. Organ. Rev. 2011, 7, 223–248. [Google Scholar] [CrossRef]
- Oxelheim, L.; Randøy, T.; Stonehill, A. On the treatment of finance-specific factors within the OLI paradigm. Int. Bus. Rev. 2001, 10, 381–398. [Google Scholar] [CrossRef] [Green Version]
- Park, B., II; Xiao, S.S. What drives outward FDI from emerging economies? The interplay between exploration orientation and home-country institutional changes. Can. J. Adm. Sci. 2017, 34, 387–400. [Google Scholar] [CrossRef]
- Cui, L.; Xu, Y. Outward FDI and profitability of emerging economy firms: Diversifying from home resource dependence in early stage internationalization. J. World Bus. 2019, 54, 372–386. [Google Scholar] [CrossRef]
- Boddewyn, J.J.; Brewer, T.L. International-business political behavior: New theoretical directions. Acad. Manag. Rev. 1994, 19, 119–143. [Google Scholar] [CrossRef]
- Rugman, A.M.; Verbeke, A. Multinational Enterprises and Public Policy. J. Int. Bus. Stud. 1998, 29, 115–136. [Google Scholar] [CrossRef]
- La Porta, R.; Lopez-de-Silanes, F.; Shleifer, A.; Vishny, R.W. Investor protection and corporate governance. Corp. Gov. Corp. Financ. A Eur. Perspect. 2007, 58, 91–110. [Google Scholar] [CrossRef]
- Hertenstein, P.; Sutherland, D.; Anderson, J. Internationalization within networks: Exploring the relationship between inward and outward FDI in China’s auto components industry. Asia Pacific J. Manag. 2017. [Google Scholar] [CrossRef] [Green Version]
- Li, J.; Li, Y.; Shapiro, D. Knowledge Seeking and Outward FDI of Emerging Market Firms: The Moderating Effect of Inward FDI. Glob. Strateg. J. 2012, 2, 277–295. [Google Scholar] [CrossRef]
- Xia, J.; Ma, X.; Lu, J.W.; Yiu, D.W. Outward foreign direct investment by emerging market firms: A resource dependence logic. Strateg. Manag. J. 2013. [Google Scholar] [CrossRef]
Figure 1.
Evolution of outward FDI (OFDI) Stocks. Source: Authors based on United Nations Conference on Trade and Development [41]. Authors’ elaboration.
Figure 1.
Evolution of outward FDI (OFDI) Stocks. Source: Authors based on United Nations Conference on Trade and Development [41]. Authors’ elaboration.

Figure 2.
Scree plot. Source: Authors’ elaboration.

Table 1.
Main Methodologies.
| Binary Response Models and GEE | OLS (Cross-Sectional) | Hierarchical or Mixed Models | Cluster, PCA, Factor Analysis | Tobit | Theoretical | Panel Data | Dynamic Panel Data | Meta-Analysis | Multiple Case Study |
|---|---|---|---|---|---|---|---|---|---|
| (Lu et al., 2014) [50] | (Adomako et al., 2019) [51] | (Wang et al., 2012) [52] | (Hoskisson et al., 2013) [53] | (Estrin, et al., 2016) [54] | (Yamakawa et al., 2008) [55] | (Stoian & Mohr, 2016) [56] | (Song et al., 2019) [57] | (Duran et al., 2019) [58] | (Mihailova et al., 2020) [59] |
| (Gaur et al., 2014) [60] | (Wei & Nguyen, 2017) [61] | (Deng & Zhang, 2018) [62] | (Cárdenas et al., 2018) [63] | (Panicker et al., 2019) [64] | Paul, J., & Benito, G. R. G. (2018) [65] | ||||
| (Meyer, et al., 2008) [66] | (Hong et al., 2015) [67] | (Zhu et al., 2019) [68] | (Gölgeci et al., 2019) [69] | (Liou et al., 2016) [70] | (Peng et al., 2008) [11] | ||||
| (Zhang et al., 2011) [71] | (Wu & Deng, 2020) [72] | (Luo, 2011) [73] | |||||||
| (Pisani & Ricart, 2018) [74] | (Wan & Hoskisson, 2003) [14] | ||||||||
| (Marano, et al., 2017) [75] |
Source: Authors’ elaboration.
Table 2.
Recurrent Data Sources.
| Data Source | Papers |
|---|---|
| Economic Freedom of the World | (Zhu et al., 2019) [68] |
| Project GLOBE | (Estrin et al., 2016; Zhang et al., 2011; Zhu et al., 2019) [54,68,71] |
| International Monetary Fund’s World Economic Outlook | (Estrin et al., 2018) [76] |
| IMD World Competitiveness Dataset | (Stoian & Mohr, 2016) [56] |
| Worldwide Governance Indicators | (Cárdenas et al., 2018; Estrin et al., 2016; Liou et al., 2016) [54,63,70] |
| Global Competitiveness Report—WEF | (Cárdenas et al., 2018; Duran et al., 2019; Liou et al., 2016) [58,63,70] |
| World Investment Report | (Estrin et al., 2016; Liou et al., 2016; Luo et al., 2010; Marano et al., 2017; Meyer et al., 2008; Wang et al., 2012; Yamakawa et al., 2008; Zhang et al., 2011) [23,54,55,63,66,71,75,77] |
| International Country Risk Guide | (Lu et al., 2014; Stoian & Mohr, 2016; Wan & Hoskisson, 2003; Zhang et al., 2011) [14,50,56,71] |
| Corruption Perception Index | (Luo, 2011) [73] |
| Fortune Global 500 | (Marano et al., 2017; Wang et al., 2012) [52,75] |
Source: Authors’ elaboration.
Table 3.
Types of variables.
| Dependent Variable | Independent Variable | Control Variables | Moderating Variables | Instrumental Variables |
|---|---|---|---|---|
| Degree of internationalization | Corruption/Control of Corruption | Distance/Geographic/Cultural/Economic | Political stability | Legal Origin |
| Firm performance | FDI Inflows | GDP Home/Host | Regulatory effectiveness | Population |
| GDP/GDP per capita | Rule of Law/Law & Order | Risk Economic/Financial | FDI (inward) flows | |
| Institutional quality | Bureaucracy | State ownership | Size of the Public Sector | |
| FDI (Inward)/Flows/Stocks/Spillovers | Institutional quality | Macroeconomic uncertainty | Fiscal freedom | |
| Investment | Distance | Trade openness | Trade freedom | |
| Outward FDI/Flows/Positions/Acquisitions | Voice and Accountability | Population | Home market size | |
| New Products | Political stability | Common language | Regulatory institutional quality | |
| Export intensity | Government effectiveness | GDP per capita | ||
| Economic growth | GDP per capita | Colony | ||
| Innovation capability | Legal extensiveness | Firm age | ||
| Per capita income | Quality of local infrastructures | Industry effects | ||
| Internationalization decision | Market size | Exports | ||
| Return on assets | Education/Quality of Education | Firm size/Subsidiary Size | ||
| Technological Intensity | Ethnic index | Research and Development | ||
| Labor/Labor market/Labor intensity | Business Group | |||
| Property rights | FDI (inward) flows | |||
| Trade/Trade openness | Control of Corruption | |||
| Green Innovation | Government Effectiveness |
Source: Authors’ elaboration.
Table 4.
Countries included in the study.
| Region | Countries |
|---|---|
| Latin America and the Caribbean | Argentina, Brazil, Chile, Colombia, Jamaica, Mexico, Peru and Venezuela |
| Europe | Bulgaria, Croatia, Czech Republic, Estonia, Greece, Hungary, Latvia, Lithuania, Poland, Romania, Slovenia, Serbia and Ukraine |
| Asia | Bangladesh, China, India, Indonesia, Kazakhstan, Malaysia, Pakistan, the Philippines, Russia, Sri Lanka, Thailand and Vietnam |
| Africa | Kenya, Nigeria, Namibia, South Africa, Uganda and Zambia |
| MENA | Egypt, Jordan, Kuwait, Morocco, Qatar, Tunisia, Turkey and the United Arab Emirates |
Source: Authors’ elaboration.
Table 5.
Major Loadings of the Factors.
| Factor | Variable | Description | Loading |
|---|---|---|---|
| 1. Transparency of the Government | gci_dpf | Diversion of public funds | 0.8180 |
| gci_ptp | Public trust in politicians | 0.8780 | |
| gci_fdg | Favoritism in decisions of government officials | 0.8165 | |
| 2. Research, development and innovation | gci_ci | Capacity for innovation | 0.8155 |
| gci_csr | Company spending on R&D | 0.8075 | |
| gci_uic | University-industry collaboration in R&D | 0.8390 | |
| 3. Inequality | fsi_fe | Factionalized Elites | 0.8866 |
| fsi_gg | Group Grievance | 0.8763 | |
| fsi_sl | State Legitimacy | 0.8544 | |
| 4. Rules for Inward FDI | gci_ftf | FDI and technology transfer | 0.8029 |
| gci_pfo | Prevalence of foreign ownership | 0.9018 | |
| gci_bir | The business impact of rules on FDI | 0.8310 | |
| 5. Education and training | gci_qms | Quality of math and science education | 0.8318 |
| gci_ase | Availability of scientists and engineers | 0.6944 | |
| gci_qes | Quality of the education system | 0.6592 | |
| 6. Financial Market | gci_flm | Financing through the local equity market | 0.6287 |
| gci_vca | Venture capital availability | 0.4894 |
Source: Authors’ elaboration.
Table 6.
Results of estimated models.
| (1) | (2) | (3) | (4) | (5) | (6) | (7) | |
|---|---|---|---|---|---|---|---|
| Variables | OLS_Rob | RE_Rob | FE_Rob | RE_Rob_ar(1) | FE_Rob_ar(1) | RE_Rob_C | FE_Rob_C |
| L.l_ofdi_s | 0.931 *** | 0.681 *** | |||||
| (0.027) | (0.077) | ||||||
| Transparency of the Government | 0.281 *** | 0.131 ** | 0.098 | 0.042 *** | 0.150 ** | 0.034 | 0.038 |
| (0.092) | (0.057) | (0.064) | (0.016) | (0.070) | (0.055) | (0.057) | |
| Research, development, and innovation | 0.507 *** | 0.163 *** | 0.110* | 0.015 | 0.024 | 0.091 | 0.056 |
| (0.117) | (0.061) | (0.065) | (0.017) | (0.049) | (0.058) | (0.063) | |
| Inequality | −0.673 *** | −0.501 *** | −0.225 | −0.042 * | −0.225 | −0.105 | −0.111 |
| (0.131) | (0.115) | (0.209) | (0.023) | (0.149) | (0.126) | (0.187) | |
| Rules for Inward FDI | −0.186 * | −0.060 | −0.072 | 0.006 | 0.001 | −0.030 | −0.037 |
| (0.110) | (0.059) | (0.065) | (0.015) | (0.029) | (0.057) | (0.062) | |
| Education and training | −0.177 * | −0.146 | −0.156 | −0.017 | −0.041 | −0.185 * | −0.152 |
| (0.104) | (0.104) | (0.114) | (0.013) | (0.068) | (0.103) | (0.114) | |
| Financial Market | −0.104 | −0.194 *** | −0.194 *** | 0.030 ** | −0.008 | −0.152 *** | −0.154 *** |
| (0.070) | (0.045) | (0.044) | (0.015) | (0.015) | (0.042) | (0.042) | |
| Constant | 1.492 *** | 1.492 *** | 1.492 *** | 0.192 *** | 0.550 *** | −7.899 *** | −9.685 *** |
| (0.133) | (0.153) | (0.000) | (0.048) | (0.111) | (1.822) | (3.203) | |
| l_gdppck | 0.996 *** | 1.184 *** | |||||
| (0.192) | (0.338) | ||||||
| inflation | −0.010** | −0.011 *** | |||||
| (0.004) | (0.004) | ||||||
| Observations | 528 | 528 | 528 | 480 | 480 | 528 | 528 |
| R-squared | 0.438 | 0.374 | 0.215 | 0.941 | 0.596 | 0.489 | 0.262 |
| Groups | 48 | 48 | 48 | 48 | 48 | 48 | |
| Breush-Pagan test | χ2(1) = 1346 p-value = 0.000 | ||||||
| Hausman test | F(6515) = 3.77 p-value = 0.0011 | F(6515) = 3.98 p-value = 0.0007 | |||||
| AIC | 682.99 | 207.76 | |||||
| BIC | 708.61 | 236.98 | |||||
Note: Robust standard errors in parentheses, *** p < 0.01, ** p < 0.05, * p < 0.1. R-squared is the within R-squared for the fixed effects and the overall for the random effects. Source: Authors’ elaboration.
Publisher’s Note: MDPI stays neutral with regard to jurisdictional claims in published maps and institutional affiliations. |
© 2020 by the authors. Licensee MDPI, Basel, Switzerland. This article is an open access article distributed under the terms and conditions of the Creative Commons Attribution (CC BY) license (http://creativecommons.org/licenses/by/4.0/).
Share and Cite
MDPI and ACS Style
Buitrago R., R.E.; Barbosa Camargo, M.I. Home Country Institutions and Outward FDI: An Exploratory Analysis in Emerging Economies. Sustainability 2020, 12, 10010. https://doi.org/10.3390/su122310010
AMA Style
Buitrago R. RE, Barbosa Camargo MI. Home Country Institutions and Outward FDI: An Exploratory Analysis in Emerging Economies. Sustainability. 2020; 12(23):10010. https://doi.org/10.3390/su122310010
Chicago/Turabian StyleBuitrago R., Ricardo E., and María Inés Barbosa Camargo. 2020. "Home Country Institutions and Outward FDI: An Exploratory Analysis in Emerging Economies" Sustainability 12, no. 23: 10010. https://doi.org/10.3390/su122310010
Note that from the first issue of 2016, this journal uses article numbers instead of page numbers. See further details here.