Effect of Chloride Ions on the Electrochemical Oxidation of Chalcopyrite at 340 °C and 21 MPa


1
Key Laboratory of High-Temperature and High-Pressure Study of the Earth’s Interior, Institute of Geochemistry, Chinese Academy of Sciences, Guiyang 550081, China
2
School of Fundamental Sciences, Zhejiang Pharmaceutical College, Ningbo 315100, China
3
College of Chemistry and Materials Engineering, Guiyang University, Guiyang 550005, China
*
Author to whom correspondence should be addressed.
Minerals 2020, 10(12), 1071; https://doi.org/10.3390/min10121071
Submission received: 29 October 2020
/
Revised: 16 November 2020
/
Accepted: 19 November 2020
/
Published: 29 November 2020
(This article belongs to the Section Mineral Geochemistry and Geochronology)
Abstract
:Understanding the oxidative mechanisms of chalcopyrite in various hydrothermal fluids is of great significance to improve copper extraction and to model the geochemical cycling of copper, iron, and sulfur. This paper investigated the effect of NaCl on the electrochemical oxidation of chalcopyrite at 340 °C and 21 MPa using polarization curves, electrochemical impedance spectroscopy (EIS), scanning electron microscopy (SEM), energy dispersive X-ray spectroscopy (EDS), and Raman spectroscopy. The experimental results showed that NaCl can promote chalcopyrite leaching. As NaCl concentration increases, the protective property of the oxidation layer degraded. In the absence of NaCl, the oxidation layer that consisted of CuSn, (n ≥ 1), probably with some Fe2O3 and Fe(OH)3 and also in the presence of NaCl, Fe2O3, is the principal oxidation product. More rapid ionic diffusion and further chemical reaction contributed to the improvement of chalcopyrite dissolution with increasing NaCl concentration. A dissolution mechanism is proposed in this paper to explain the chalcopyrite leaching processes which is dependent on NaCl concentration.
1. Introduction
Chalcopyrite (CuFeS2) is the most abundant Cu-bearing ore mineral, present in volcanogenic massive sulfide ore deposits and sedimentary exhalative deposits formed by hydrothermal circulation [1,2,3]. The electrochemical oxidation of chalcopyrite in hydrothermal system affects the dissolved transition metal concentrations and the mineral stabilities in fluids. Jarosite, the element sulfur, and metal-deficient polysulfide have been considered as the possible composition of the passivation layer to inhibit further chalcopyrite oxidation [4,5]. Understanding the chalcopyrite electrochemical processes by hydrometallurgical routes at high temperature and pressure can be achieved by investigating chalcopyrite oxidation products and their leach rate.
As Cl− is common in hydrothermal fluids, and investigating the effect of NaCl on the electrochemical oxidation of chalcopyrite at high temperature and pressure could (1) model the geochemical cycling of copper, iron, and sulfur, and (2) provide an alternative way to improve copper extraction. At low temperature and pressure, chloride ions addition can increase the crystallinity and porosity of sulfur on the chalcopyrite surface and form copper salts (CuCl0, , , or ) in the solution, leading to higher dissolution kinetics of chalcopyrite [6]. However, increases in chloride concentration have little effect on the leaching kinetics of chalcopyrite if chloride concentrations are above 0.5 M [7,8,9]. There are few studies addressing the effect of NaCl concentration on the leaching rate and dissolution pathway of chalcopyrite at high temperature and pressure. As Sun et al. reported [10], this was attributed to three reasons: (1) contamination of experimental solution by corrosion of the apparatus; (2) the difficulty of developing an effective reference electrode to detect in situ electrochemical behavior, and (3) the difficulty in maintaining stable electrochemical tests in high temperature and pressure conditions. In addition, chalcopyrite is often associated with other sulfide minerals, such as pyrite and galena in hydrothermal ore. The galvanic coupling between them affects the experimental results [11]. It is therefore necessary to investigate the influence of chloride ions on the chalcopyrite oxidative mechanism in harsh working conditions to resolve these problems.
The purpose of this study is to reveal the effect of Cl− on the leaching rate and the dissolution pathway of chalcopyrite at 340 °C and 21 MPa by in situ electrochemical measurements and surface characteristics. The electrochemical parameters of the leaching reactions in the chalcopyrite/solution interface are provided by polarization curves and electrochemical impedance spectroscopy (EIS). The surface morphologies of oxidized chalcopyrite are observed by scanning electron microscope (SEM). The chemical composition of oxide products at the deposit surface is examined by energy dispersive X-ray spectroscopy (EDS). The mineral phases of leached chalcopyrite are identified by Raman spectroscopy. Finally, a dissolution mechanism is elucidated according to the experimental results. This work provides an experimental basis for an alternative way to accelerate chalcopyrite leaching with chloride ions at high temperature and pressure.
2. Materials and Methods
2.1. Electrode and Electrolyte Preparation
A sample of pure chalcopyrite was obtained from Dongchuan copper mine, Yunnan Province, China and was used to sinter pure, compact, and malleable chalcopyrite blocks [12]. The chemical composition of these blocks was checked by energy-dispersive X-ray spectrometry and listed in Table 1. Electrodes were made by machining the chalcopyrite block into truncated cone-like shapes, which were successively polished with 1500, 3000, and 5000 grit silicon carbide papers and rinsed with acetone. Before each experiment, the area of working electrode was measured under a microscope. The counter electrode was a platinum electrode, using conical alumina ceramic as the carrier and sintering platinum powder on the two circular surfaces of the conical ceramic, with Pt wire insulating in the ceramic to link with the two surfaces. The area of the exposed surface was constantly 0.45 cm2. The reference electrode was an Ag/AgCl pressure-balanced external reference electrode with its 0.1 M KCl reference solution. Considering that the reference electrode was at ambient temperature (25 °C) and system pressure via the reference solution bridge, the temperature gradient between the high temperature system and the room temperature reference electrode gave rise to a thermal diffusion potential [10]. This problem was solved by Macdonald et al. [13], where the calibrated equation of the electrode potential was as follows:
where is the observed potential of the working electrode vs. the Ag/AgCl external reference electrode, and is the corresponding potential vs. the standard hydrogen electrode (SHE) at the experimental temperature. In , T is the experimental temperature.
The solutions with various NaCl concentrations (0 mol/L, 0.05, 0.1 and 0.2 mol/L) were prepared by adding NaCl into ultrapure water. Argon was pumped into the solution until the concentration of dissolved oxygen (DO) measured by a DO analyzer (85, YSI, Yellow Springs, OH, USA) was maintained at 0.1 ± 0.02 mg/L for each experiment. Due to the high corrosion resistance of the titanium inside the liner in the autoclave body and the renewed NaCl solution for each experiment, the experimental solution was not significantly contaminated by its container.
2.2. Electrochemical Measurements
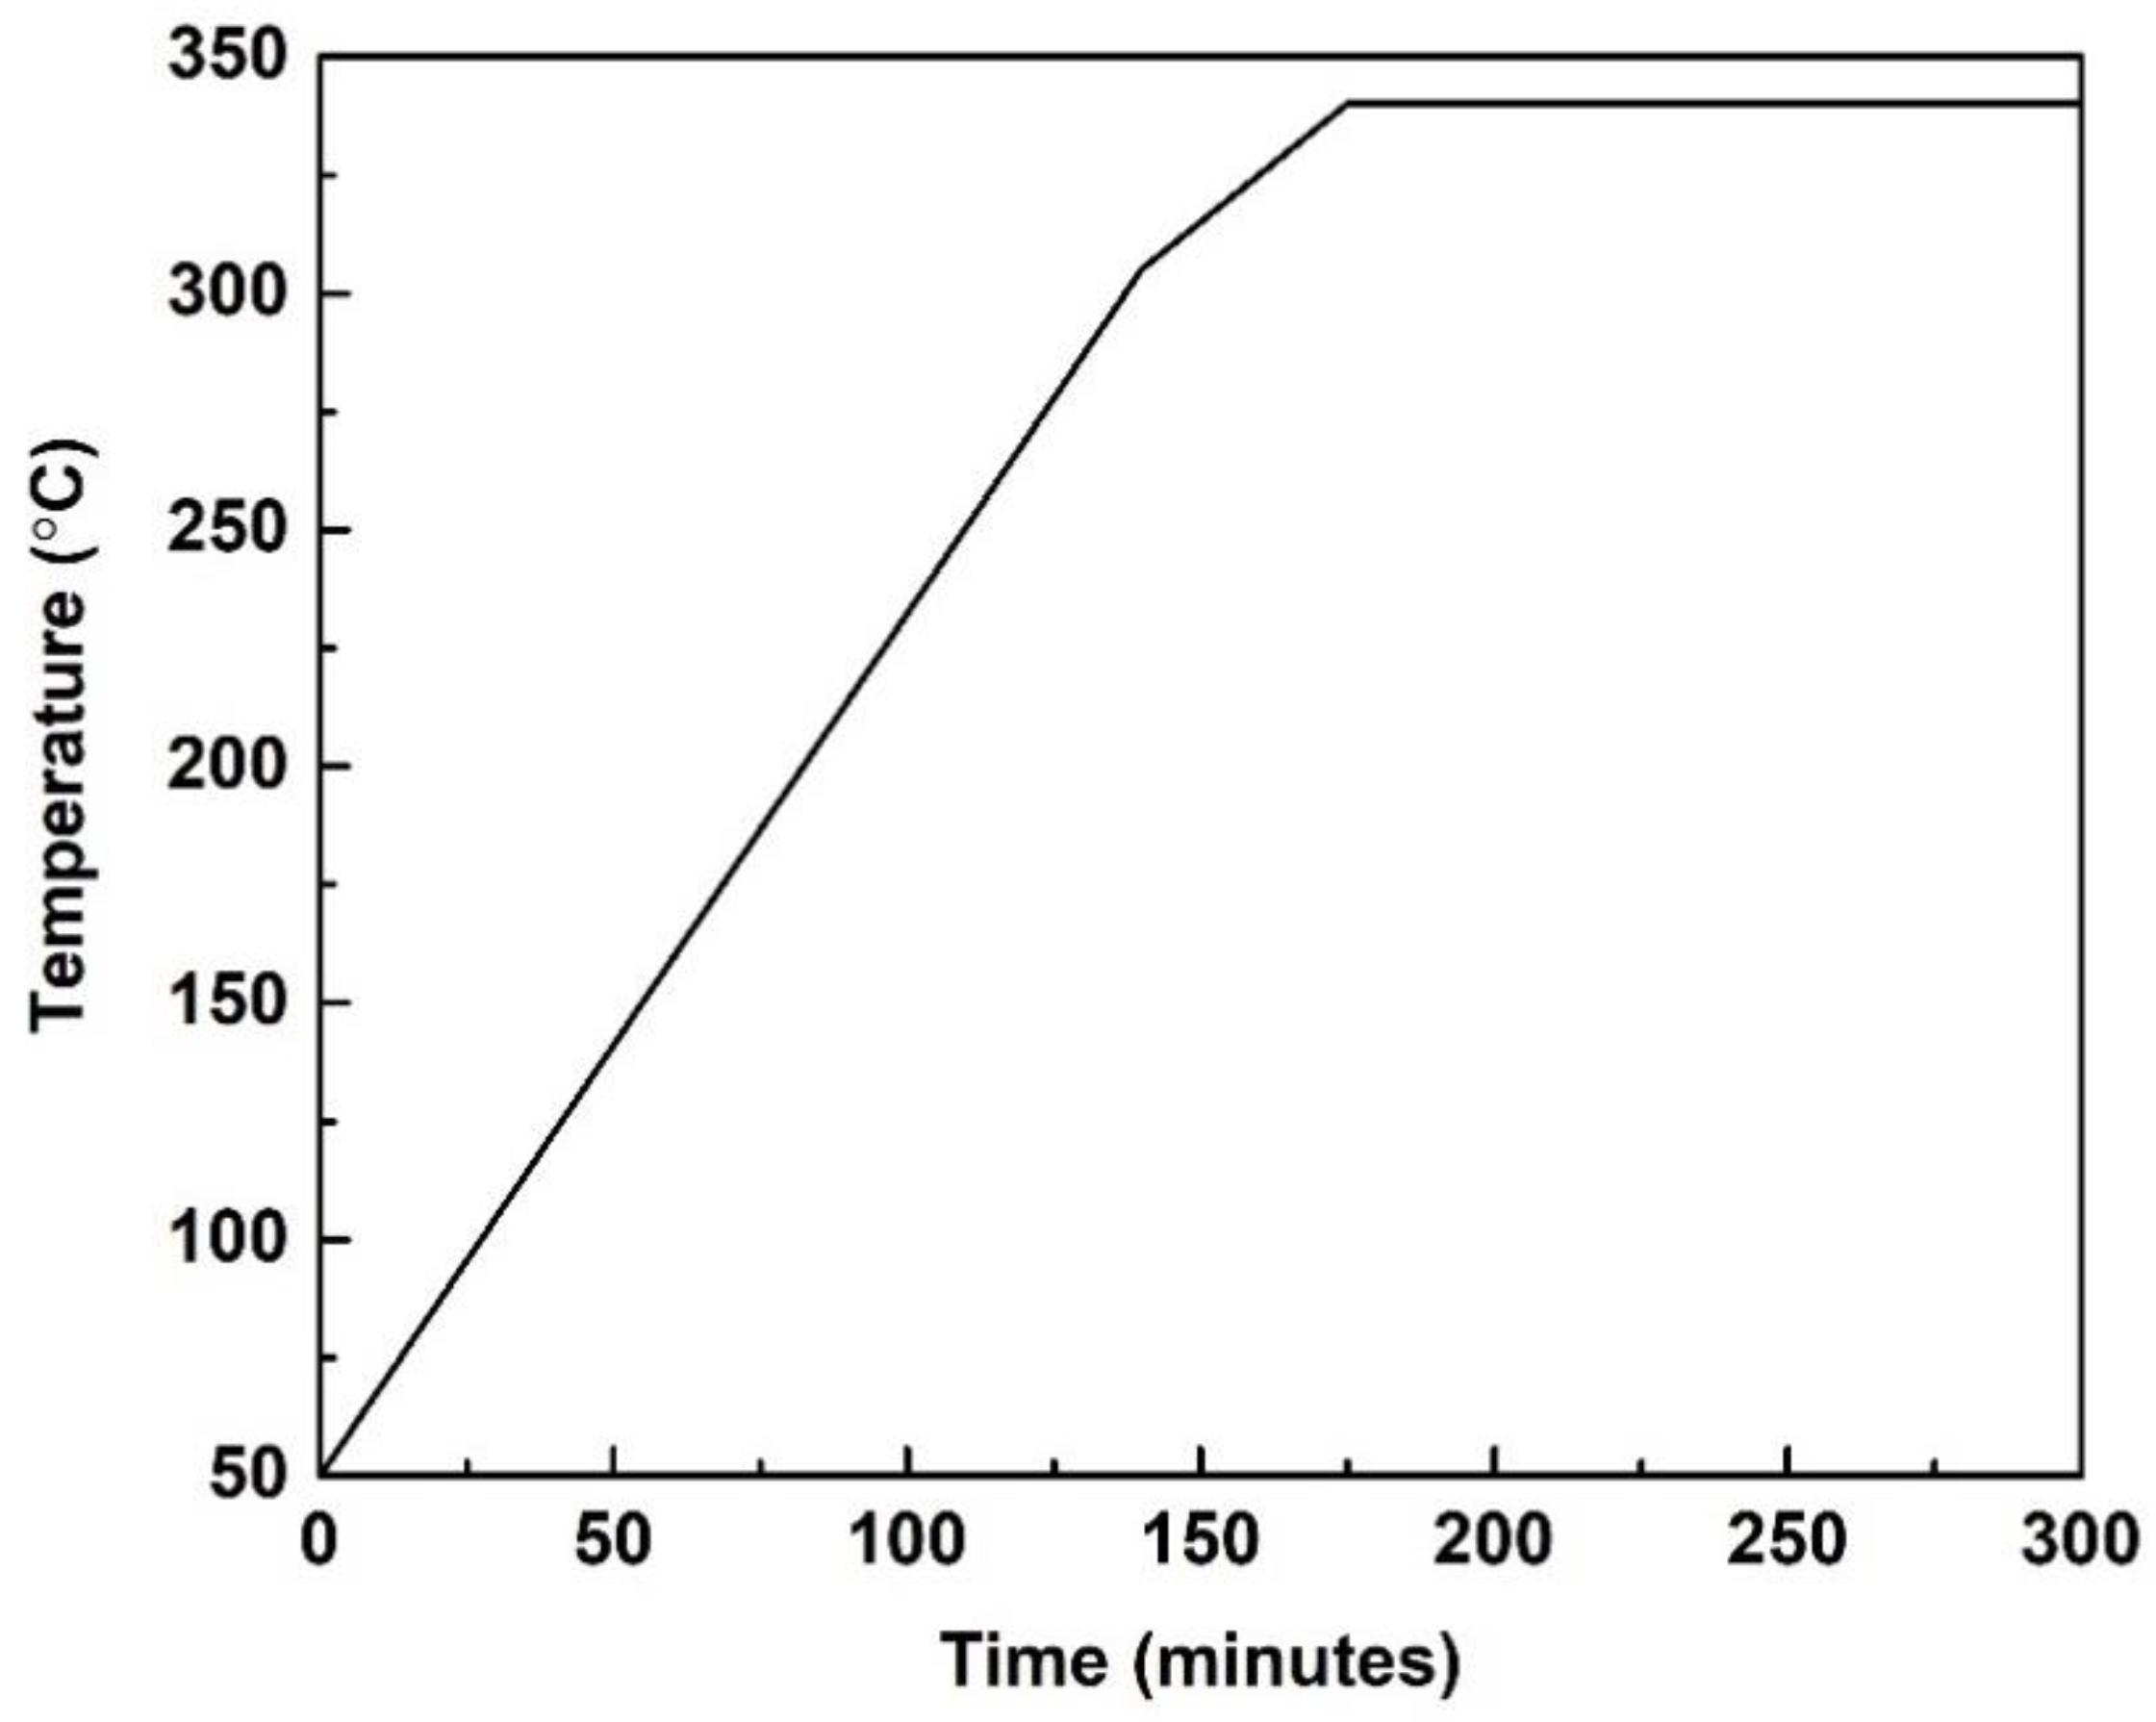
The electrochemical experiments were performed in an autoclave with three electrodes, using an assembly similar to that described by Lin et al. [14]. All electrochemical measurements were conducted by means of a computer-controlled electrochemical measurement system (PAR-STAT 2263, Princeton Applied Research, 2263A). Argon was pumped into the autoclave to remove air, and the final pressure was adjusted before heating. All experiments were conducted without any oxygen fugacity buffers. Then, the temperature of the solution was raised to 340 ± 1 °C for three hours, as shown in Figure 1. The final temperature and the corresponding pressure were maintained at 340 ± 1 °C and 21 ± 1.5 MPa, respectively. Four hours of OCP (open circuit potentials) recording started immediately after the autoclave was heated so that the OCP could reach a quasisteady state. Afterwards, EIS tests were conducted at OCP in the frequency range of 0.01–10,000 Hz with a peak-to-peak amplitude of 10 mV. Then, polarization curves were obtained by changing the electrode potential from −0.4 to +1.0 V (vs. OCP) at a scan rate of 2 mV·s-1 successively. ZSimpWin 3.20 (2004) software was then used to fit the impedance data.
2.3. Surface Characterization Measurements
After the chalcopyrite blocks were sintered, abraded and cleaned, they were exposed to the solutions with different NaCl concentrations (0, 0.1, and 0.2 mol/L) before heating. The solutions were then heated to 340 ± 1 °C for three hours (Figure 1) and maintained at 340 ± 1 °C for one hour. After four hours, the final chalcopyrite samples were obtained. The structure and the chemical composition of the chalcopyrite surface were characterized by a scanning electron microscopy (SEM) (JSM-7800F, JEOL, Tokyo, Japan) equipped with an energy-dispersive X-ray spectroscopy (EDS) (EDAX TEAM Apollo XL, Ametek, San Diego, CA, USA). The mineral phases of the leached chalcopyrite were identified by using a confocal micro-Raman spectroscopy system (inVia, Renishaw, London, UK) with a 514.5 nm argon laser excitation line. A laser power of 8 mW was used as an excitation source. A collection time of 60 s was used for each spectrum, and five spectra were accumulated for each acquisition to avoid the further oxidation of chalcopyrite. The spectra were collected with a CCD detector (RenCam, Renishaw, London, UK) using backscattering geometry and an objective lens with a ×50 magnification.
3. Results and Discussion
3.1. Polarization Curves
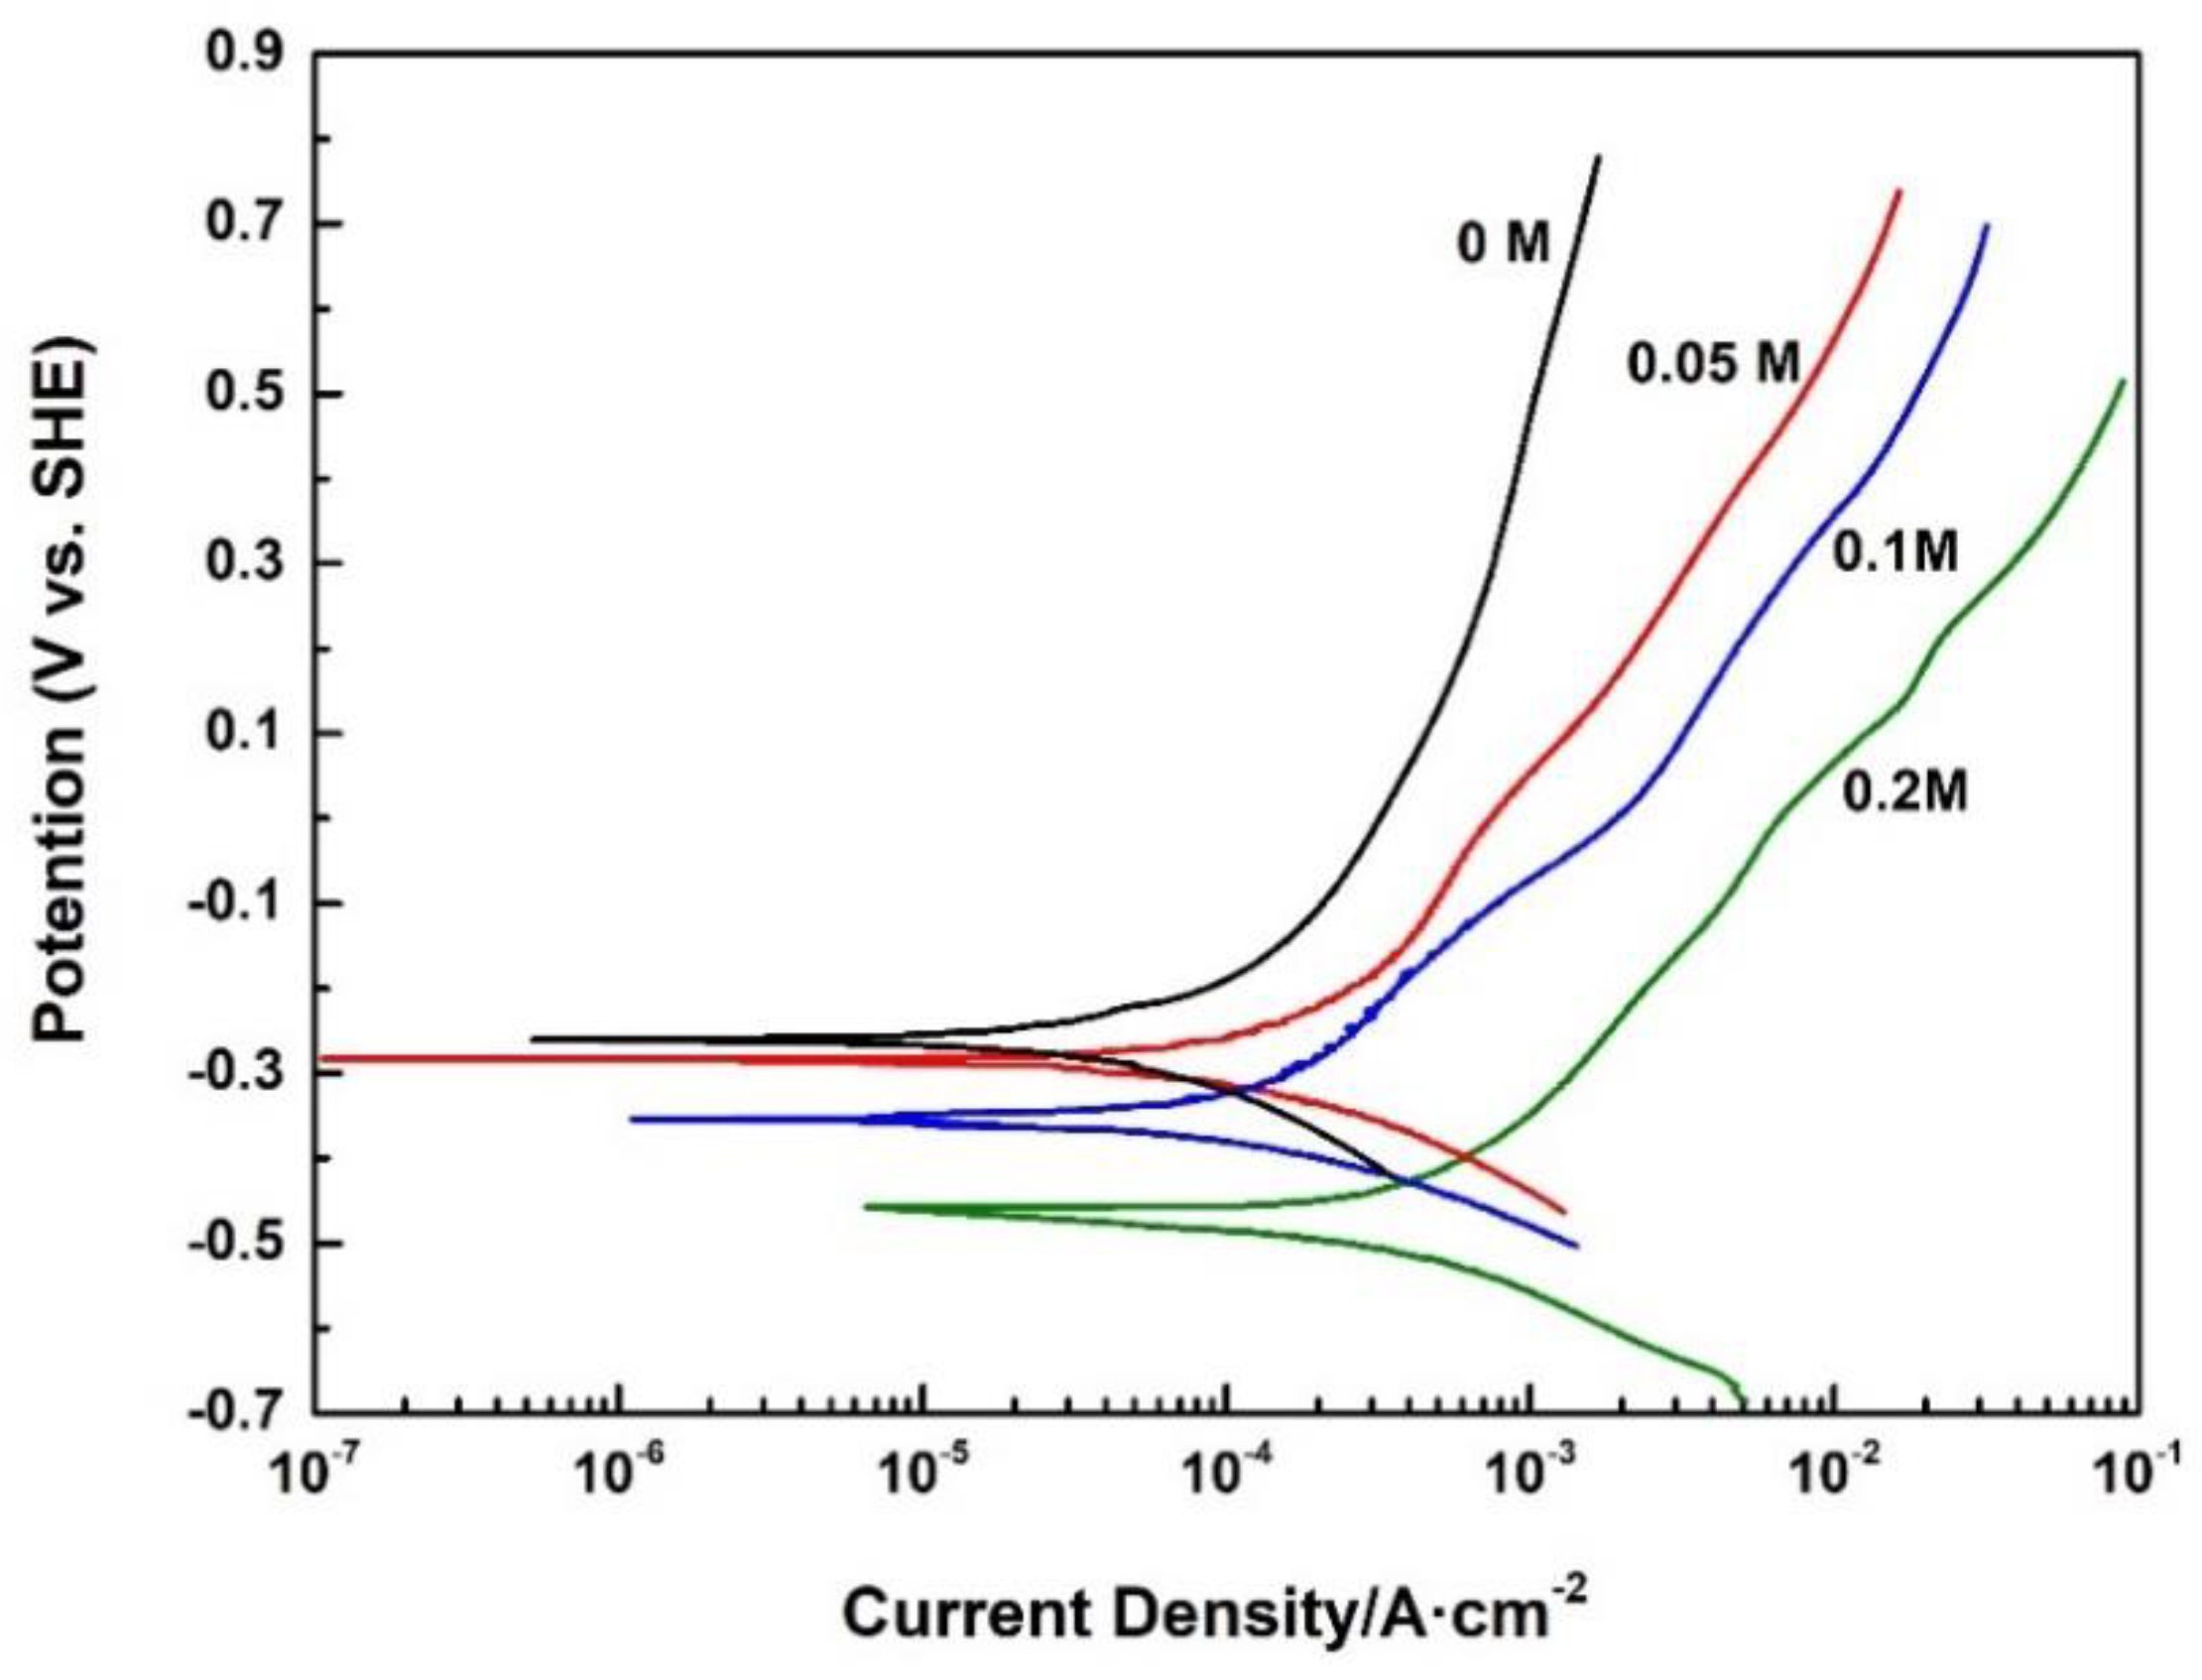
Potentiodynamic polarization is a direct current technique that gives fundamental information, such as the activity and susceptibility to corrosion of the material [15]. Figure 2 represents the polarization curves of chalcopyrite in the solutions with various NaCl concentrations (0, 0.05, 0.1 and 0.2 mol/L) at 340 ± 1 °C and 21 ± 1.5 MPa, with a scan rate of 2 mV·s−1. It was observed that the anodic current density increased a little throughout the positive scan of polarization curves due to the formation of relatively stable surface coating during the chalcopyrite oxidizing processes in the electrolyte without NaCl. However, in the NaCl-containing electrolyte, the anodic current density increased rapidly with increasing anodic potential as the result of the covered unstable oxide products. While the concentration of Cl− increased from 0 to 0.2 mol/L, Ecorr decreased from −0.257 to −0.473 V, and icorr increased from 94.34 to 452.50 μA·cm−2, also confirming that the surface layer became less stable. Therefore, the presence of Cl− can accelerate the chemical leaching of chalcopyrite.
3.2. Electrochemical Impedance Spectroscopy
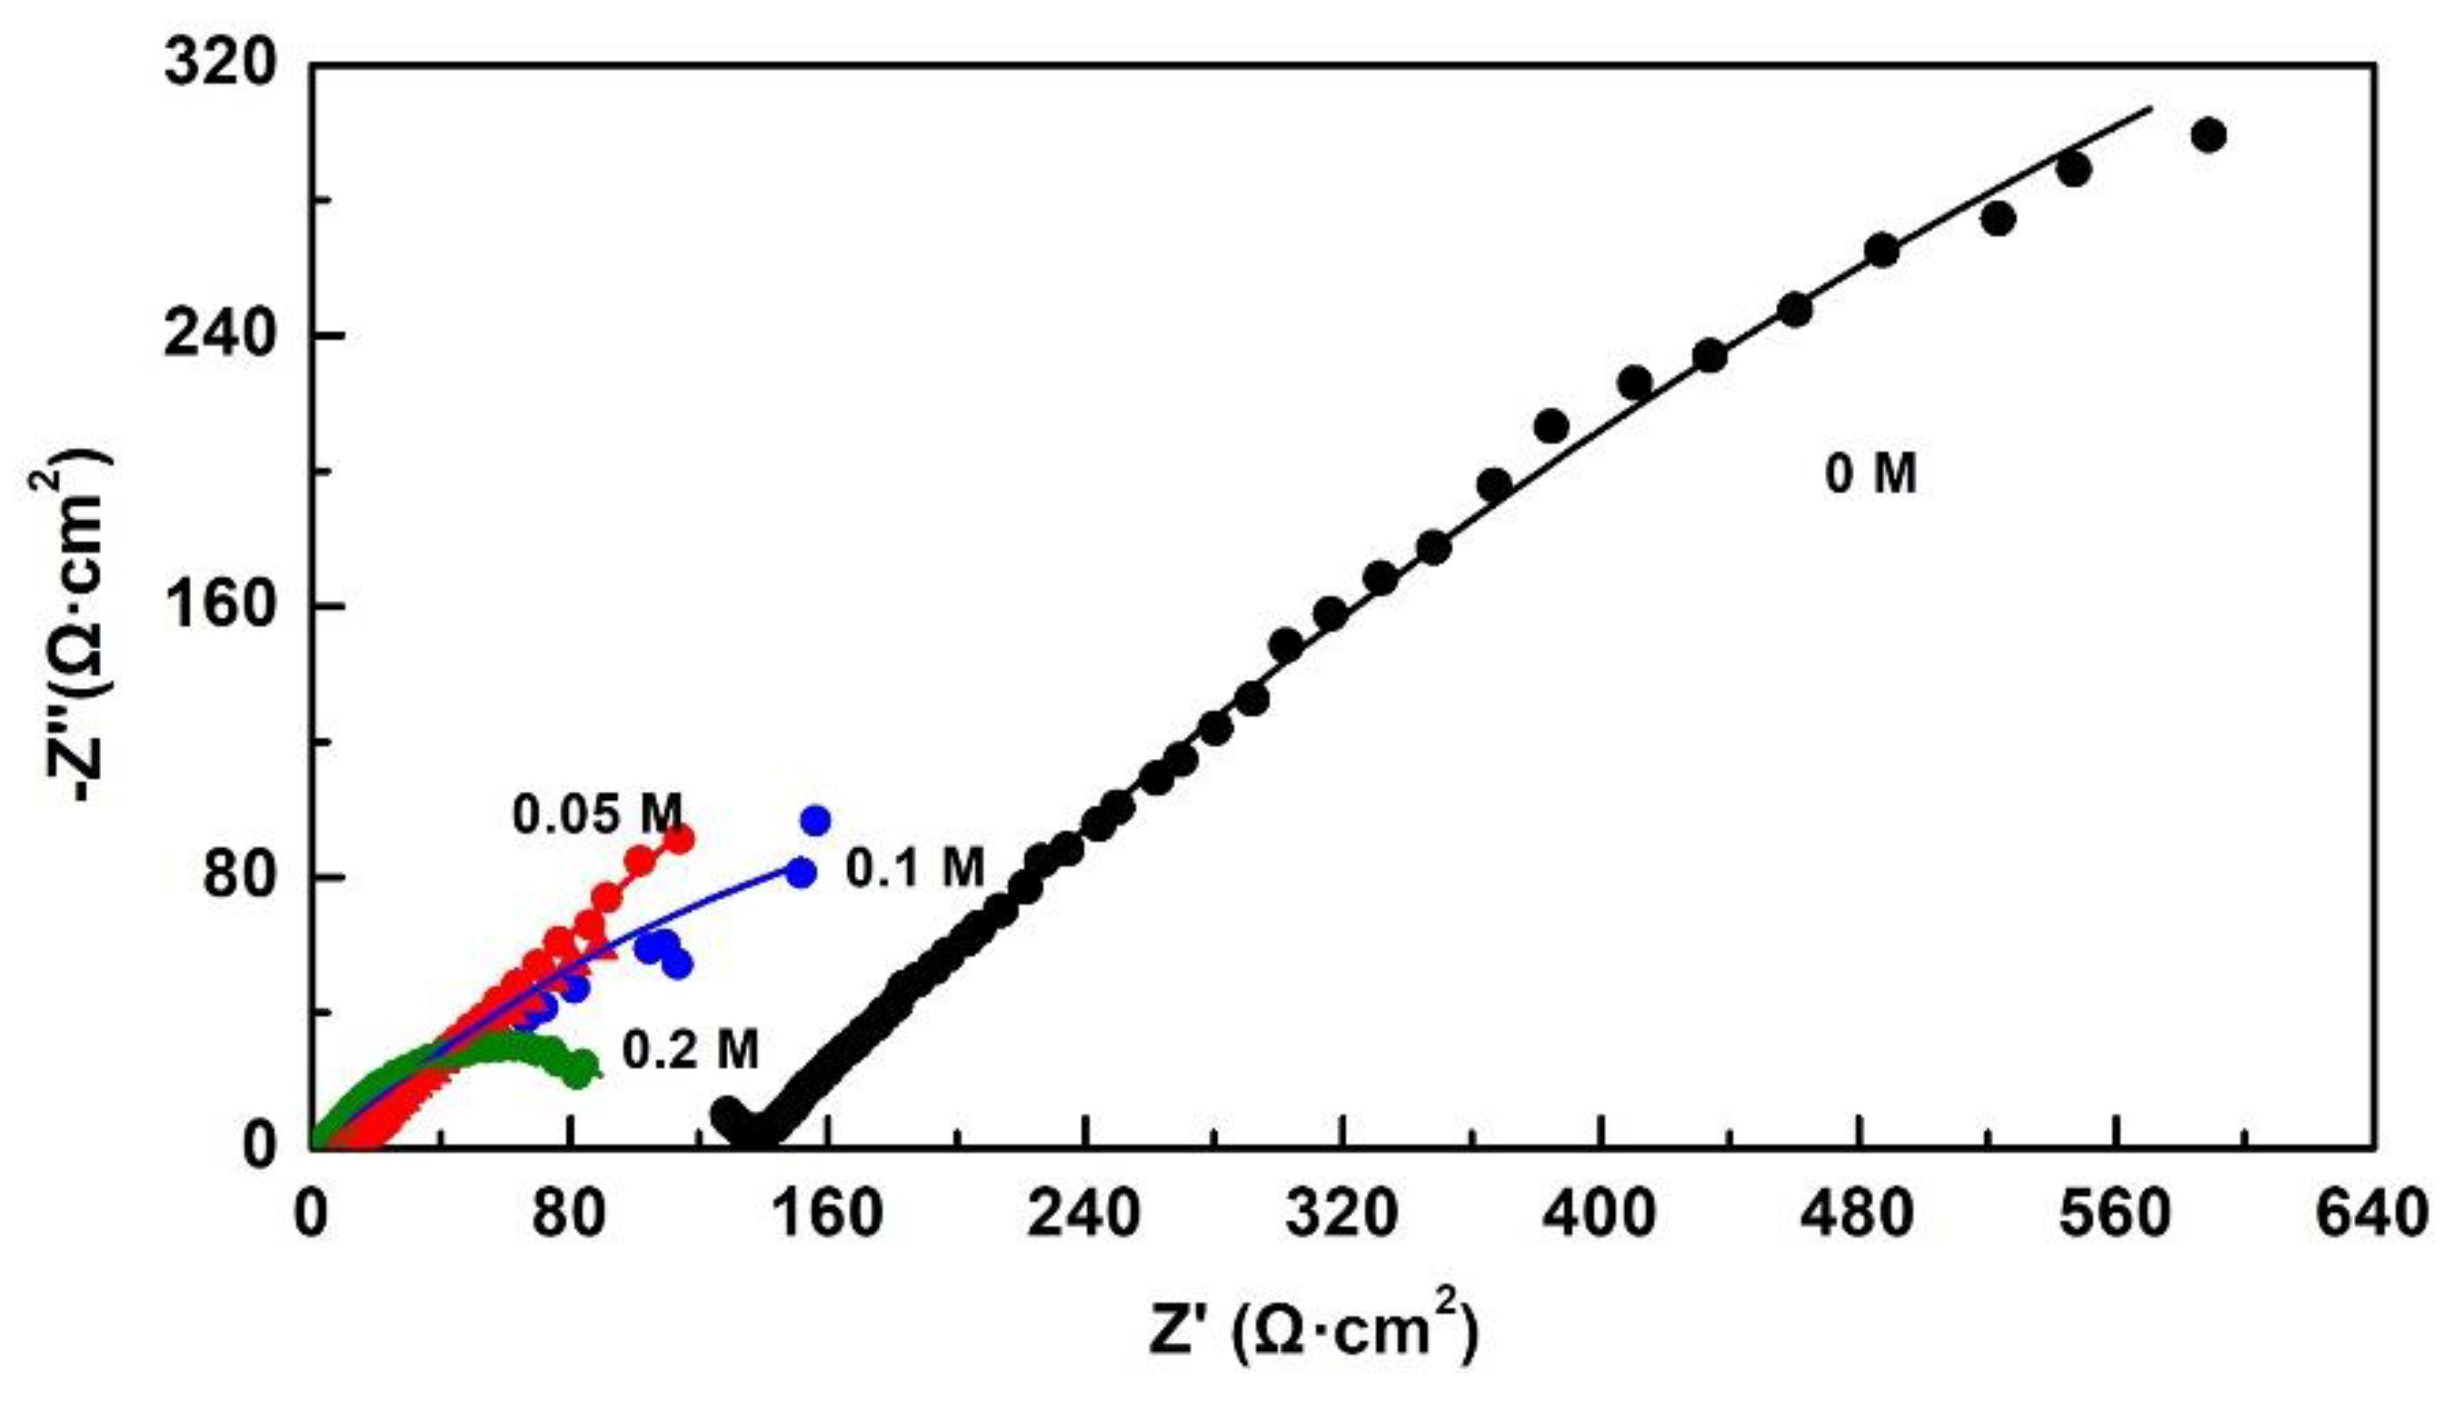
Electrochemical impedance spectroscopy was measured to study the surface structural properties of the chalcopyrite/solution interface in the solutions with different NaCl concentrations at 340 ± 1 °C and 21 ± 1.5 MPa. The recorded EIS spectra and corresponding fitted curves are plotted in the form of Nyquist diagrams in Figure 3. All spectra were composed of two depressed capacitive loops. The first capacitive loop at high frequencies was related to the protective properties of the surface layer. The second capacitive loop at low frequencies was attributed to the charge transfer resistance at the interface between chalcopyrite and solution [16,17]. In accordance with the equivalent circuit model shown in Figure 4, the obtained impedance parameters are presented in Table 2, where Rs is the electrolyte and other ohmic resistance, Rp is the surface layer resistance, Qp represents the corresponding capacitive behavior of surface layer, and Rt and Qdl are the charge transfer resistance and the corresponding capacitance, respectively.
As reported by Chirita and Schlegel [20] the rate of overall reaction progress (inversely proportional to Rr) is controlled by the rate of charge transfer (surface reactions) if Rp < Rt, or by the thickness of surface layer (ion diffusion across the surface layer) if Rp > Rt, or both if Rp = Rt. While the Rt value was much higher than the Rp value at the same NaCl concentration, chemical reaction is the main factor in limiting the leaching process of chalcopyrite.
With increasing NaCl concentration, a lower Rp indicated that the oxide layer became less protective, such that more ions could diffuse across the layer. Values of Rp were just 5.00 Ω·cm2, while the concentration of NaCl solution was 0.2 mol/L, showing the rapid depletion of surface barrier for further ion diffusion. A lower Rt indicated that chloride ions could stimulate the chemical reaction on the chalcopyrite surface. Therefore, charges are more easily transferred through the interface between chalcopyrite and NaCl solution. Attributed to more rapid ionic diffusion and further chemical reaction, an increase in NaCl concentration led to an improvement in the chalcopyrite dissolution rate. As the Rt value dropped more than the Rp value with increasing NaCl concentration, further chemical reaction was dominant in promoting chalcopyrite leaching.
3.3. SEM and EDS
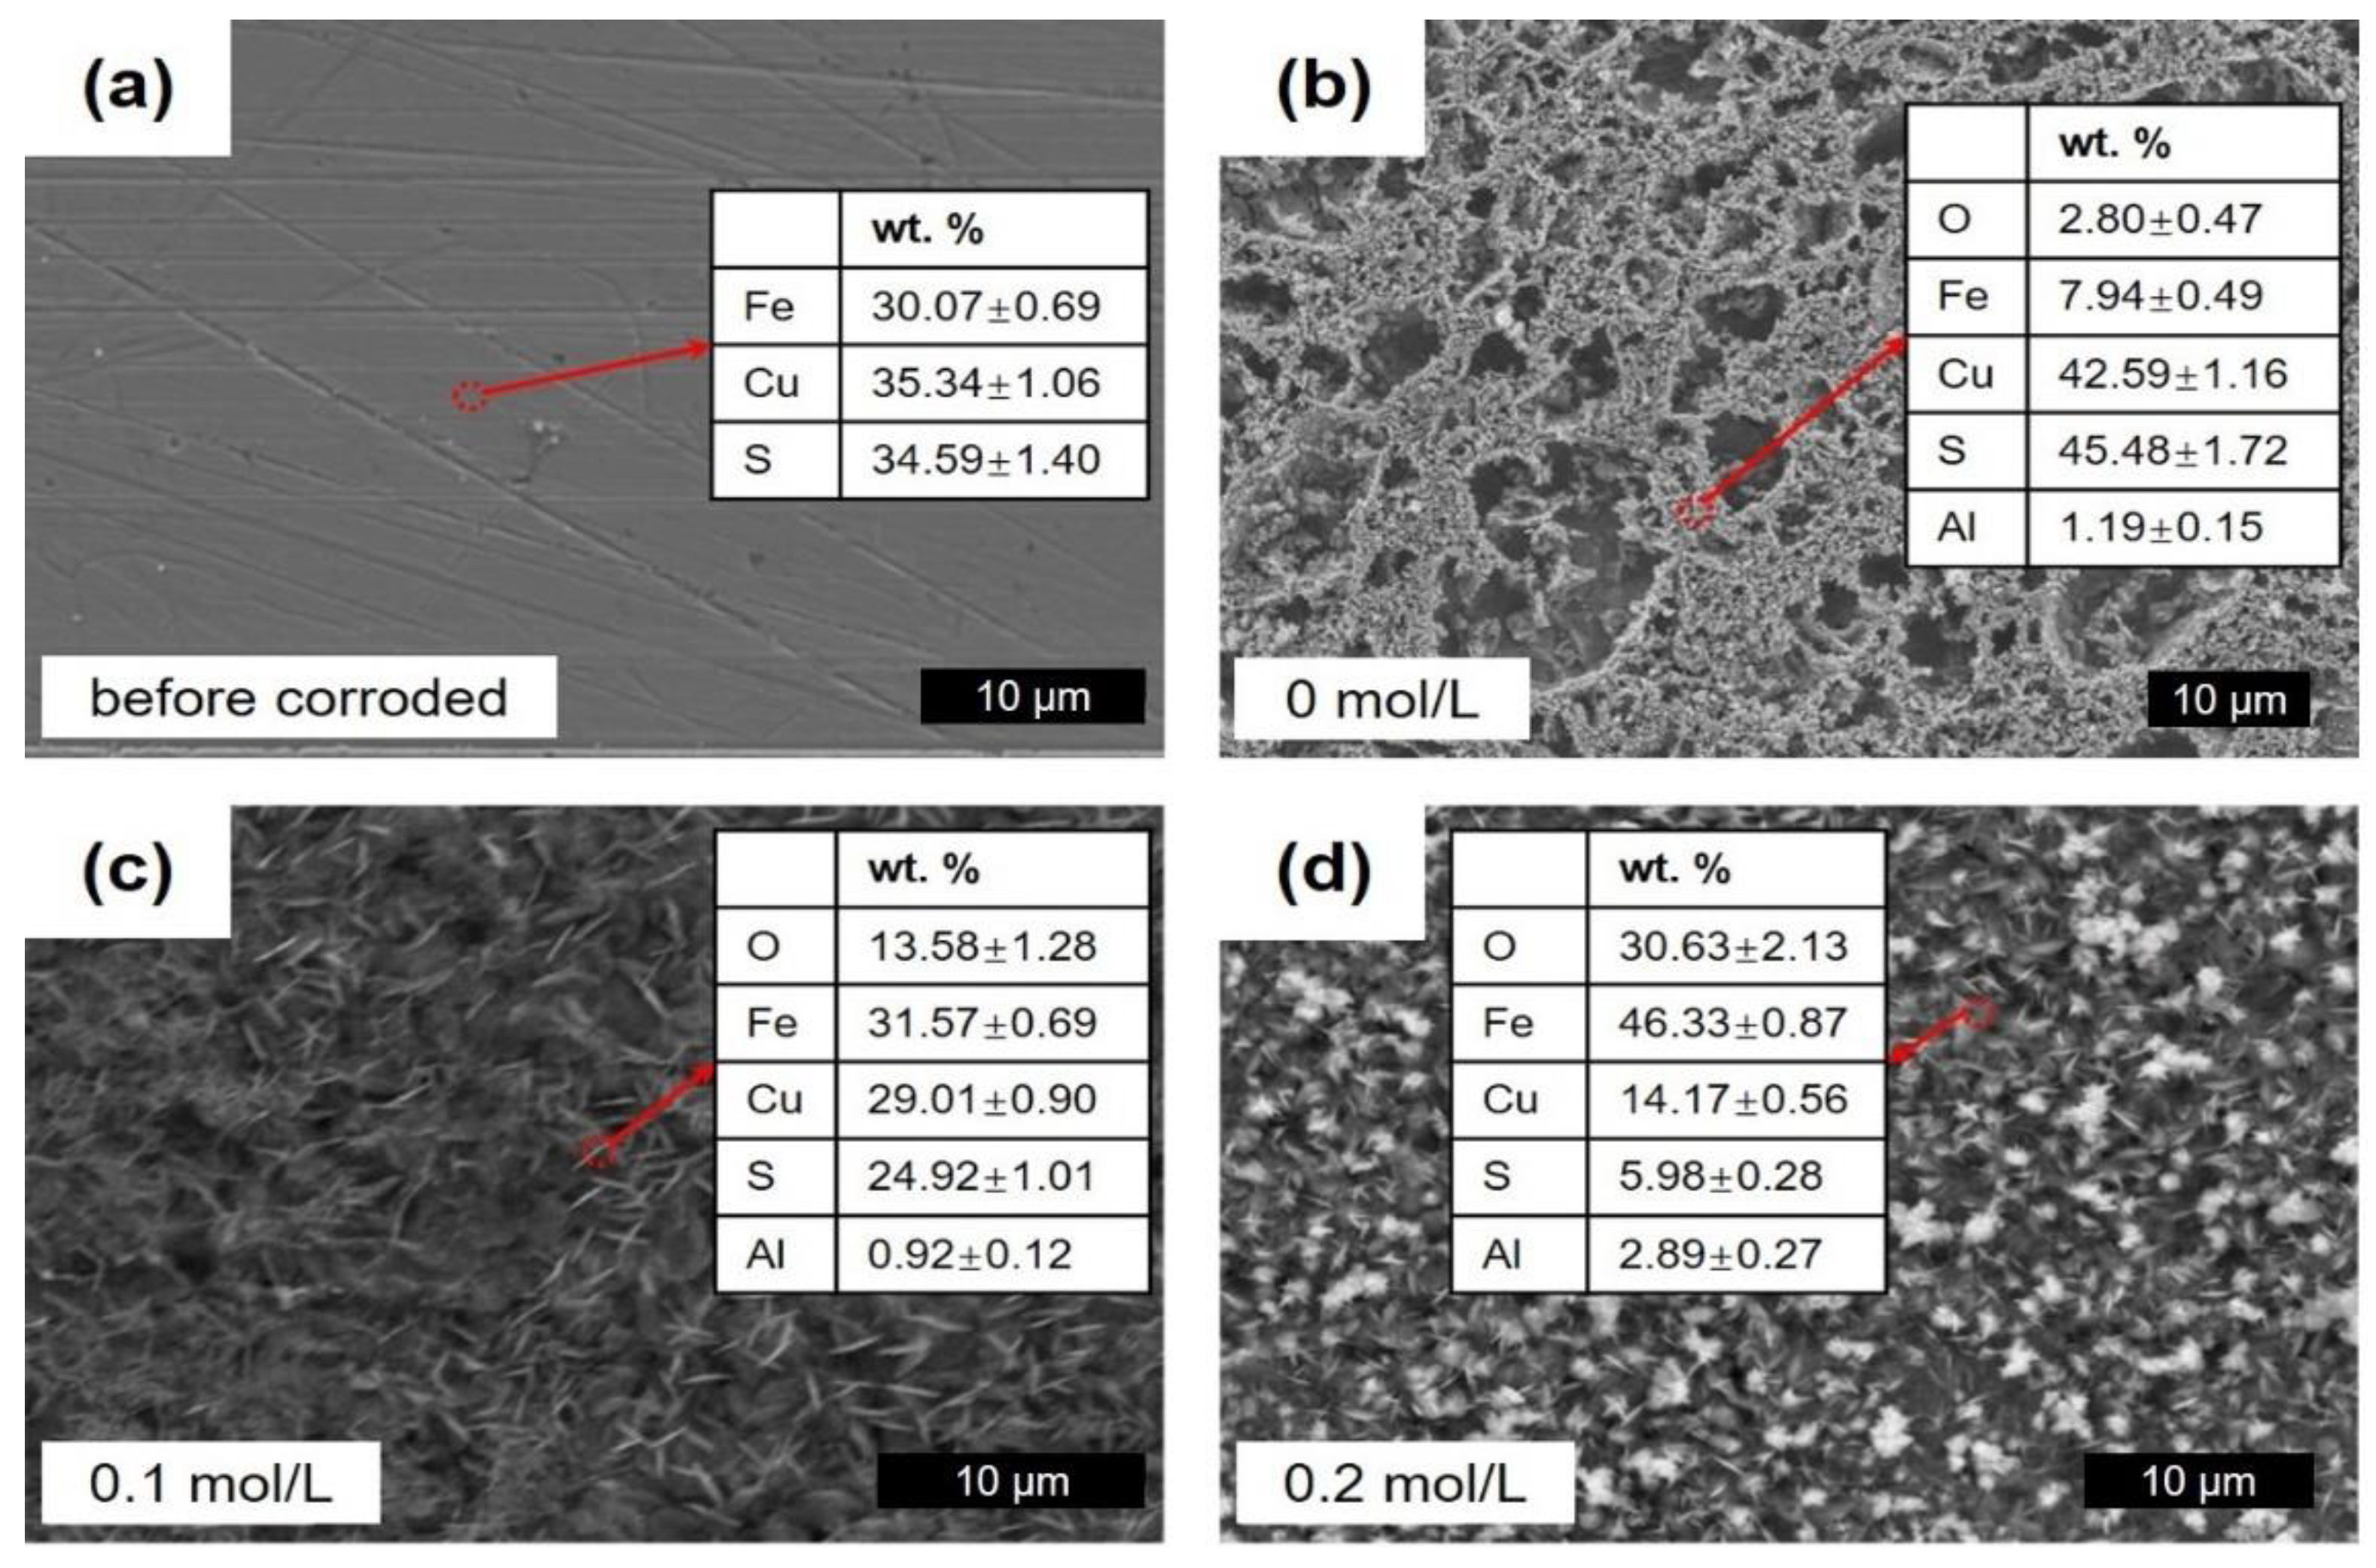
After the chalcopyrite blocks were exposed into the solution with various NaCl concentrations (0, 0.1, and 0.2 mol/L) at 340 ± 1 °C and 21 ± 1.5 MPa, their surface microstructures were examined by SEM. Results and the corresponding positions of EDS element analysis spots are presented in Figure 5. While the chalcopyrite samples were abraded and cleaned, their surfaces were smooth and clear (Figure 5a). However, after the chalcopyrite block was immersed in 0 mol/L NaCl solution for 4 h, the surface layer changed to a honeycomb structure with several secondary particles (Figure 5b). Cu and S are dominant components of the Cu-rich layer as confirmed by EDS. In the 0.1 mol/L NaCl solution, abundant sliced precipitates covered the chalcopyrite surface (Figure 5c). Increased Fe and O were detected, associated with decreased Cu and S. When NaCl concentrations reached 0.2 mol/L, the surface layer of chalcopyrite was composed of bigger particles (Figure 5d). Uniform growth of an oxide layer was due to initial oxide nucleation on selected sites followed by uniform growth of oxide particles [21]. Fe and O were the majority components of the leach residue.
3.4. Raman Spectroscopy
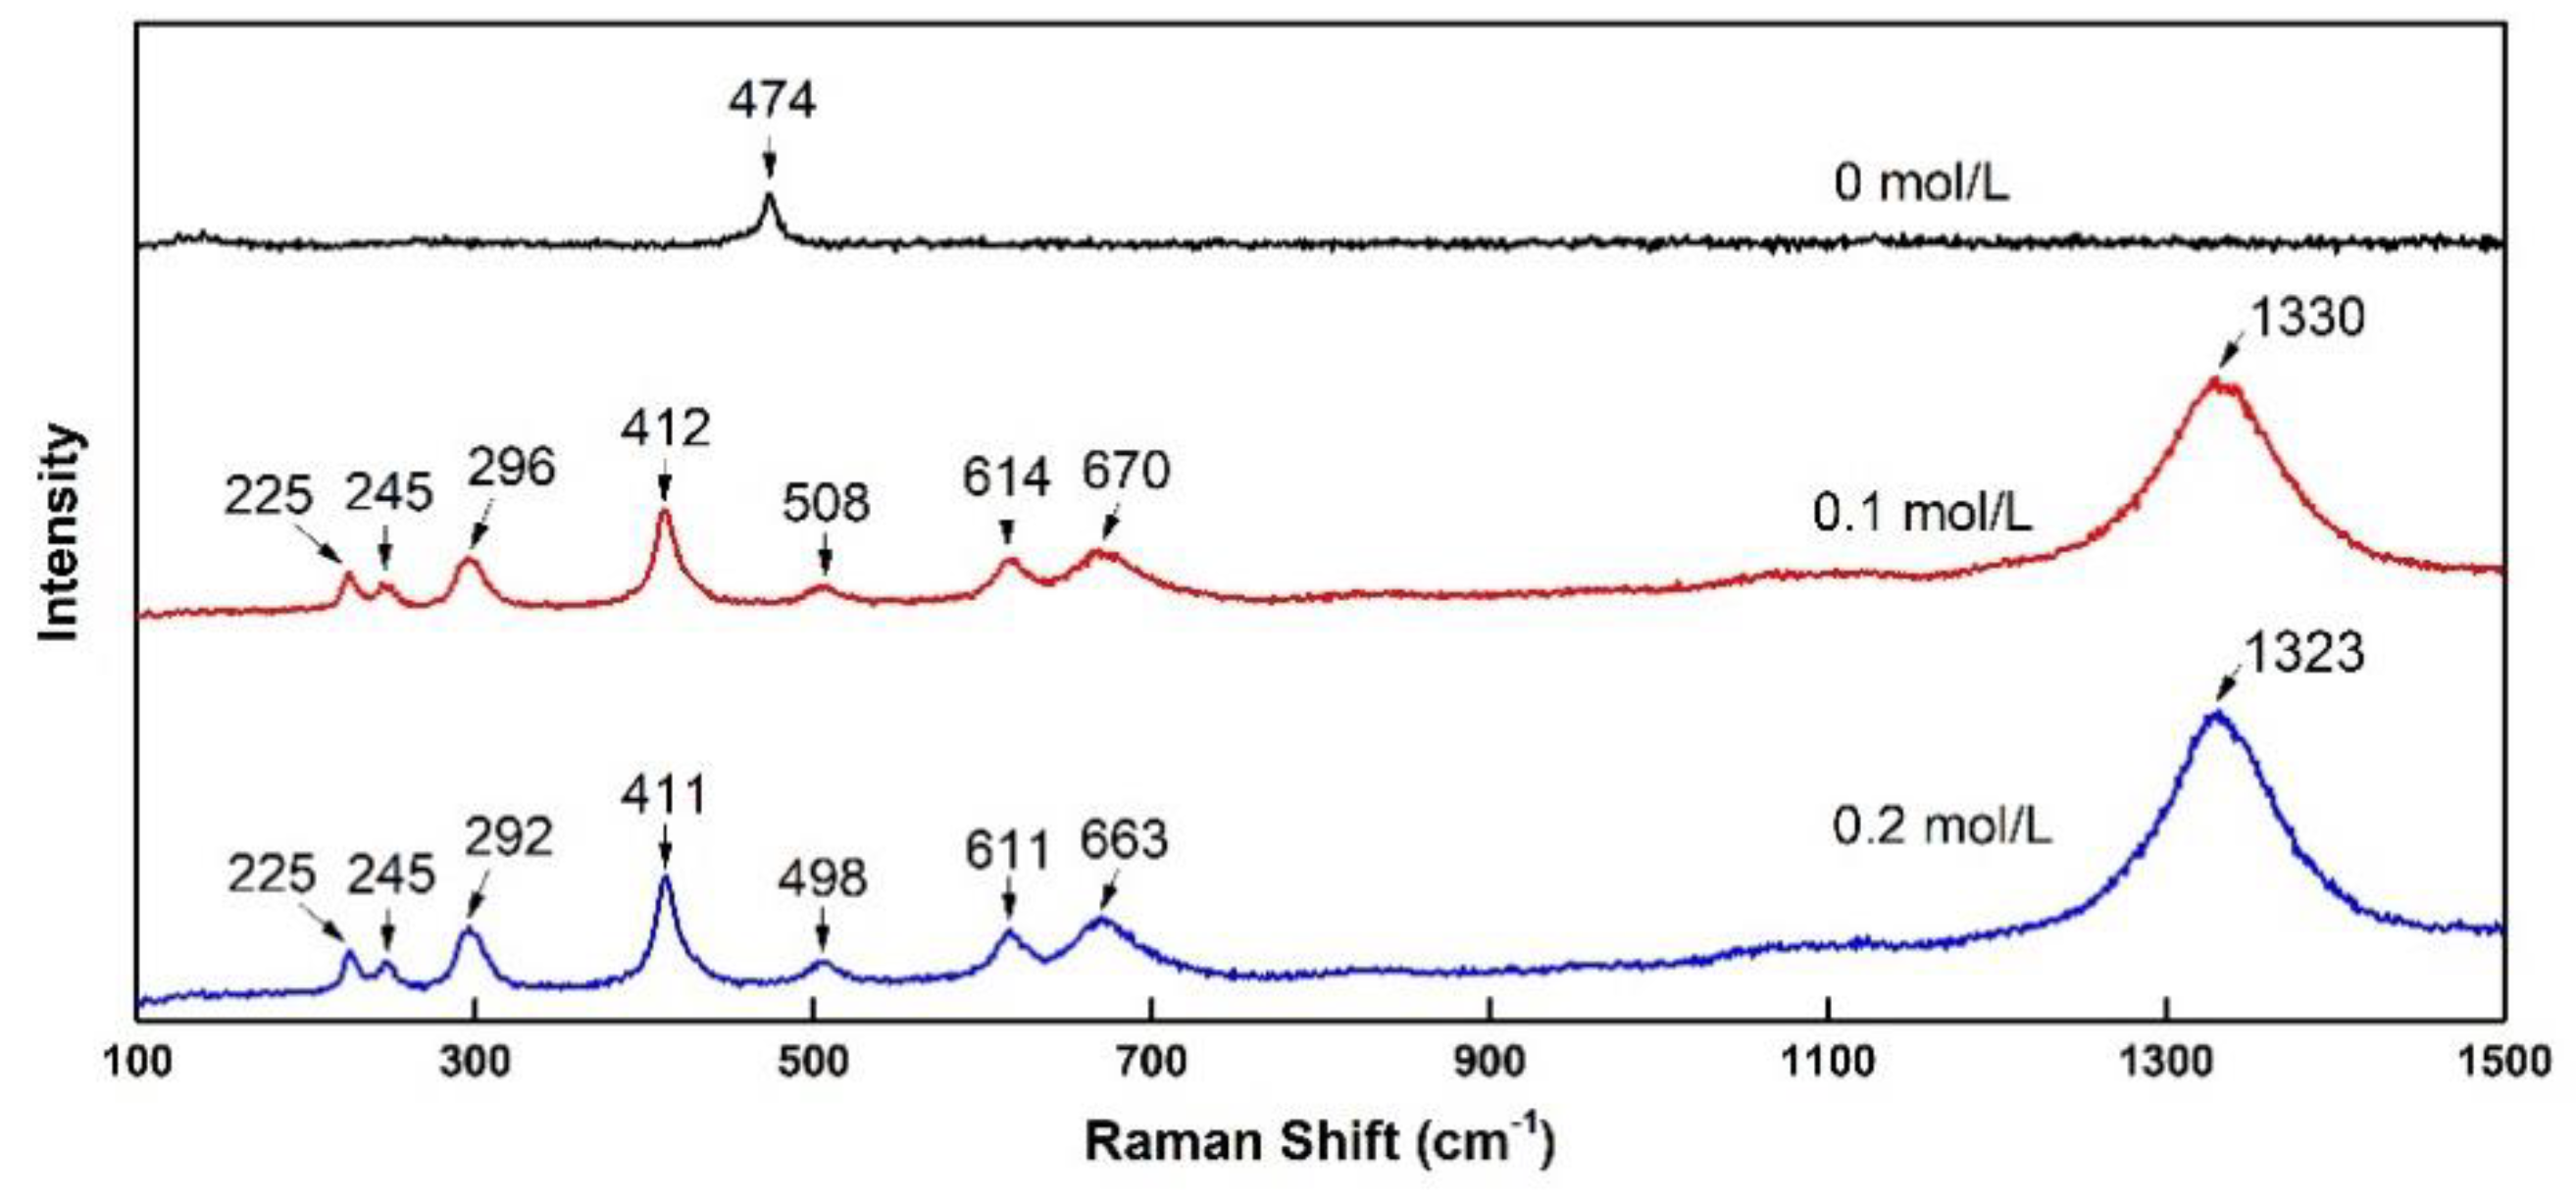
To verify the secondary minerals precipitated on the chalcopyrite surface during the oxidization process, the leach residues were further analyzed by Raman spectroscopy. The obtained spectra are shown in Figure 6. Its Raman frequencies were checked using chalcopyrite, covellite, and hematite reference materials. As Munce et al. [22] reported, the strong intensity of the main band at 474 cm−1 with weak intensities of bands between 100 and 300 cm−1 is suggestive of covellite and/or cupric polysulfide (CuSn, n ≥ 1) [23,24,25]. Therefore, these features indicate that CuSn (n ≥ 1) was formed during the oxidation of chalcopyrite in 0 mol/L NaCl solution. The bands at ~225, ~245, ~296, ~412, ~508, ~614, ~670, and ~1330 cm−1 could be assigned to hematite (Fe2O3) [26], which was the leach product of chalcopyrite in the solution with 0.1 mol/L NaCl concentration. When more Cl− was added into the fluid, the same positions of stronger bands were detected, showing deposition of more Fe2O3 particles onto the chalcopyrite surface.
3.5. Effect of Chloride Ions on the Mechanism Model of Chalcopyrite Oxidation
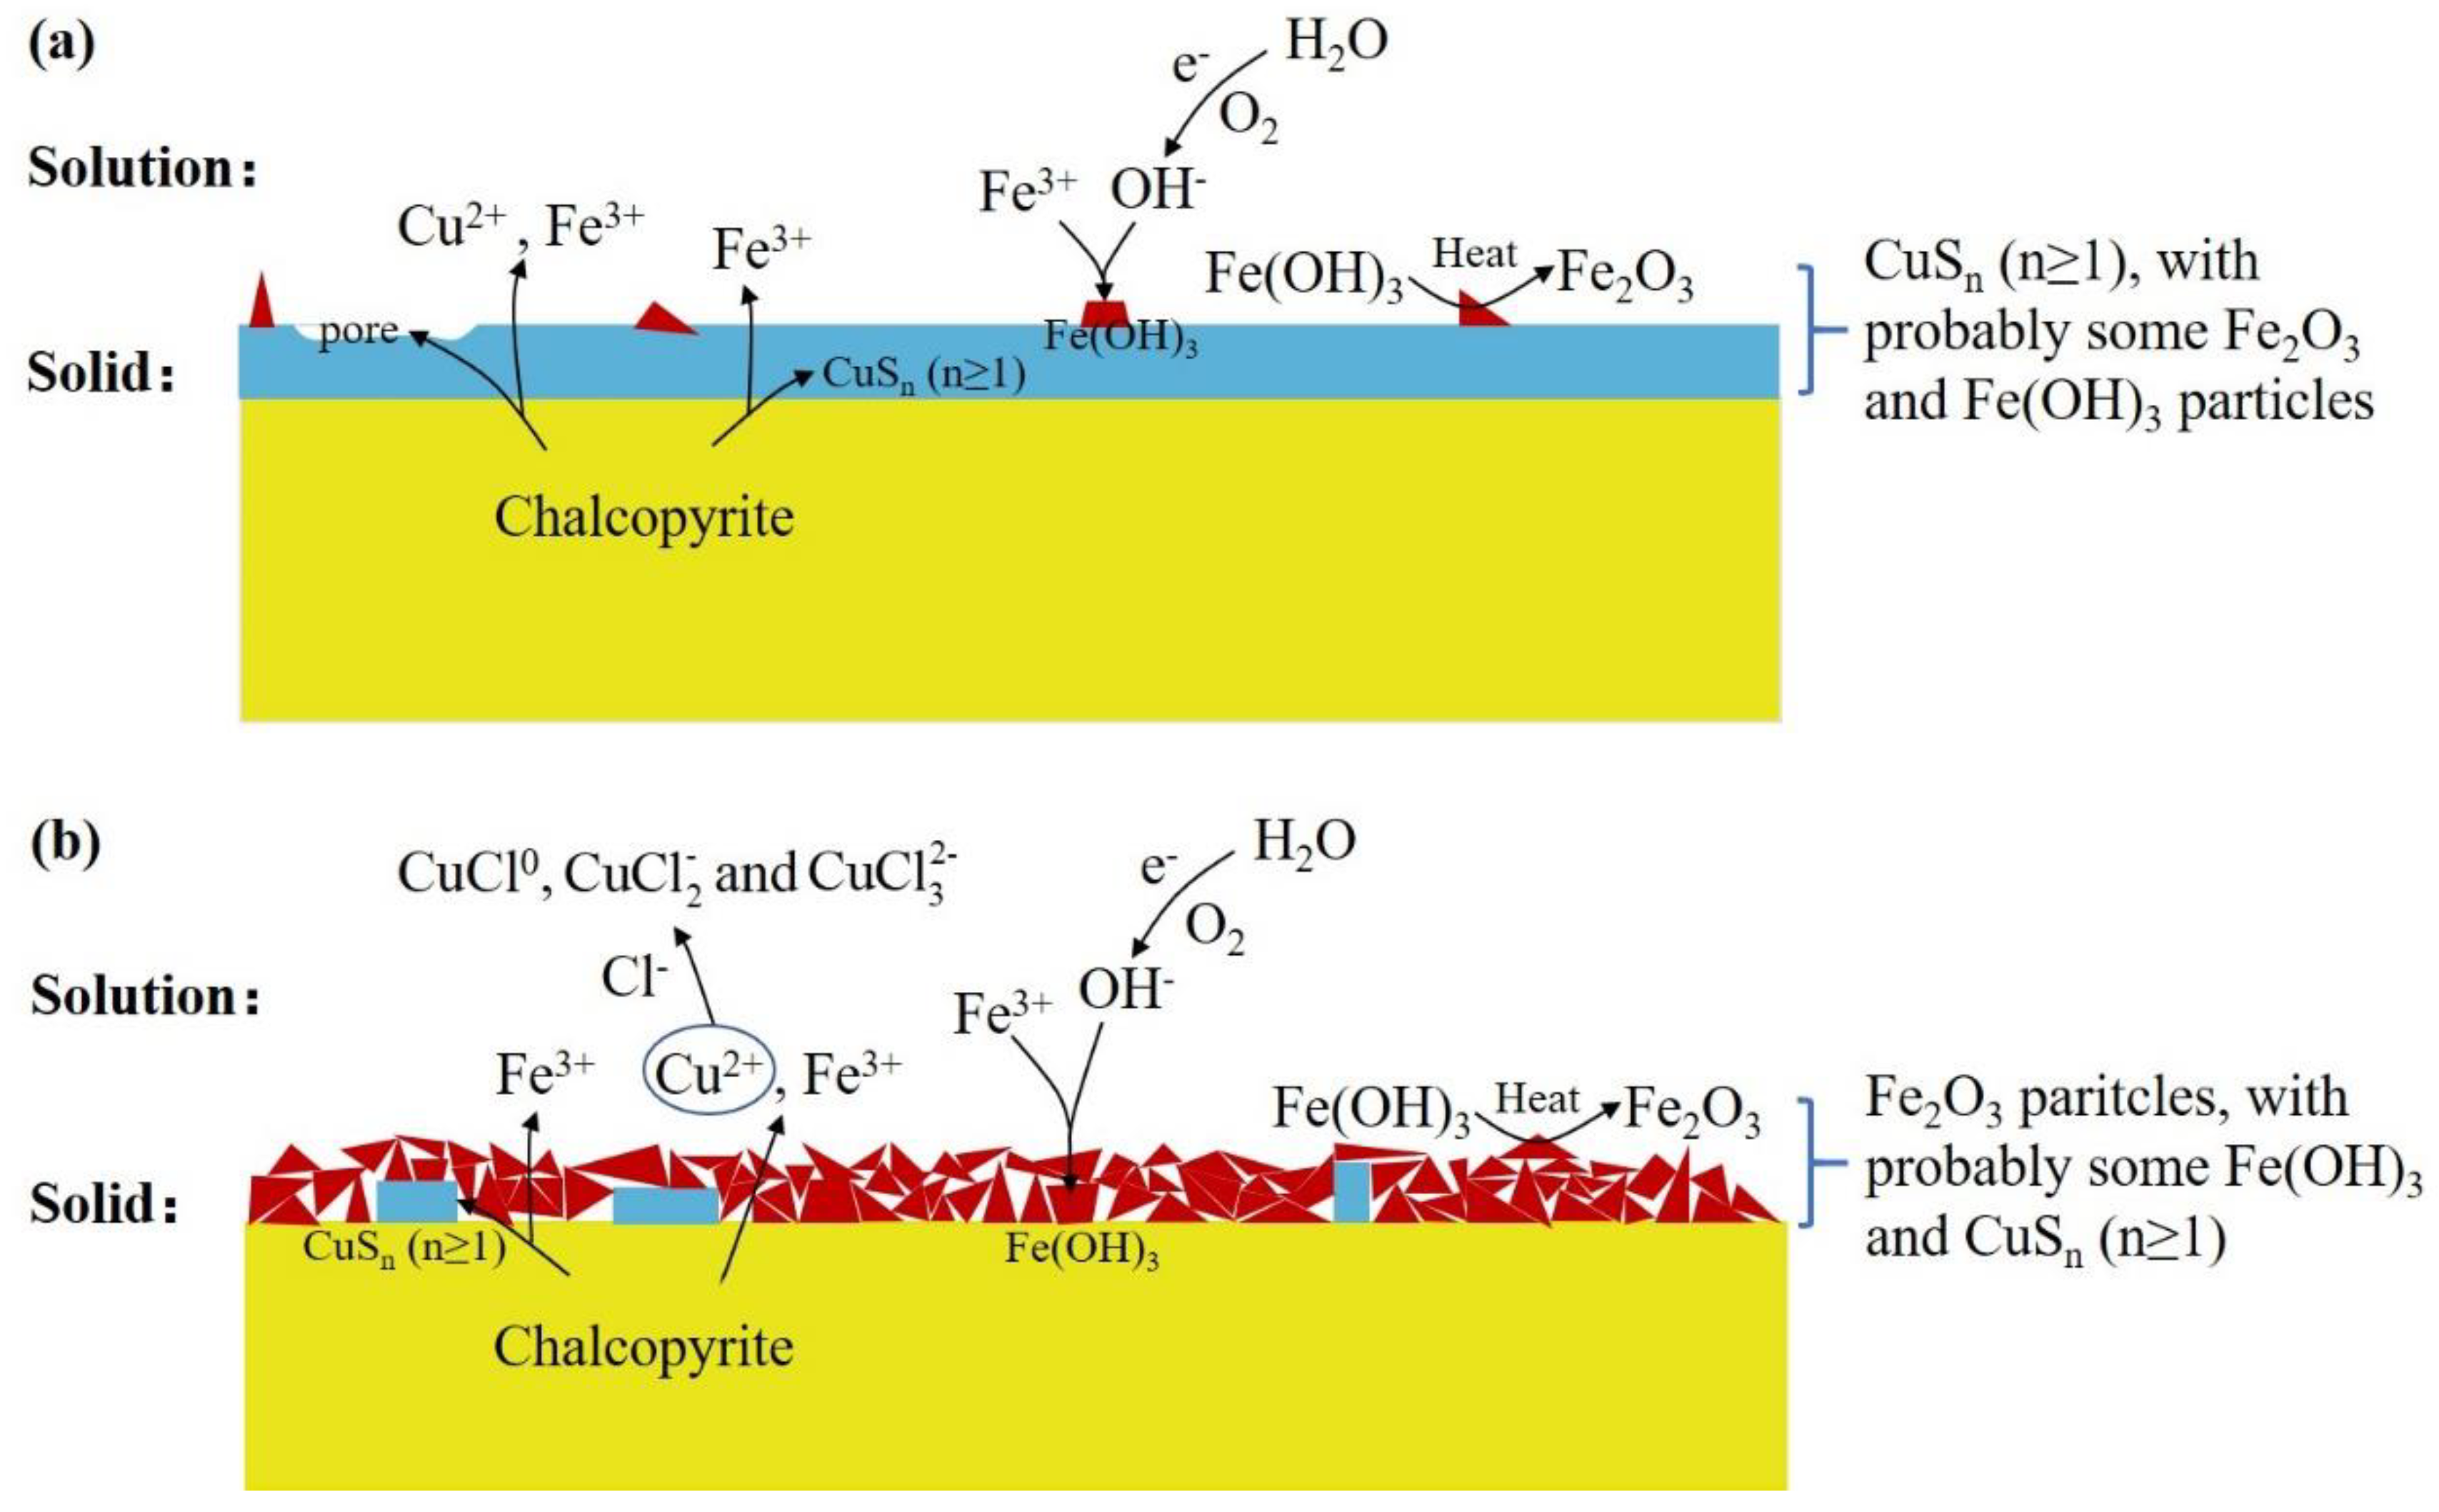
The added Cl− is of great significance to the chemical leaching of chalcopyrite. It could effectively promote chalcopyrite dissolution and change the precipitated particles on the chalcopyrite surface. A mechanism model of the chalcopyrite oxidation was proposed from the results of kinetic and surface science studies (Figure 7). In the solution without NaCl, iron leached preferentially to copper to form a barrier-like Cu-rich layer on the chalcopyrite surface. The oxidative leaching of chalcopyrite took place through Equations (3) and (4) [27,28,29].
The dissolved Fe was precipitated as Fe(OH)3 (Equation (5)) [28,30]. Then, Fe(OH)3 became thermodynamically unstable with respect to Fe2O3 (Equation (6)) [31]. Thus, the observed surface layer in the solution without NaCl was a Cu-rich layer, consisting of CuSn (n ≥ 1), probably with some Fe2O3 and Fe(OH)3 particles.
While the solution contains NaCl, dissolved Cu was consumed by reacting with Cl− to produce chloro-complexes CuCl0 (Equation (7)), (Equation (8)) and (Equation (9)), as reported by Lin et al. [32] and Lundstrom et al. [33]. This could stimulate the dissolution of Cu from chalcopyrite and inhibit the formation of barrier-like CuSn (n ≥ 1). Thus, compared to more rapid ionic diffusion, further chemical reaction is the main cause for improving chalcopyrite dissolution with increasing NaCl concentration.
More ferric ions diffused outward to the chalcopyrite/solution interface and combine with OH− to generate Fe(OH)3, promoting the precipitation of thermodynamically stable oxide (Fe2O3. Fe2O3) particles that gradually replace CuSn (n ≥ 1) and eventually become the dominant oxide products. Therefore, in the solution with increasing NaCl concentration, the surface coating became an Fe-rich oxide layer composed of Fe2O3 particles, probably with some Fe(OH)3 and CuSn (n ≥ 1) particles. With gaps among the Fe2O3 particles, ions and electrons could effectively pass across the chalcopyrite/solution interface. The EIS results show that the values of Rp was just 5.00 Ω·cm2, while the Cl− concentration reached 0.2 mol/L, which means the precipitation of Fe2O3 particles made no contribution to limiting chalcopyrite oxidation.
4. Conclusions
The experimental results showed that added chloride ions in aqueous solution at 340 °C and 21 MPa could substantially promote the leaching of chalcopyrite. In the 0 mol/L NaCl solution, iron leached preferentially to copper, leading to the formation of a Cu-rich layer on the chalcopyrite surface. It consisted of CuSn (n ≥ 1), probably with some Fe2O3 and Fe(OH)3 particles.
The added Cl− could react with Cu2+ to form chloro-complexes CuCl0, , and , which inhibited the formation of barrier-like CuSn (n ≥ 1). As the results of EIS reported, more rapid ion diffusion contributed to promoting chalcopyrite oxidation with increasing NaCl concentration, but further chemical reaction caused by NaCl addition is dominant.
As more dissolved Fe was precipitated as Fe(OH)3, and as Fe(OH)3 was thermodynamically unstable with respect to Fe2O3, the surface layer was a Fe-rich layer, formed of Fe2O3, probably with some CuSn (n ≥ 1) and Fe(OH)3 particles. With gaps among the Fe2O3 particles, ions and electrons could easily diffuse through the chalcopyrite/solution interface. In the 0.2 mol/L NaCl solution, the oxide layer had no effects on inhibiting chalcopyrite leaching.
Author Contributions
Conceptualization and methodology, H.L.; investigation, L.W.; preparation of experimental materials, L.W., L.X. and L.Z.; experimental analysis, H.L., L.W. and Q.L.; writing—original draft preparation, L.W.; writing—review and editing, H.L., L.W., Q.L., L.X., L.Z. and S.L.; plotting, L.W. All authors have read and agreed to the published version of the manuscript.
Funding
This work was financially supported by project of National Natural Science Foundation of China (U1812402), the National Natural Science Foundation of China (Grant No. 41903054), the National Key R&D Program of China (Grant No. 2016YFC0600104), Large-Scale Scientific Apparatus Development Program (Grant No. YZ200720), CAS, and 135 Program of the Institute of Geochemistry, CAS.
Acknowledgments
The authors in this work thank Zengsheng Li, Wei Zhang, and Lin Chen for the experimental assistance. The authors thank the two anonymous reviewers and the associated editor for their helpful comments and suggestions.
Conflicts of Interest
The authors declare no conflict of interest.
References
- Hutchinson, R. Volcanogenic sulfide deposits and their metallogenic significance. Econ. Geol. 1973, 68, 1223–1246. [Google Scholar] [CrossRef]
- Farquhar, M.L.; Wincott, P.L.; Wogelius, R.A.; Vaughan, D.J. Electrochemical oxidation of the chalcopyrite surface: An XPS and AFM study in solution at pH 4. Appl. Surf. Sci. 2003, 218, 34–43. [Google Scholar] [CrossRef]
- Canet, C.; Alfonso, P.; Melgarejo, J.C.; Belyatsky, B.V. Geochemical evidences of sedimentary-exhalative origin of the shale-hosted PGE–Ag–Au–Zn–Cu occurrences of the Prades Mountains (Catalonia, Spain): Trace-element abundances and Sm–Nd isotopes. J. Geochem. Explor. 2004, 82, 17–33. [Google Scholar] [CrossRef]
- O’Connor, G.M.; Eksteen, J.J. A critical review of the passivation and semiconductor mechanisms of chalcopyrite leaching. Miner. Eng. 2020, 154, 106401. [Google Scholar] [CrossRef]
- Zhong, S.; Li, Y. An improved understanding of chalcopyrite leaching kinetics and mechanisms in the presence of NaCl. J. Mater. Sci. Technol. 2019, 8, 3487–3494. [Google Scholar] [CrossRef]
- Zhao, H.; Wang, J.; Qin, W.; Hu, M.; Zhu, S.; Qiu, G. Electrochemical dissolution process of chalcopyrite in the presence of mesophilic microorganisms. Miner. Eng. 2015, 71, 159–169. [Google Scholar] [CrossRef]
- Hernández, P.; Taboada, M.; Herreros, O.; Torres, C.; Ghorbani, Y. Chalcopyrite dissolution using seawater-based acidic media in the presence of oxidants. Hydrometallurgy 2015, 157, 325–332. [Google Scholar] [CrossRef]
- Liu, Q.; Chen, M.; Yang, Y. The effect of chloride ions on the electrochemical dissolution of chalcopyrite in sulfuric acid solutions. Electrochim. Acta 2017, 253, 257–267. [Google Scholar] [CrossRef]
- Ruiz, M.C.; Montes, K.S.; Padilla, R. Chalcopyrite leaching in sulfate–chloride media at ambient pressure. Hydrometallurgy 2011, 109, 37–42. [Google Scholar] [CrossRef]
- Sun, H.; Wu, X.; Han, E.H. Effects of temperature on the protective property, structure and composition of the oxide film on Alloy 625. Corros. Sci. 2009, 51, 2565–2572. [Google Scholar] [CrossRef]
- Knight, R.D.; Roberts, S.; Cooper, M.J. Investigating monomineralic and polymineralic reactions during the oxidation of sulphide minerals in seawater: Implications for mining seafloor massive sulphide deposits. Appl. Geochem. 2018, 90, 63–74. [Google Scholar] [CrossRef]
- Wang, L.; Li, H.; Liang, W.; Yin, Y.; Liu, Q. High pressure sintering of a pure, compact and malleable chalcopyrite block. Mater. Lett. 2017, 199, 61–64. [Google Scholar] [CrossRef]
- Macdonald, D.D.; Scott, A.C.; Wentrcek, P. External reference electrodes for use in high temperature aqueous systems. J. Electrochem. Soc. 1979, 126, 908–911. [Google Scholar] [CrossRef]
- Lin, S.; Li, H.; Xu, L.; Zhang, Y.; Cui, C. A novel experimental device for electrochemical measurements in supercritical fluids up to 700 °C/1000 bar and its application in the corrosion study of superalloy Inconel 740H. RSC Adv. 2017, 7, 33914–33920. [Google Scholar] [CrossRef] [Green Version]
- Azizi, A.; Shafaei, S.Z.; Noaparast, M.; Karamoozian, M. Galvanic interaction between chalcopyrite and pyrite with low alloy and high carbon chromium steel ball. J. Chem. 2013, 2013, 1–9. [Google Scholar] [CrossRef]
- Almeida, T.d.C.; Garcia, E.M.; da Silva, H.W.A.; Matencio, T.; de Freitas Cunha Lins, V. Electrochemical study of chalcopyrite dissolution in sulfuric, nitric and hydrochloric acid solutions. Int. J. Miner. Process. 2016, 149, 25–33. [Google Scholar] [CrossRef]
- Juan, Y.; Yang, H.Y.; Fan, Y.J. Effect of potential on characteristics of surface film on natural chalcopyrite. T. Nonferr. Metal. Soc. 2011, 21, 1880–1886. [Google Scholar]
- Chiriţă, P.; Schlegel, M.L. Oxidative dissolution of iron monosulfide (FeS) in acidic conditions: The effect of solid pretreatment. Int. J. Miner. Process. 2015, 135, 57–64. [Google Scholar] [CrossRef]
- Tüken, T.; Erbil, M. The corrosion behaviour of polypyrrole coating synthesized in phenylphosphonic acid solution. Appl. Surf. Sci. 2006, 252, 2311–2318. [Google Scholar] [CrossRef]
- Chiriță, P.; Schlegel, M.L. Pyrite oxidation in air-equilibrated solutions: An electrochemical study. Chem. Geol. 2017, 470, 67–74. [Google Scholar] [CrossRef]
- Zhong, X.; Han, E.H.; Wu, X. Corrosion behavior of Alloy 690 in aerated supercritical water. Corros. Sci. 2013, 66, 369–379. [Google Scholar] [CrossRef]
- Munce, C.G.; Parker, G.K.; Holt, S.A.; Hope, G.A. A Raman spectroelectrochemical investigation of chemical bath deposited CuxS thin films and their modification. Colloids Surf. A 2007, 295, 152–158. [Google Scholar] [CrossRef]
- Khan, S.A.; Hughes, R.W.; Reynolds, P.A. Raman spectroscopic determination of oxoanions in aqueous polysulfide electrolyte solutions. Vib. Spectrosc. 2011, 56, 241–244. [Google Scholar] [CrossRef]
- Liu, H.; Lu, X.; Zhang, L.; Xiang, W.; Zhu, X.; Li, J.; Wang, X.; Lu, J.; Wang, R. Collaborative effects of Acidithiobacillus ferrooxidans and ferrous ions on the oxidation of chalcopyrite. Chem. Geol. 2018, 493, 109–120. [Google Scholar] [CrossRef]
- Parker, G.K.; Woods, R.; Hope, G.A. Raman investigation of chalcopyrite oxidation. Colloids Surf. A 2008, 318, 160–168. [Google Scholar] [CrossRef]
- Hanesch, M. Raman spectroscopy of iron oxides and (oxy)hydroxides at low laser power and possible applications in environmental magnetic studies. Geophys. J. Int. 2009, 177, 941–948. [Google Scholar] [CrossRef]
- Ghahremaninezhad, A.; Asselin, E.; Dixon, D. Electrochemical evaluation of the surface of chalcopyrite during dissolution in sulfuric acid solution. Electrochim. Acta 2010, 55, 5041–5056. [Google Scholar] [CrossRef]
- Mikhlin, Y.; Nasluzov, V.; Romanchenko, A.; Tomashevich, Y.; Shor, A.; Félix, R. Layered structure of the near-surface region of oxidized chalcopyrite (CuFeS2): Hard X-ray photoelectron spectroscopy, X-ray absorption spectroscopy and DFT+U studies. Phys. Chem. Chem. Phys. 2017, 19, 2749–2759. [Google Scholar] [CrossRef]
- Nava, D.; González, I. Electrochemical characterization of chemical species formed during the electrochemical treatment of chalcopyrite in sulfuric acid. Electrochim. Acta 2006, 51, 5295–5303. [Google Scholar] [CrossRef]
- Mu, Y.; Peng, Y.; Lauten, R.A. The galvanic interaction between chalcopyrite and pyrite in the presence of lignosulfonate-based biopolymers and its effects on flotation performance. Miner. Eng. 2018, 122, 91–98. [Google Scholar] [CrossRef]
- Majzlan, J.; Navrotsky, A.; Schwertmann, U. Thermodynamics of iron oxides: Part III. Enthalpies of formation and stability of ferrihydrite (~Fe(OH)3), schwertmannite (~FeO(OH)3/4(SO4)1/8), and ε-Fe2O3. Geochim. Cosmochim. Acta 2004, 68, 1049–1059. [Google Scholar] [CrossRef]
- Lin, H.; Wu, X.; Rao, P. The electrowinning of copper from a cupric chloride solution. JOM 1991, 43, 60–65. [Google Scholar] [CrossRef]
- Lundström, M. Chalcopyrite Dissolution in Cupric Chloride Solutions; Helsinki University of Technology: Helsinki, Finland, 2009. [Google Scholar]
Figure 1.
Heating process of the autoclave.

Figure 2.
The polarization of curves of chalcopyrite in the solutions with various NaCl concentrations at a scan rate of 2 mV·s−1.
Figure 2.
The polarization of curves of chalcopyrite in the solutions with various NaCl concentrations at a scan rate of 2 mV·s−1.

Figure 3.
Nyquist plots of chalcopyrite at open circuit potentials (OCP) in the solutions with various NaCl concentrations.
Figure 3.
Nyquist plots of chalcopyrite at open circuit potentials (OCP) in the solutions with various NaCl concentrations.

Figure 4.
Equivalent circuit of chalcopyrite in the solutions with various NaCl concentrations.

Figure 5.
SEM images of chalcopyrite before exposure (a) and after 4 h exposure to the solutions with various NaCl concentrations (b–d).
Figure 5.
SEM images of chalcopyrite before exposure (a) and after 4 h exposure to the solutions with various NaCl concentrations (b–d).

Figure 6.
Raman spectra of the chalcopyrite after 4 h exposure to the solutions with various NaCl concentrations.
Figure 6.
Raman spectra of the chalcopyrite after 4 h exposure to the solutions with various NaCl concentrations.

Figure 7.
A mechanism model of the chalcopyrite oxidation in the solution without NaCl (a) and with NaCl (b).
Figure 7.
A mechanism model of the chalcopyrite oxidation in the solution without NaCl (a) and with NaCl (b).


Table 1.
Chemical composition (wt.%) of chalcopyrite.
| Sample | Cu | Fe | S |
|---|---|---|---|
| Chalcopyrite | 35.34 | 30.07 | 34.59 |
Table 2.
Model parameters for equivalent circuit of Figure 3.
Table 2.
Model parameters for equivalent circuit of Figure 3.
| NaCl (mol·L−1) | Rs (Ω·cm2) | CPEp, Y0 (S·cm−2·s−n) | n | Rp (Ω·cm2) | CPEdl, Y0 (S·cm−2·s−n) | n | Rt (Ω·cm2) | χ2 |
|---|---|---|---|---|---|---|---|---|
| 0 | 5.902 | 3.232 × 10⁻⁶ | 0.5061 | 132.1 | 6.175 × 10⁻³ | 0.5025 | 2201.0 | 8.39 × 10⁻⁵ |
| 0.05 | 5.129 | 1.583 × 10⁻² | 0.5170 | 73.8 | 1.673 × 10⁻² | 0.5521 | 1659.0 | 1.77 × 10⁻⁴ |
| 0.1 | 2.819 | 3.345 × 10⁻³ | 0.7517 | 9.4 | 1.740 × 10⁻² | 0.3693 | 641.2 | 6.78 × 10⁻⁴ |
| 0.2 | 2.038 | 5.823 × 10⁻³ | 0.7085 | 5.0 | 1.317 × 10⁻² | 0.5621 | 108.5 | 6.84 × 10⁻⁴ |
Publisher’s Note: MDPI stays neutral with regard to jurisdictional claims in published maps and institutional affiliations. |
© 2020 by the authors. Licensee MDPI, Basel, Switzerland. This article is an open access article distributed under the terms and conditions of the Creative Commons Attribution (CC BY) license (http://creativecommons.org/licenses/by/4.0/).
Share and Cite
MDPI and ACS Style
Wang, L.; Li, H.; Liu, Q.; Xu, L.; Zha, L.; Lin, S. Effect of Chloride Ions on the Electrochemical Oxidation of Chalcopyrite at 340 °C and 21 MPa. Minerals 2020, 10, 1071. https://doi.org/10.3390/min10121071
AMA Style
Wang L, Li H, Liu Q, Xu L, Zha L, Lin S. Effect of Chloride Ions on the Electrochemical Oxidation of Chalcopyrite at 340 °C and 21 MPa. Minerals. 2020; 10(12):1071. https://doi.org/10.3390/min10121071
Chicago/Turabian StyleWang, Luying, Heping Li, Qingyou Liu, Liping Xu, Lei Zha, and Sen Lin. 2020. "Effect of Chloride Ions on the Electrochemical Oxidation of Chalcopyrite at 340 °C and 21 MPa" Minerals 10, no. 12: 1071. https://doi.org/10.3390/min10121071
Note that from the first issue of 2016, this journal uses article numbers instead of page numbers. See further details here.