Reverse Combined Microflotation of Fine Magnetite from a Mixture with Glass Beads
by
 , and
, and
Nickolaj N. Rulyov
1,2,*, 
Lev O. Filippov
3,
Dmytro Y. Sadovskyi
1,2 and
Vitalina V. Lukianova
2,4 1
Institute of Biocolloid Chemistry, National Academy of Sciences of Ukraine, 03142 Kyiv, Ukraine
2
Private Venture “TURBOFLOTSERVICE”, 252103 Kyiv, Ukraine
3
GeoResources Laboratory, University of Lorraine, CNRS, 54000 Nancy, France
4
Department of Ecology and Safety of Vital Functions, National Transport University, 01010 Kyiv, Ukraine
*
Author to whom correspondence should be addressed.
Minerals 2020, 10(12), 1078; https://doi.org/10.3390/min10121078
Submission received: 2 October 2020
/
Revised: 29 October 2020
/
Accepted: 16 November 2020
/
Published: 30 November 2020
(This article belongs to the Special Issue Fine Particle Flotation: Experimental Study and Modelling)
Abstract
:Magnetite is an essential iron-bearing mineral. The primary method of magnetite ore beneficiation involves successive steps of crushing, grinding, and magnetic separation. Reverse cationic flotation is used at the final stage to remove silicate and aluminosilicate impurities from the magnetite concentrate and reduce silica content to 1–3%, depending on metallurgical processing route (electrometallurgy, direct iron reduction). In view of the stringent demands of the magnetite concentrate grade, before flotation, the ore is currently routinely ground down to a particle size below 35 µm, and magnetite particles are ground to a size below 10 µm. This significantly reduces the efficiency of flotation and increases iron loss in the tailings due to the hydraulic report in froth being up to 15–25%. Combined microflotation (CMF) looks to be a promising method of increasing fine-particle flotation efficiency, as it uses relatively small amounts of microbubbles alongside conventional coarse bubbles. Microbubbles act as flotation carriers, collecting gangue particles on their surface, which then coarse bubbles float. The purpose of this study is to explore the effectiveness of CMF for processing a model mixture that contained magnetite particles smaller than 10 µm and glass beads (Ballotini) below 37 µm in size when the initial iron content in the mixture was 63.76%. Commercial reagent Lilaflot 821M was used as both collector and frother. The flotation procedure, which included the introduction of 15 g/t of the collector before the start of flotation, and the addition of 5 g/t of the collector in combination with a microbubble dose of 0.018 m3/t 6 min after starting flotation, ensured an increase in the concentrate grade to 67.63% Fe and iron recovery of 91.16%.
1. Introduction
Demand for iron is sustainably high, and the rates of its production and consumption may serve as indicators of the development of the global economy [1]. Although annual iron production rose beyond 3 billion ton, the need to boost it further still grows. Since rich deposits of iron ore are being depleted, there are more incentives to start developing low- and medium-grade deposits.
Magnetite is one of the main iron-bearing minerals. Magnetite concentrate is produced by separating it from gangue in the successive stages of crushing, grinding, and magnetic separation and flotation [2,3]. The major undesirable impurity is quartz, and according to iron- and steel-industry standards, its content cannot exceed 5–7%. Conventional ways to remove quartz involve the reverse, direct anionic or cationic flotation, or their combinations to produce high-grade iron concentrate for modern processing technologies [4,5]. Scientific studies aimed at finding effective reagents and upgrading the equipment for iron-ore beneficiation started in the 1930s and continue to this day [5,6]. Currently, reverse cationic flotation is the common practice, where amines are used as collectors to ensure the removal of quartz in the froth [5,7,8]. This approach includes the flotation of quartz in alkaline conditions (рН 9.5–10.5), and the use of amine collectors and corn starch as iron-oxide depressors [6,9,10]. The initiatives to unlock fine disseminated iron ores imply challenges associated with the need for ore grinding to particles sizes below 33 µm after magnetic separation and before flotation conditioning. However, coarse bubbles (1–3 mm) generated in conventional flotation cells are not effective for the flotation of these fine particles; hence, this causes the extension of the flotation process and the surge of collector consumption [11,12]. These factors make the process costly and inefficient in terms of energy and general resource consumption. A promising solution for this problem suggests using fine microbubbles smaller than 0.1 mm, which act as flotation carriers, along with coarse bubbles. The flotation efficiency of fine particles depends on bubble capture efficiency, and this value is proportional to (dp)n/(Db)m, where dp and Db are particles and bubble sizes, respectively, and n and m are around 2. Considering that, the microbubble diameter is around 10 times smaller than the diameter of conventional coarse bubbles generated in a flotation cell, and the capture efficiency of fine particles is about 100 times higher than that of coarse bubbles. Therefore, microbubbles can collect fine particles on their surface sufficiently quickly, and coarse bubbles then transport them into the froth. This concept was theoretically substantiated in [13]. The method, termed “combined microflotation”, proved its effectiveness in quartz flotation [14,15], in the reverse cationic flotation of real magnetite concentrate at the Ferrexpo concentrator (Horishni Plavni, Ukraine) [16], and fine-grained sulfide minerals [17,18]. Recent studies [19] showed that application of microbubbles with coarse bubbles promotes the flotation of fine (<20 µm) and medium-size (60–80 µm) particles [19]. The above studies revealed that microbubble application led to significant water recovery and hence the increased hydraulic entrainment of particles into froth; in reverse flotation, this phenomenon leads to a decrease in valuable mineral recovery. The objective of this research is to define the optimal conditions of reverse combined microflotation of magnetite on the basis of studies of the reverse cationic flotation of magnetite from a mixture with glass beads.
2. Experiments
2.1. Materials
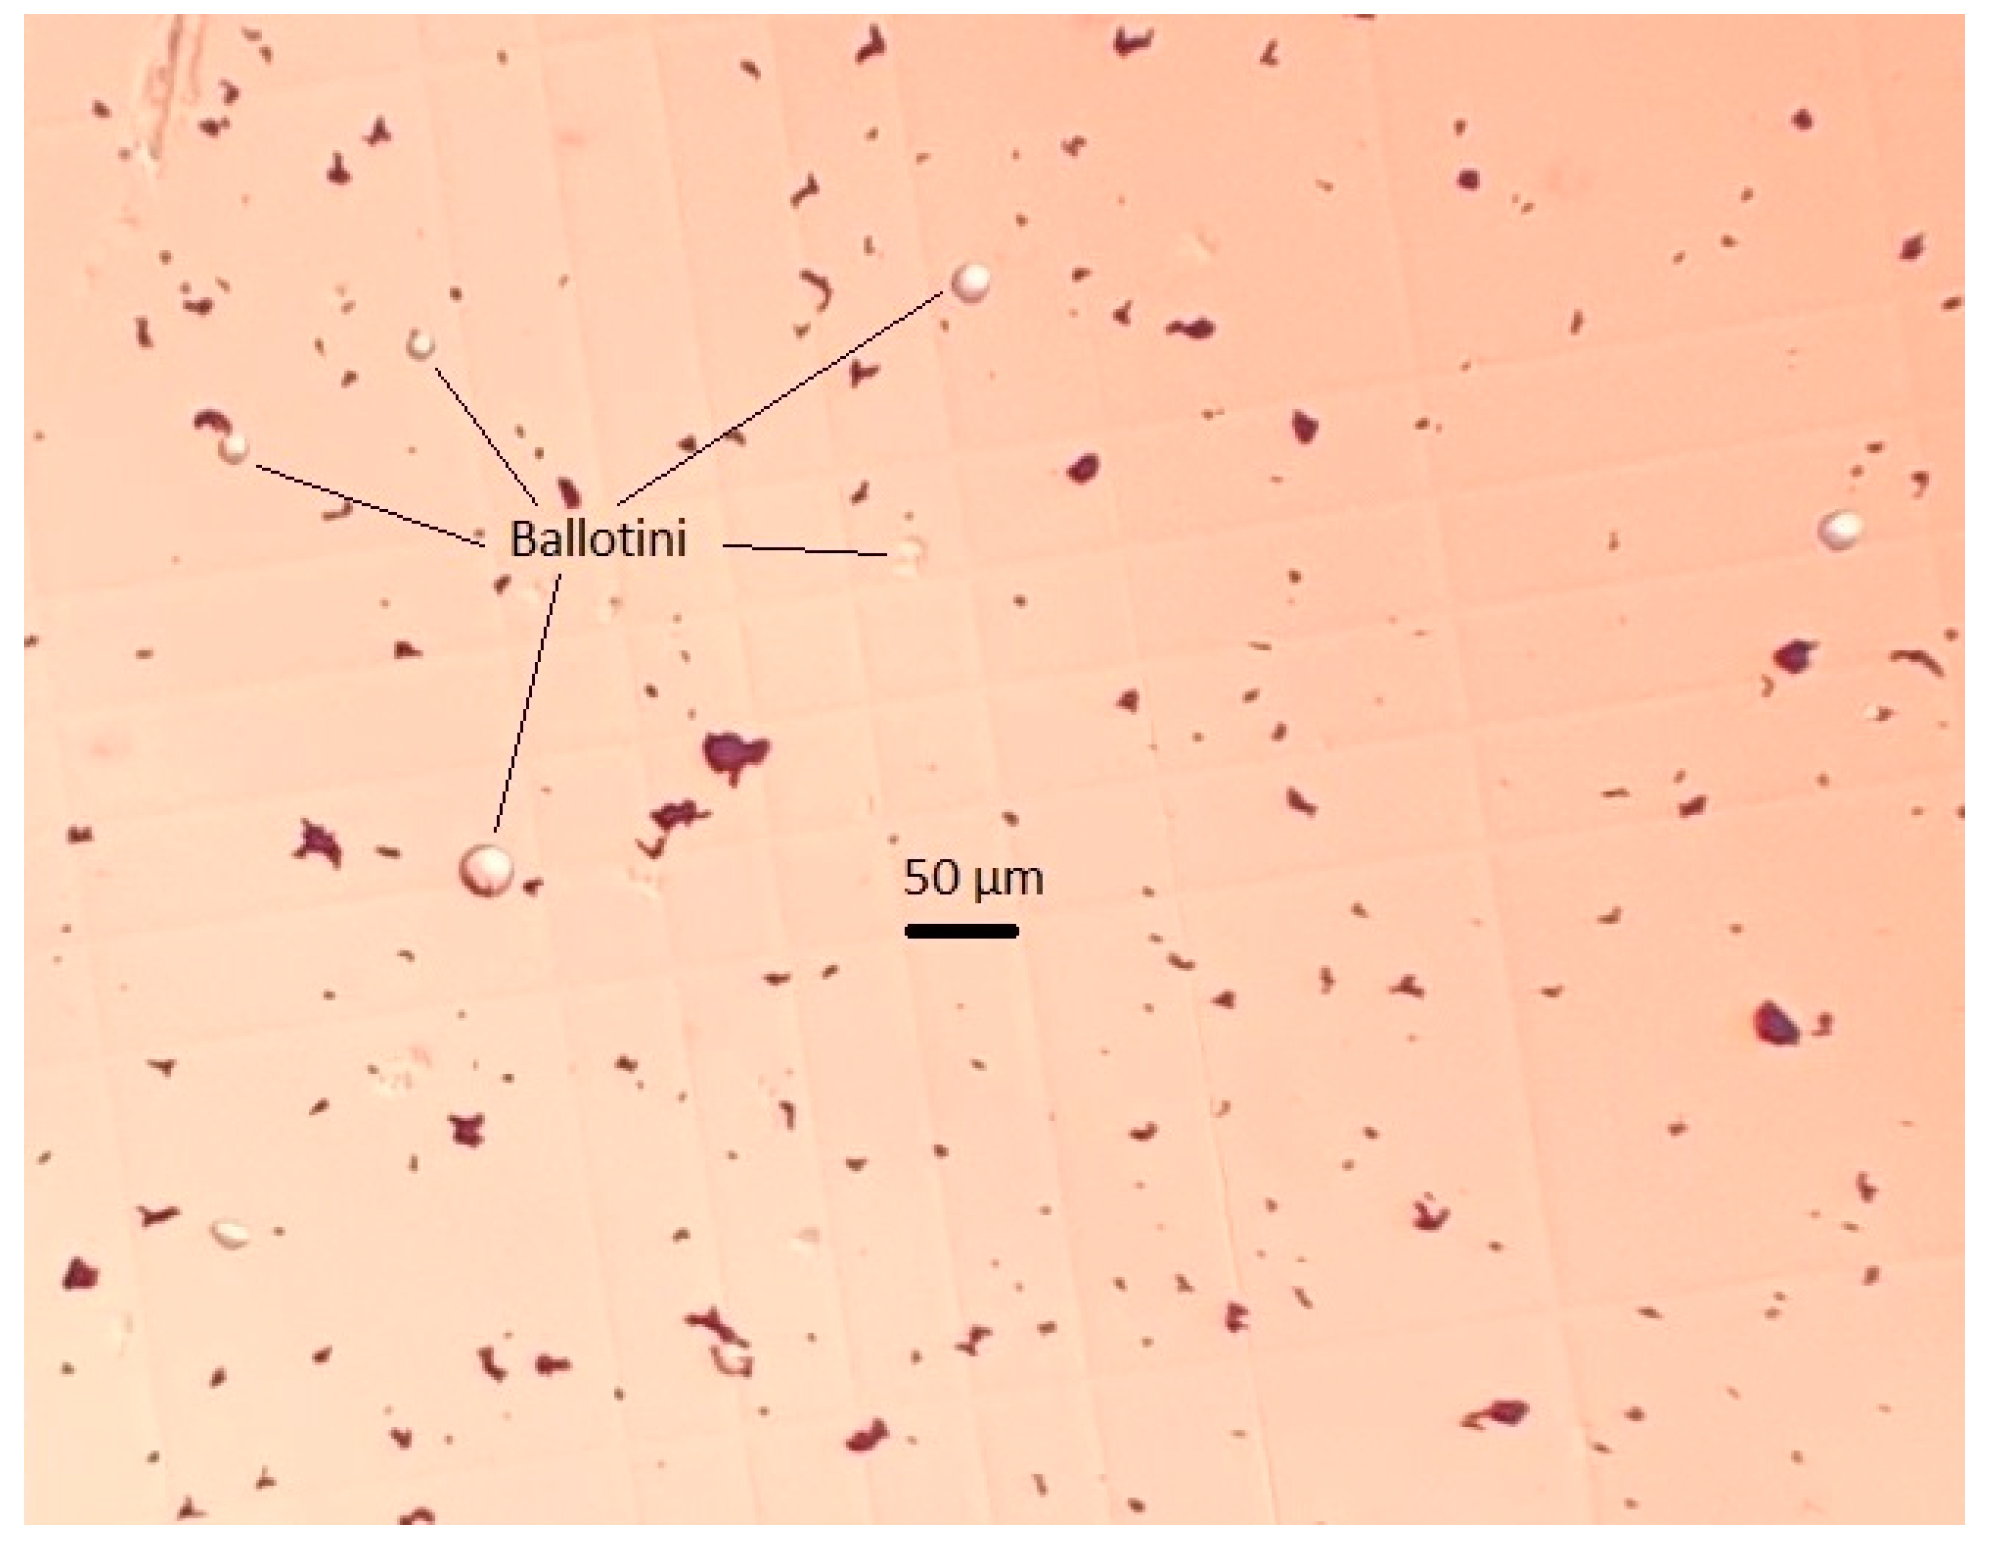
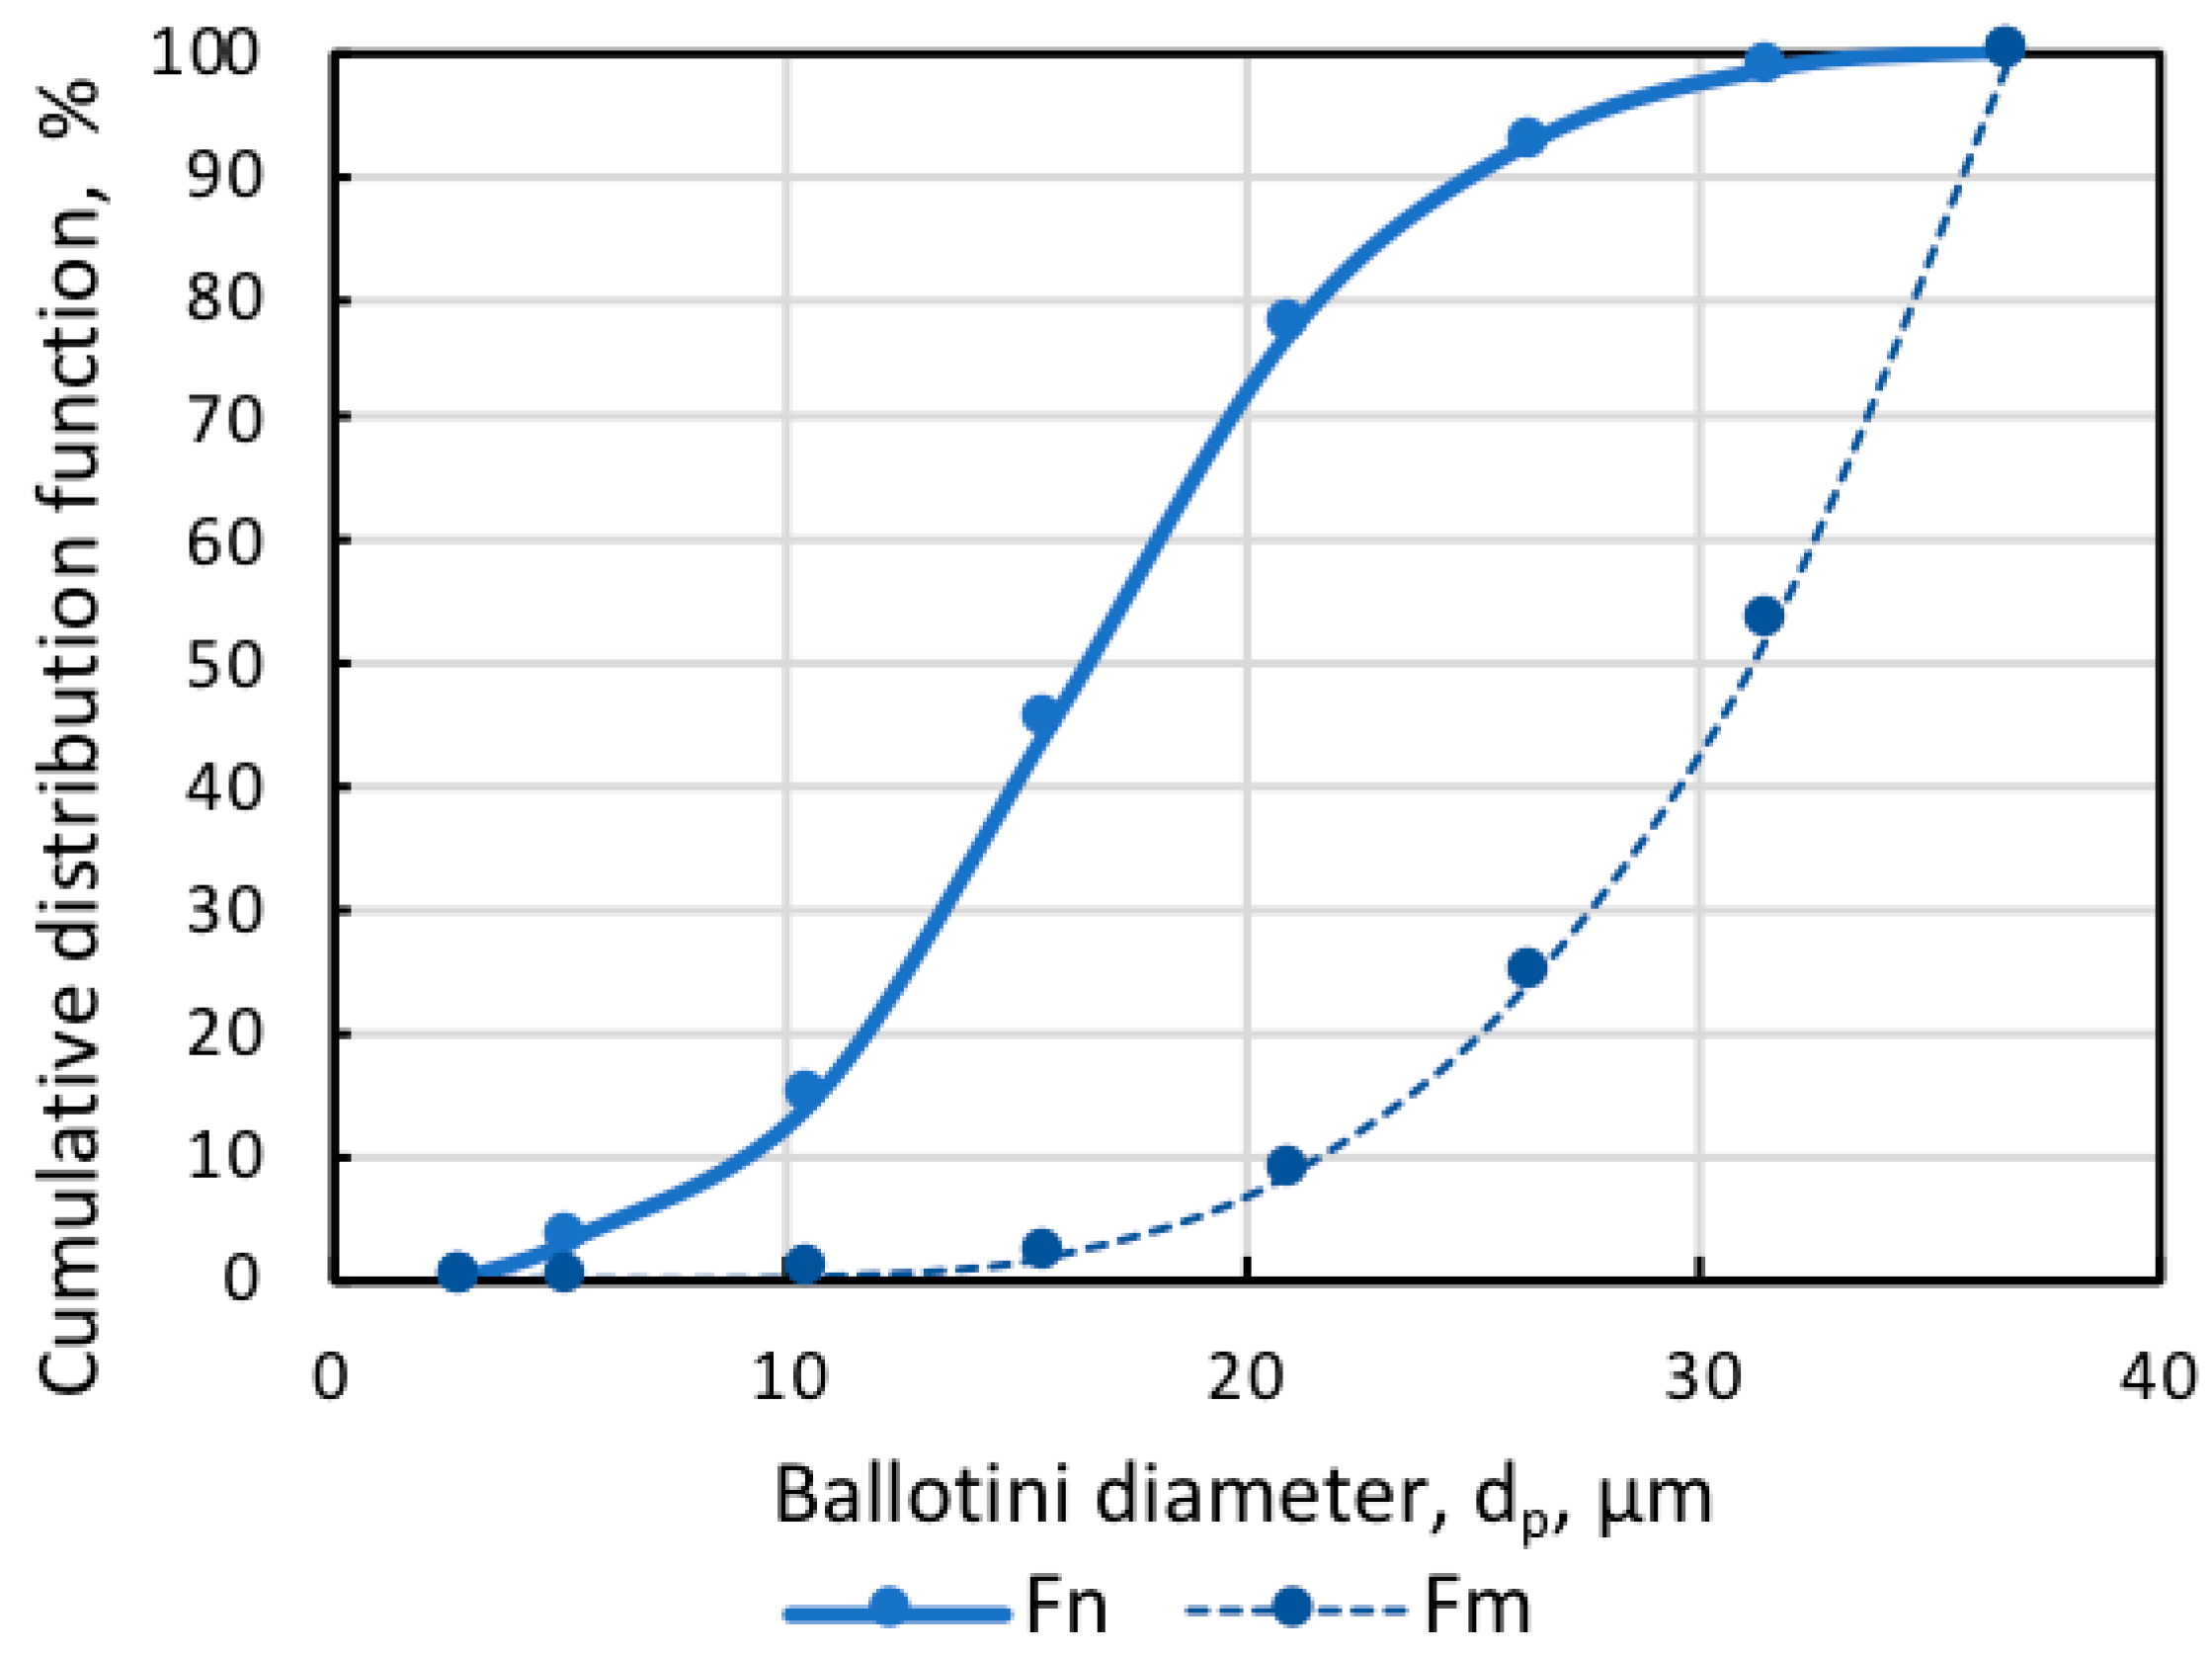
The artificial mixture of practically pure magnetite (Fe, 72.4%) and glass beads (Ballotini) was the study object. Figure 1 shows that the size of magnetite particles was below 10 µm, and glass beads were smaller than 37 µm, which was in line with the dimensional ratio of magnetite and quartz particles in actual pulp, for example, at the Ferrexpo Poltava Mining (FPM) concentrator. The size distribution of Ballotini particles was defined by the statistical processing of micrographs. The numerical and mass cumulative distribution functions of Ballotini, presented in Figure 2, showed that the share of Ballotini particles ranging in size from 20 to 37 µm accounted for 95% of the total mass of glass beads. In all test runs, a model mixture was used in which Ballotini content was 12 wt%, and iron concentration was 63.76 wt%.
2.2. Chemicals
Etheramine-based collector Lilaflot 821M produced by Akzo Nobel Surface Chemistry (ANSC, Stenungsund, Sweden) was used as cationic collector and frother [20]. Since this specific reagent poorly and lengthily dissolves in water, in order to guarantee the high accuracy of the dose, 1 g of the collector was first dissolved in 5 mL of isopropanol, and then diluted by 1 L of distilled water. The produced stock solution was used as collector and frother for microbubble generation.
2.3. Facilities
The flotation tests were performed on a Mekhanobr-FML3 laboratory cell (Mekhanobr Technika, Saint Petersburg, Russia) shown in Figure 3. Cell volume was 2 L, and its linear dimensions were 115 × 115 × 145 mm. Figure 3 also shows air-in-water microdispersion generator MBGen-0.012 (TURBOFLOTSERVICE, Kyiv, Ukraine) [16], intended to supply a set dose of microbubbles and collector into the flotation cell by a thin polyvinyl chloride (PVC) pipe (2 mm). In every test run, the generation of stable air-in-water microdispersion was produced by feeding a Lilaflot 821M solution into the amount of 0.5 g/L in MBGen-0.012. This ensured the production of air-in-water dispersion with an air concentration of 63.7 vol.%. By knowing the consumption of the collector solution (1.61 mL/s) and the air (2.82 mL/s) in MBGen-0.012, it was possible to precisely estimate the time needed for supplying the required dose of microbubbles (mL/g) and the collector (g/t) into the cell.
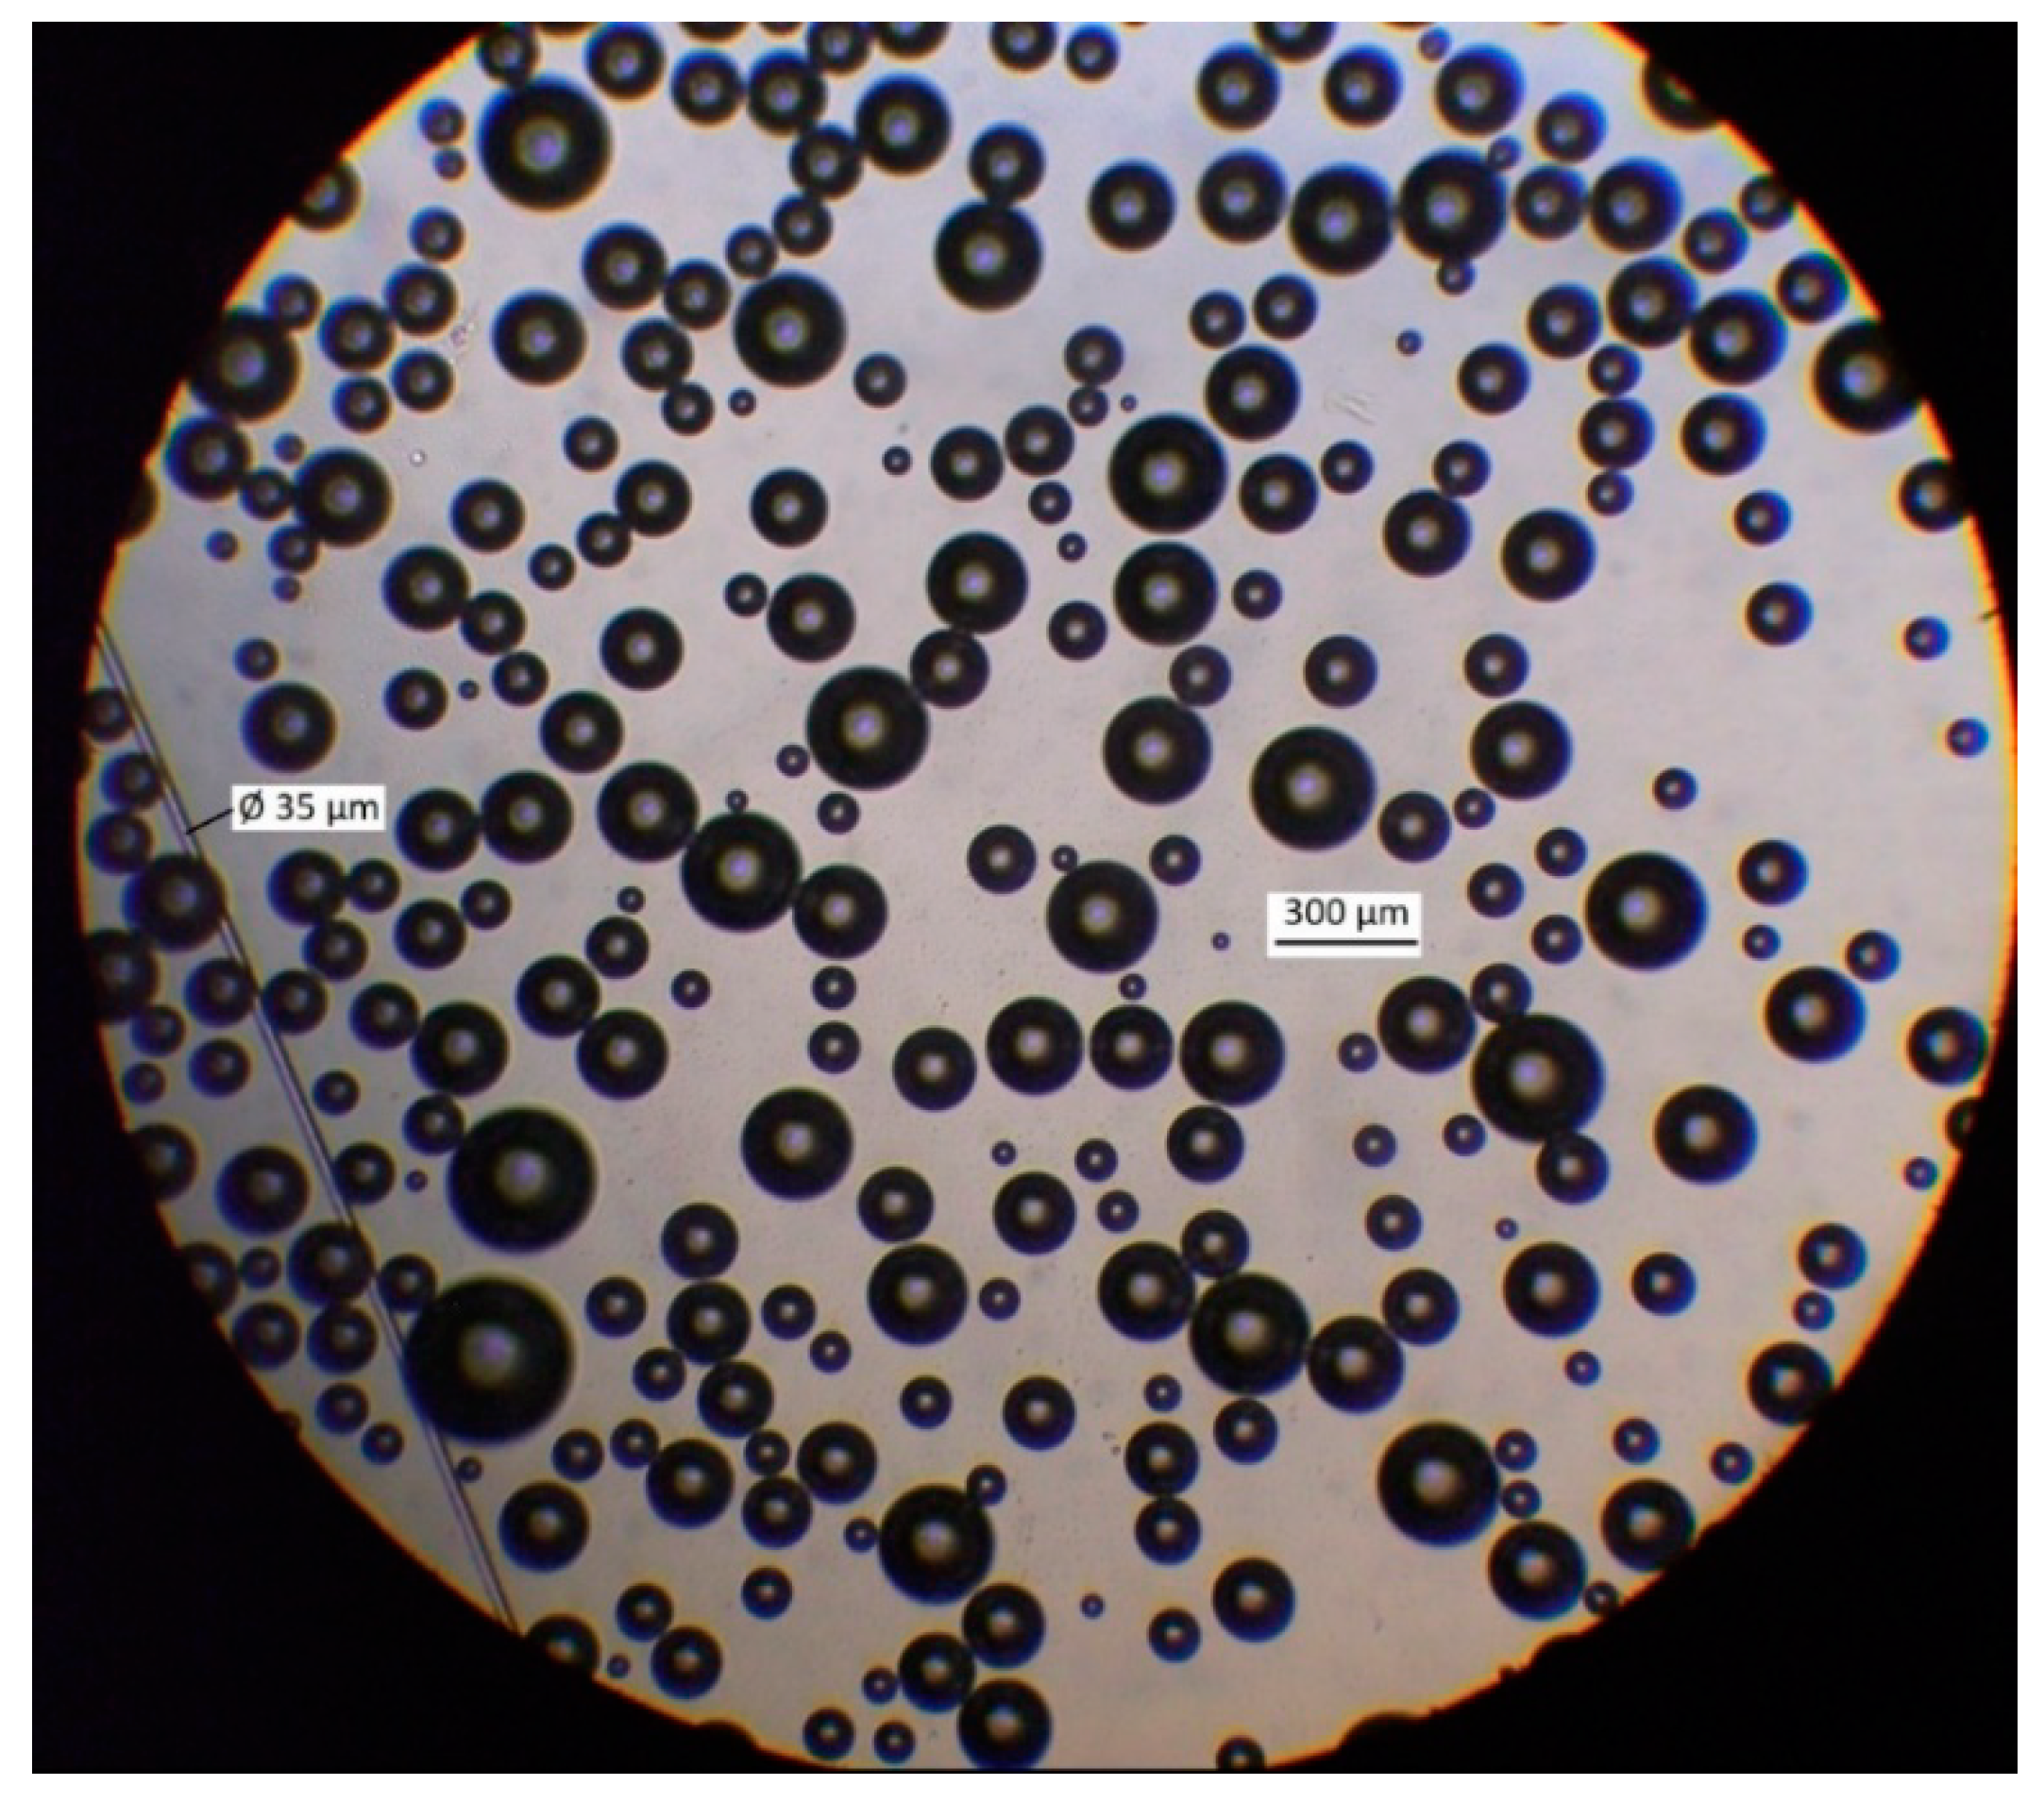
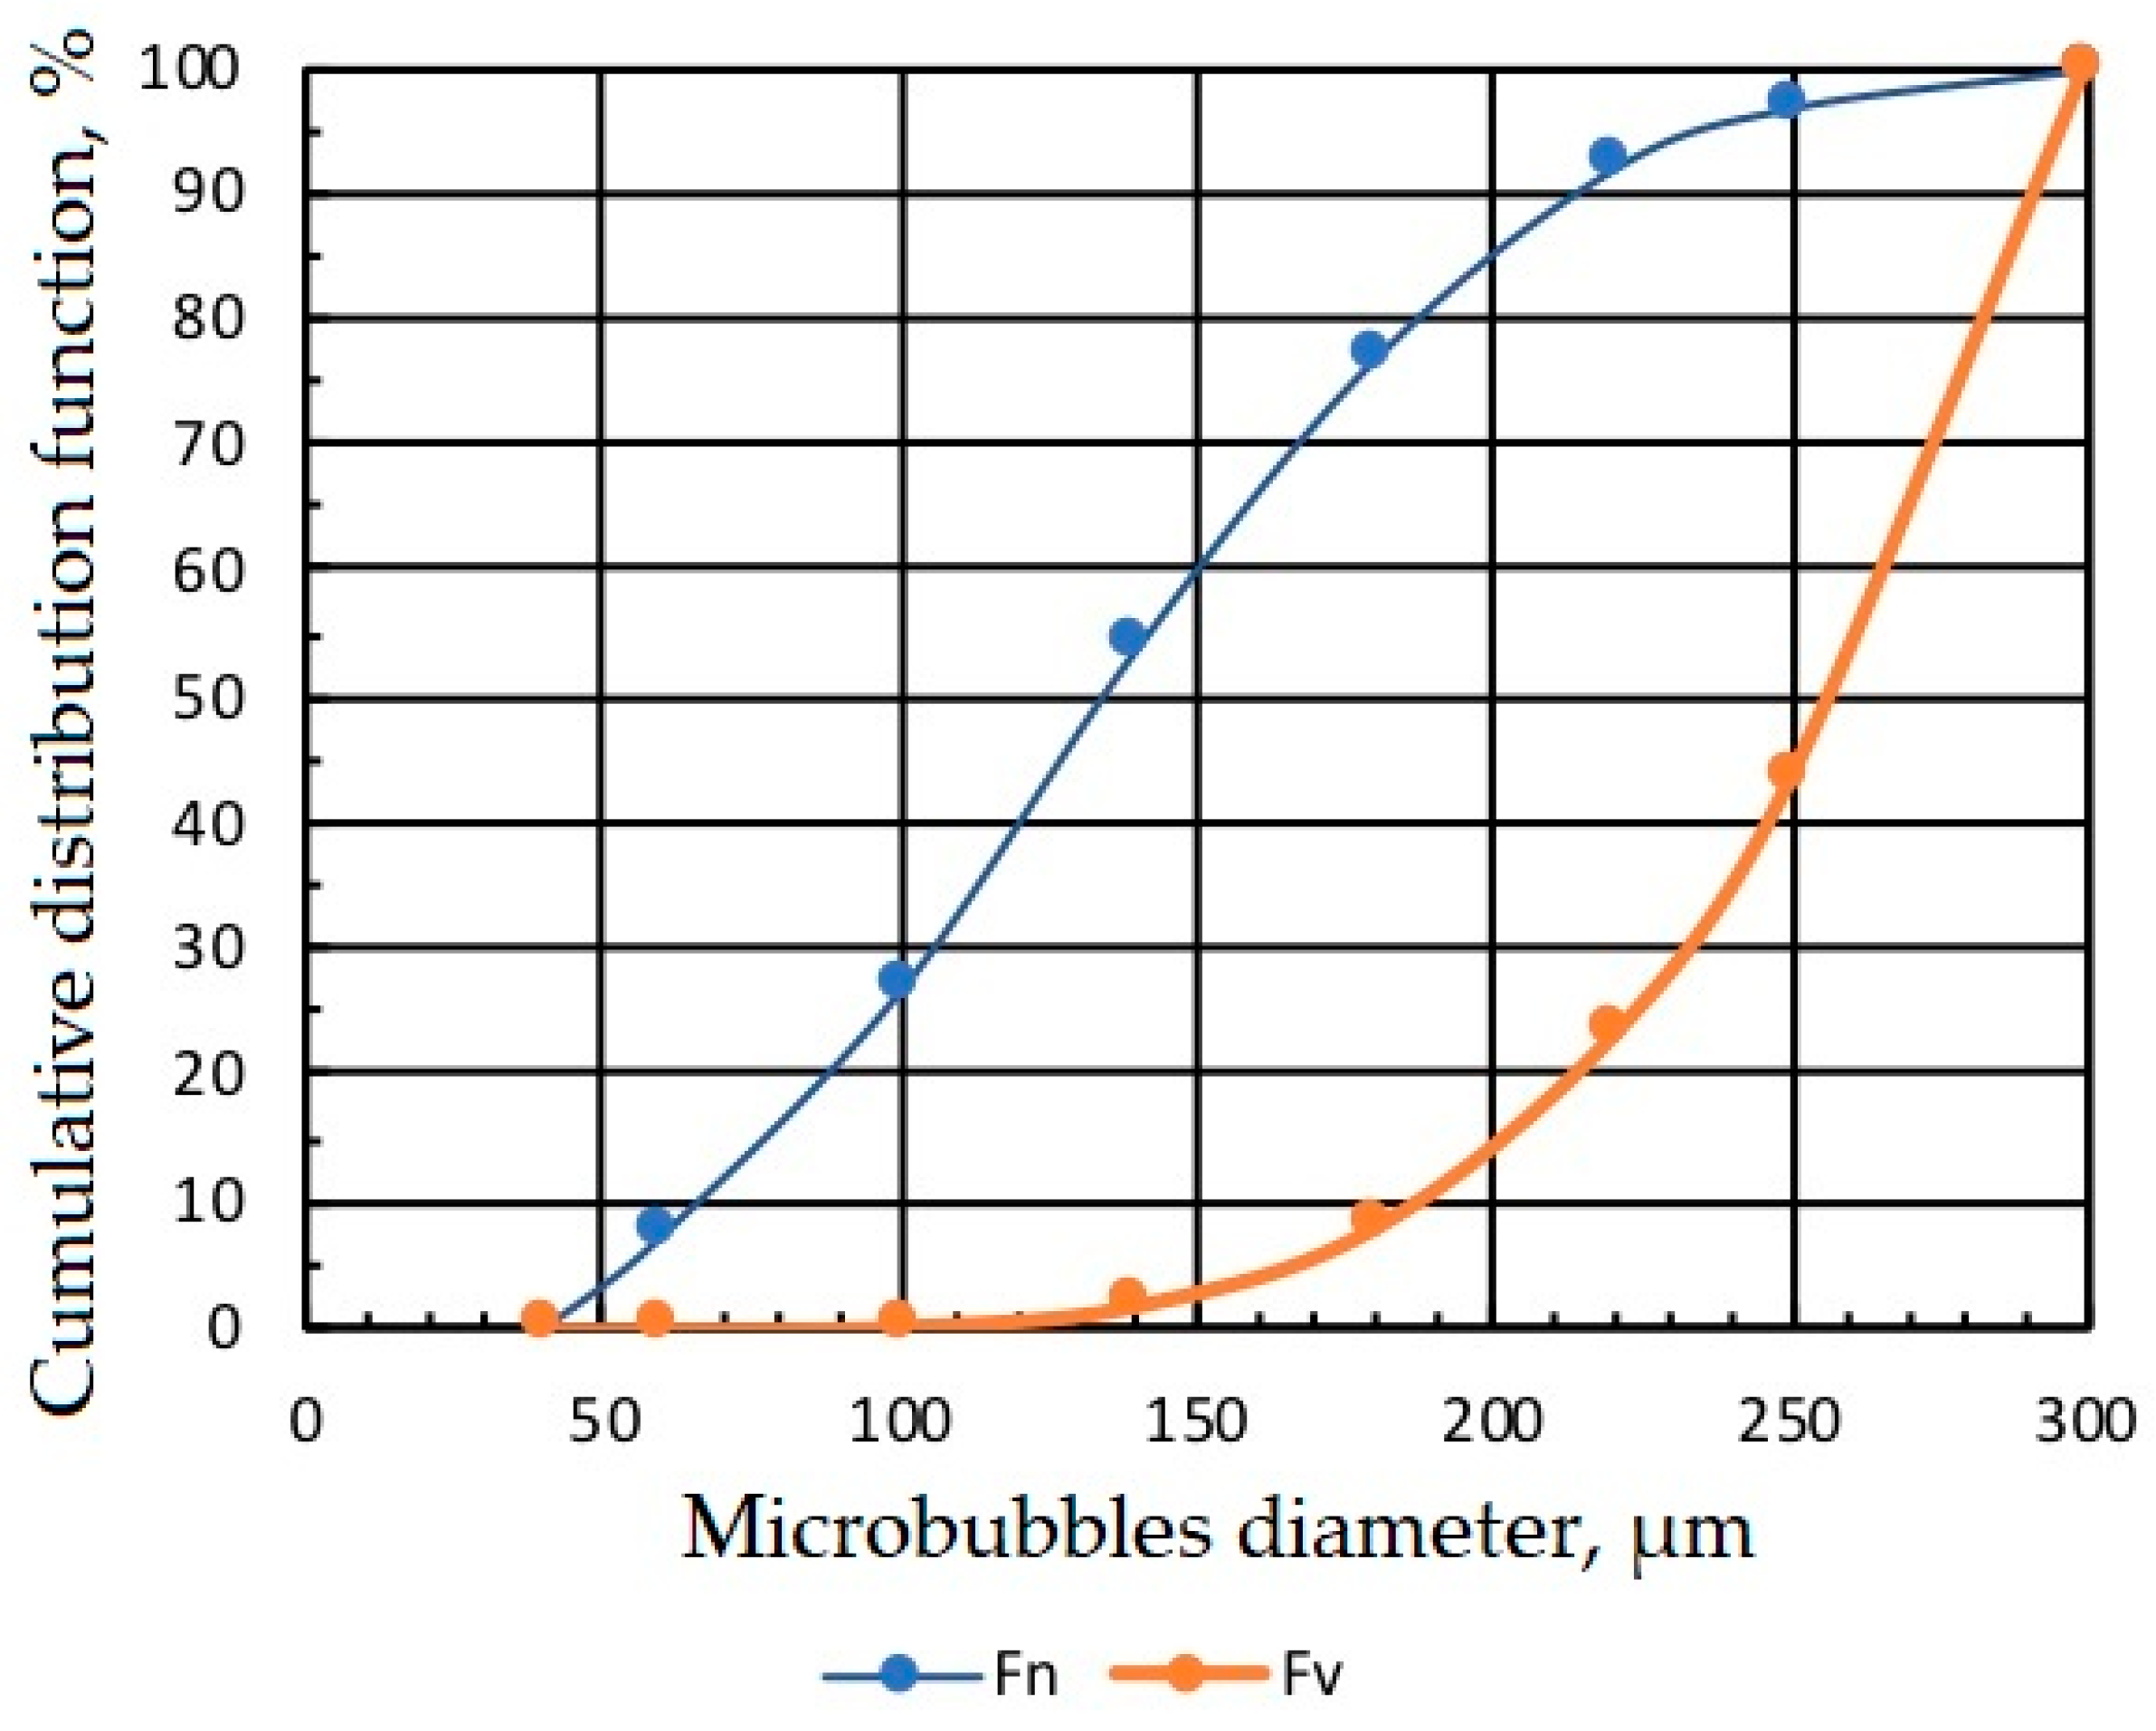
Figure 4 presents the micrograph of microbubbles generated by MBGen-0.012 using the procedure described in [16], and Figure 5 shows the numerical and volume cumulative distribution functions of microbubbles obtained by the statistical processing of micrographs. Data in Figure 5 confirmed that microbubbles sized 200–300 µm accounted for 85% of the air volume in the dispersion. A peristaltic pump, shown in Figure 3, controlled the flow rate of air in the flotation cell.
2.4. Measurement Procedure
In all experiments, the pulp was prepared with tap water, and solid concentration amounted to 250 g/L or to around 21 wt%. Before starting the test, the flotation cell was filled with 1.8 L of tap water at a temperature of 15 ± 2 °C, and 0.5 kg of the magnetite and Ballotini mixture of the above-mentioned composition was added into the cell. Then, for the proper dispersion of magnetite particles and Ballotini aggregates in water, the mixture was agitated for 1 min without air supply and at the impeller rotation speed of 1500 rpm. Next, the set dose of the collector was added into the mixture, suspension volume was increased to 2 L, and the mixture was agitated for 30 s at the impeller rotation rate of 900 rpm. Before starting the flotation, the air-in-water microdispersion generator supplied a set amount of microbubbles and collector into the flotation cell for several seconds; then, the peristaltic pump was switched to supply air into the cell at the rate of 0.3 or 0.18 L/min. During flotation, the froth was collected at the time intervals = 3 min, = 3 min, = 5 min, and = 9 min. Samples thus obtained were weighted, evaporated, and analyzed for iron content. This procedure provided data on the recoveries of solids and water into the froth and on the iron content in solids. Once samples of the froth product had been collected, data were used to calculate the recovery of iron into concentrate (cell product) and its grade using formulae
where n is the number of the collected froth-product samples, Δmi and pi are their mass and iron content, respectively, and and are the recalculated initial mass of solids in the pulp and the iron content in solids. Data also provided the means to estimate iron recovery by flotation and entrainment at different flotation conditions. In some tests, microbubbles and additional amounts of the collector were introduced not immediately at the start of flotation, but at later stages (in 6 and/or 11 min after the start of flotation).
The flow rate of air supplied into the flotation cell by the peristaltic pump was adjusted so that it was in alignment with the ratio of air consumption/solid mass in a cell that is typical for actual industrial applications. For example, in the process of magnetite-concentrate flotation at the Ferrexpo concentrator, this ratio was 20–25 m3/h/t = 0.33–0.42 L/min/kg. To simulate a corresponding ratio in the test runs, when the mass of solids in the cell was 0.5 kg, the air flowrate had to be in the range 0.16–0.21 L/min. Only under such conditions does the kinetics of the flotation process in a laboratory cell reflect actual industrial patterns. In laboratory studies, air consumption is routinely defined on the basis of the superficial air velocity used in industrial flotation cells. At the Ferrexpo concentrator, superficial air velocity is 0.70–0.99 cm/s. In the main experiments on the reverse flotation of magnetite, airflow rate was set at 0.18 L/min for the cross-sectional area of 132.5 cm2 to work with superficial gas velocity of 0.73 cm/s.
3. Results
3.1. Dependence of Iron Recovery and Concentrate Grade on Collector Dose
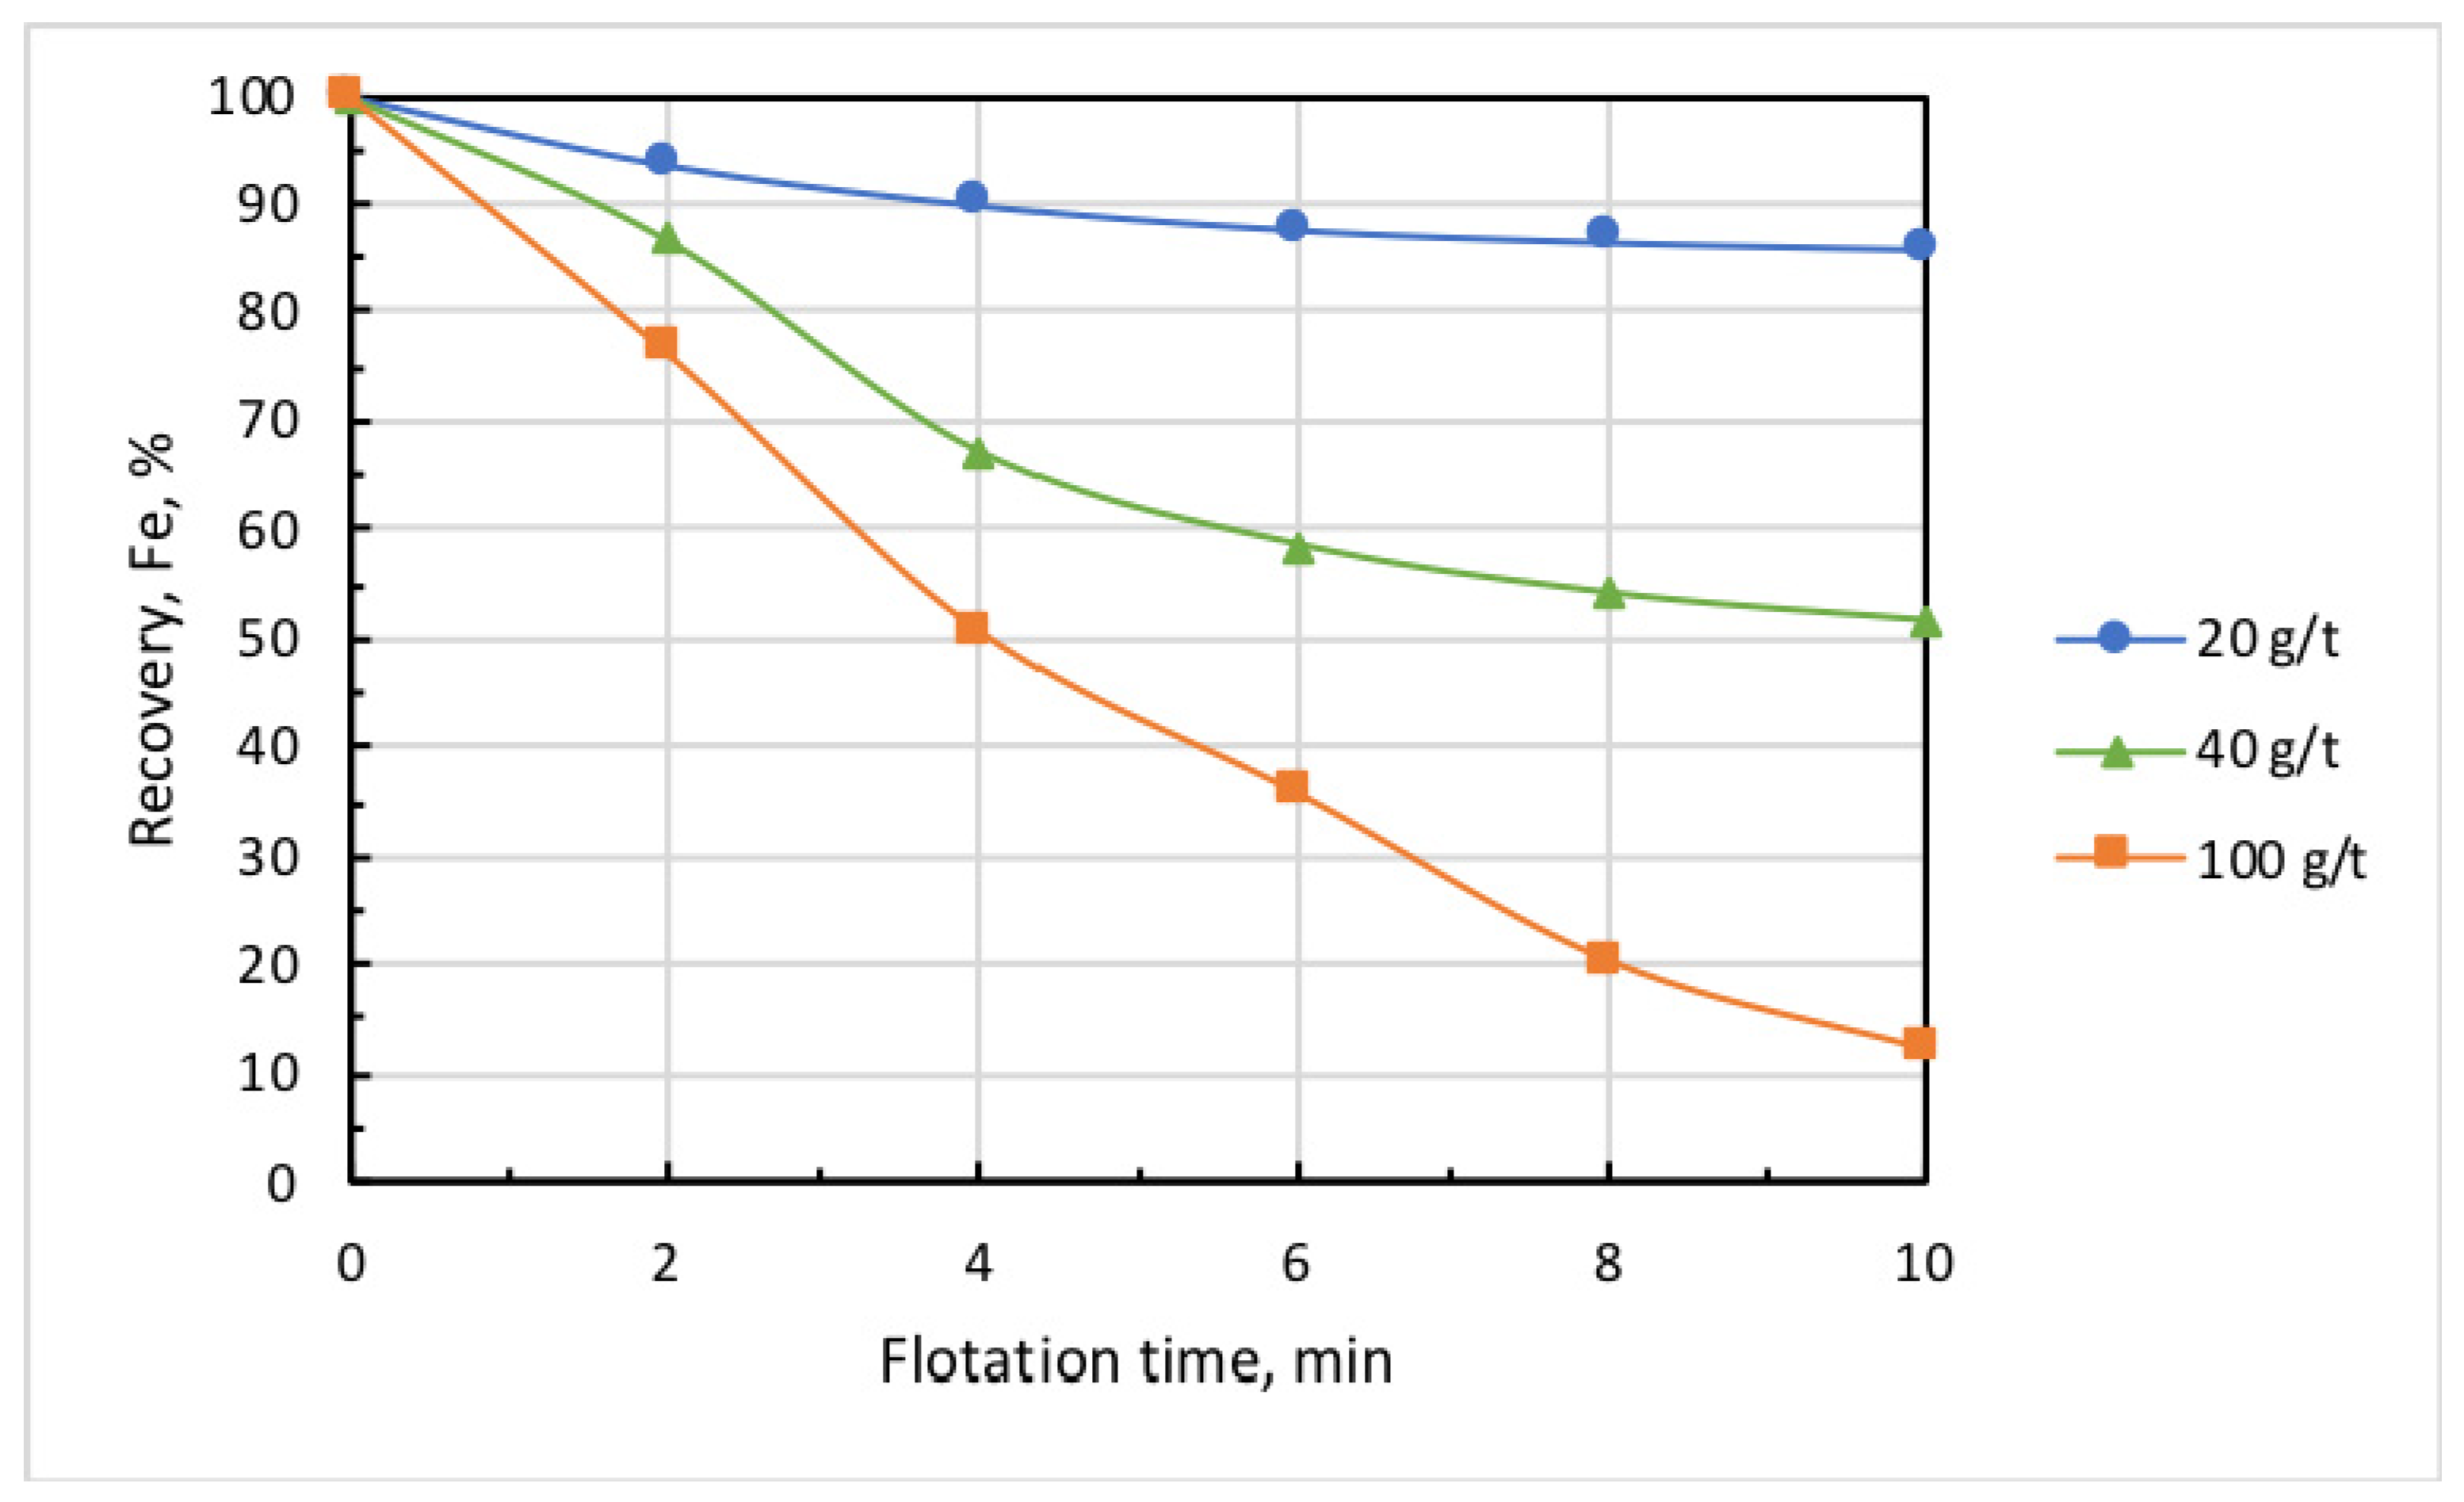
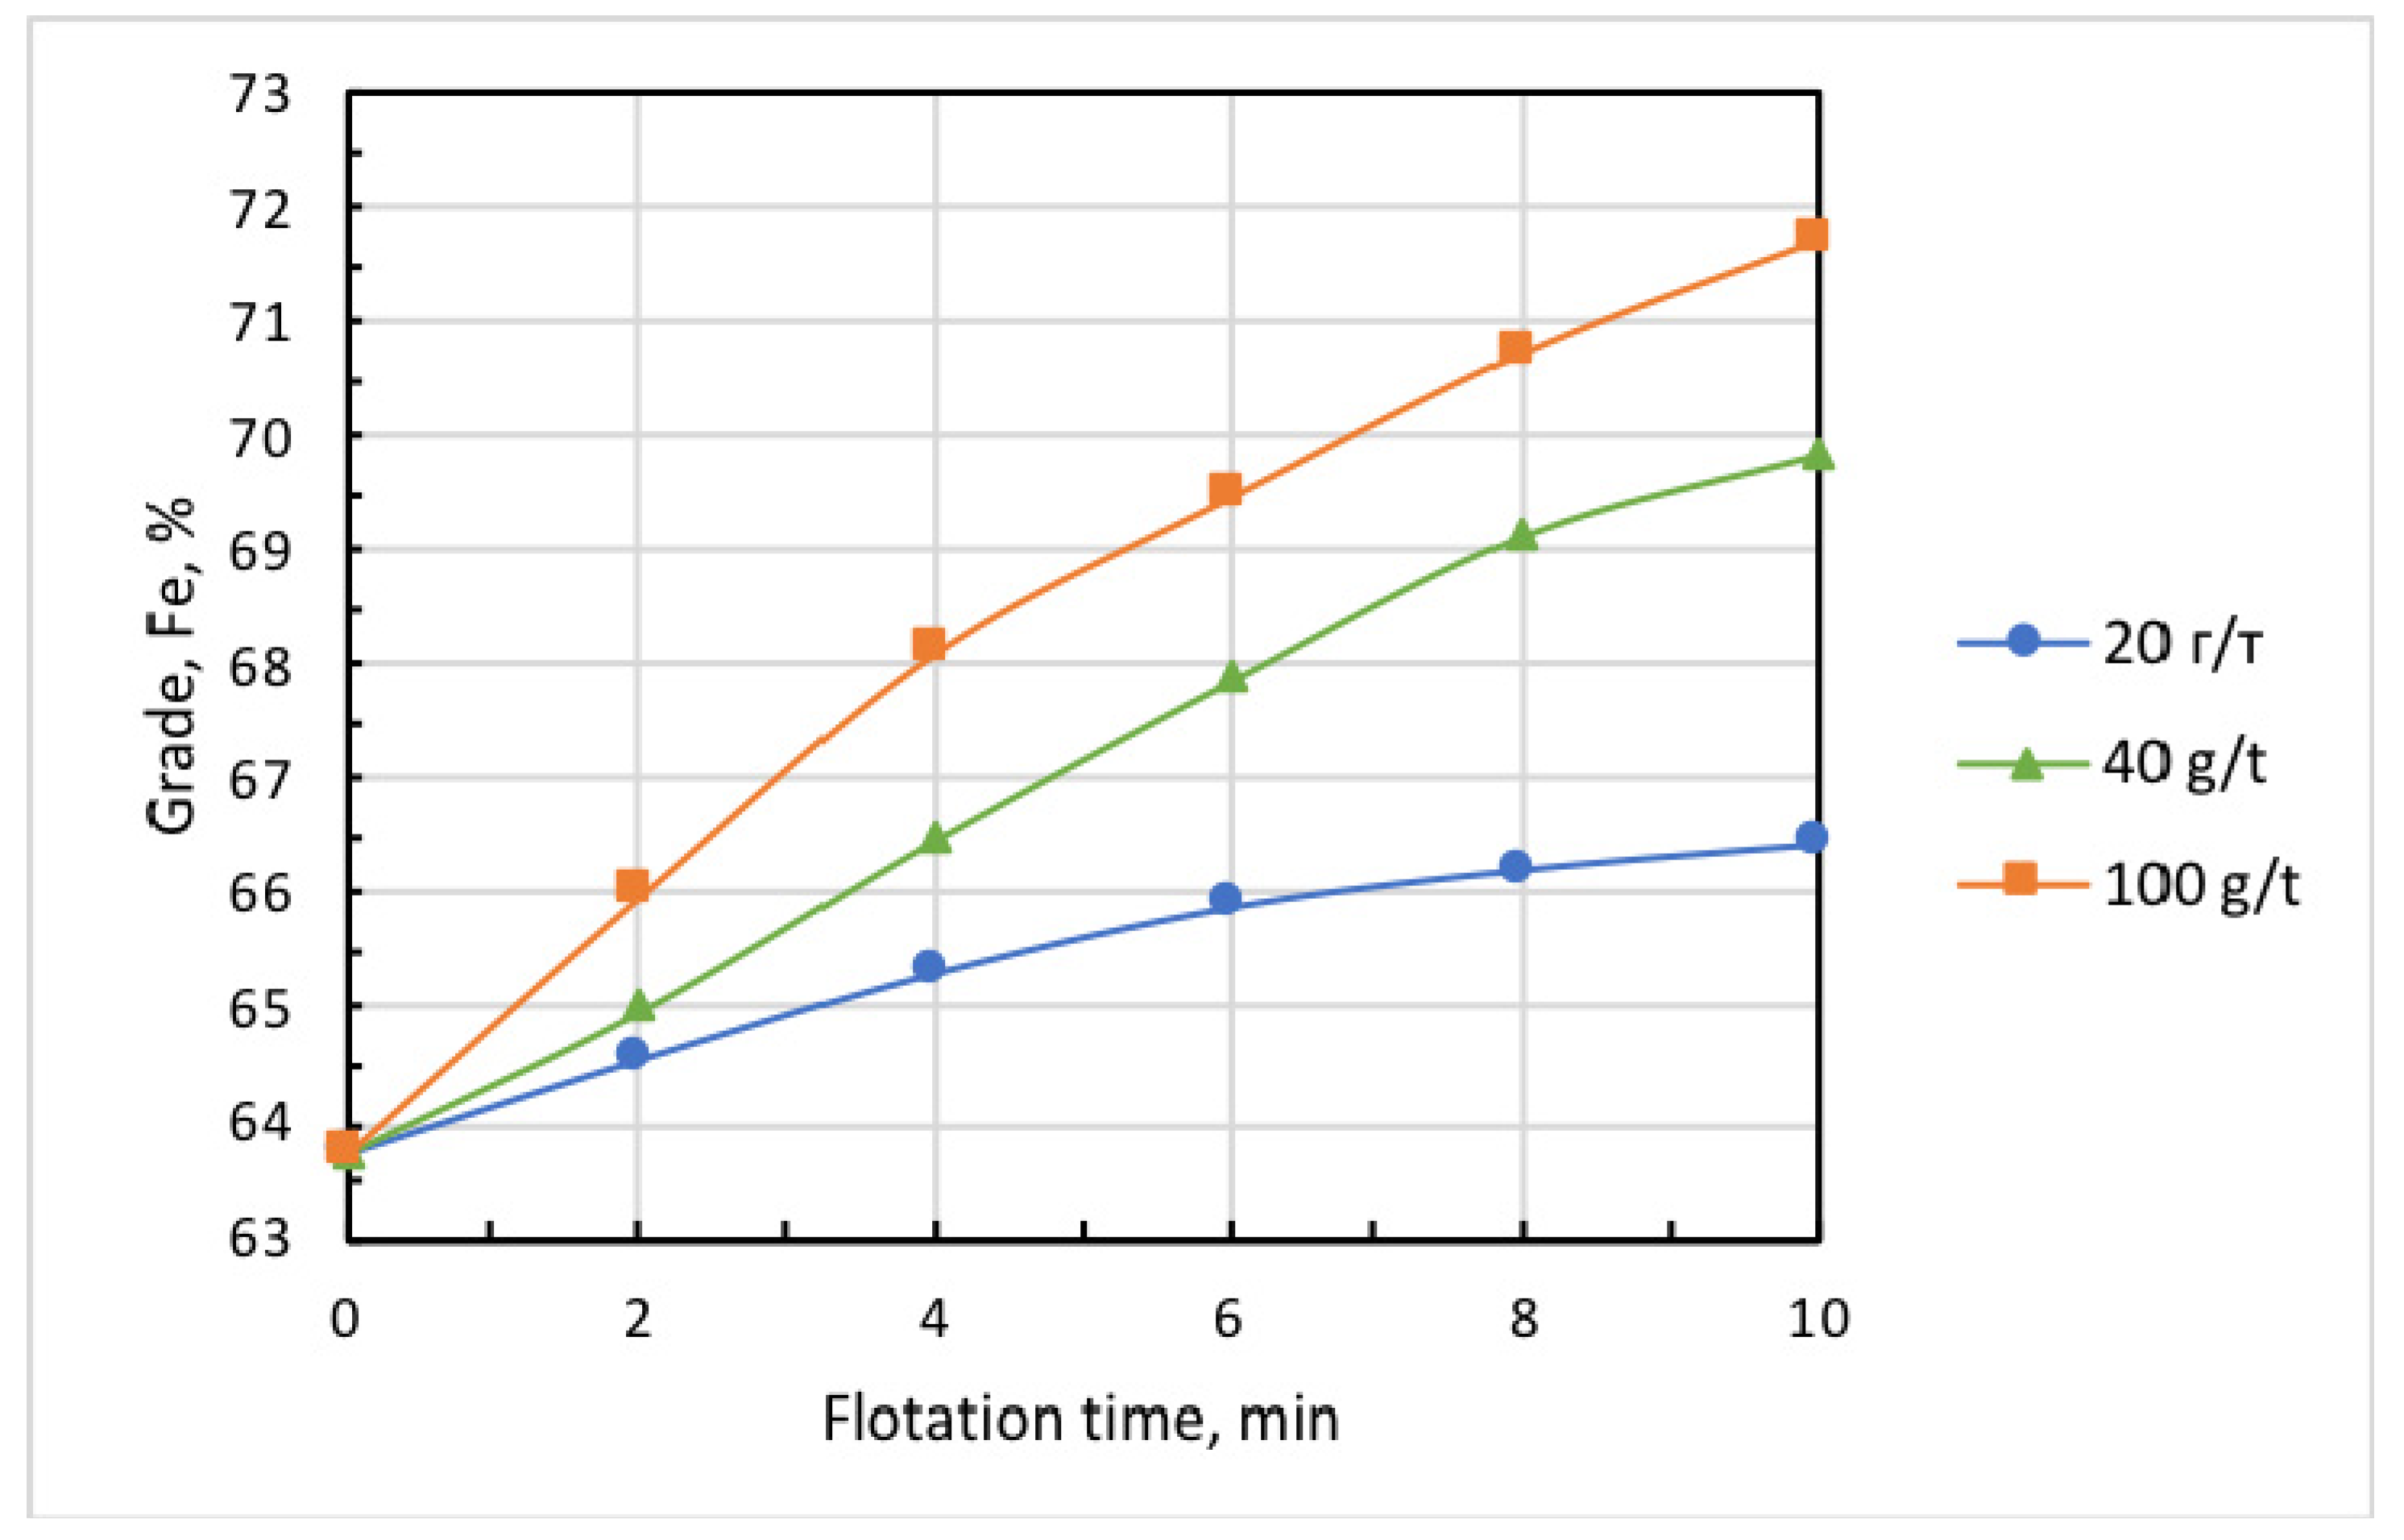
Figure 6 and Figure 7 show the kinetic dependencies of iron recovery and the grade of the cell (nonfloated) product at different collector dosages. These findings demonstrate that, with the increase in collector dose above 20 g/t, the concentrate grade (iron content) essentially grew, but iron recovery dramatically dropped. This may be partly attributed to the fact that the increase in collector dose promotes the iron-flotation report into the froth product. Since the collector is also a good frother, this induces increased water recovery and the hydraulic entrainment of magnetite into the froth product. Knowing the initial concentration of iron in the pulp, which in these experiments amounted to = 0.1594 g/mL, it is easy to calculate in first approximation the ratio of iron entrained into the froth product using formula
where is the iron concentration in the pulp before the -th sampling of the froth product, is the volume of water contained in the froth product, is the initial volume of the pulp, is the coefficient of the entrainment of magnetite particles, and is the number of collected froth-product samples. In first approximation, can be calculated by formula
where is the initial mass of solids in the pulp, is the iron percentage in the solids, is water content in -th froth-product sample, is the mass of solids in a sample, and is the iron percentage inside it. Results presented in [21] showed that, for particles smaller than 10 µm, coefficient ≈ 0.9. As the percentage of iron remained in the cell product and was known, and the entrained iron content could be calculated, the flotation recovery of iron into the froth product could be estimated. Table 1 presents respective calculations obtained with the use of Equations (1) and (2). These results showed that, with the increase in collector dose from 20 to 100 g/t, the true flotation recovery of iron into the froth product rose by 10 times, whereas entrainment grew by about 2 times. With regard to this fact, in all experiments that followed, collector dose was 20 g/t, and airflow rate was set at 0.18 L/min.
3.2. Dependence of Iron Recovery and Concentrate Grade on Microbubble Dosage Supplied Before Starting Flotation
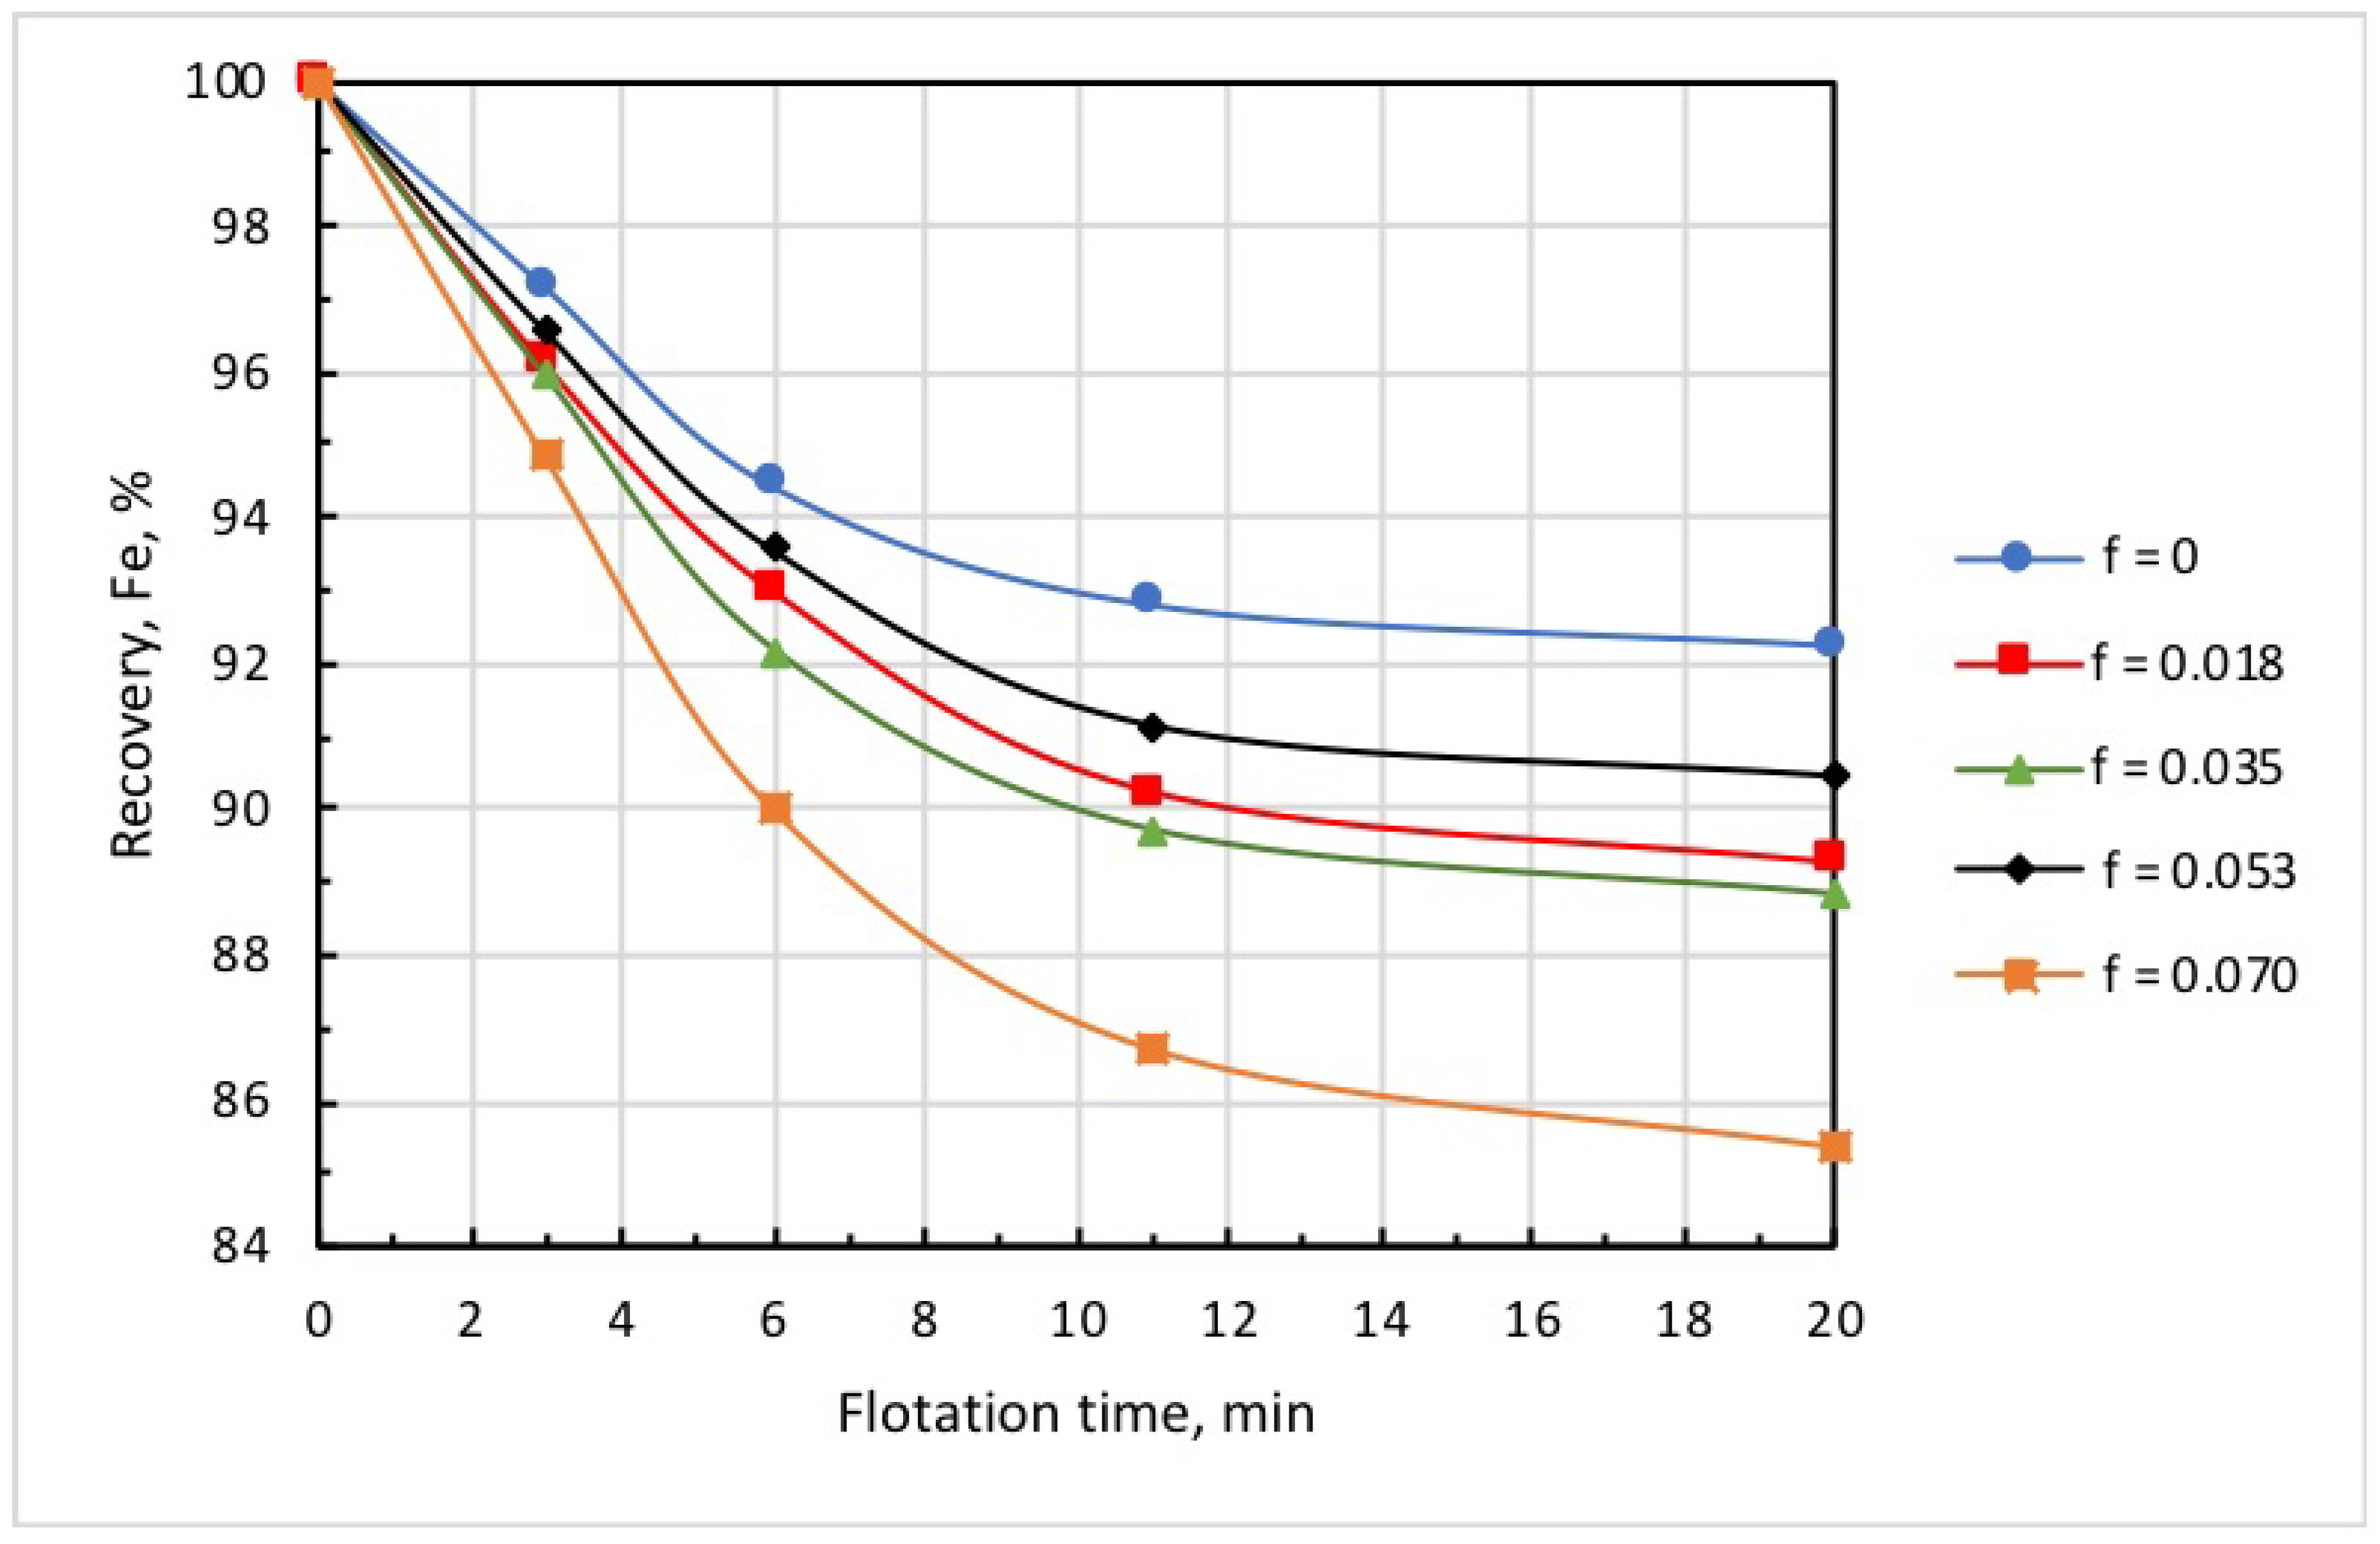
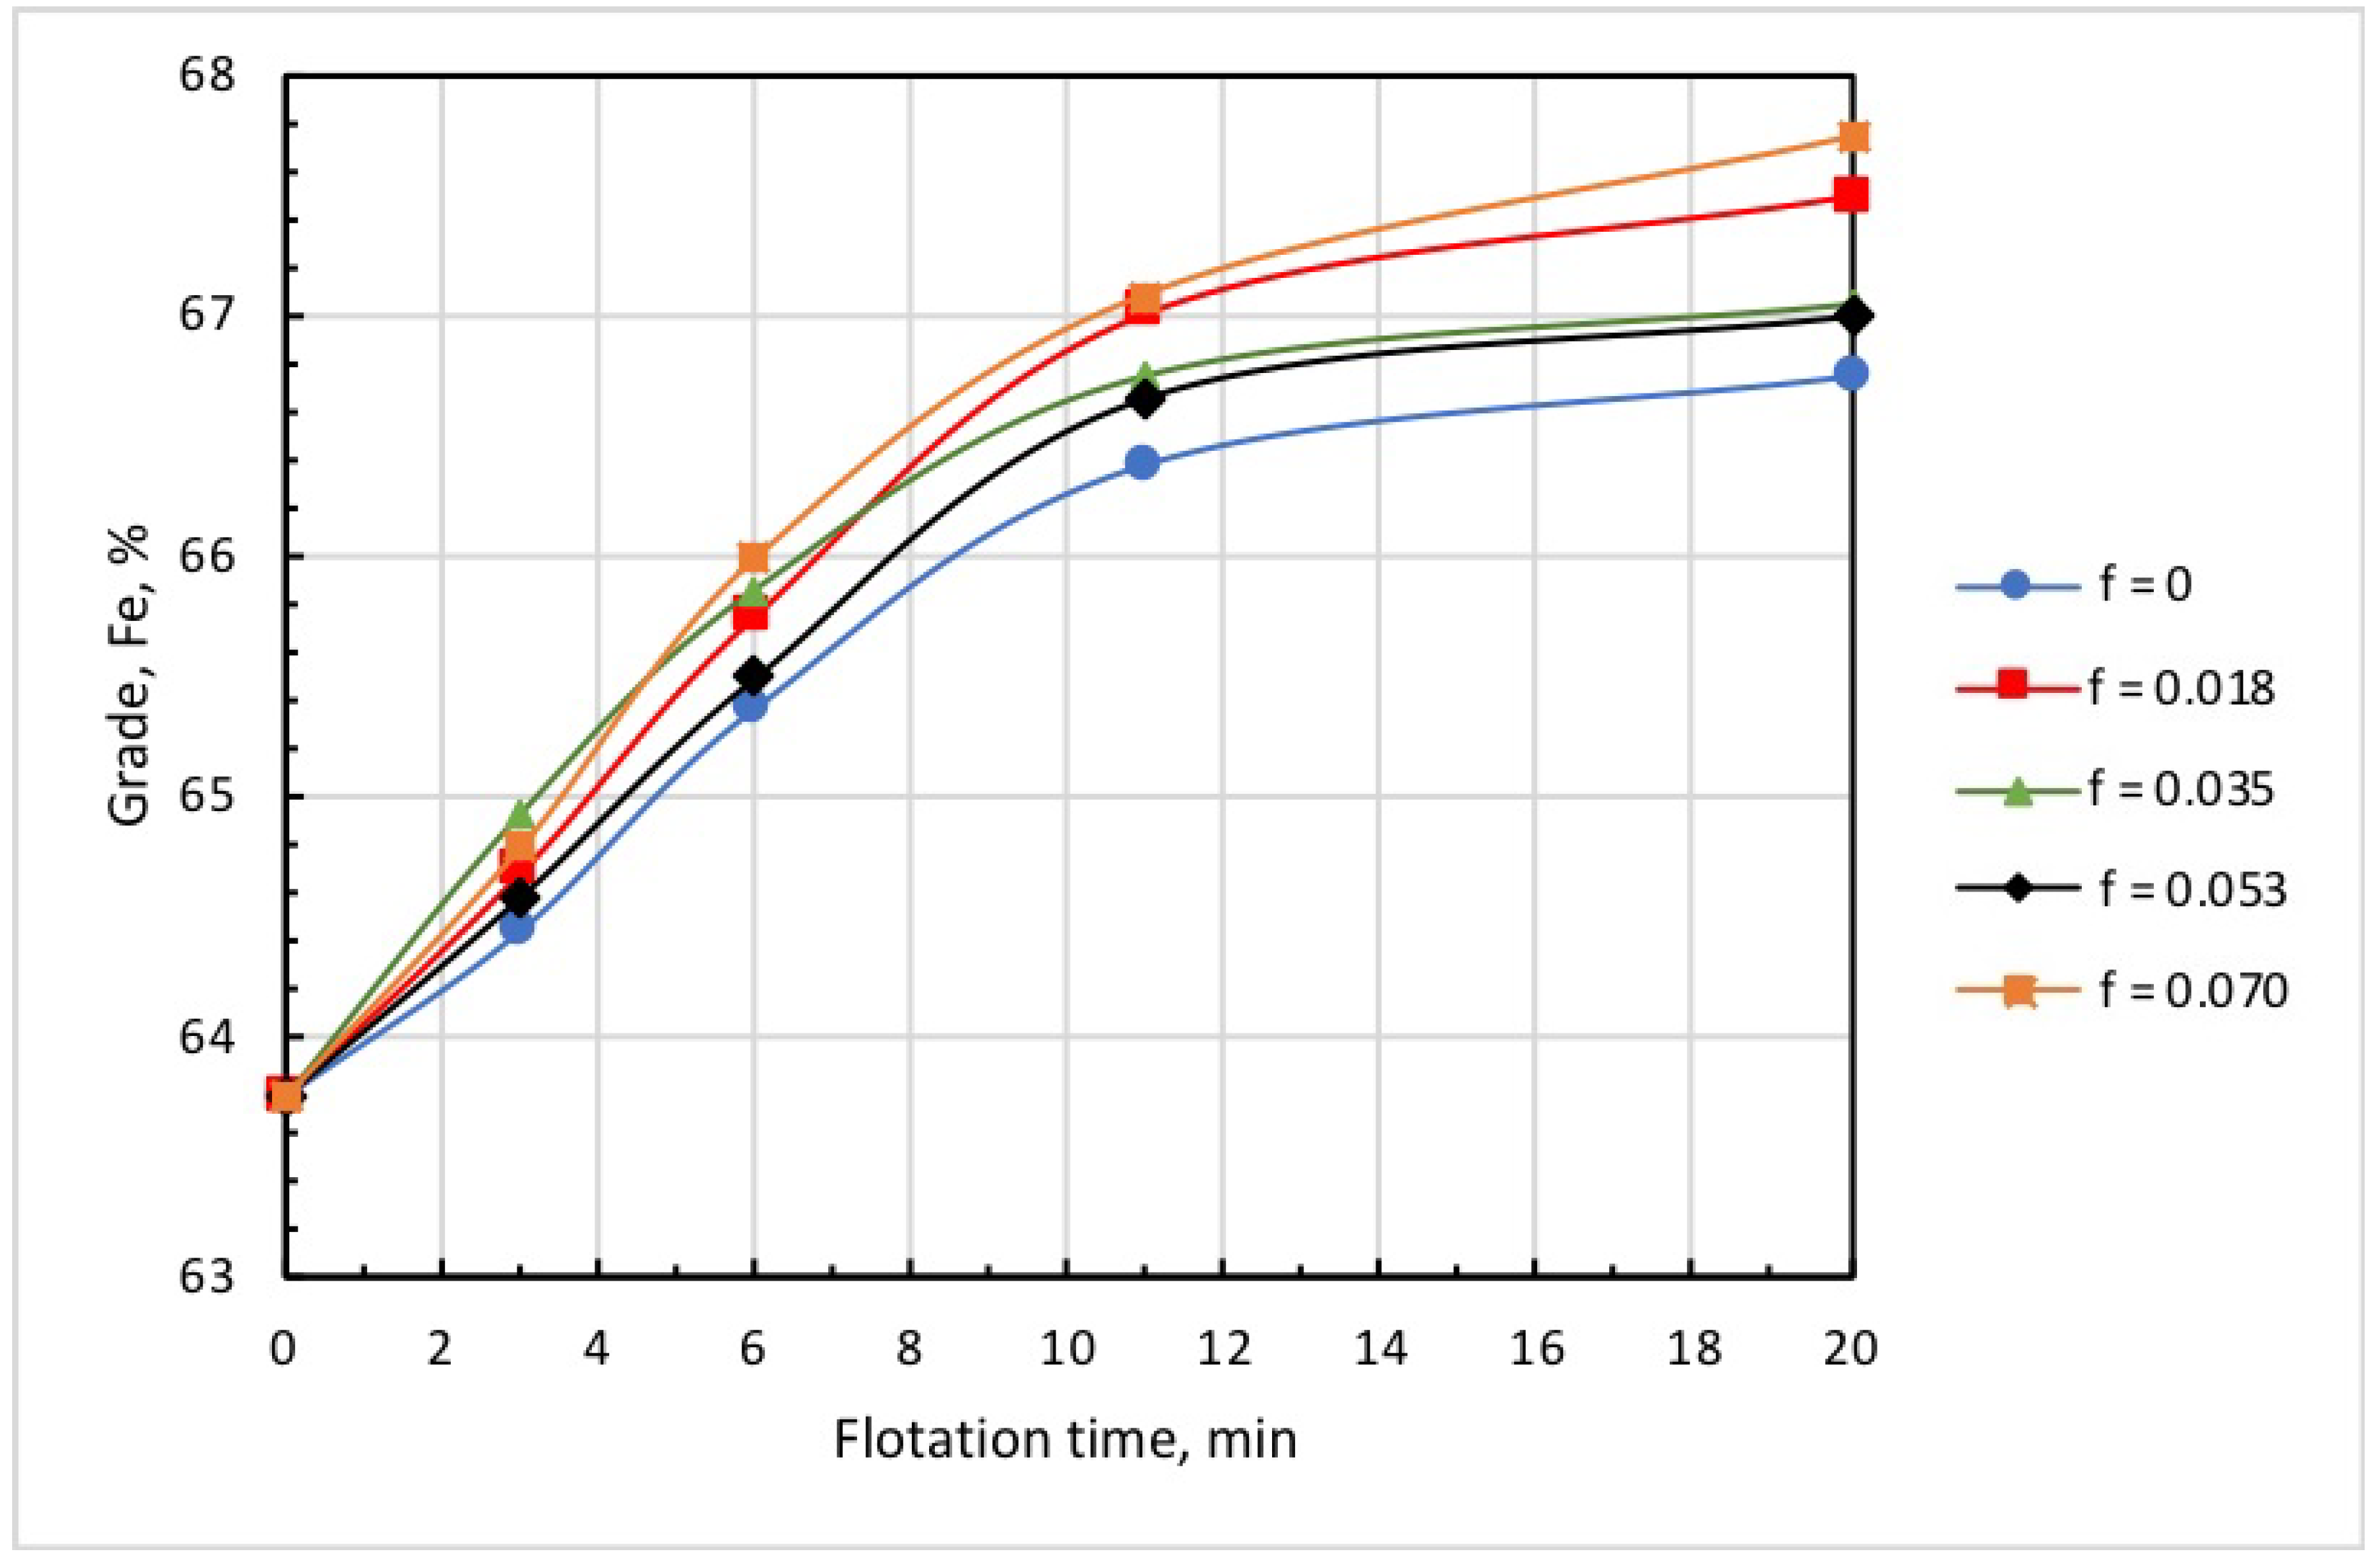
Figure 8 and Figure 9 show the kinetics of iron recovery and concentrate grade at an airflow rate of 0.18 L/min, collector dose of 20 g/t, and microbubble dose varying in the range of 0 to 0.070 mL/g. These findings demonstrate that the increase in microbubble dose consistently resulted in an increase in concentrate grade and in a decrease in iron recovery.
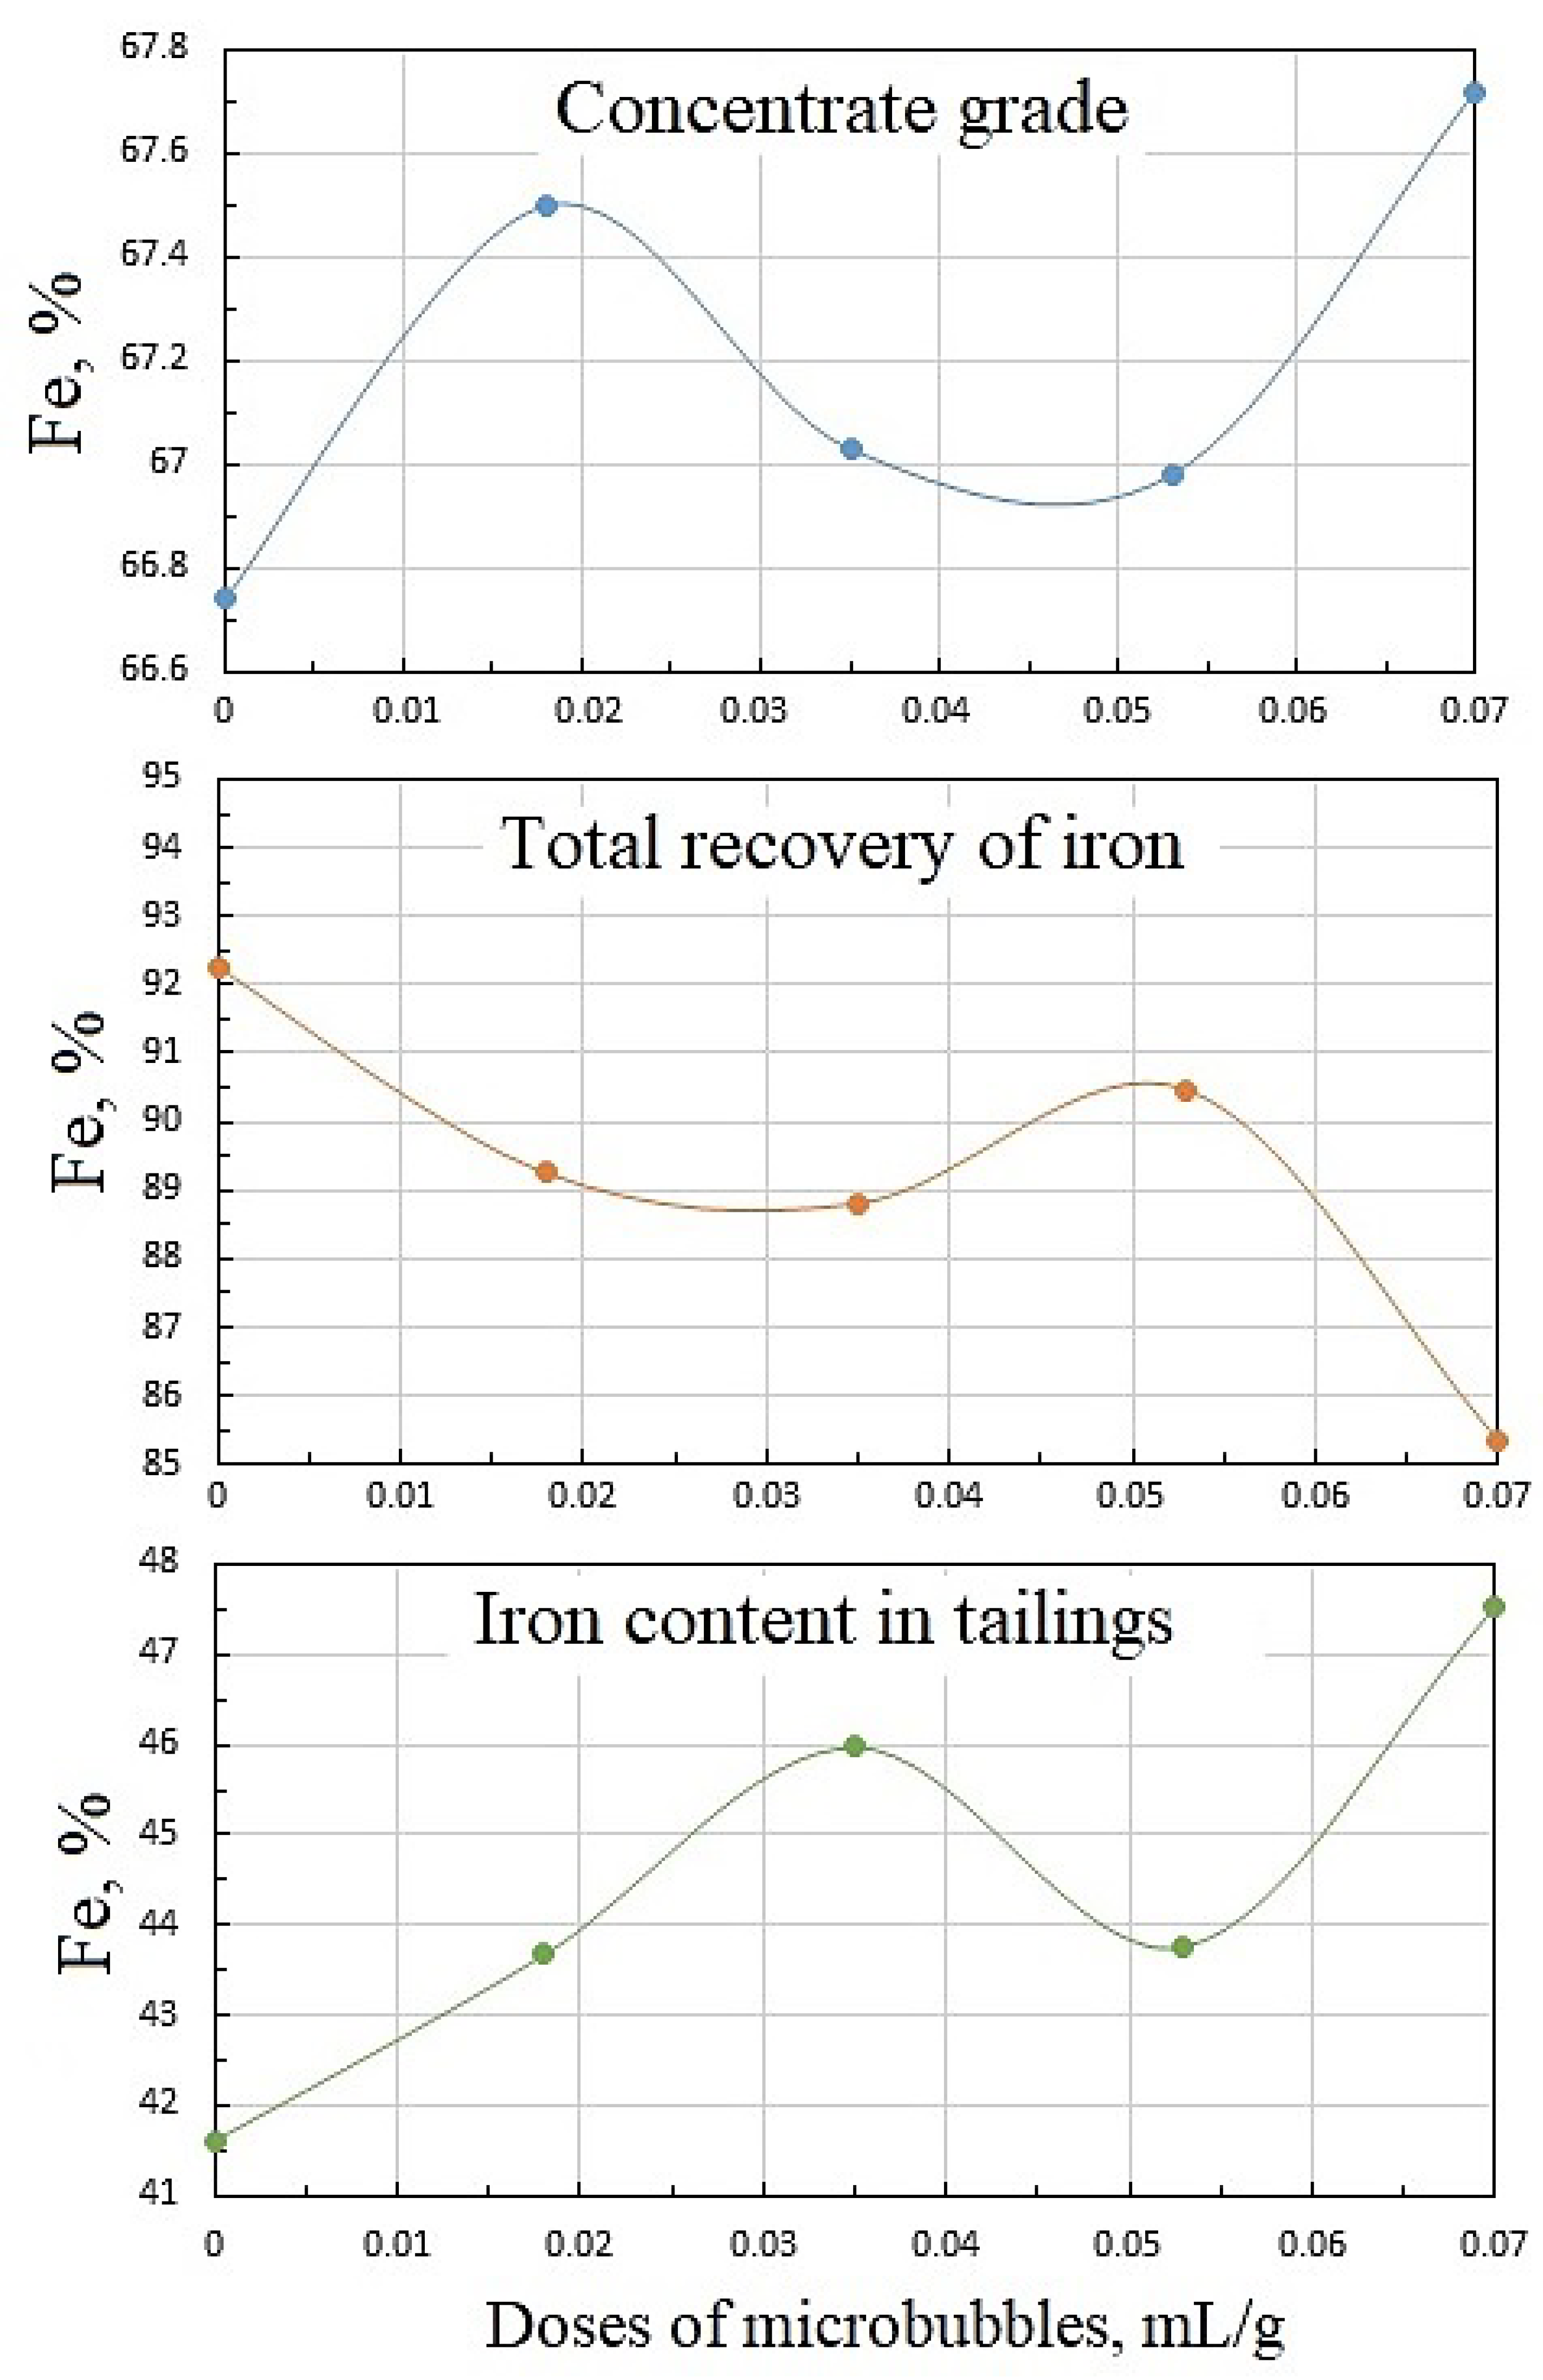
Figure 10 shows the dependencies of concentrate grade, iron recovery, and iron percentage in the tailings on microbubble dose, and whence it follows that these functions were not monotonous. The latter can be attributed to the complex pattern of microbubble effects on the flotation of both Ballotini and magnetite. Data in Table 2 reveal that the increase in microbubble dose from 0 to 0.07 mL/g brought about roughly a twofold increase in both iron entrainment into the froth, and iron-flotation report. This was essentially induced by the kinetics of water recovery and, correspondingly, magnetite entrainment into the froth product. As it follows from Figure 11, the kinetic graphs of water recovery were not positioned in the stacked relationship with the increased dose of microbubbles. Consequently, the kinetics of magnetite entrainment would have a similar dependence pattern on microbubble dose.
Data in Table 2 show that a sufficiently high concentrate grade and iron recovery were achieved at the relatively small microbubble dose of = 0.018 mL/g. In practical terms, this had a positive effect, as the need to generate large amounts of microbubbles may impede to a certain extent the industrial implementations of combined microflotation.
3.3. Dependencies of Iron Recovery and Concentrate Grade on Timing the Introduction of Collector and Microbubble Dose
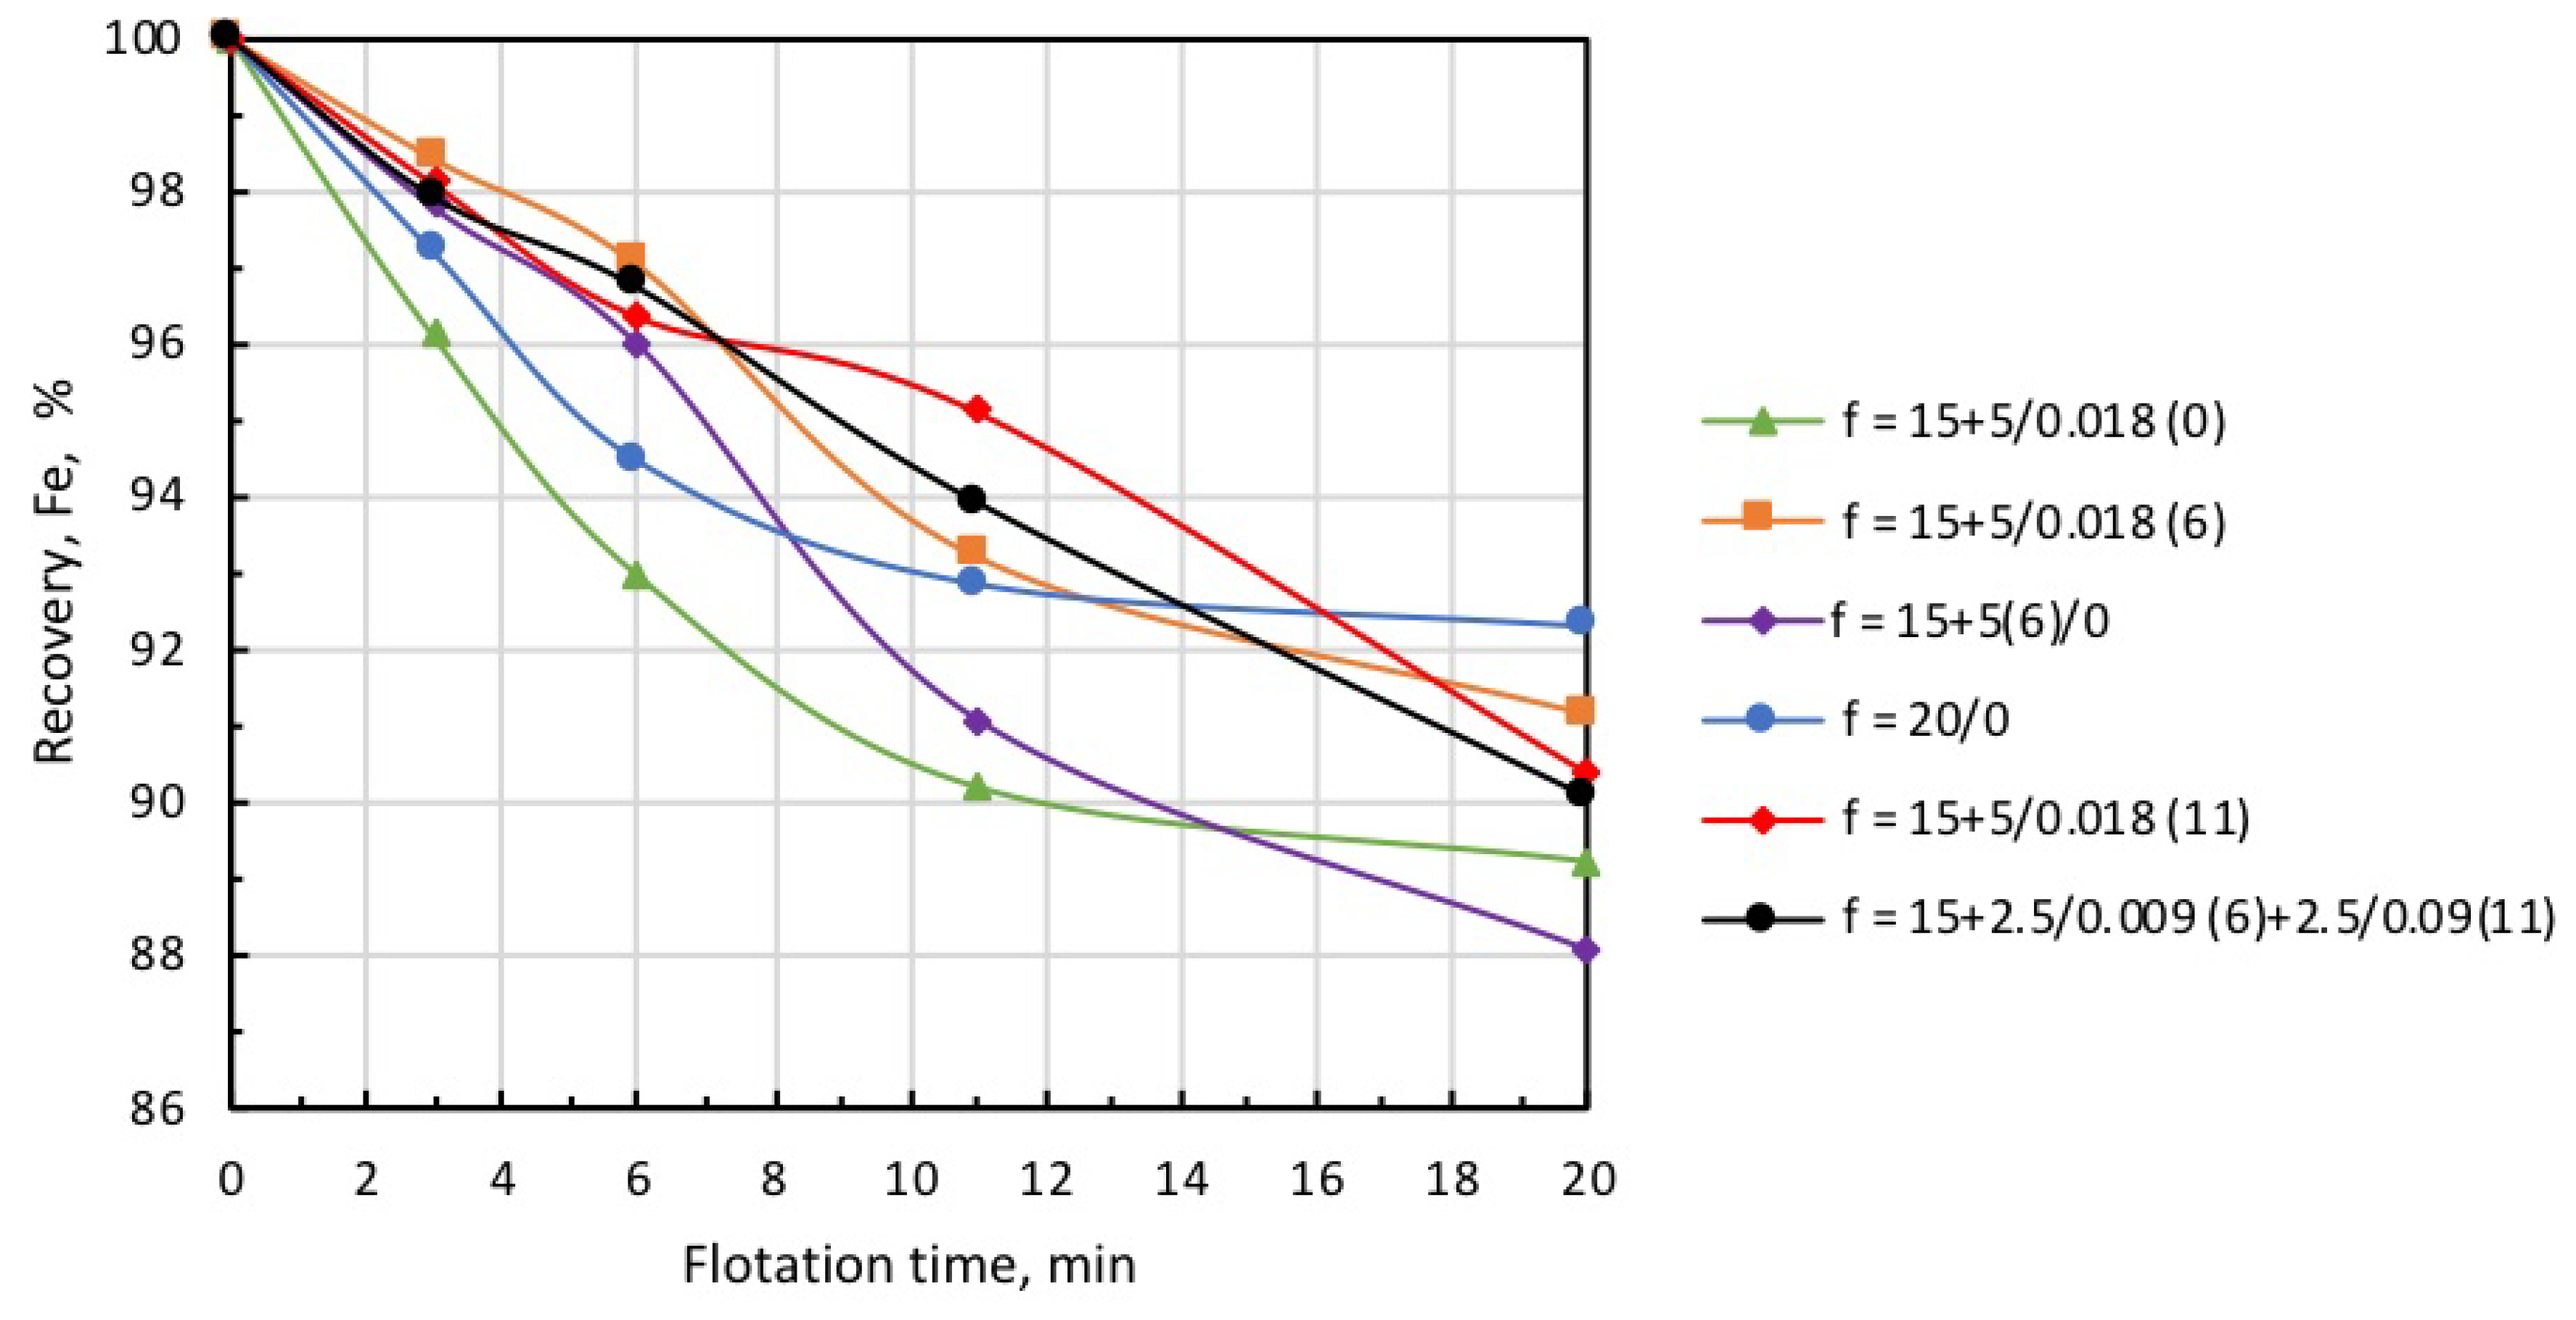
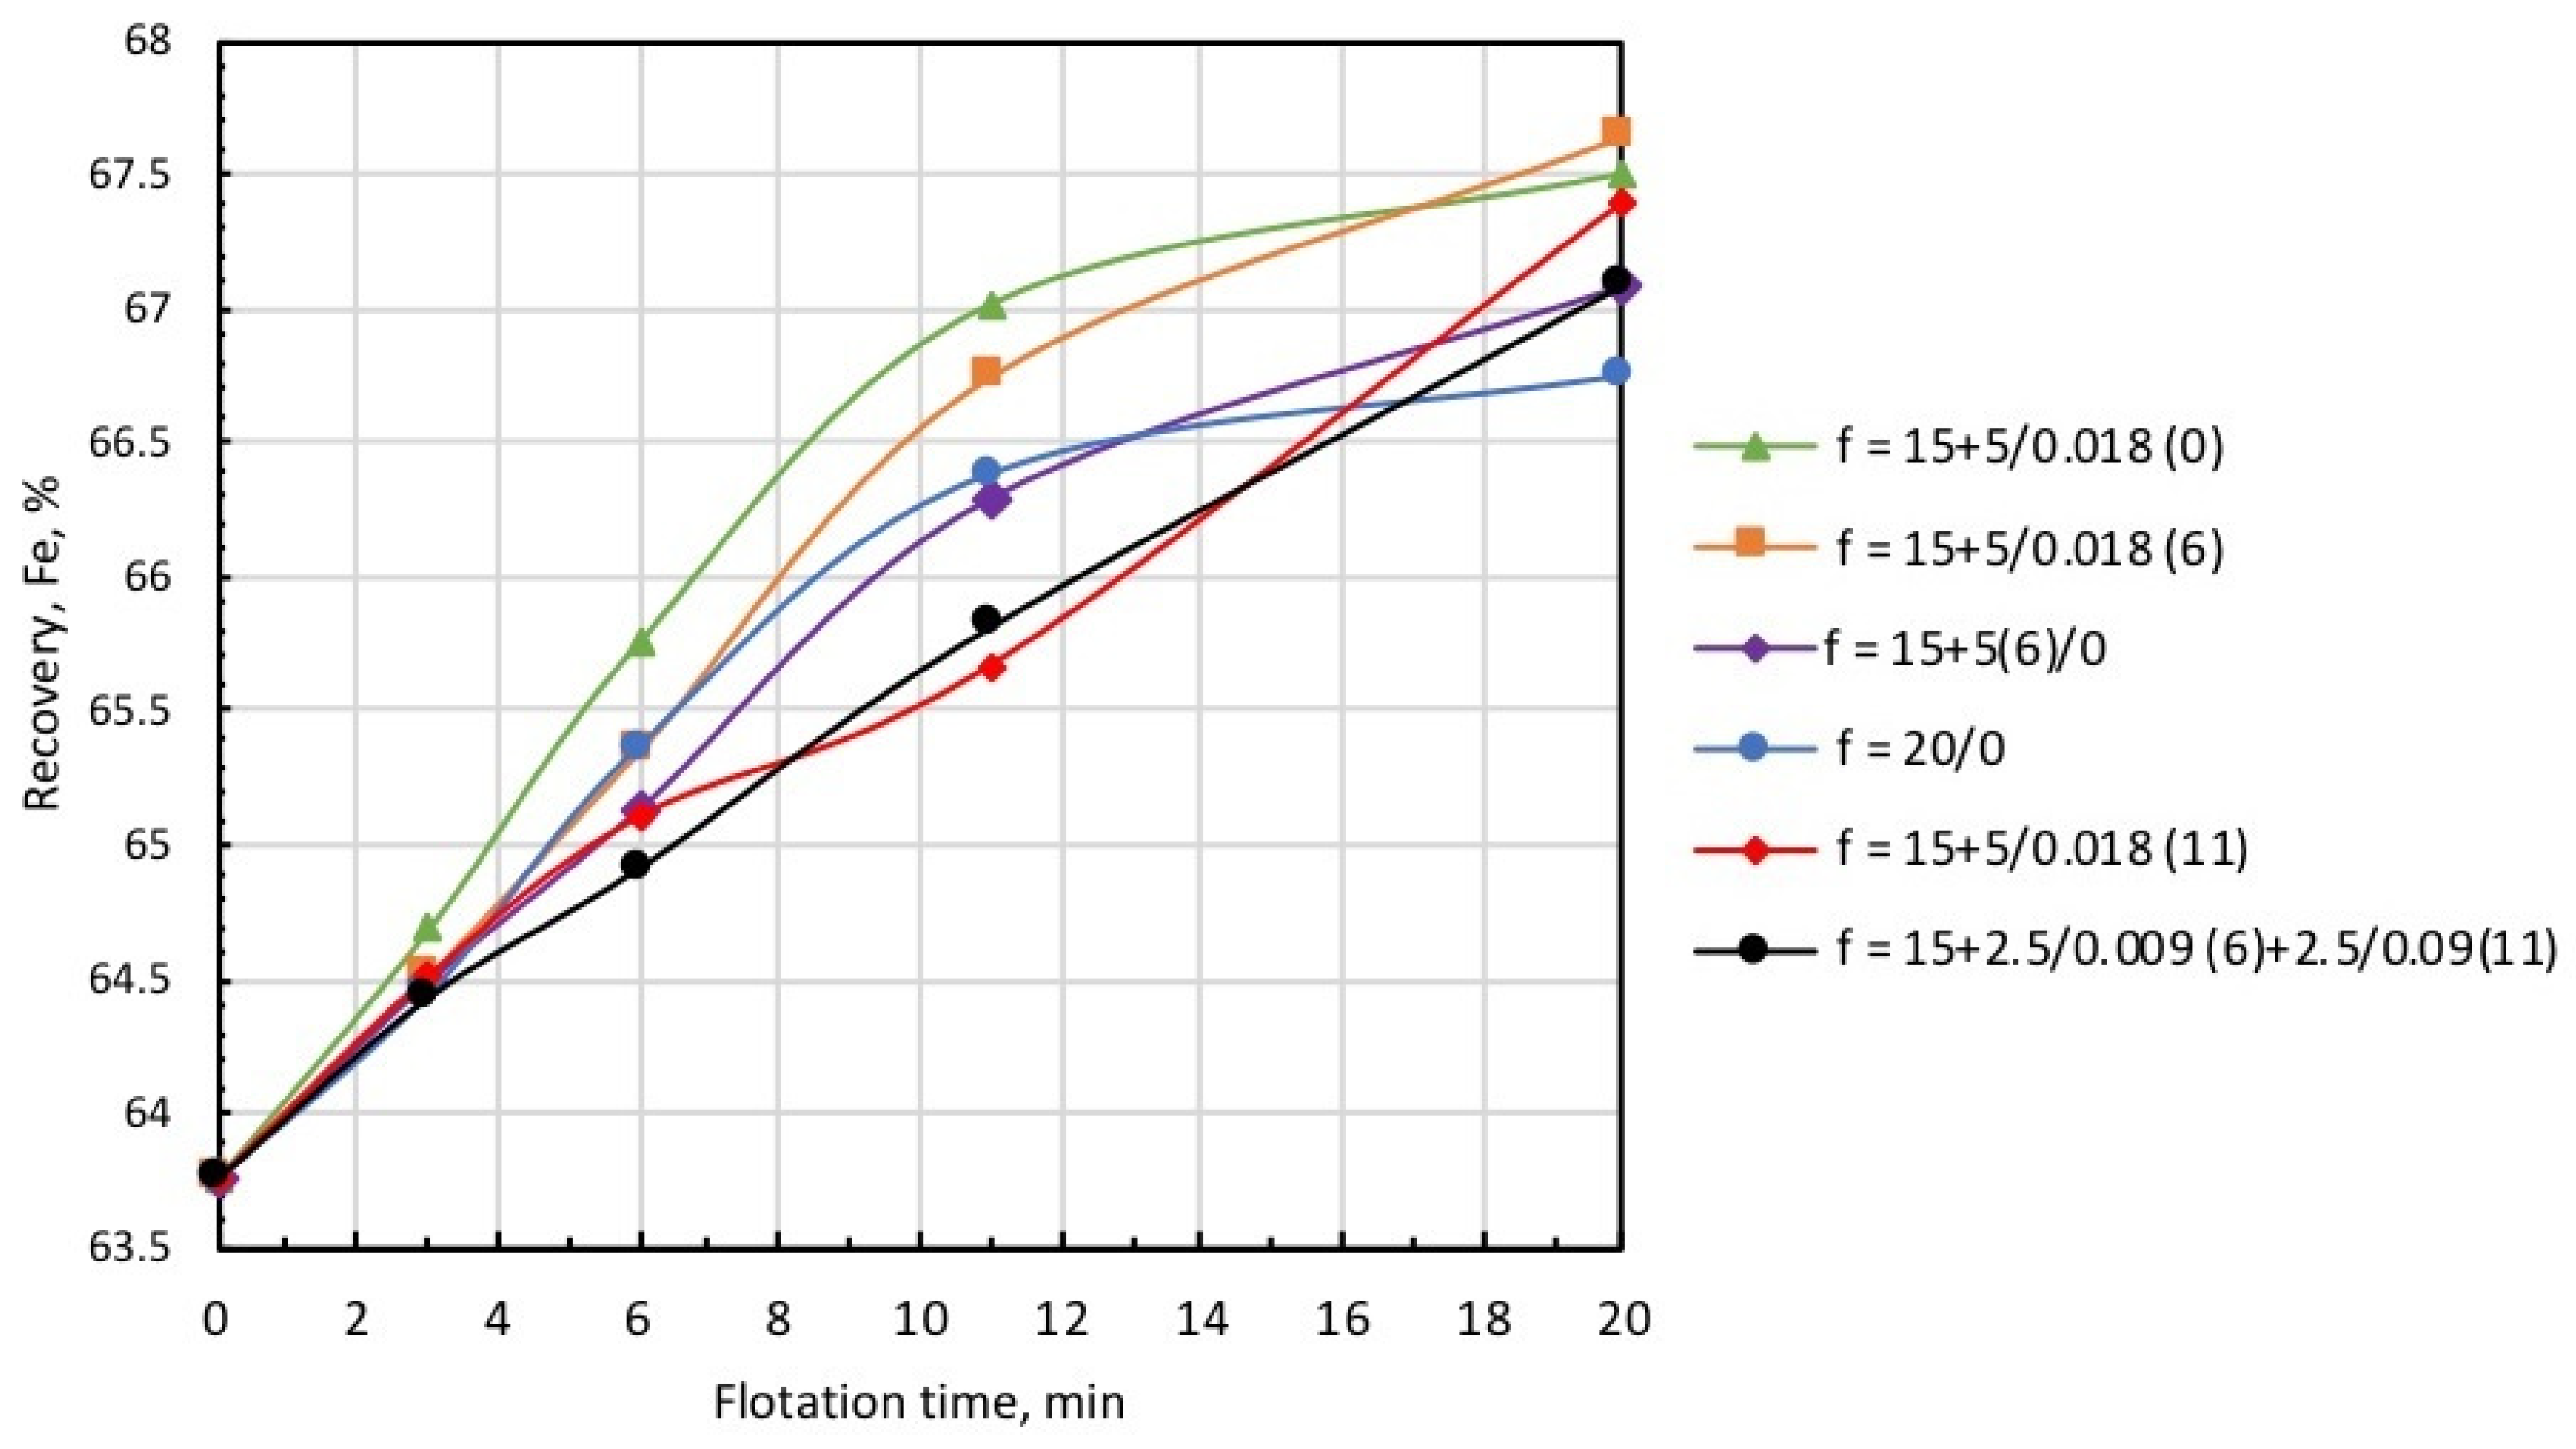
Considering that a collector also serves as a frother at many beneficiation facilities, it is often supplied in split fractions added at various sections of the flotation circuit. The intention is to decrease iron entrainment in the froth product, which is considered as tailings in reverse cationic flotation. As the collector for silicate minerals is used as a frother for microbubble generation, a single introduction of the total dose of microbubbles and the collector may lead to increased iron entrainment into the froth product, as was the case in the test runs discussed above. The introduction of the total dose of microbubbles directly before flotation resulted in greater froth density, which caused the essential entrainment of iron into the froth product. Figure 12 and Figure 13 show the kinetic dependencies of recovery and concentrate grade on different introduction methods of the microbubbles and collector. In all tests, microbubble dose was the same (0.018 mL/g), and the total amount of collector supplied into the pulp was established on the basis of the collector consumption of 5 g/t.
Data presented in Figure 12 and Figure 13, and Table 3 demonstrate that the highest recovery was observed in microbubble-free tests, but in this case, the concentrate was of the poorest quality (Column 1). In the case when the introduction of the collector dose was distributed in time, i.e., 15 g/t was supplied before flotation, and 5 g/t was added on the 6th minute of flotation (microbubble-free mode), concentrate quality slightly increased, but recovery significantly dropped (see Column 2).
This was also accompanied by a substantial growth in iron-flotation report and entrainment into the froth product. Significant improvements in iron recovery and concentrate grade were registered when the collector dose of 15 g/t was directly introduced into the pulp before flotation, and an additional 5 g/t was fed in combination with the microbubbles (see Column 3 in Table 3). The best results in terms of recovery/grade balance were achieved when the collector dose of 15 g/t was directly introduced into the pulp before the start of flotation, and 5 g/t with the microbubbles at the 6th minute of flotation (see Column 4). Table 3 also demonstrates (Columns 5 and 6) that the introduction of microbubbles at the 11th minute of flotation or in equal portions in the 6th and 11th minutes resulted in some deterioration of both recovery and concentrate grade. Thus, the combined microflotation of magnetite from the mixture with Ballotini produced the best results in treatment mode when the collector dose of 15 g/t was introduced into the pulp before flotation, and the dose of 5 g/t with microbubbles (0.018 mL/g) in about 1/3 of the total flotation period. The most likely reason for this effect is that magnetite flotation is more efficient for the higher concentration of a collector. We also have to consider that magnetite particles competed with Ballotini for attachment onto the microbubble surface. If microbubbles were introduced before flotation at a moment when collector concentration was the highest, the actual flotation of magnetite into tailings was significant (see Column 3, Table 3) due to flotation by the coarse and fine bubbles. When microbubbles were introduced at some later moment when collector concentration significantly dropped, the flotation of magnetite particles decreased, thus creating favorable conditions for the flotation of Ballotini particles. In the test on the separate flotation of magnetite and Ballotini with microbubbles and in microbubble-free mode, it was found that the flotation efficiency of magnetite responded better to collector concentration, whereas the flotation of Ballotini was more sensitive to microbubble concentration.
4. Conclusions
The efficiency of the reverse combined microflotation of magnetite from the mixture with glass beads with the use of commercial cationic collector Lilaflot 821M essentially depends on collector dose, microbubble dose, and on the mode of their introduction into the pulp. An overincrease in collector dose (in excess of 20 g/t) entailed unjustified iron loss in flotation tailing. The utilization of microbubbles is an efficient method to improve concentrate quality (up to 67.63% Fe) with high iron recovery (91.16%). The most effective mode of treatment entailed the introduction of some portion of the collector (15 g/t) into pulp before starting the flotation, and adding the rest of the collector (5 g/t) with microbubble dispersion (0.018 mL/g) at the 6th minute of flotation.
Author Contributions
Conceptualization, N.N.R. and L.O.F.; methodology, N.N.R. and L.O.F.; validation, N.N.R., formal analysis, N.N.R., D.Y.S. and V.V.L.; investigation, D.Y.S. and V.V.L.; data curation, D.Y.S.; funding acquisition, N.N.R. and L.O.F.; writing—original-draft preparation, N.N.R.; writing—review and editing, L.O.F. All authors have read and agreed to the published version of the manuscript.
Funding
This research and APC were funded by European Union’s Horizon 2020, grant number 821265.
Conflicts of Interest
The authors declare no conflict of interest.
References
- Holmes, R.J.; Lu, L. Introduction: Overview of the global iron ore industry. In Iron Ore: Mineralogy, Processing and Environmental Sustainability; Liming, L., Ed.; Woodhead Publishing: Cambridge, UK, 2015; pp. 1–42. [Google Scholar] [CrossRef]
- Ma, M. Froth Flotation of Iron Ores. Int. J. Min. Eng. Miner. Process. 2012, 1, 56–61. [Google Scholar] [CrossRef]
- Zhang, X.; Gu, X.; Han, Y.; Parra-Álvarez, N.; Claremboux, V.; Kawatra, S.K. Flotation of Iron Ores: A Review. Miner. Process. Extr. Met. Rev. 2019, 1–29. [Google Scholar] [CrossRef]
- Clemmer, J.B. Flotation of iron ore. In Proceedings of the 8th Annual Mining Symposium, Duluth, MN, USA, 15 January 1947. [Google Scholar]
- Filippov, L.; Severov, V.V.; Filippova, I.V. An overview of the beneficiation of iron ores via reverse cationic flotation. Int. J. Miner. Process. 2014, 127, 62–69. [Google Scholar] [CrossRef]
- Filippov, L.; Filippova, I.; Severov, V. The use of collectors mixture in the reverse cationic flotation of magnetite ore: The role of Fe-bearing silicates. Miner. Eng. 2010, 23, 91–98. [Google Scholar] [CrossRef]
- Iwasaki, I. Iron ore flotation, theory and practice. Min. Eng. 1983, 35, 622–631. [Google Scholar]
- Filippov, L.O.; Severov, V.V.; Filippova, I.V. Mechanism of starch adsorption on Fe–Mg–Al-bearing amphiboles. Int. J. Miner. Process. 2013, 123, 120–128. [Google Scholar] [CrossRef]
- Peres, A.; Correa, M. Depression of iron oxides with corn starches. Miner. Eng. 1996, 9, 1227–1234. [Google Scholar] [CrossRef]
- Papini, R.M.; Brandão, P.R.G.; Peres, A.E.C. Cationic flotation of iron ores: Amine characterization and performance. Min. Met. Explor. 2001, 18, 5–9. [Google Scholar] [CrossRef]
- Farrokhpay, S.; Filippov, L.; Fornasiero, D. Flotation of Fine Particles: A Review. Miner. Process. Extr. Met. Rev. 2020, 1–11. [Google Scholar] [CrossRef]
- Fornasiero, D.; Filippov, L. Innovations in the flotation of fine and coarse particles. J. Phys. Conf. Ser. 2017, 879, 012002. [Google Scholar] [CrossRef] [Green Version]
- Rulyov, N.N. Combined microflotation of fine minerals: Theory and experiment. Miner. Process. Extr. Met. 2016, 125, 1–5. [Google Scholar] [CrossRef]
- Rulyov, N.N.; Tussupbayev, N.K.; Kravtchenko, O.V. Combined Microflotation of Fine Quartz, Mineral Processing and Extractive Metallurgy. Trans. Inst. Min. Metall. C 2015, 124, 217–223. [Google Scholar]
- Farrokhpay, S.; Filippova, I.; Filippov, L.; Picarra, A.; Rulyov, N.; Fornasiero, D. Flotation of fine particles in the presence of combined microbubbles and conventional bubbles. Miner. Eng. 2020, 155, 106439. [Google Scholar] [CrossRef]
- Nickolaj, R. Fine Iron Ore Beneficiation by Combine Reverse Microflotation. In Proceedings of the 16th International Mineral Processing Symposium (IMPS 2018), Antalya, Turkey, 23–25 October 2018; pp. 254–259. [Google Scholar]
- Rulyov, N.; Nessipbay, T.; Dulatbek, T.; Larissa, S.; Zhamikhan, K. Effect of microbubbles as flotation carriers on fine sulphide ore beneficiation. Miner. Process. Extr. Met. 2017, 127, 133–139. [Google Scholar] [CrossRef]
- Tussupbayev, N.K.; Rulyov, N.; Kravtchenco, O.V. Microbubble augmented flotation of ultrafine chalcopyrite from quartz mixtures. Miner. Process. Extr. Met. 2016, 125, 5–9. [Google Scholar] [CrossRef]
- Rulyov, N.; Filippov, L.; Kravchenko, O. Combined microflotation of glass beads. Colloids Surf. A Physicochem. Eng. Asp. 2020, 598, 124810. [Google Scholar] [CrossRef]
- Albino, K.I.P.; Toledo, D.B.; Lima, O.A. New etheramine based collector for the reverse flotation of iron ore effective on the overfrothing prevention. XXVII Encontro Nacional de Tratamento de Minérios e Metalurgia Extrativa Belém-PA, 23 a 27 de Outubro de 2017. Available online: https://www.researchgate.net/publication/321198348 (accessed on 23 October 2017).
- Hoang, H.D.; Heitkam, S.; Kupka, N.; Hassanzadeh, A.; Peuker, U.A.; Rudolph, M. Froth properties and entrainment in lab-scale flotation: A case of carbonaceous sedimentary phosphate ore. Chem. Eng. Res. Des. 2019, 142, 100–110. [Google Scholar] [CrossRef]
Figure 1.
Micrograph of magnetite (black objects) and Ballotini (light balls) particle mixture.

Figure 2.
Numerical Fn and mass Fm cumulative distribution functions of Ballotini.

Figure 3.
Laboratory rig designed for studying combined microflotation processes: (1) frother solution; (2) air-in-water microdispersion generator MBGen-0.012; (3) dispergator head; (4) pipe for supplying air-in-water microdispersion into flotation cell; (5) thyristor revolution per minute controller for impeller; (6) airflow meter; (7) flotation cell; (8) pipe for air supply into flotation cell; (9) peristaltic air-dosing pump.

Figure 4.
Micrograph of microbubbles produced by MBGen-0.012 air-in-water microdispersion generator in Lilaflot 821M solution of 0.5 g/L.
Figure 4.
Micrograph of microbubbles produced by MBGen-0.012 air-in-water microdispersion generator in Lilaflot 821M solution of 0.5 g/L.

Figure 5.
Numerical Fn and volume Fv cumulative distribution functions of microbubbles.

Figure 6.
Kinetics of iron recovery at different doses of Lilaflot 821M collector. Airflow rate, 0.3 L/min.
Figure 6.
Kinetics of iron recovery at different doses of Lilaflot 821M collector. Airflow rate, 0.3 L/min.

Figure 7.
Kinetics of concentrate-grade increment at varied doses of Lilaflot 821M collector. Air flow rate, 0.3 L/min.
Figure 7.
Kinetics of concentrate-grade increment at varied doses of Lilaflot 821M collector. Air flow rate, 0.3 L/min.

Figure 8.
Kinetics of iron recovery at different doses of microbubbles (mL/g) introduced before flotation start: collector dose, 20 g/t; airflow rate, 0.18 L/min.
Figure 8.
Kinetics of iron recovery at different doses of microbubbles (mL/g) introduced before flotation start: collector dose, 20 g/t; airflow rate, 0.18 L/min.

Figure 9.
Kinetics of concentrate grade at different doses of microbubbles (mL/g) introduced before flotation start: collector dose, 20 g/t; airflow rate, 0.18 L/min.
Figure 9.
Kinetics of concentrate grade at different doses of microbubbles (mL/g) introduced before flotation start: collector dose, 20 g/t; airflow rate, 0.18 L/min.

Figure 10.
Dependencies of concentrate grade, iron recovery, and iron content in tailings on microbubble doses supplied before flotation start: collector dose, 20 g/t; airflow rate, 0.18 L/min.
Figure 10.
Dependencies of concentrate grade, iron recovery, and iron content in tailings on microbubble doses supplied before flotation start: collector dose, 20 g/t; airflow rate, 0.18 L/min.

Figure 11.
Kinetics of water recovery at different doses of microbubbles (mL/g).

Figure 12.
Iron recovery into concentrate at different modes of collector and microbubble introduction (symbols are explained in Table 3).
Figure 12.
Iron recovery into concentrate at different modes of collector and microbubble introduction (symbols are explained in Table 3).

Figure 13.
Concentrate grade at different modes of collector and microbubble introduction (symbols are explained in Table 3).
Figure 13.
Concentrate grade at different modes of collector and microbubble introduction (symbols are explained in Table 3).


Table 1.
Flotation of Magnetite/Ballotini mixture without microbubbles. Flotation time, 10 min. Airflow rate, 0.3 L/min.
Table 1.
Flotation of Magnetite/Ballotini mixture without microbubbles. Flotation time, 10 min. Airflow rate, 0.3 L/min.
| Collector Dose, g/t | 20 | 40 | 100 |
|---|---|---|---|
| Concentrate grade, Fe, % | 66.44 | 69.86 | 71.73 |
| Total recovery of iron, % | 85.99 | 51.50 | 12.04 |
| Iron content in tailings, % | 50.62 | 58.34 | 62.80 |
| Iron flotation recovery into froth, % | 7.48 | 40.70 | 75.63 |
| Iron entrainment into froth, % | 6.53 | 7.80 | 12.33 |
Table 2.
Flotation of Magnetite/Ballotini mixture at varied microbubble doses *.
| Column No. | 1 | 2 | 3 | 4 | 5 |
|---|---|---|---|---|---|
| Microbubble dose, mL/g | 0 | 0.018 | 0.035 | 0.053 | 0.07 |
| Concentrate grade, Fe, % | 66.74 | 67.5 | 67.03 | 66.98 | 67.72 |
| Total recovery of iron, % | 92.26 | 89.25 | 88.81 | 90.47 | 85.36 |
| Iron content in tailings, % | 41.61 | 43.67 | 45.97 | 43.76 | 47.52 |
| Flotation report of iron into froth, % | 6.37 | 8.62 | 8.86 | 7.61 | 12.29 |
| Iron entrainment into froth, % | 1.37 | 2.13 | 2.33 | 1.92 | 2.35 |
* Flotation time, 20 min. Total collector dose, 20 g/t. Microbubbles added before flotation start. Airflow rate, 0.18 L/min.
Table 3.
Flotation of magnetite/Ballotini mixture at different modes of collector and microbubble introduction. Total dose of collector, 20 g/t. Airflow rate, 0.18 L/min. Flotation time, 20 min.
Table 3.
Flotation of magnetite/Ballotini mixture at different modes of collector and microbubble introduction. Total dose of collector, 20 g/t. Airflow rate, 0.18 L/min. Flotation time, 20 min.
| Column No. | 1 | 2 | 3 | 4 | 5 | 6 |
|---|---|---|---|---|---|---|
| Timing (min) of collector (g/t) and microbubble (mL/g) introduction | 20 + [0/0(0)] | 15 + 5(6)/[0/0(0)] | 15 + [5/0.018(0)] | 15 + [5/0.018(6)] | 15 + [5/0.018(11)] | 15 + [2.5/0.009(6)] + [2.5/0.009(11)] |
| Concentrate grade, Fe, % | 66.74 | 67.07 | 67.50 | 67.63 | 67.38 | 67.08 |
| Total recovery of iron, % | 92.26 | 88.07 | 89.25 | 91.16 | 90.36 | 90.06 |
| Iron content in tailings, % | 41.61 | 46.73 | 43.67 | 40.07 | 42.4 | 44.02 |
| Iron flotation report into froth, % | 6.37 | 8.62 | 8.57 | 6.51 | 6.87 | 5.94 |
| Iron entrainment, % | 1.37 | 3.31 | 2.18 | 2.33 | 3.82 | 4 |
Note: X1 + X2(t1)/[X3/Y1(t2)] + [X4/Y2(t3)]: X1, collector dose (g/t) fed directly into pulp before starting flotation; X2(t1), collector dose (g/t) in t1 min after starting flotation; X3 and X4, collector doses (g/t) fed into pulp with microbubbles in t2 and t3 min, respectively, after starting flotation; Y1(t2) and Y2(t3) microbubble doses (mL/g), fed into pulp in t2 and t3 min after starting flotation.
Publisher’s Note: MDPI stays neutral with regard to jurisdictional claims in published maps and institutional affiliations. |
© 2020 by the authors. Licensee MDPI, Basel, Switzerland. This article is an open access article distributed under the terms and conditions of the Creative Commons Attribution (CC BY) license (http://creativecommons.org/licenses/by/4.0/).
Share and Cite
MDPI and ACS Style
Rulyov, N.N.; Filippov, L.O.; Sadovskyi, D.Y.; Lukianova, V.V. Reverse Combined Microflotation of Fine Magnetite from a Mixture with Glass Beads. Minerals 2020, 10, 1078. https://doi.org/10.3390/min10121078
AMA Style
Rulyov NN, Filippov LO, Sadovskyi DY, Lukianova VV. Reverse Combined Microflotation of Fine Magnetite from a Mixture with Glass Beads. Minerals. 2020; 10(12):1078. https://doi.org/10.3390/min10121078
Chicago/Turabian StyleRulyov, Nickolaj N., Lev O. Filippov, Dmytro Y. Sadovskyi, and Vitalina V. Lukianova. 2020. "Reverse Combined Microflotation of Fine Magnetite from a Mixture with Glass Beads" Minerals 10, no. 12: 1078. https://doi.org/10.3390/min10121078
Note that from the first issue of 2016, this journal uses article numbers instead of page numbers. See further details here.