Flow Stress Curve Modification and Constitutive Model of 20CrMoA Steel during Warm Deformation


1
College of Mechanical Engineering and Mechanics, Ningbo University, Ningbo 315211, China
2
Department of Mechanical Engineering, Zhejiang Business and Technology Institute, Ningbo 315012, China
*
Author to whom correspondence should be addressed.
Metals 2020, 10(12), 1602; https://doi.org/10.3390/met10121602
Submission received: 10 November 2020
/
Revised: 25 November 2020
/
Accepted: 26 November 2020
/
Published: 29 November 2020
(This article belongs to the Section Metal Casting, Forming and Heat Treatment)
Abstract
:The warm deformation behavior of 20CrMoA steel at the temperature of 873–1123 K and the strain rate of 0.01−10 s−1 was investigated to obtain its processing property and optimum processing parameters. The true stress-true strain curves showed that flow stress reaches the peak rapidly, followed by slow decrease till reaching a steady state. This suggests a flow softening of dynamic recovery. The stress dropped with increasing deformation temperature and decreasing strain rate. The reduction became more distinct at lower temperature and higher strain rate due to flow softening caused by deformation heat. In the temperature range of 873–973 K, the deformation of 20CrMoA steel was more sensitive to temperature, and the average decline rate of steady stress was 6.9 times larger than that in the temperature range of 1023–1123 K. After modifying the stress curves, a constitutive model was developed for different deformation temperature ranges based on modified curves. The model was in good agreement with the experimental results.
1. Introduction
Warm forming generally refers to plastic deformation at a temperature of 873–1123 K, which combines the advantages of cold forming and hot forming. Warm forming parts have high precision, small tendency of oxidation and decarburization, and good feasibility for automatic production due to good formability [1,2].
Warm forming has been studied on various carbon steels. Abdollah-Zadeh proposed that continuous dynamic recrystallization was responsible for the ferrite grain refinement during warm deformation of a low carbon Nb-microalloyed steel [3]. Behrang found that the volume fraction of the DRX regions increased and grain size decreased as the carbon content of the alloy increased [4]. Rahul suggested that the recrystallization texture of ultra-low carbon steel was developed and influenced by deformation temperature after complete recrystallization [5]. Storojeva studied the microstructure evolution mechanism of medium carbon steel and found that the spheroidization of pearlite was accelerated due to the heavy warm deformation and the homogeneity of the cementite distribution and grain size depend on the cooling rate and deformation temperature [6]. Those works mainly focus on forming process and mechanism of grain refinement [7]. Application of warm forming has been conducted in industry such as multi-stage steel forging [8], precise forging of bevel gears [9], parts of aluminum alloys [10,11], and warm extrusion [12]. Recently, some have taken a closer look at warm cross wedge rolling (WCWR) [13,14,15], and the influence of rolling temperature on WCWR was argued. Huang et al. [16] carried on comparative study of warm and hot cross-wedge rolling and proposed that it is indefinite whether the decrease of energy consumption for heating workpiece can compensate the increase of the torque during warm rolling. Bulzak et al. [17] suggested that over 80% of energy during warm and hot rolling was used to heat the billet, according to the comparative analysis of WCWR of ball pins at the rolling temperature 923 K, 1023 K, and 1273 K, which indicated that WCWR can save energy consumption. Huang investigated WCWR of 42CrMo at the ferrite region (rolling temperature of 923 K and 973 K) and did not give analysis of ferrite-austenite region. Bulzak analyzed WCWR of C45 steel at the ferrite region (923 K) and ferrite-austenite (1023 K), but the same constitutive equation and materials constants were applied at the different rolling temperature. Obviously, forming temperature is the focus on WCWR and directly determines the energy consumption during WCWR and the microstructure of products. Therefore, the appropriate constitutive model is the basis of simulation and application of WCWR. However, there are only a few studies regarding the constitutive model for warm forming. For example, Johnson-Cook model was employed to model the flow stress behavior of 20CrMnTiH from 873 K to 1123 K [18], in which stress error caused by deformation heat was not considered. The constitutive relationship of medium carbon steel was developed by the modified Arrhenius model based on Zener-Hollomon parameters at the deformation temperature varying from 823 K to 973 K [19], so it is only applicable to single-phase structure in low-temperature regions. The same method applied to 42CrMo steel as well [20]. Rastegari suggested that Arrhenius-type constitutive equation predicts the softening behavior of the dynamic spheroidization better than Johnson-Cook models and is more accurate [21].
The isothermal flow stress data are essential for the constitutive model [22,23]. When the strain rate is higher than a certain value, the actual temperature of the specimen may rise due to plastic deformation heat [24]. Therefore, it is necessary to modify the stress curves affected by deformation heat, especially under the forming conditions of low temperature and high strain rate. In addition, phase transformation is inevitable in warm forming, which will have a great influence on flow behavior. Therefore, the constitutive model of single-phase material does not apply to multi-phase materials [25].
In this study of WCWR, a low carbon and low alloy steel 20CrMoA was selected to investigate its warm deformation behavior by compression tests, which can establish a foundation for WCWR of shaft parts. It has high quenching ability, good machinability and cold strain plasticity [26]. This paper aims to analyze the influence of deformation temperature on the flow stress during warm deformation and determine proper process parameters. The sensitivity to various temperature ranges of the selected material was analyzed and the suitable forming temperature is suggested, then a constitutive model is developed based on modified flow stress and strain compensation. The validity and accuracy of results predicted by the proposed model is also investigated by comparing with the experimental curves.
2. Materials and Experimental Procedure
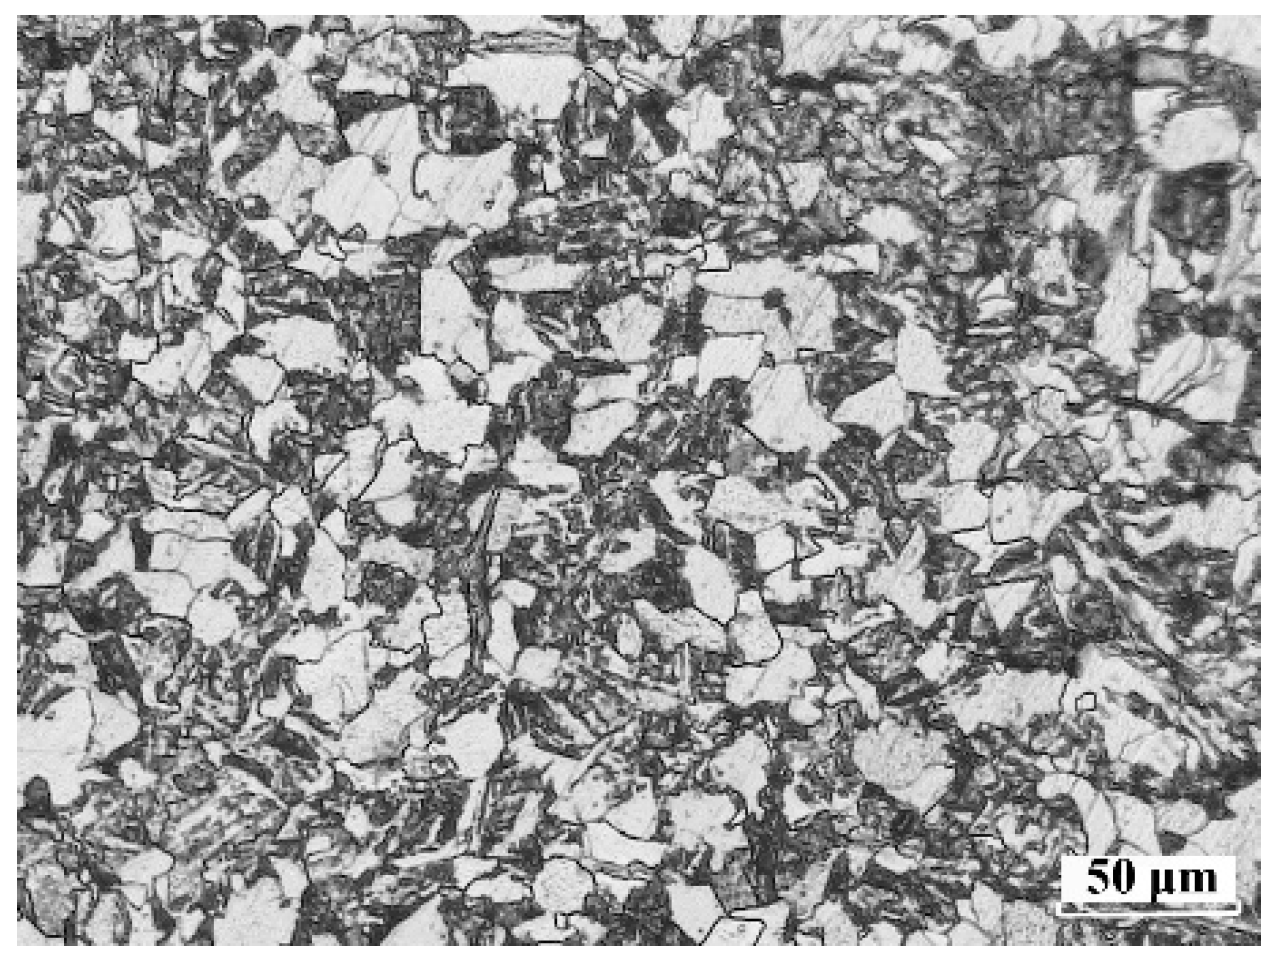
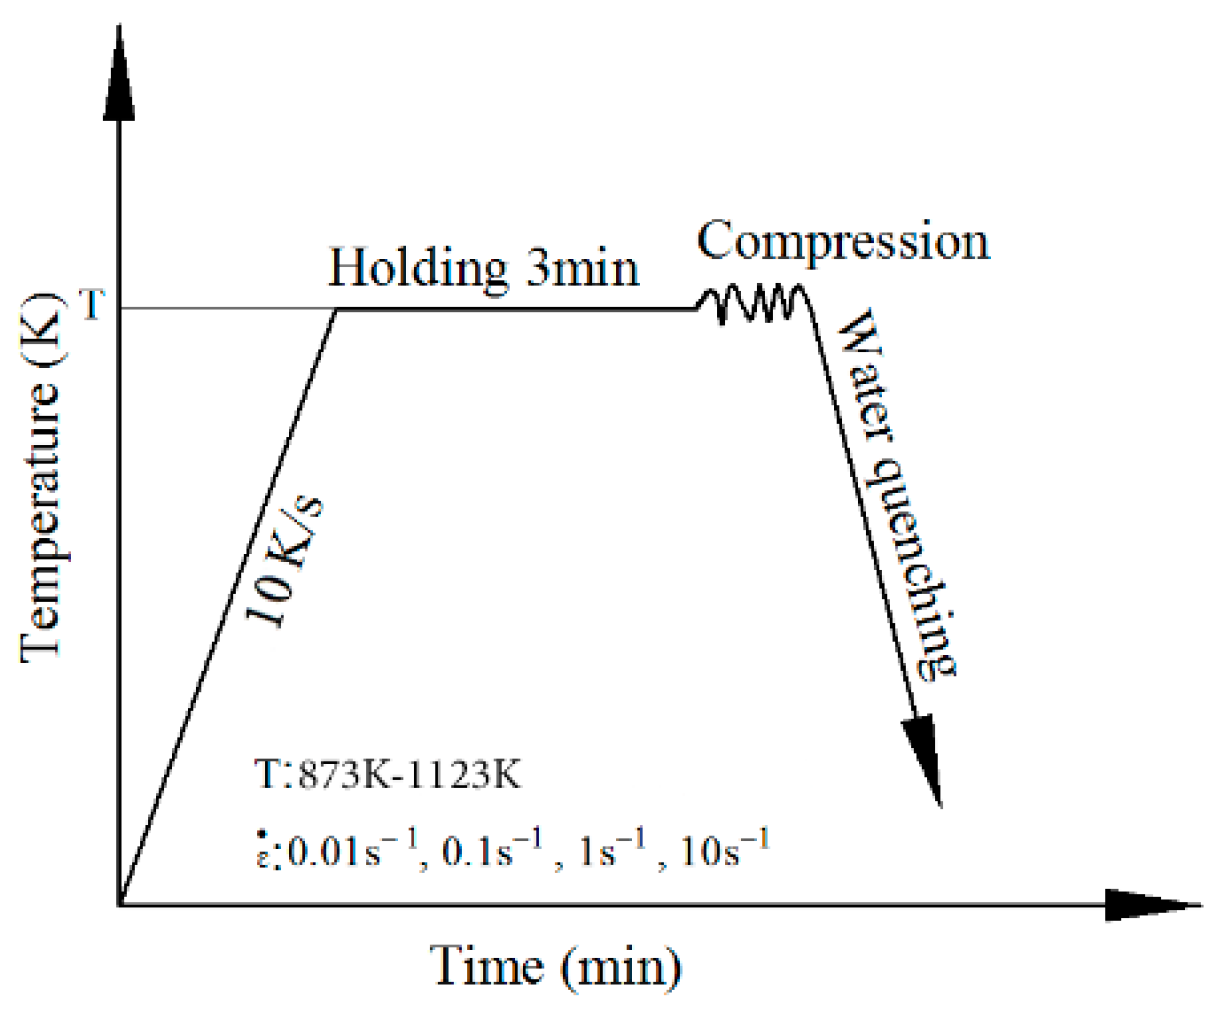
The chemical composition of 20CrMoA steel was: 0.2%C, 0.24%Si, 0.52%Mn, 0.92%Cr, and 0.16%Mo and the balance was for Fe. Figure 1 shows the original microstructure of 20CrMoA steel, which is ferrite and pearlite. JMatPro (Version 7.0, Sente Software Ltd., Guildford, Surrey, UK) is used for calculating the AC1 temperature which was 1004 K. The cylindrical specimens with a diameter of 8 mm and a height of 12 mm sampled from a homogenized bar were compressed on a Gleeble-3500 thermal simulator (Dynamic Systems Inc., Poestenkill, NY, USA). To reduce the friction between the specimens and dies during the tests, the two ends of the specimens were coated with the graphite lubricant. In this experiment, the deformation temperature was 873, 923, 973, 1023, and 1123 K. The curve of compression process is shown in Figure 2. First, each specimen was heated to the specified deformation temperature at a rate of 10 K/s−1 and held for 3 min under isothermal conditions for heat balance. Then, the specimen was compressed in the axial direction at strain rates of 0.01, 0.1, 1, and 10 s−1. The reduction in height was 65% at the end of the test (true strain is about 1.05). Finally, the specimens were immediately quenched in water after compression ended. During the experiment, the machine automatically collects data of true stress, true strain, and actual temperature of specimen.
3. Results and Discussion
3.1. Analysis of Stress-Strain Curves
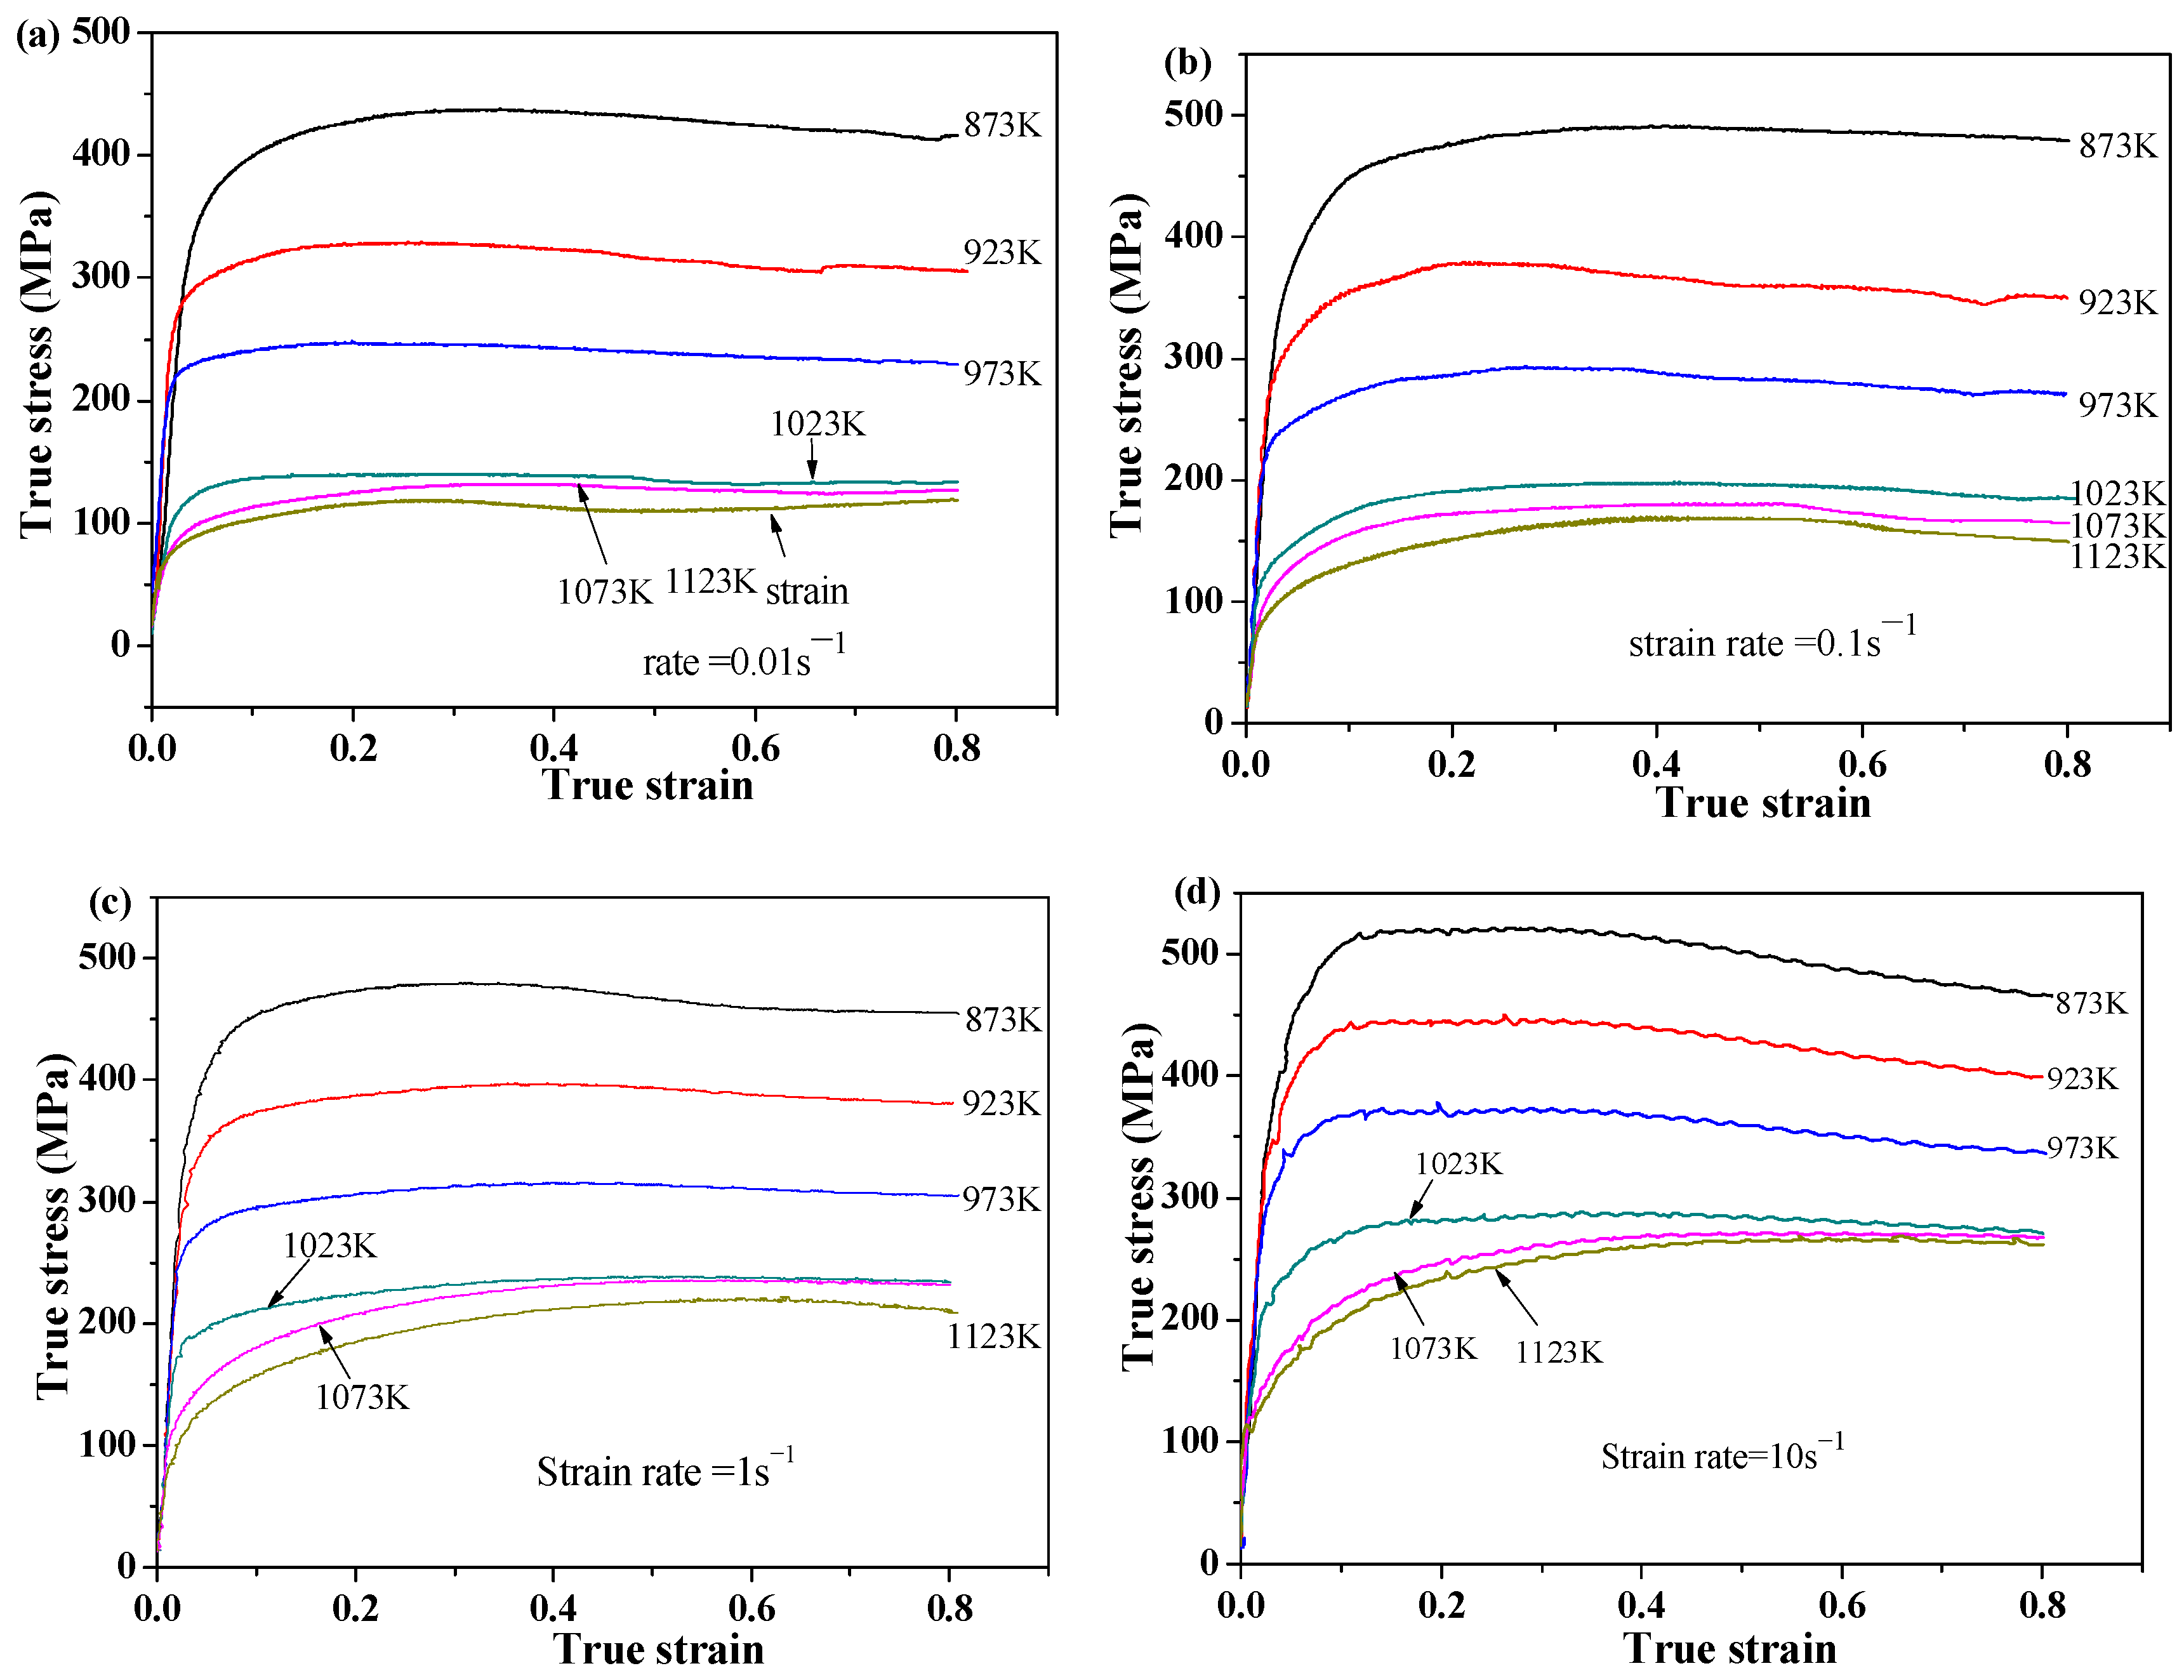
Figure 3 shows the true stress-true strain curves of 20CrMoA steel at deformation temperature of 873−1123 K and deformation rate of 0.01−10 s−1, and the curves are not revised. In the early stage of warm deformation, the true stresses increased sharply and reached a peak, then decreased slowly until reaching a steady state, which was similar to the previously reported results that the stress increased with the decreasing deformation temperature and the increasing strain rate. However, different from the dynamic recrystallization during hot forming, the flow stress curves of warm forming mainly present dynamic recovery. It is worth noting that the stresses have drastic varieties in low temperature region (873−973 K), but slight changes in high temperature region (1023–1123 K) at a constant strain rate, which indicates that the deformation is more sensitive to the deformation temperature in low temperature range than in high one.
3.2. Effect of Deformation Energy on Temperature
Comparing Figure 3c with Figure 3b, it is worth noting that the effect of strain rate on stress is not significant. When the deformation temperature is 873 K, the peak stress (482.59 MPa) at strain rate of 1 s−1 is less than the value (490.06 MPa) at strain rate of 0.1 s−1. When the deformation temperature is 923 K, the peak stress (398.68 MPa) at strain rate of 1 s−1 is only 5.12% larger than the value (379.56 MPa) at strain rate of 0.1 s−1. In addition, as can be seen from Figure 3d, under the condition of lower deformation temperature and higher strain rate, the flow stress does not show a typical stable stage, but shows additional flow softening. The main reason is that rising deformation temperature affected the flow stress of metal and alloy. In the forming process, most of the energy is converted into heat energy, and enough deformation time can be provided for deformation at a low strain rate, enabling the heat caused by plastic work to dissipate to the surrounding environment [27,28]. Owing to the significant reduction in forming time at a high strain rate, most of the deformation heat cannot be dissipated timely but stored in the specimens as heat energy, thus resulting in the rising temperature and decreasing stress of the specimens. In other words, under the conditions of low temperature and high strain rate, the flow stresses collected in the tests are not the values at the preset temperatures, and as the specimen temperature rises, flow stress decreases, thus further softening.
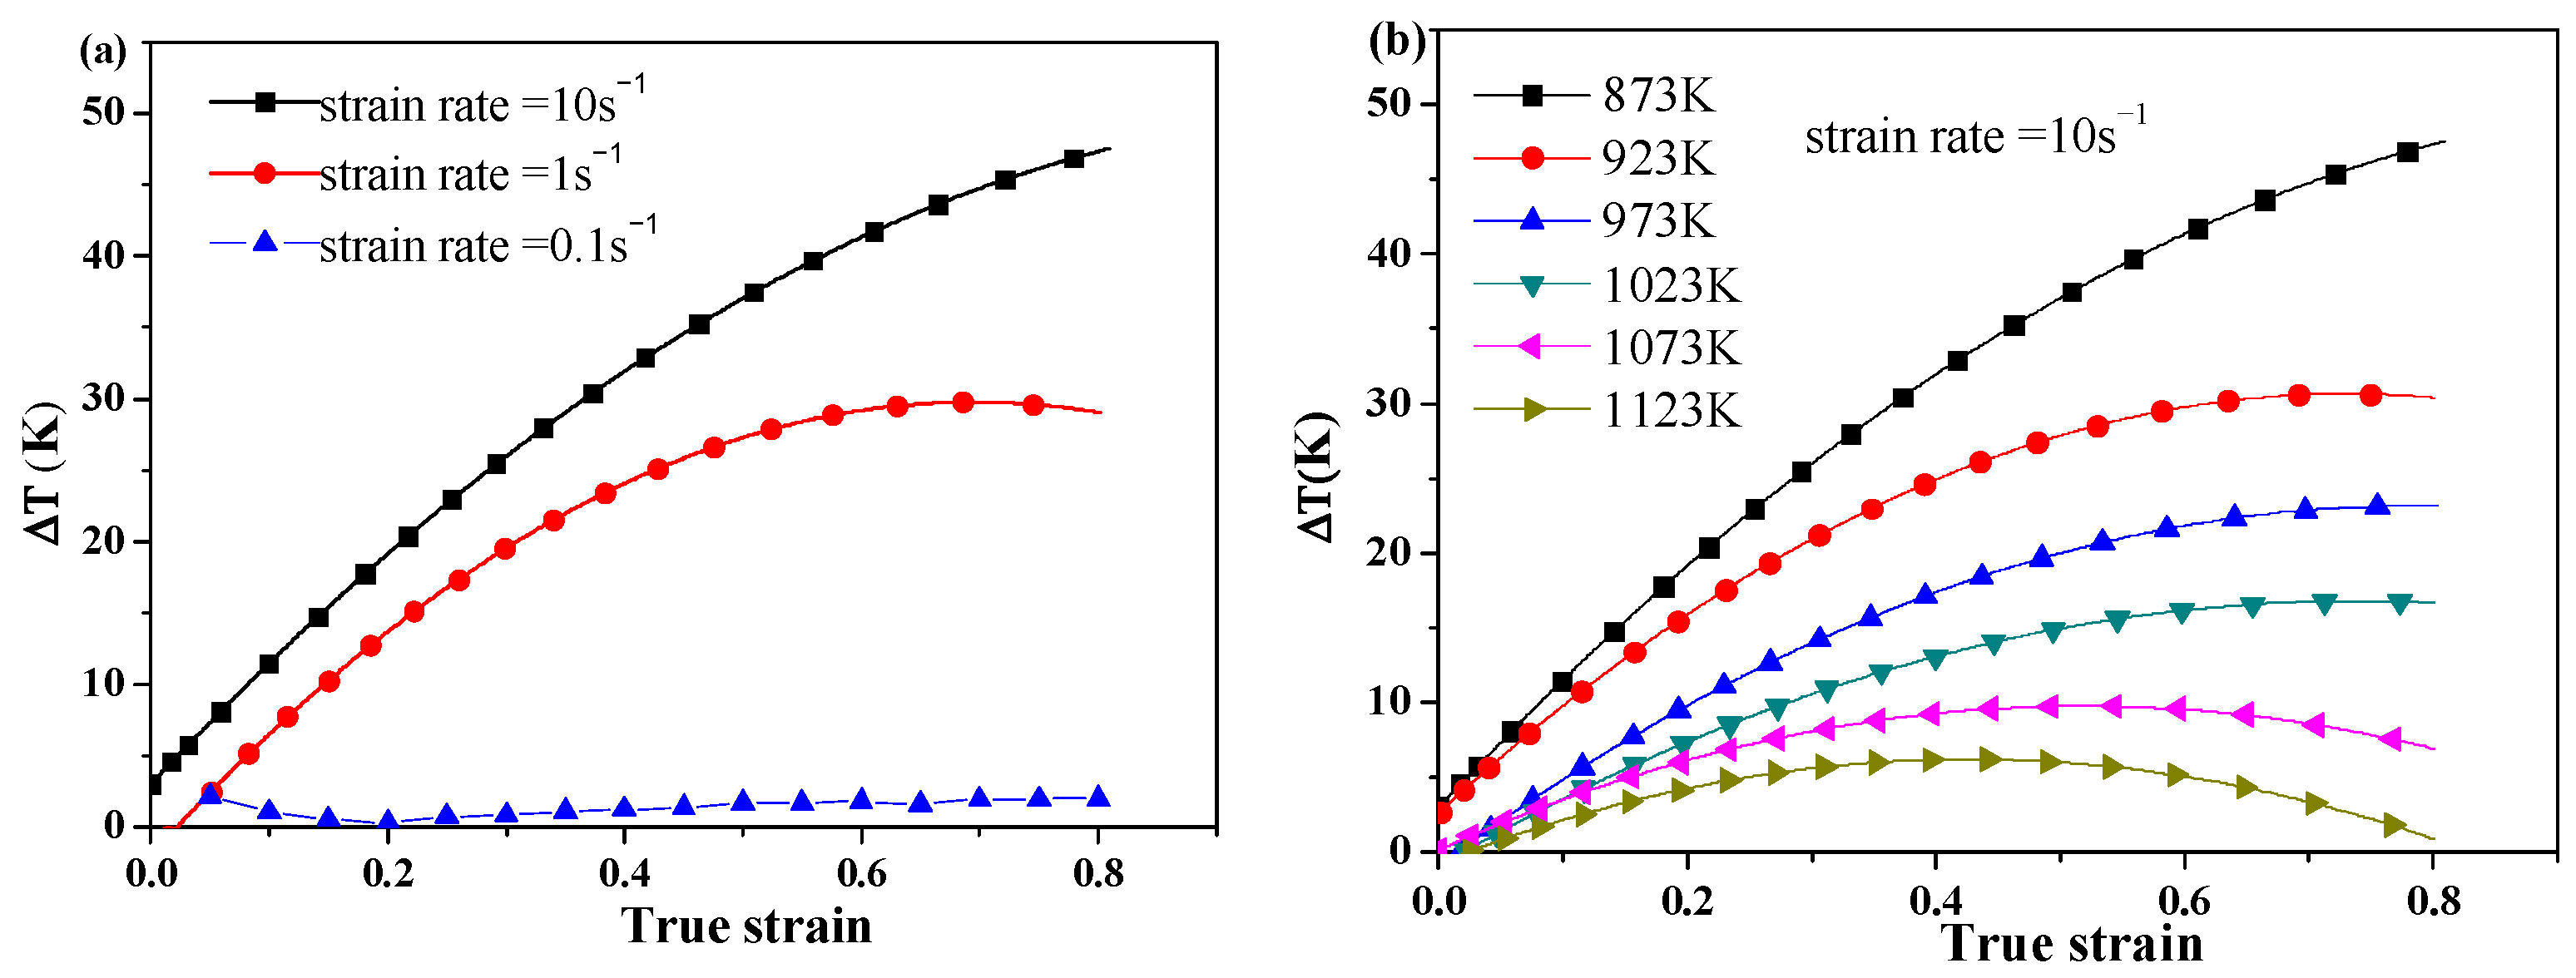
According to the real-time temperature data collected by Gleeble-3500 simulator, the temperature of the specimen shows an upward trend. Figure 4a shows the temperature increments of the specimens under different strain rates at the temperature of 873 K, and the values increase with increasing strain rate and strain. However, the lower strain rate has less effect on the temperature of the specimen. If the strain rate is less than 0.1 s−1, the variation of temperature tends to zero which can be ignored. Figure 4b shows the variation of temperature increments of the specimens at the strain rate of 10 s−1 and in the low deformation temperature range. When the deformation temperature is 873 K, the temperature increment is the largest, and the temperature increment at a strain of 0.8 is 48.06 K, making the actual temperature of the specimen almost equal to the next preset temperature of 923 K. Therefore, under the forming condition of low temperature and high strain rate, due to the temperature rise of the specimen, the flow stress curve shows additional softening after peak. According to the temperature increment, deformation at low strain rates values less than 0.1 s−1 can be regarded as isothermal process, but it is adiabatic process at high strain rates of 1 s−1 and 10 s−1. Due to the short deformation time, the deformation heat causes the temperature of the specimen to increase sharply, so it is necessary to modify the stress curves according to the temperature increment.
4. Constitutive Model during Warm Deformation
4.1. Correction of Flow Stress Curve
The effect of temperature increment on flow stress can be expressed as [29]
where Δσ is the value of temperature increment on stress, Q is the activation energy of thermal deformation, n is the stress index, α is the stress level parameter, which will be calculated later, R is the gas constant (8.314 J mol−1 K−1), T is the experimental temperature (K), and ΔT is the temperature increment.
Arrhenius equation is widely used to describe the relationship of strain rate, flow stress and temperature. The relationship between temperature and strain rate is expressed by the Zener Hollomon parameter [30,31], which is given as
where, is strain rate (s−1), is flow stress (MPa), R is the universal gas constant (8.314 J mol−1 K−1) and Q is the activation energy (KJ·mol−1 K−1). T is the experimental temperature (K), A, α, β, n1, and n are material constant, and α = β/n1. Substituting the power low and exponential law of into Equation (3), it gives
The following equations are obtained by taking logarithms of Equations (5) and (6), respectively.
In terms of the low and high stress level, Equation (3) can be expressed as
Taking the logarithm of both sides of Equation (9), it gives
Differentiating Equation (10), it gives
Substituting the peak stress to Equation (7), Equation (8), and Equation (10), the constants can be obtained: β = 0.0567, n1 = 16.267, α = 0.00348, n = 11.612, b = 5.536, then, Q = 534.53 kJ/mol.
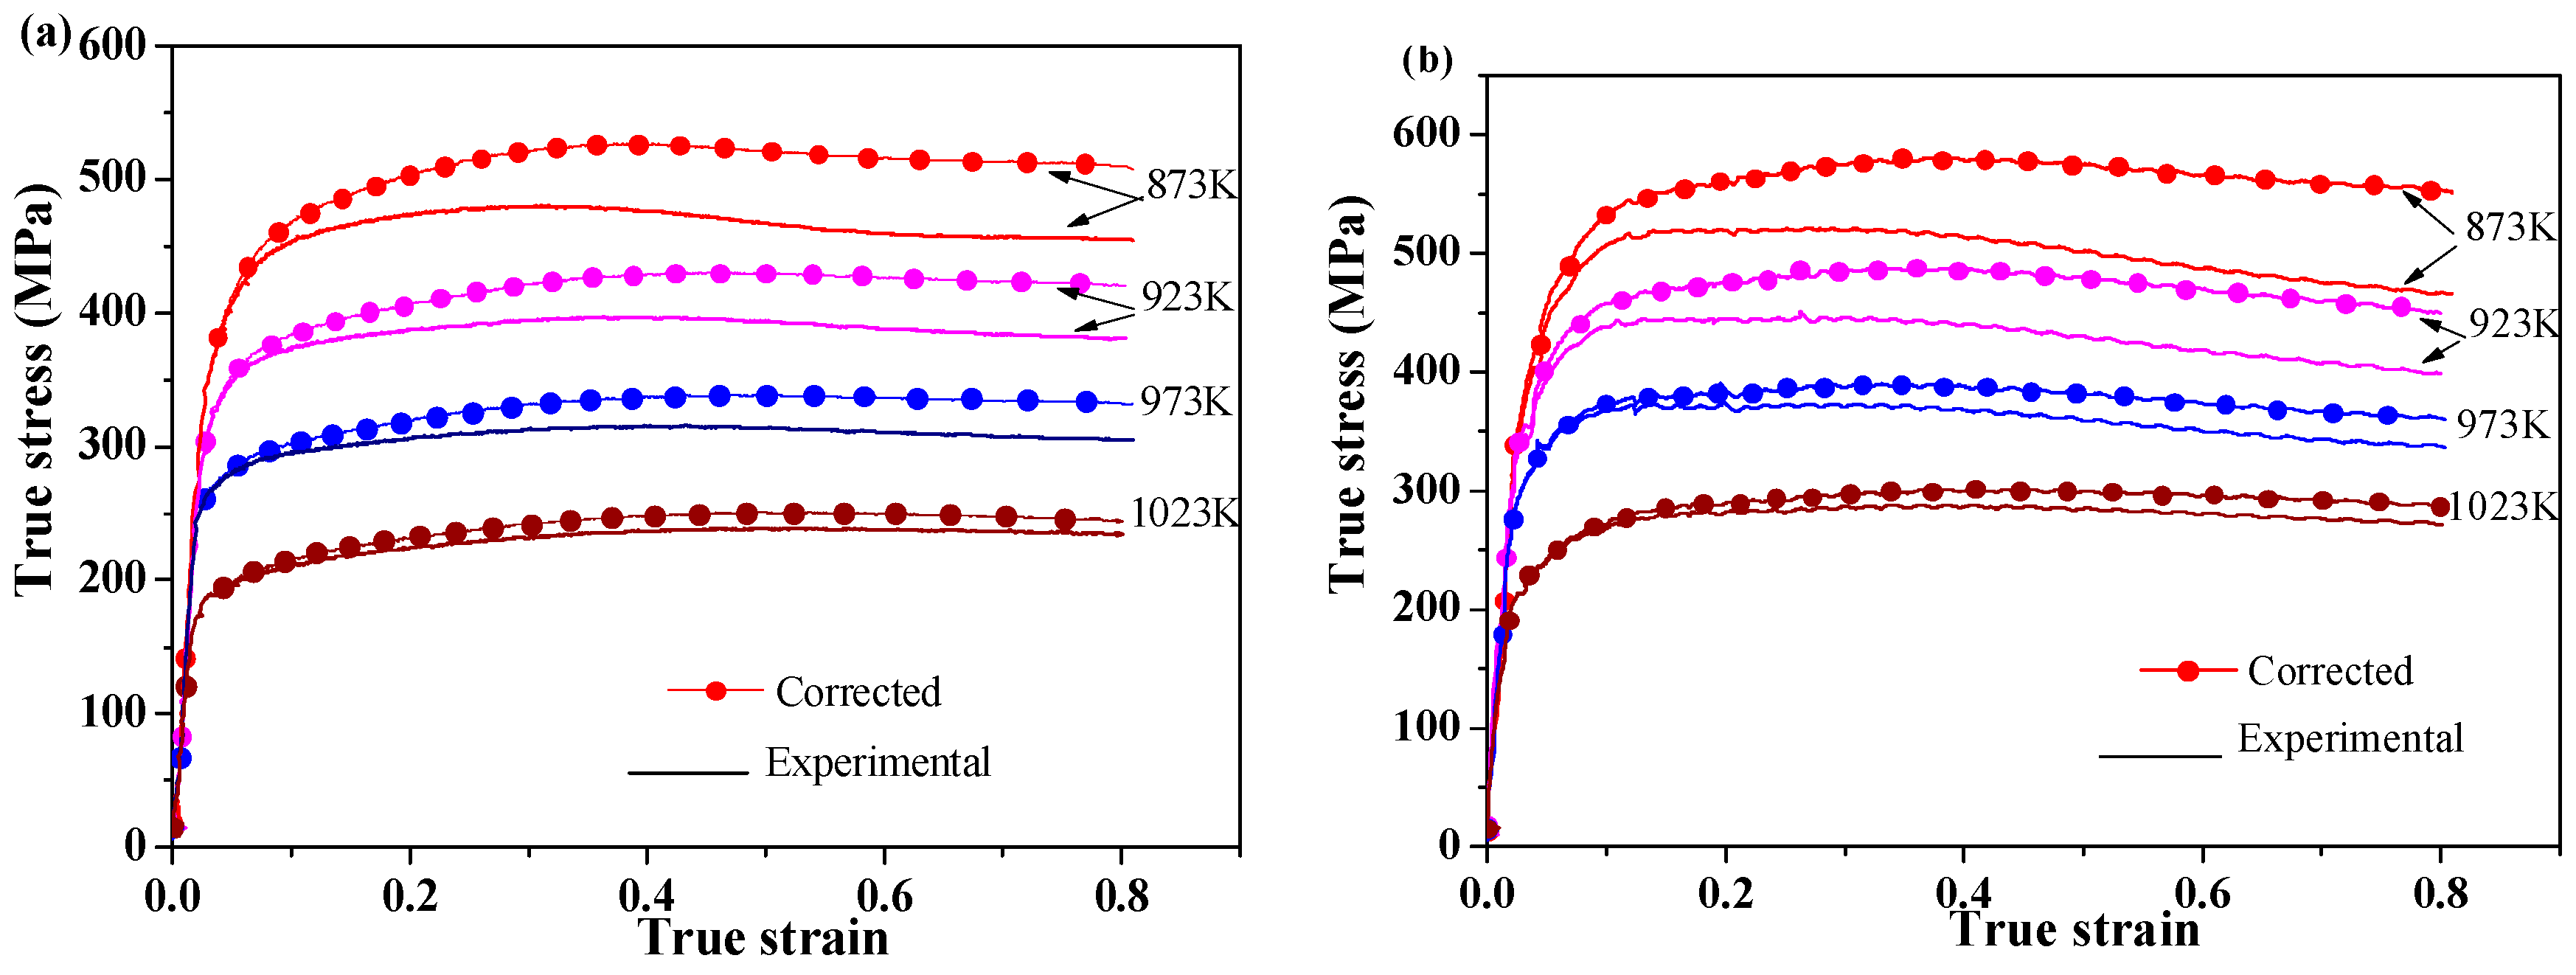
Substituting α, n, Q to Equation (1), the flow stress at 1 s−1 and 10 s−1 are corrected and the modified curve is shown in Figure 5. It can be seen from Figure 5 that under the condition of high strain rate, the increase of deformation temperature has a significant influence on the stress. The stress value is largely different at a lower temperature and a higher strain rate. Under the deformation condition of 873 K and 10 s−1, the maximum value of is 86.58 MPa, 18.8% higher than the measured value, while under the deformation condition of 1073 K and 1 s−1, the maximum value of is only 8.55 MPa, only 3.77% higher than the measured value. Under the deformation condition of 1123 K and 1 s−1, the stress error can be ignored due to the small temperature increment.
4.2. Construction of Constitutive Model
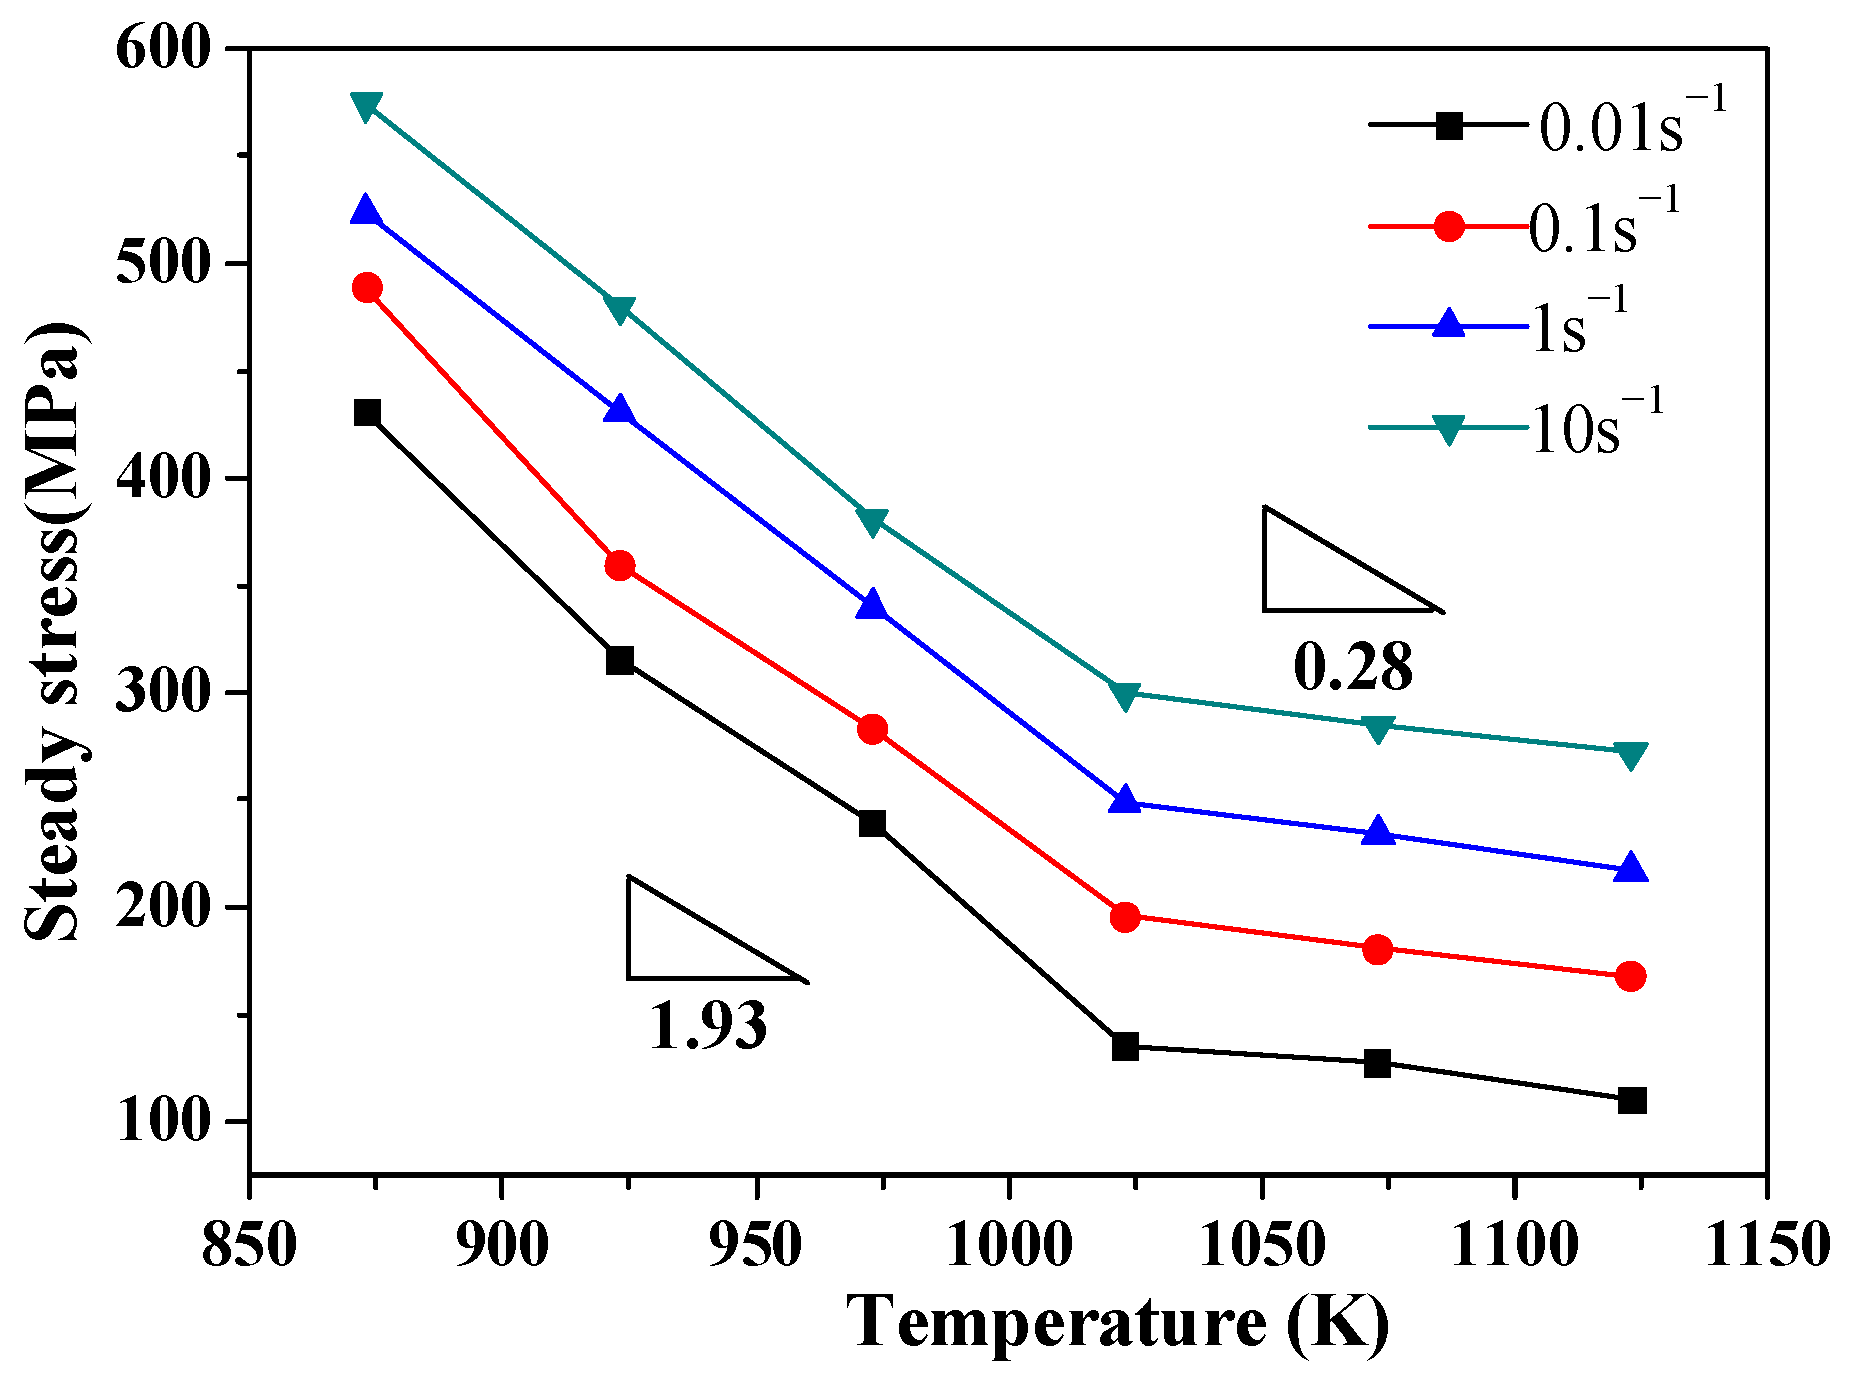
According to the modified flow stress data, the relationship between steady stress and temperature under various strains can be analyzed, as shown in Figure 6. It can be seen that the steady stress decreases with the increase of temperature, but the average rate of decline in low-temperature region is 1.93, which is 6.89 times as much as the value 0.28 in the high-temperature region. Obviously, the deformation is more sensitive in the high temperature region. At a temperature lower than AC1 temperature (1004 K), the microstructure of 20CrMoA steel is mainly ferrite, but austenite emerges caused by phase transformation in high temperature region. It has been widely recognized that the crystal lattice types of ferrite and austenite are body-centered cubic (BCC) and face-centered cubic (FCC), respectively. BCC metals are much less active than FCC metals, resulting in much higher thermal sensitivity [32]. It is the main reason that the steady stress decreases more rapidly in the low temperature region. Therefore, it is necessary to establish constitutive models of different temperature ranges according to different temperature sensitivities.
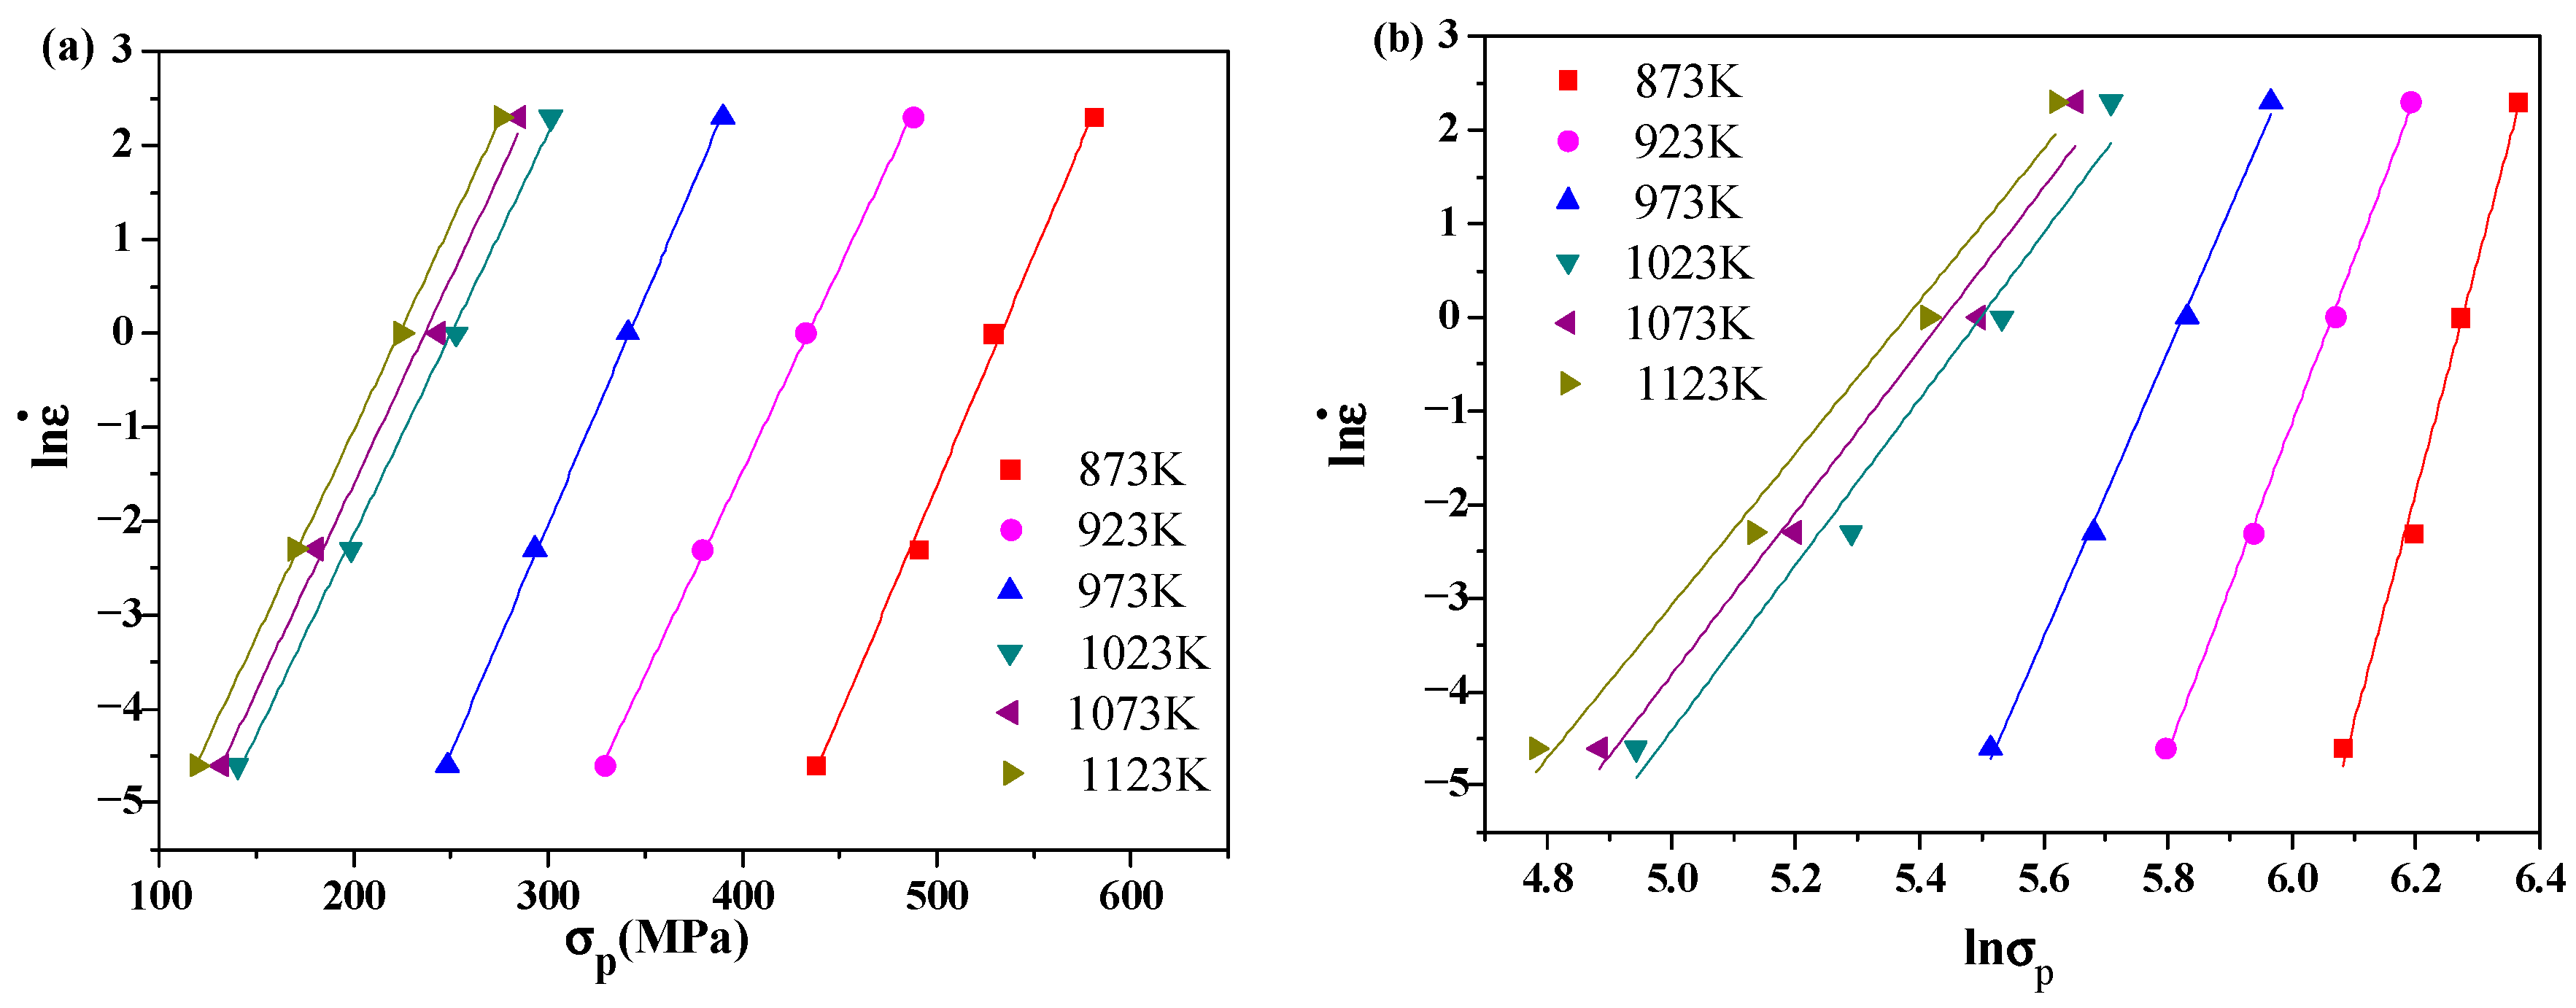
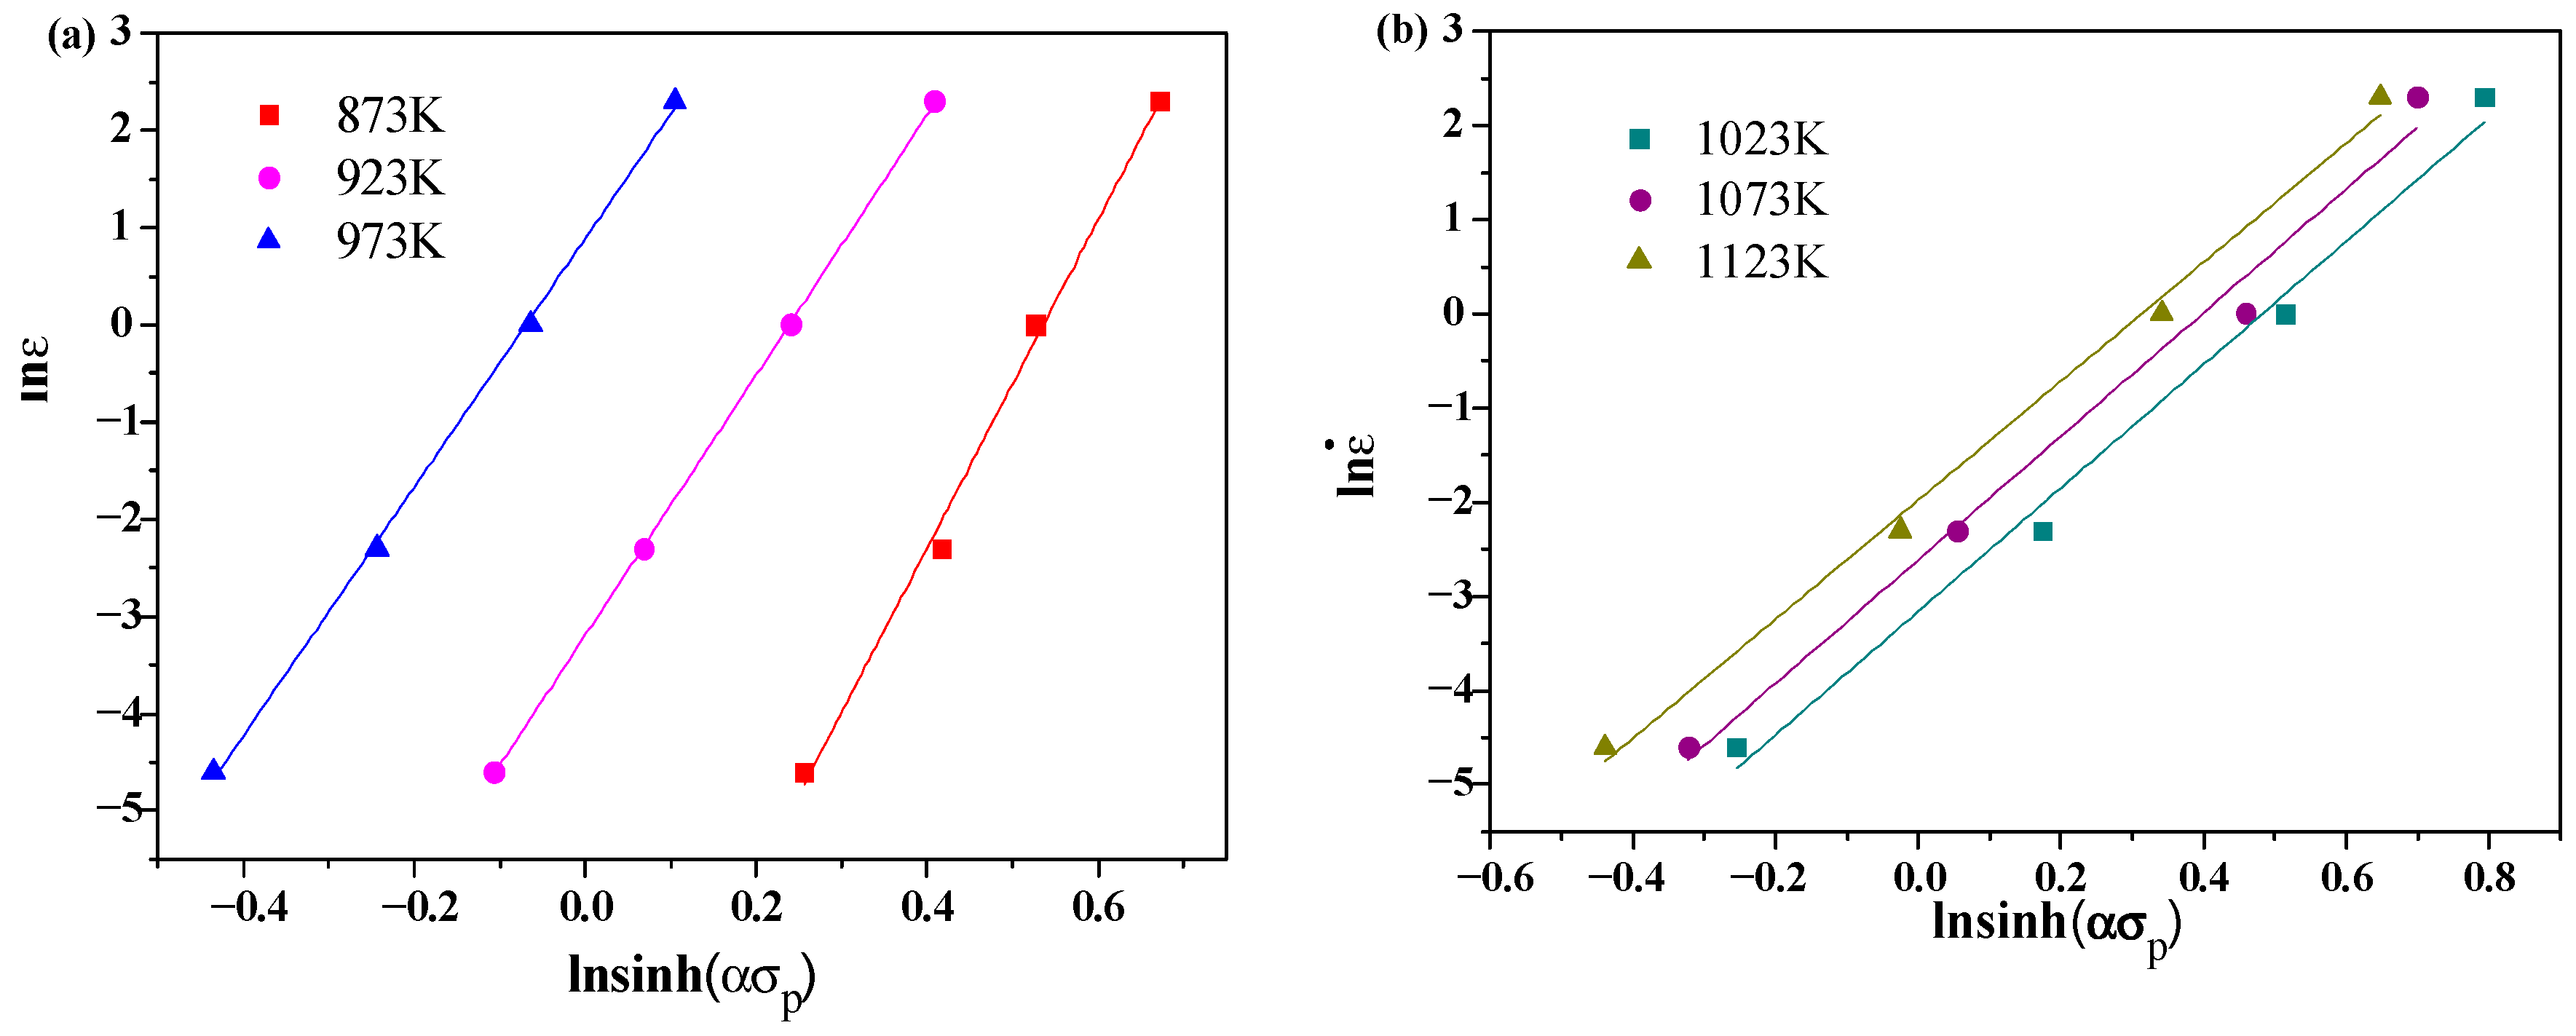
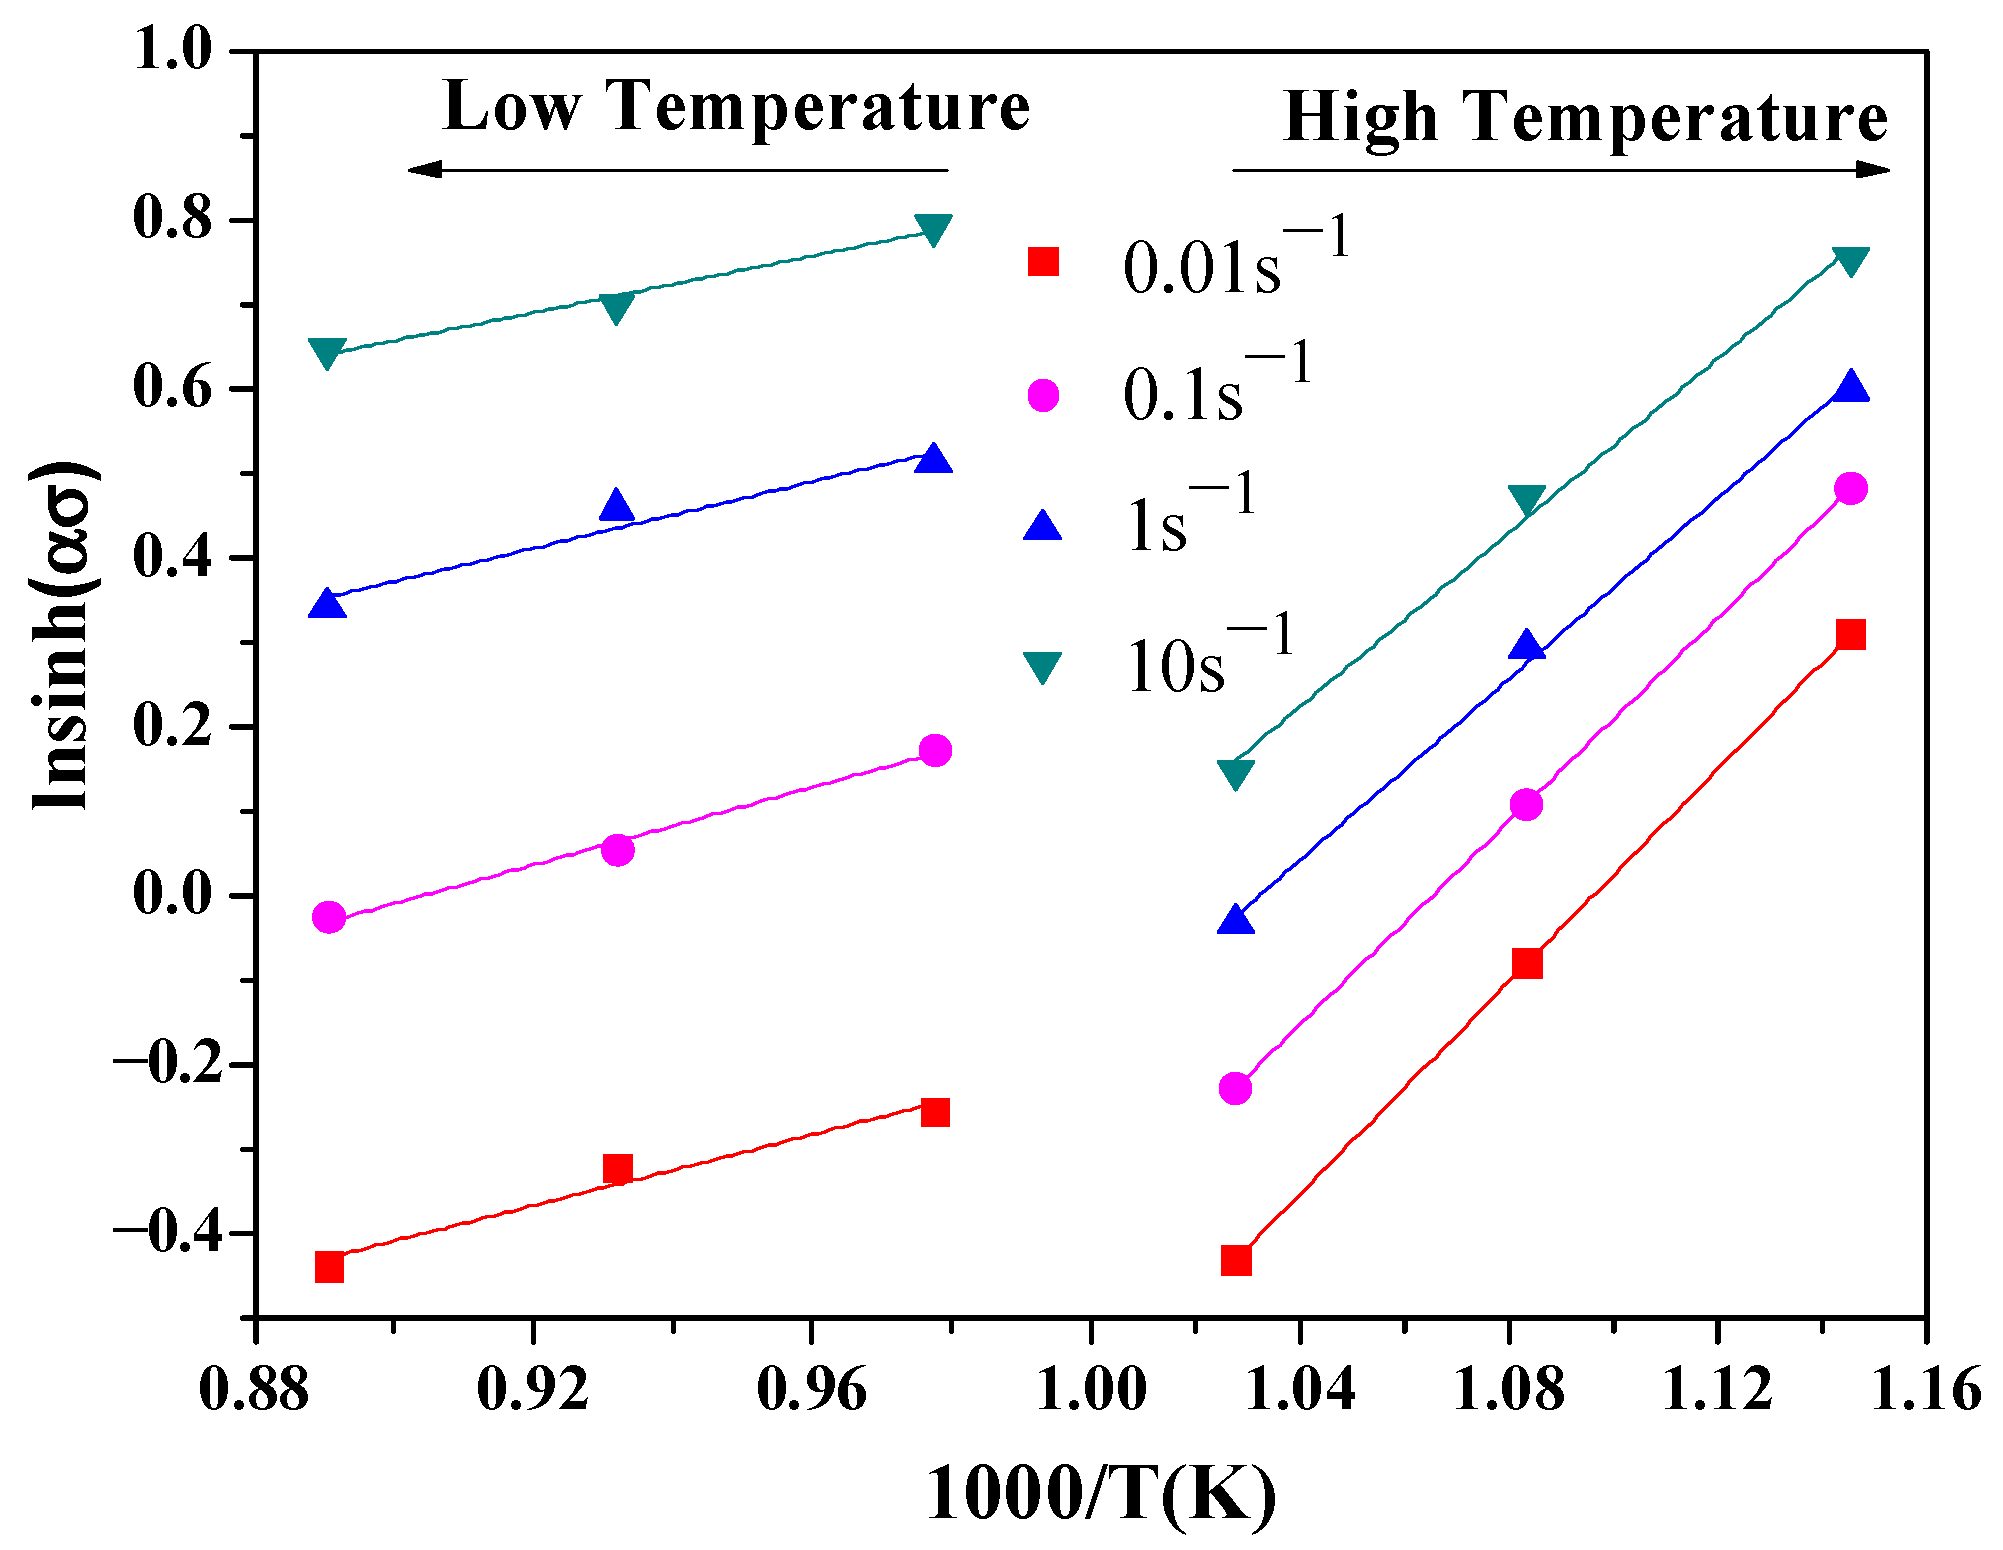
Substituting the peak stresses of the modified curves to Equations (7)–(9) for variable linear regression, the experimental data obtained from the warm compression tests can be fitted into a series of straight lines as shown in Figure 7, Figure 8 and Figure 9. Calculating the average value of the slope of the fitting line in the figures respectively, the material constants n1, , n, and Q can be obtained, as shown in Table 1.
4.3. Strain Correction for Constitutive Models
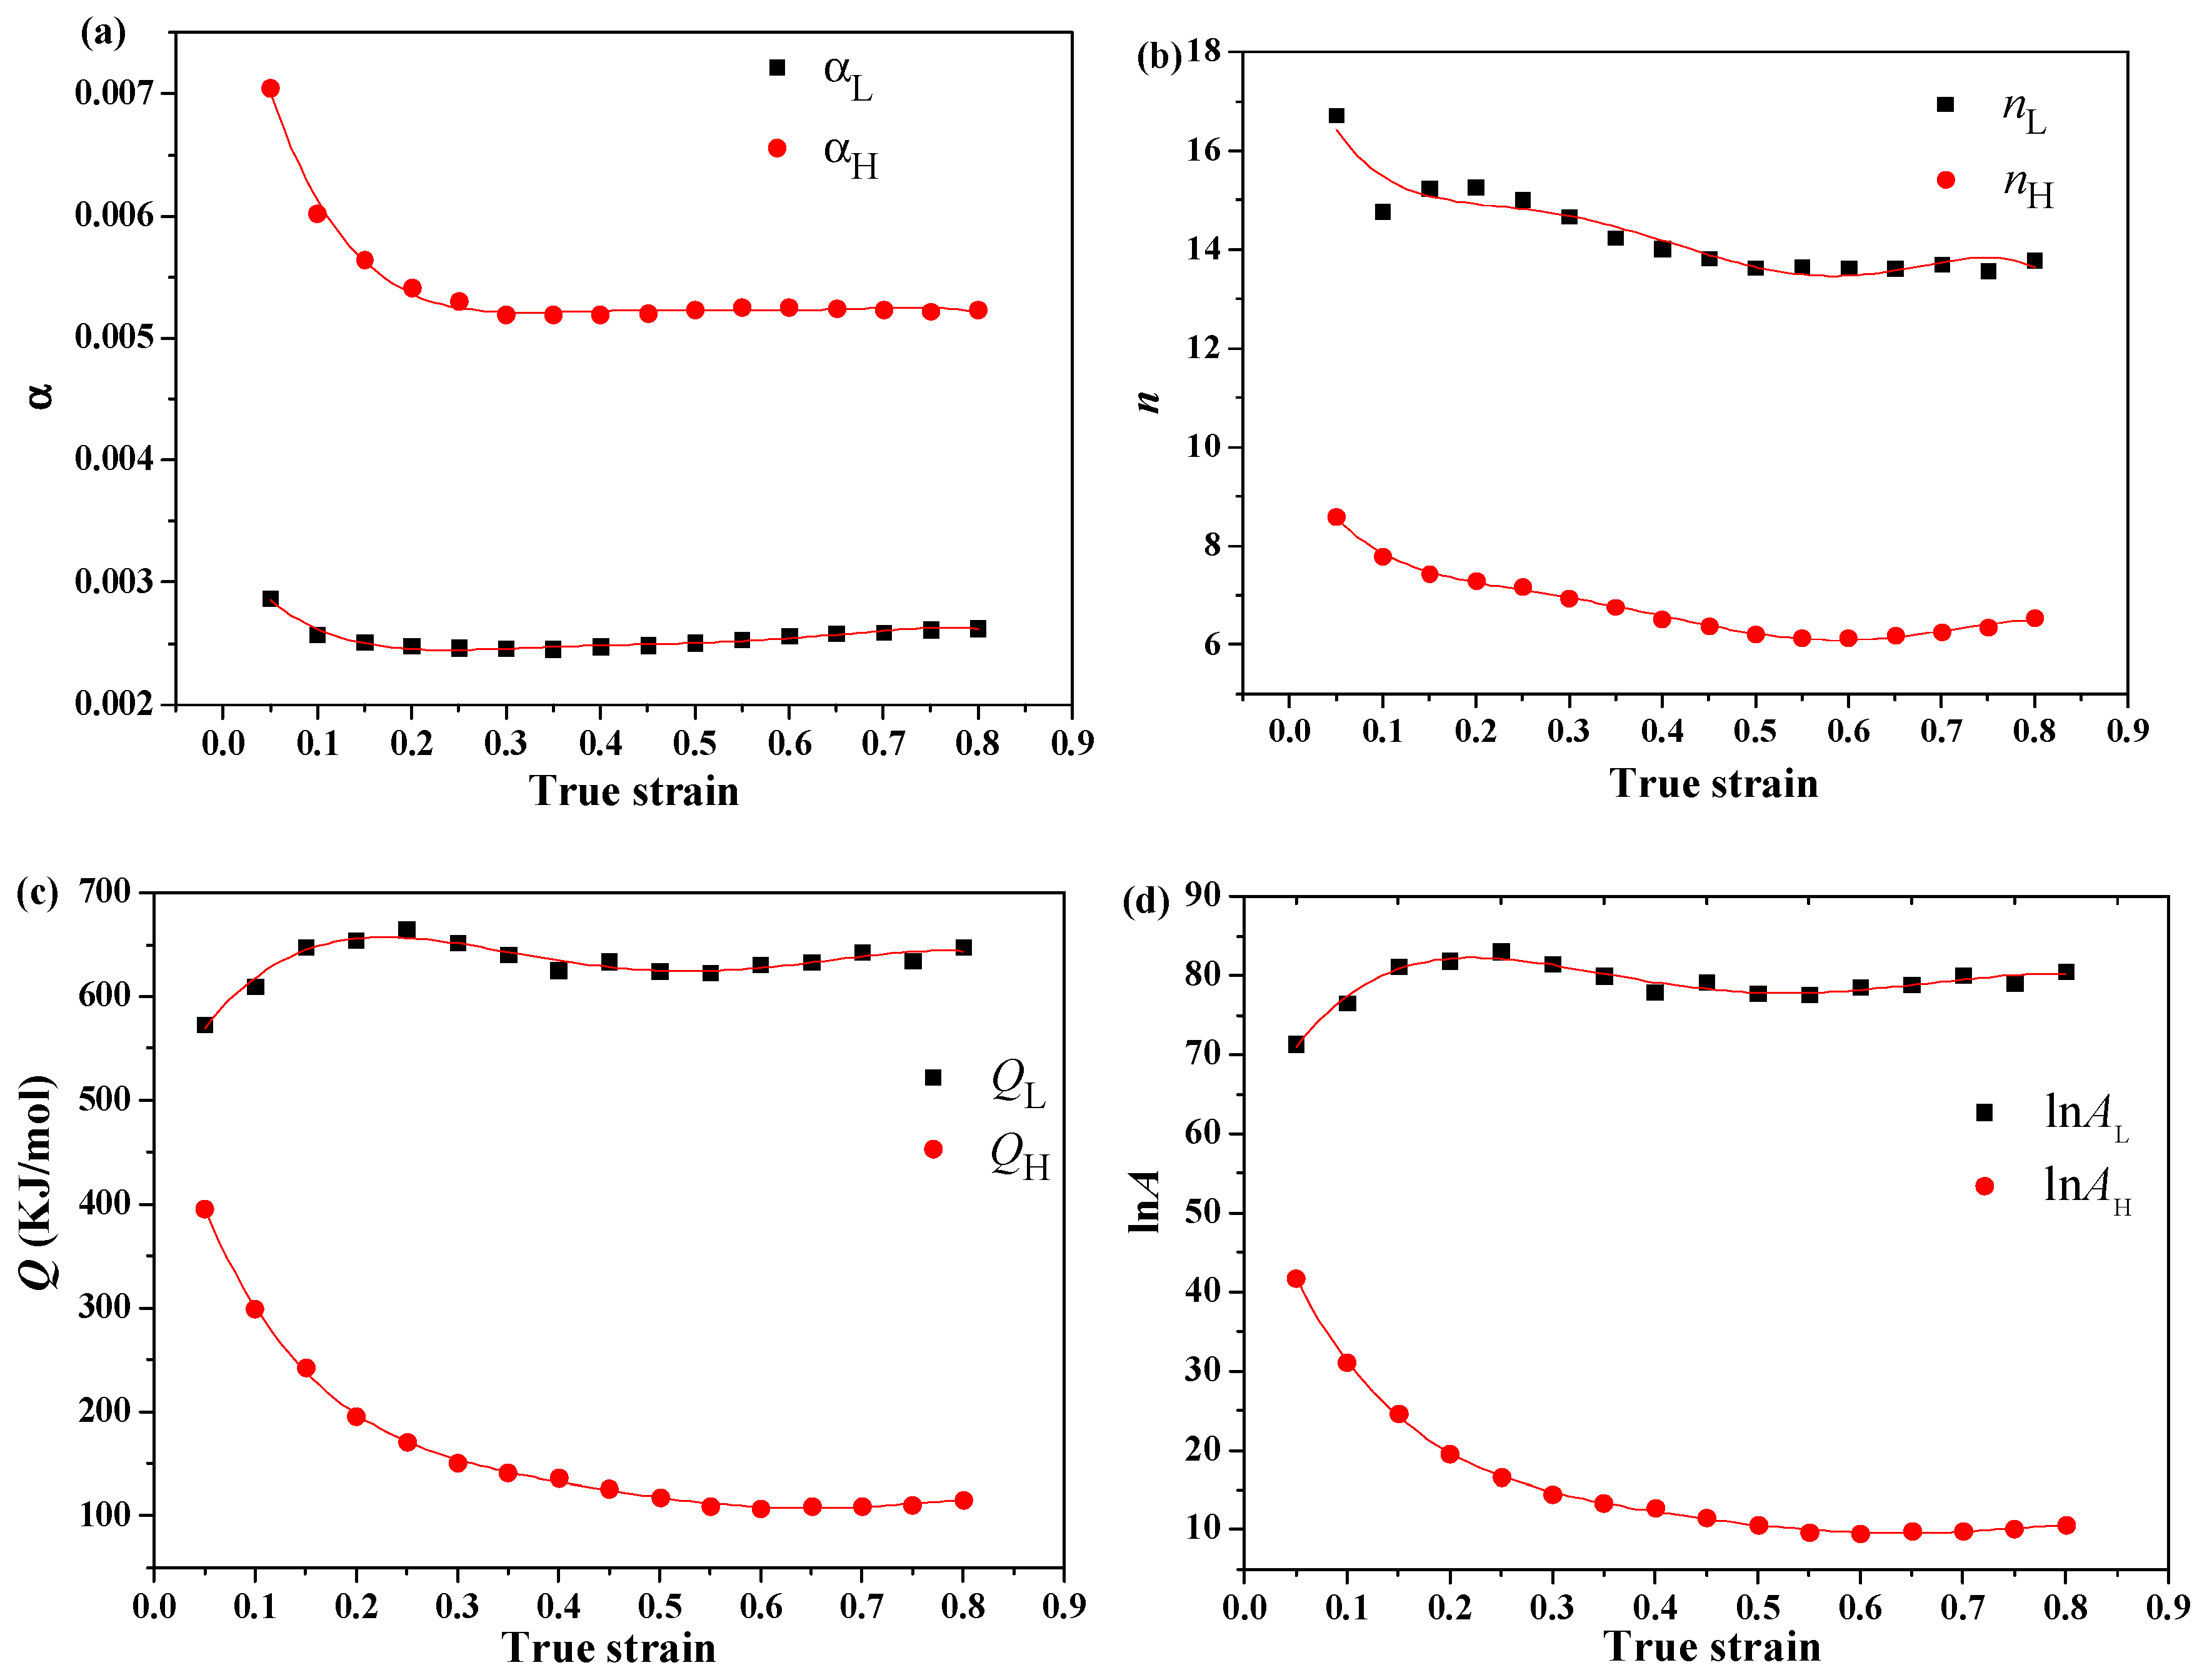
Obviously, the above equations do not consider the effect of strain on the calculation of material constants. The plastic flow behavior of 20CrMoA steel during warm forming is affected by strain which further significantly affects the forming time and the balance between dynamic softening and work hardening. Therefore, in order to more accurately estimate the plastic flow behavior of 20CrMoA steel, the strain compensation should be included in the constitutive model during warm deformation. In the strain range of 0–0.8, the material constants (α, n, A, Q) of the constitutive equations under different true strains are calculated with an interval 0.05. These material constants can be expressed by the polynomial function of strain, as shown in Equation (13). Fitting the polynomials, the coefficients of functions can be obtained, as shown in Table 2 and Table 3. Figure 10 shows the polynomial curves of material constants fitted in the low and high temperature region.
Substituting the material constants into Equation (3), the constitutive model with strain correction of 20CrMoA steel during warm deformation can be obtained, as shown in Equation (14). According to the previous analysis, due to the different microstructures of the material, the material has higher temperature sensitivity in the ferrite region than in the dual phase region. Therefore, when deformation temperature is lower than the transformation temperature (1004 K), the material constants of low temperature range can be applied, otherwise, that in high temperature range should be applied.
4.4. Verification of Constitutive Equation
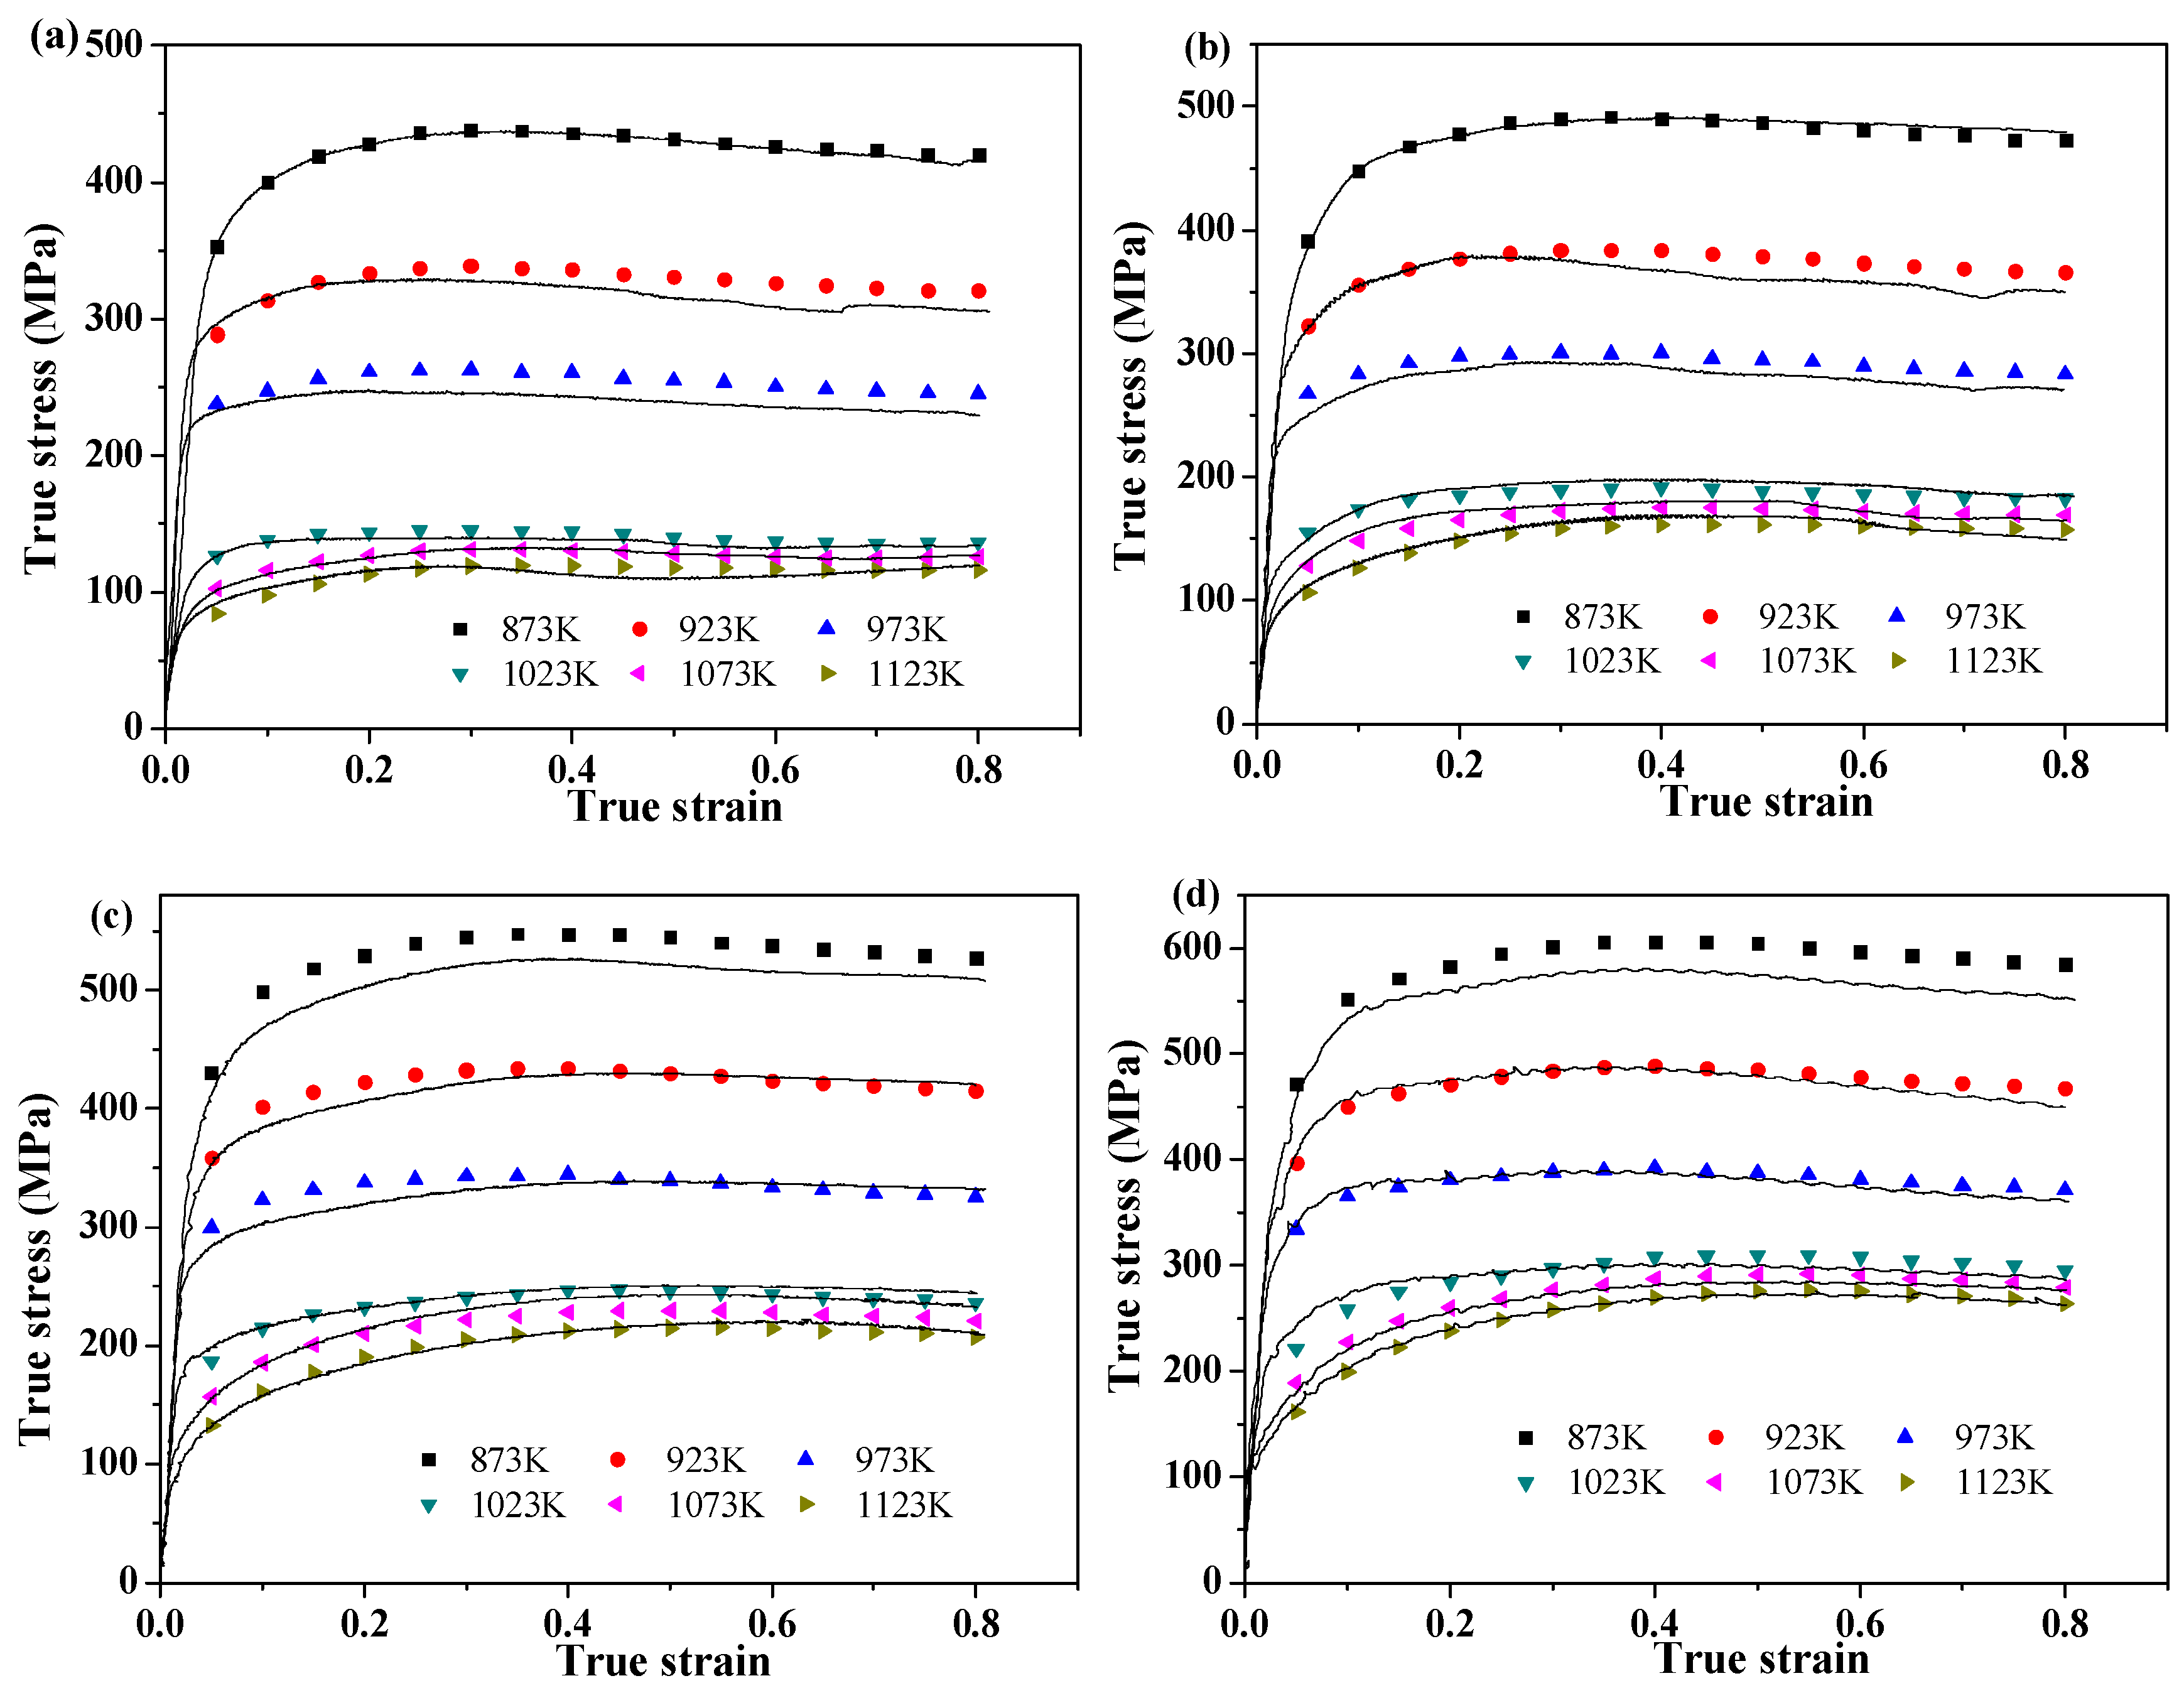
In order to verify the constitutive model of 20CrMoA steel with strain correction, the fifth-degree polynomial coefficients in Table 2 and Table 3 are respectively substituted into Equation (14), then the predicted stress values in low and high temperature regions are obtained. The predicted stress values with a strain variable of 0.1–0.8 at an interval of 0.05 are compared with those in experimental curves, as shown in Figure 11, which demonstrates that the predicted true stress values agree well with the experimental ones in the whole strain rate range.
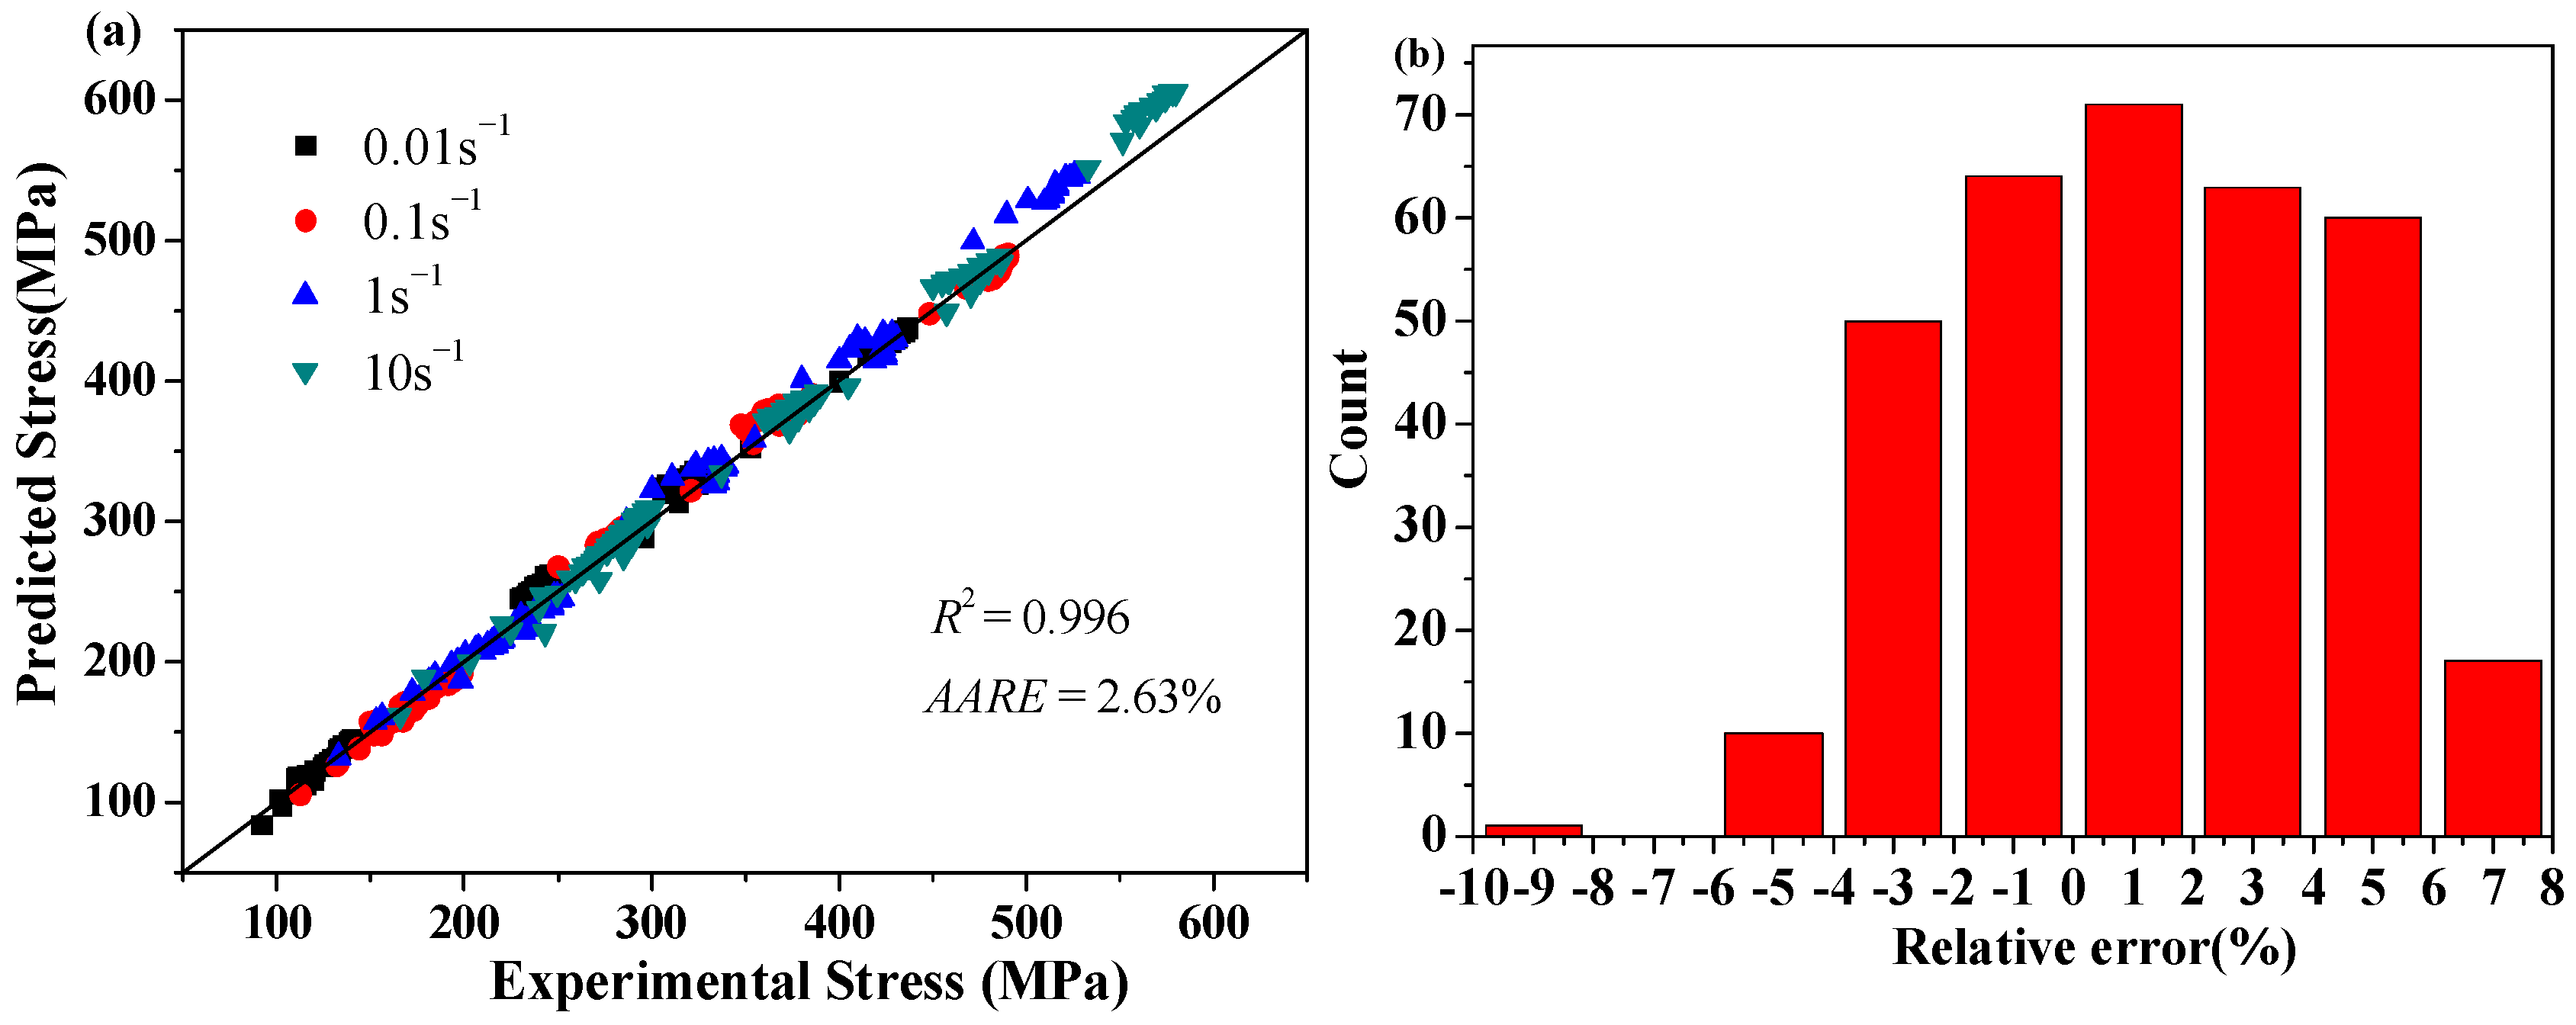
The correlation coefficient R and average absolute relative error (AARE) are used to evaluate the accuracy of the constitutive equation. The value of R reflects the degree of correlation of the predicted values and experimental ones in Equation (15). AARE calculated by comparing relative errors item by item, was used to measure predictability in Equation (16). Where, E is the experimental stress, and P is the predicted stress. and are the average values of E and P, respectively. N is the number of data used for study.
Figure 12a shows that the correlation coefficient (R2) between the predicted values and the experimental ones is 0.996, and the average absolute relative error (AARE) is 2.63%. In the sample data of predicted stress values, the maximum relative error is −9.04%, and the proportion of relative error between −5% and 5% is 86.9%, Figure 12b shows the statistical analysis of relative error and indicates that the constitutive model is highly accurate in predicting flow stress.
5. Conclusions
(1) 20CrMoA steel has higher temperature sensitivity in the low temperature region (ferrite region). With increasing temperature, the decline rate of the steady-state stress is 6.9 times that of the high temperature range.
(2) Considering the large flow stress at temperature less than 1023 K and the low temperature sensitivity at temperature more than 1023 K, it is suggested that the warm forming temperature of 20CrMoA steel should be above 1023 K. While the deformation resistance is relatively stable, the temperature can be adjusted appropriately to change the proportion of dual phase microstructure to achieve the expected mechanical properties. Further study on the microstructure is essential for more accurate forming temperature region.
(3) According to the effect of temperature increment on stress, it is necessary to modify the flow stress curves under the condition of low temperature and high strain rate. Considering the great difference in the sensitivity of deformation to temperature, the hyperbolic sine constitutive model of 20CrMoA steel during warm deformation is established in both low and high temperature ranges. After strain correcting, the constitutive model can accurately predict the flow stress. The correlation coefficient R2 between predicted values and experimental values is 0 996 and AARE is 2.63%.
Author Contributions
Conceptualization, S.X. and X.S.; methodology, S.X.; Software, S.X.; validation, S.X., J.C., and X.S.; formal analysis, S.X.; investigation, S.X.; resources, S.X.; data curation, S.X.; writing—original draft preparation, S.X.; writing—review and editing, S.X. and S.L.; visualization, S.X. and J.C.; supervision, S.L.; project administration, X.S.; funding acquisition, X.S. All authors have read and agreed to the published version of the manuscript.
Funding
This research was funded by the National Natural Science Foundation of China (grant no. 51975301), and the Natural Science Foundation of Zhejiang Province of China (grant no. LZ17E050001).
Conflicts of Interest
The authors declare no conflict of interest.
References
- Siegert, K.; Kammerer, M.; Keppler-Ott, T.; Ringhand, D. Recent developments on high precision forging of aluminum and steel. J. Mater. Process. Technol. 1997, 71, 91–99. [Google Scholar] [CrossRef]
- Lange, K. Modern metal forming technology for industrial production. Mater. Process. Technol. 1997, 71, 2–13. [Google Scholar] [CrossRef]
- Abdollah-Zadeh, A.; Eghbali, B. Mechanism of ferrite grain refinement during warm deformation of a low carbon Nb-microalloyed steel. Mater. Sci. En A. 2007, 457, 219–225. [Google Scholar] [CrossRef]
- Poorganji, B.; Miyamoto, G.; Mäki, T.; Furuhara, T. Formation of ultrafine grained ferrite by warm deformation of lath martensite in low-alloy steels with different carbon content. Scr. Mater. 2008, 59, 279–281. [Google Scholar] [CrossRef]
- Unnikrishnan, R.; Kumar, A.; Khatirkar, R.; Shekhawat, S.K.; Sapate, S.G. Structural developments in un-stabilized ultra low carbon steel during warm deformation and annealing. Mater. Chem. Phys. 2016, 183, 339–348. [Google Scholar] [CrossRef]
- Storojeva, L.; Ponge, D.; Kaspar, R.; Raabe, D. Development of microstructure and texture of medium carbon steel during heavy warm deformation. Acta Mater. 2004, 52, 2209–2220. [Google Scholar] [CrossRef] [Green Version]
- Eghbali, B.; Abdollah-Zadeh, A. Influence of deformation temperature on the ferrite grain refinement in a low carbon Nb-Ti microalloyed steel. J. Mater. Process. Technol. 2006, 180, 44–48. [Google Scholar] [CrossRef]
- Hsu, C.-C.; Huang, J.-H.; Chen, W.-C.; Fuh, Y.K. Numerical analysis and experimental validation on multi-stage warm forging process of deep groove ball bearing—A modified punch geometry with microstructure and defect analysis. Int. J. Adv. Manuf. Technol. 2016, 89, 2119–2128. [Google Scholar] [CrossRef]
- Lee, Y.; Yoon, E.; Nho, T.; Moon, Y. Microstructure control of ferrous driven part fabricated by warm precision forging. Procedia Manuf. 2018, 15, 404–410. [Google Scholar] [CrossRef]
- Babu, P.A.; Saraf, M.; Vora, K.; Kuppan, P. Forgeability Study of Al 6061 Alloy during Warm Forging of Cylindrical Billets; Elsevier: Amsterdam, The Netherlands, 2018; Volume 5, pp. 11950–11961. [Google Scholar]
- Forcellese, A.; Gabrielli, F. Warm forging of aluminum alloys: A new approach for time compression of the forging sequence. Int. J. Mach. Tool Manuf. 2000, 40, 1285–1297. [Google Scholar] [CrossRef]
- Choi, C.; Groseclose, A.; Altan, T. Estimation of plastic deformation and abrasive wear in warm forging dies. J. Mater. Process. Technol. 2012, 212, 1742–1752. [Google Scholar] [CrossRef]
- Kache, H.; Stonis, M.; Behrens, B.-A. Development of a warm cross wedge rolling process using FEA and downsized experimental trials. Prod. Eng. 2012, 6, 339–348. [Google Scholar] [CrossRef]
- Xiong, Y.; Sun, S.; Li, Y.; Zhao, J.; Lv, Z.; Zhao, D.; Zheng, Y.; Fu, W. Effect of warm cross-wedge rolling on microstructure and mechanical property of high carbon steel rods. Mater. Sci. Eng. A 2006, 431, 152–157. [Google Scholar] [CrossRef]
- Sun, S.H.; Xiong, Y.; Zhao, J. Microstructure characteristics in high carbon steel rod after warm cross-wedge rolling. Scripta Mater. 2005, 53, 137–140. [Google Scholar] [CrossRef]
- Huang, X.; Wang, B.; Zhou, J.; Ji, H.; Mu, Y.; Li, J. Comparative study of warm and hot cross-wedge rolling:numerical simulation and experimental trial. Int. J. Adv. Manuf. Technol. 2017, 92, 3541–3551. [Google Scholar] [CrossRef]
- Bulzak, T.; Pater, Z.; Tomczak, J.; Majerski, K. Hot and warm cross-wedge rolling of ball pins—Comparative analysis. J. Manuf. Process. 2020, 50, 90–101. [Google Scholar] [CrossRef]
- Chai, R.-X.; Su, W.-B.; Guo, C.; Zhang, F.-F. Constitutive relationship and microstructure for 20CrMnTiH steel during warm deformation. Mater. Sci. Eng. A 2012, 556, 473–478. [Google Scholar] [CrossRef]
- Li, H.-B.; Feng, Y.-L.; Yan, T.; Yu, E. Constitutive Model of Warm Deformation Behavior of Medium Carbon Steel. J. Iron Steel Res. Int. 2016, 23, 940–948. [Google Scholar] [CrossRef]
- Li, Y.Y.; Zhao, S.; Fan, S.Q.; Zhong, B. Plastic properties and constitutive equations of 42CrMo steel during warm forming process. Mater. Sci. Technol. 2013, 30, 645–652. [Google Scholar] [CrossRef]
- Rastegari, H.; Rakhshkhorshid, M.; Somani, M.C.; Porter, D.A. Constitutive Modeling of Warm Deformation Flow Curves of an Eutectoid Steel. J. Mater. Eng. Perform. 2017, 77, 203–2178. [Google Scholar] [CrossRef]
- Goetz, R.L.; Semiatin, S.L. The Adiabatic Correction Factor for Deformation Heating during the Uniaxial Compression Test. J. Mater. Eng. Perform. 2001, 10, 710–717. [Google Scholar] [CrossRef]
- Li, L.; Zhou, J.; Duszczyk, J. Determination of a constitutive relationship for AZ31B magnesium alloy and validation through comparison between simulated and real extrusion. J. Mater. Process. Technol. 2006, 172, 372–380. [Google Scholar] [CrossRef]
- Li, Q.; Wang, T.-S.; Li, H.-B.; Gao, Y.-W.; Li, N.; Jing, T.-F. Warm deformation behavior of steels containing carbon of 0.45% to 1.26% with martensite starting structure. J. Iron Steel Res. Int. 2010, 17, 34–37. [Google Scholar] [CrossRef]
- Wang, D.; Jin, J.; Wang, X. A unified constitutive model for a low alloy steel during warmdeformation considering phase differences. J. Mater Process Technol. 2017, 245, 80–90. [Google Scholar] [CrossRef]
- He, A.; Chen, L.; Wang, S.; Huangfu, L.X. Research on Dynamic Recrystallization Behavior of 20CrMo Alloy Steel during Hot Deformation. Adv. Mater. Res. 2013, 683, 488–491. [Google Scholar] [CrossRef]
- Wang, C.; Yu, F.; Zhao, D.; Zhao, X.; Zuo, L. Hot deformation and processing maps of DC cast Al-15%Si alloy. Mater. Sci. Eng. A 2013, 577, 73–80. [Google Scholar] [CrossRef]
- Yu, D.; Xu, D.; Wang, H.; Zhao, Z.; Wei, G.; Yang, R. Refining constitutive relation by integration of finite element simulations and Gleeble experiments. J. Mater. Sci. Technol. 2019, 35, 1039–1043. [Google Scholar] [CrossRef]
- Devadas, C.; Baragar, D.; Ruddle, G.; Samarasekera, I.V.; Hawbolt, E.B. The thermal and metallurgical state of steel strip during hot rolling: Part II. Factors influencing rolling loads. Met. Mater. Trans. A 1991, 22, 321–333. [Google Scholar] [CrossRef]
- Zener, C.; Hollomon, J.H. Effect of Strain Rate Upon Plastic Flow of Steel. J. Appl. Phys. 1944, 15, 22–32. [Google Scholar] [CrossRef]
- Sellars, C.M.; Whiteman, J.A. Recrystallization and grain growth in hot rolling. Met. Sci. 1979, 13, 187–194. [Google Scholar] [CrossRef]
- Liang, R.; Khan, A.S. A critical review of experimental results and constitutive models for BCC and FCC metals over a wide range of strain rates and temperatures. Int. J. Plast. 1999, 15, 963–980. [Google Scholar] [CrossRef]
Figure 1.
Initial microstructure of 20CrMoA.

Figure 2.
Thermal simulation process curve.

Figure 3.
True flow stress-strain curves at different deformation conditions: (a) 0.01 s−1, (b) 0.1 s−1, (c) 1 s−1, (d) 10 s−1.
Figure 3.
True flow stress-strain curves at different deformation conditions: (a) 0.01 s−1, (b) 0.1 s−1, (c) 1 s−1, (d) 10 s−1.

Figure 4.
Curves of temperature variation during deformation: (a) 873 K, (b) 10 s−1.

Figure 5.
Modified stress-strain curves: (a) 1 s−1 (b) 10 s−1.

Figure 6.
Relationship between steady stress and temperature.

Figure 7.
Relationship between stress and strain rate: (a) and (b) and .

Figure 8.
Relationship between and : (a) low temperature region, (b) high temperature region.

Figure 9.
Relationship between and 1000/T at different strain rates.

Figure 10.
Relationships between material constants α, n, Q, lnA and : (a) α, (b) n, (c) Q, (d) lnA.
Figure 10.
Relationships between material constants α, n, Q, lnA and : (a) α, (b) n, (c) Q, (d) lnA.

Figure 11.
Comparison between experimental and predicted flow stresses.

Figure 12.
Error analysis and statistics of predicted stresses: (a) correlation between experimental and predicted flow stresses, (b) statistical analysis of relative error.
Figure 12.
Error analysis and statistics of predicted stresses: (a) correlation between experimental and predicted flow stresses, (b) statistical analysis of relative error.


Table 1.
Material constants in Arrhenius equations (peak stress).
| Low Temperature Region (873–973 K) | High Temperature Region (973–1123 K) | ||
|---|---|---|---|
| αL | 0.00246 | αH | 0.00519 |
| nL | 14.674 | nH | 6.948 |
| QL(J/mol⋅K) | 652.608 | QH (J/mol⋅K) | 150.821 |
| lnAL | 81.474 | lnAH | 14.45 |
Table 2.
Coefficients of the polynomial functions of β, α, n, Q, and lnA (873–973 K).
| α | n | Q | lnA | ||||
|---|---|---|---|---|---|---|---|
| BL0 | 0.00326 | CL0 | 18.28 | DL0 | 492.4 | EL0 | 60.55 |
| BL1 | −0.00104 | CL1 | −49.74 | DL1 | 1886.2 | EL1 | 256.68 |
| BL2 | 0.0504 | CL2 | 290.1 | DL2 | 7351.27 | EL2 | −1044.27 |
| BL3 | −0.1148 | CL3 | −810.97 | DL3 | −11,406.17 | EL3 | 1736.56 |
| BL4 | 0.1256 | CL4 | 1017.3 | DL4 | −6851.16 | EL4 | −1204.69 |
| BL5 | −0.0525 | CL5 | −413.81 | DL5 | 957.75 | EL5 | 256.26 |
Table 3.
Coefficients of the polynomial functions of β, α, n, Q, and lnA (1023–1123 K).
| α | n | Q | lnA | ||||
|---|---|---|---|---|---|---|---|
| BH0 | 0.0084 | CH0 | 9.78 | DH0 | 534.72 | EH0 | 57.25 |
| BH1 | −0.0344 | CH1 | −31.57 | DH1 | −3327.82 | EH1 | −369.44 |
| BH2 | 0.144 | CH2 | 160.28 | DH2 | 11,926.74 | EH2 | 1322.67 |
| BH3 | −0.2915 | CH3 | −420.7 | DH3 | −22,568.5 | EH3 | −2516.77 |
| BH4 | 0.2866 | CH4 | 507.12 | DH4 | 21,250.61 | EH4 | 2393.33 |
| BH5 | −0.1097 | CH5 | −222.61 | DH5 | −7749.15 | EH5 | −882.89 |
Publisher’s Note: MDPI stays neutral with regard to jurisdictional claims in published maps and institutional affiliations. |
© 2020 by the authors. Licensee MDPI, Basel, Switzerland. This article is an open access article distributed under the terms and conditions of the Creative Commons Attribution (CC BY) license (http://creativecommons.org/licenses/by/4.0/).
Share and Cite
MDPI and ACS Style
Xu, S.; Shu, X.; Li, S.; Chen, J. Flow Stress Curve Modification and Constitutive Model of 20CrMoA Steel during Warm Deformation. Metals 2020, 10, 1602. https://doi.org/10.3390/met10121602
AMA Style
Xu S, Shu X, Li S, Chen J. Flow Stress Curve Modification and Constitutive Model of 20CrMoA Steel during Warm Deformation. Metals. 2020; 10(12):1602. https://doi.org/10.3390/met10121602
Chicago/Turabian StyleXu, Sheng, Xuedao Shu, Shuxin Li, and Ji Chen. 2020. "Flow Stress Curve Modification and Constitutive Model of 20CrMoA Steel during Warm Deformation" Metals 10, no. 12: 1602. https://doi.org/10.3390/met10121602
Note that from the first issue of 2016, this journal uses article numbers instead of page numbers. See further details here.